Bitcoin Power Analysis Hashrate Implications and Miner Economics - BitOoda
←
→
Page content transcription
If your browser does not render page correctly, please read the page content below
July 15, 2020
Research
Sam Doctorac
Bitcoin Power Analysis sam@bitooda.io
@CryptoSamDoctor
Hashrate Implications Rishabb Suresh
rsuresh@bitooda.io
and Miner Economics As of: 7/14/2020
BTC Price: $9220
Target Hashrate: 123.85 EH/s
Current Hashrate: 121.5 EH/s
We attempt to measure, locate and price viability, while S19s are viable to 9c/kWh. Risks to our thesis
power capacity, and estimate miner Key Takeaways
profitability in the context of potential China’s hydro season shifts the cost curve • Price action could reduce funding needs
future Hashrate and capital constraints. down (slide 23), which supports capital or delay achieving our Hashrate
accumulation, BTC price appreciation (slide projections. Slide 34 shows revenue • About 50% of 9.6 GW global
We assess that the BTC mining industry 25), and subsequent hash growth with a 4-6 sensitivity vs. device cash operating cost mining power capacity is likely
utilizes ~65% of 9.6GW (slide 11, growing at month lag (slide 26). at different network Hashrate in China; the US is at ~14%;
~10% p.a.) of available power capacity, assumptions. capacity utilization is ~ 67%
powering 2.8mm dedicated bitcoin mining Upgrade cycle could take Hashrate to 360 • Increased access to cheap power could
rigs. Most current devices are S17 class (slide EH/s in two years and 260 EH/s in 1 year drive Hashrate higher, although limited • Median BTC mining power
48), but future growth will largely come (slide 28), led by available power capacity by diminishing BTC revenue per MWh cost is 3c / kWh and cost to
from next-gen S19 class mining rigs (slide and the replacement of S9s and S17s by S19 (slide 37). mine 1 BTC is ~$5000
28). class rigs (slide 30). We have not assessed • Semiconductor capacity / ASIC
potential impacts of future rig upgrades. shipments could drive variance to our • Hashrate could reach 260 &
We identified 4.1GW of this power capacity model – although we note that the 360 EH/s in 12 & 24 months
across 153 mining sites, including power Increases in Hashrate and difficulty would industry has previously delivered with upgrade cycle but needs
prices at 67 sites representing ~3GW,by reduce BTC flow per PH/s (slide 35) and per significantly more units than our model
speaking with miners, rig manufacturers, MWh (slide 37). Miner economics could assumes (slide 44).
$6.3B Capex; funding gap is
resellers and public sources (slide 14). weaken, needing a BTC price of $21000 to $4.1B vs. industry cash
offset the lower BTC flow per PH at 260EH/s, In Summary: Current BTC network power generation
Our conversations lead us to believe that we and $29000 to offset 360 EH/s (slide 34). A capacity is ~9.6GW (~50% in China, 14% in
have accounted for ~80% of US / Canadian $1000 price increase is needed to offset the US), driving 121EH/s of computing • Price needs to appreciate by
capacity, but just ~15% of Chinese capacity. each 10EH/s increase in Hashrate (Slide 38). Hashrate. We assess that Hashrate could $1000 for every 10EH/s
If accurate, this would imply a 50% market reach 360EH/s in two years, led by an increase to stay revenue
share for China-based miners, followed by $4.5B Capex is needed over 12 months, upgrade cycle, falling median power prices neutral per MWh
the US at 14% (slide 15). $6.3B to fully fund the upgrade cycle (slide from the current 3c / kWh level, and ~$4.1B
40). Even with an assumed 35% per annum external funding into the mining industry. • Cheap power, BTC price and
We assess the median power price at price appreciation to $15,500 by YE 2021, a Cheap power, BTC price and semiconductor semiconductor shipments are
3c/kWh (slide 17) and median cash cost to $4.1B funding gap remains vs. cash shipments are key risk factors. key risk factors to our
mine BTC at ~$5000 (slide 20). Slide 21 generation (slide 43). estimates
shows S9 class rigs need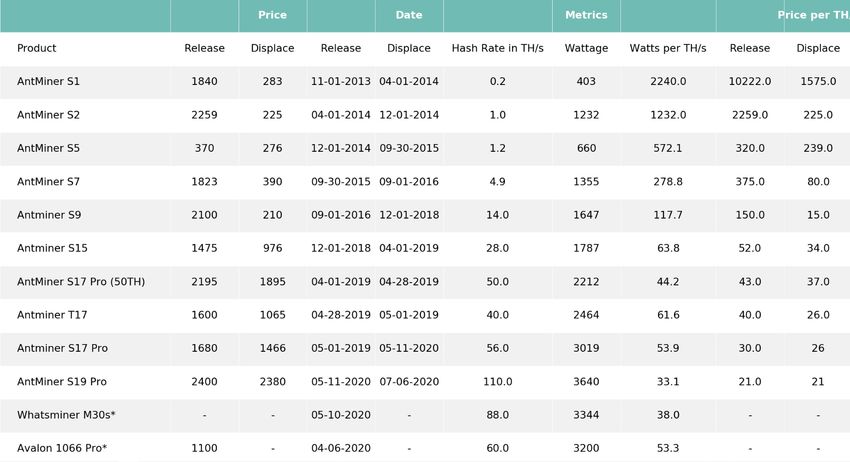
BitOoda Research

                       Foreword
                       The Importance of Bitcoin Mining Research
                       Bitcoin is a digital commodity that spurred         This report by BitOoda serves to improve                   importance of mining. This year we decided
                       the emergence of a new asset class. One of          the transparency related to the composition                to sponsor this research project conducted
                       the defining characteristics of this new asset      of Bitcoin miners. BitOoda leveraged its                   by BitOoda centered around the power cost
                       class is that ownership of the asset’s units is     extensive network to survey 67 mining sites.               analysis for the Bitcoin mining network.
                       recorded on a distributed ledger.                   This data, combined with secondary
                                                                           research of publicly available data, allowed               We look forward to continuing our research
                       Bitcoin miners update the Bitcoin ledger            them to locate a total of 153 mining sites                 of the Bitcoin mining space and helping to
                       (i.e., add new blocks of transactions to the        with operations in 20 countries, comprising                push the ecosystem forward. We thank the
                       ledger) by operating costly, specialized            more than 40% of the global network                        BitOoda team for their work, which we
                       hardware and consuming large amounts of             Hashrate. Although further assumptions had                 hope will elevate everyone’s understanding
                       energy. By doing so, miners perform                 to be made, this valuable dataset allowed                  about this complex and fascinating part of
                       transaction settlement and secure the               them to draw some interesting insights such                the Bitcoin ecosystem.
                       ledger. As such, Bitcoin mining is a                as Bitcoin’s global production cost curve,
                       foundational component of the network               the network’s total power consumption,
                       and Bitcoin as an asset. Despite its                and is useful in making predictions about                  Juri Bulovic
                       importance, mining has been among the               the network Hashrate growth.                               Fidelity Center for Applied Technology
                       least transparent and the least understood
                       part of the broader Bitcoin ecosystem.              While no research report about the state of
                                                                           Bitcoin mining can draw definitive
                       Miners are not required to register and get         conclusions, research studies with
                       a license to be part of the Bitcoin network –       transparent and sound methodologies like
                       the system is permisionless and that is what        this shed more light on the industry. When
                       makes it robust, more decentralized, and            the results from multiple such independent
                       ultimately secure. Due to its open and              studies are combined, one can make
                       pseudonymous attributes, it is not possible         conclusions about the mining ecosystem
                       to directly observe the actual composition          with more confidence.
                       of the mining network – by location, size
                       and type of operation, equipment used, or           Fidelity Center for Applied Technology
                       the economics and profitability. All of this is     (FCAT) started mining bitcoin in 2014 with
                       important macro data that would help us             research as our main objective. In 2018, we
                       understand the state and health of the              organized the Mining Summit, a two-day,
                       system and identify trends and make                 free and public event, with the goal of
                       predictions on how it may be evolving .             sharing our learnings and educating the
                                                                           broader community about the state and

2                                                                        For exclusive use of BitOoda clients. Do not redistribute.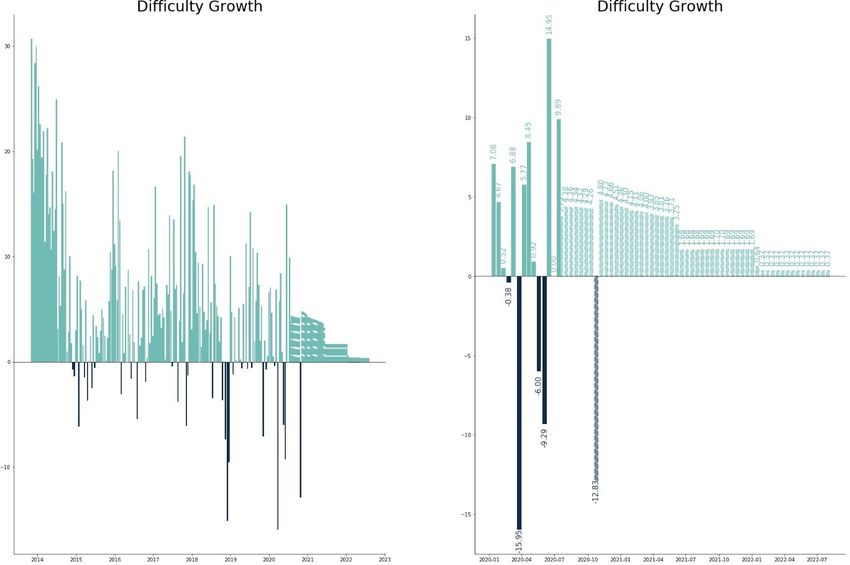
BitOoda Research

                       About Us:

                       BitOoda:                                               our role as an Agency-only broker,                   Sam Doctor:
                                                                              including building foundational
                       Founded in New York in 2017, BitOoda set               relationships with firms across the                  Sam Doctor, the principal author of this
                       out to become the leading digital asset                digital asset ecosystem, including funds,            report, is Chief Strategist at BitOoda.
                       fintech firm. The company was created to               projects, data centers, capital markets
                                                                              participants, and service providers.                 Sam Doctor’s flagship research includes
                       deliver transparency and accelerate the
                                                                                                                                   both project evaluations and Bitcoin mining
                       global adoption of transformational
                                                                        •     Led the digital asset community’s                    analyses focused on Bitcoin mining
                       technologies by promoting efficient
                                                                              regulatory development through our                   profitability and risk factors. His aim, as the
                       marketplaces through innovative and
                                                                              SEC-regulated Broker Dealer, our CFTC-               Chief Strategist at BitOoda, is to apply a
                       professional capital markets solutions.                regulated Introducing Broker, and our                variety of capital markets tools to enable
                       Founders Tim Kelly and Rob Madden                      principal leadership role as a founding              investors and projects to reduce risk,
                       leveraged their expertise to create a                  member of the Association for Digital                enhance returns and overcome barriers to
                       financial technology and services firm that            Asset Markets (ADAM), a trade group
                                                                                                                                   adoption.
                       aims to evolve digital asset markets through           focused on defining industry standards
                       an innovative data-driven platform that                for the advancement of fair and orderly              Mr. Doctor is a veteran finance professional
                       offers next-generation financial products,             markets.                                             with over 18 years research experience,
                       high-touch brokerage services, and applied                                                                  covering technology stocks, macro and
                                                                        •     Applied advanced technologies and
                       research solutions that put our clients’               data analytics to design a suite of                  quantitative strategy and cryptocurrency
                       interests first.                                       proprietary data products and indices                research, formerly at JPMorgan in New York
                                                                              that give our clients unique advantages              and Asia, and more recently as the Head of
                       Today, BitOoda has become a pioneer in the             to optimize their positions and manage               Data Science and Quant Research at
                       digital finance space. We have:                        risk.                                                Fundstrat Global Advisors.
                       •   Established a brand as an authority for      For more information on BitOoda, please                    Mr. Doctor holds a Finance & Strategy MBA
                           institutional solutions in the digital       visit our website or contact us at                         from the prestigious Indian Institute of
                           economy through product engineering          info@bitooda.com                                           Management, Ahmedabad and is an
                           – including our proprietary BitOoda
                                                                                                                                   Electronics and Semiconductor engineer
                           Hash™ Bitcoin Hashpower Contract,
                           BitOoda Difficulty™ Swap and BitOoda                                                                    from the University of Mumbai, India. He
                           Transaction Fee™ products.                                                                              holds his Series 7, 63, 86 and 87 licenses
                                                                                                                                   with FINRA .
                       •   Developed an industry-leading
                           distribution & execution capability in                                                                  More information is on his LinkedIn page.

3                                                                     For exclusive use of BitOoda clients. Do not redistribute.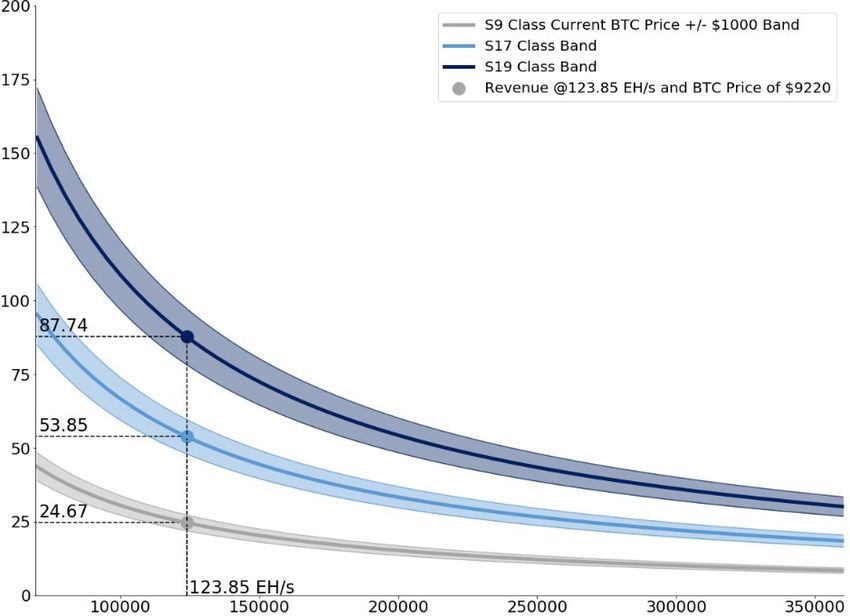
BitOoda Research

                       Analyzing the Bitcoin Network

                       Research Methodology
                       The BitOoda Hash Dashboard
                       Network Power Capacity
                       Miners’ Geographic Distribution
                       Mining Cost Curves
                       Effects of China’s Hydro Season
                       Future Outlook for Hash
                       Price, Power and Production Capacity Constraints
                       Appendix and Sources

4                                      For exclusive use of BitOoda clients. Do not redistribute.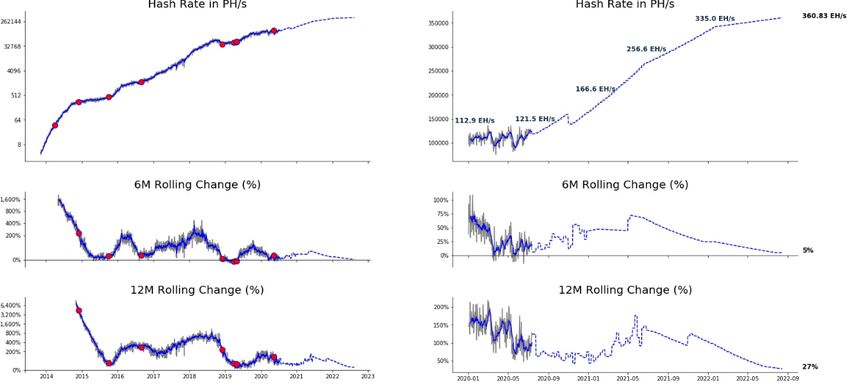
BitOoda Research

                        Research
                       Methodology

5                         For exclusive use of BitOoda clients. Do not redistribute.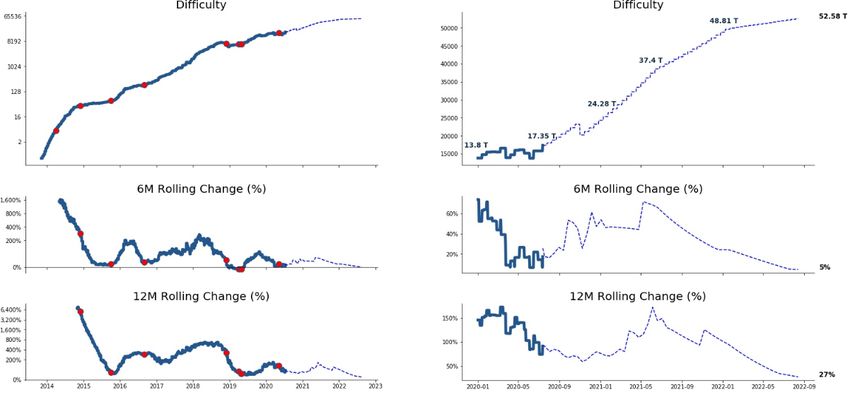
BitOoda Research

                       The Bitcoin Network:
                       Demystifying Mining
                       Bitcoin mining is a secretive industry, with very        and reseller we could identify (more than 60               Finally, we examined the potential network
                       little publicly available information. We find that      conversations), requesting data on facility size,          Hashrate if all the available electricity in the
                       even many sophisticated crypto investors have            location, and power price, while promising                 network powered latest-generation rigs, and its
                       gaps in their understanding of mining and                anonymity, which is critical to this highly                security implications. We then estimate the
                       potential investment opportunities in the space.         secretive community. Power price is the single             capital investment required to achieve that
                       Despite stellar research by Coinmetrics,                 largest industry cost, and a primary source of             potential Hashrate, as well as the funding gap –
                       Coinshares, and the Cambridge Center for                 competitive advantage.                                     external funding required to bridge the
                       Alternative Finance, unanswered questions                                                                           difference between the capex need and the
                       remain. This research has been commissioned by           In addition, we surveyed 45+ public sources such           internal cash generation within the network. We
                       Fidelity Center for Applied Technology (FCAT)            as company websites, press releases and media              take note of the key constraints to Hashrate
                       and independently conducted by BitOoda. We               interviews with miners to piece together what              growth: available cheap electricity, capital
                       aim to add to the existing body of research,             information we could obtain.                               availability, equipment availability, lead times
                       building upon prior research and attempting to                                                                      and production constraints, and the impact of
                       address new questions.                                                                                              BTC price on the value of diminishing BTC
                                                                                We gathered size and country data on 131
                                                                                                                                           rewards per production unit as the network
                       Research Objectives                                      miners (153 sites across 20 countries), totaling
                                                                                                                                           grows.
                                                                                4GW of available power. Of these, we obtained
                       In this research project, we set out to answer           power prices on 66 sites, either as a point
                       some of the age-old questions around Bitcoin             estimate – such as 1.8c / kWh or a range (e.g.             We conclude with our 18-24 month outlook for
                       mining, starting with how much power does the            between 2-3c/kWh), totaling about 2.9GW of                 the Bitcoin Mining Network.
                       network draw; how much power can it currently            available power capacity. We also did research
                       draw and how this capacity is growing.                   into the impact of China’s hydro season on the             Takeaways
                                                                                mining community – with surprising results.
                       We also aim to identify the distribution of mining                                                                  •   Current BTC network power capacity is
                       capacity globally, both by geography and by the          We used this data to build a cost curve of power               ~9.6GW (~50% in China, 14% in the US),
                       cost of power, with an aim to develop a power            price for the known capacity, and a curve                      driving 121EH/s of computing Hashrate.
                       cost and Bitcoin mining cost curve, based on             representing the cash cost to mine 1 Bitcoin,
                       bottom up survey research.                               making standardized assumptions such as a                  •   We assess that Hashrate could reach
                                                                                power usage effectiveness factor of 1.12. (For                 360EH/s in two years, led by an upgrade
                       Further, we aim to identify the available                every unit of power used to mine Bitcoin, 12%                  cycle, falling median power prices from the
                       computing or Hashpower in the mining network,            excess is consumed for everything else – cooling,              current 3c / kWh level, and ~$4.1B external
                       and estimate how much it could grow in the               lighting, routers / switches and other facility                funding into the mining industry.
                       coming 24 months or so. Additionally, we model           power overhead.) We then plot out the
                       the capital investment entailed in achieving this        percentage of Bitcoin mined at different cost              •   Cheap power, BTC price and semiconductor
                       Hashrate, and the constraints involved –                 levels, based on the distribution of power prices.             shipments are key risk factors.
                       semiconductor capacity, internal cash generation
                       by the mining industry, diminishing returns with         Additionally, we modeled what we believe is a              •   We do NOT make any price forecasts, and
                       rising Hashrate (a function of the price of Bitcoin)     lower bound for the aggregate power capacity in                merely use different price scenarios to
                       and available external funding.                          the Bitcoin network of 9.6GW, and estimated                    model potential impacts on network
                                                                                that it could grow at a minimum of 10% a year.,                Hashrate and miner profitability and
                       Methodology                                              using simplifying assumptions detailed in the                  capital investment.
                                                                                report.
                       We spoke with every miner and rig manufacturer
6                                                                             For exclusive use of BitOoda clients. Do not redistribute.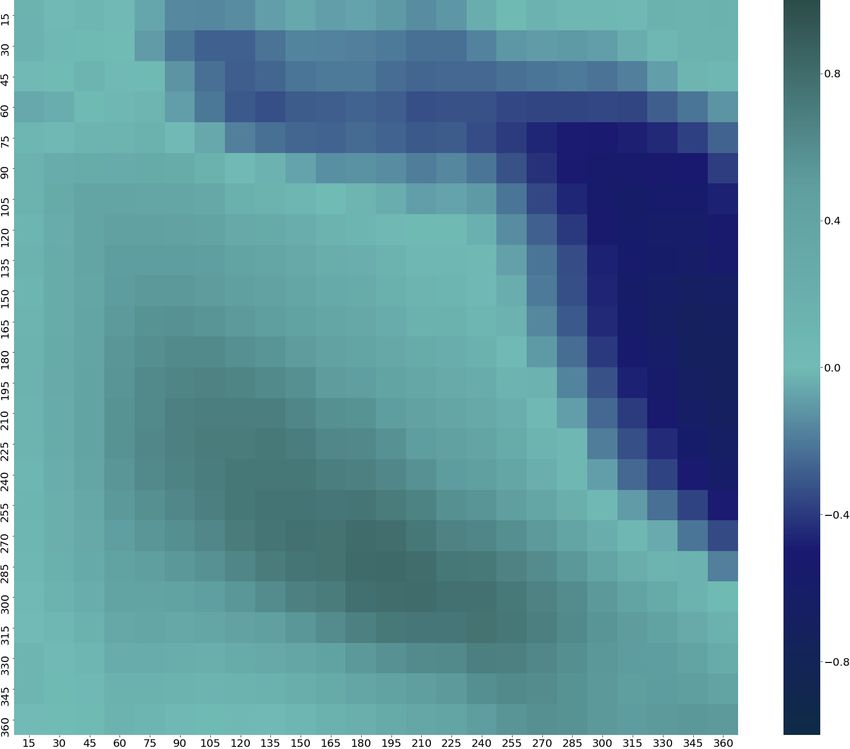
BitOoda Research

                                       Bitooda Hash™
                                         Dashboard
                       •   A regular publication that shows the state of the Bitcoin mining network: Price, Hashrate, Number of Blocks mined, Difficulty, and other
                           metrics.

                       •   We show the expected revenue per PH/s Day and per MWh as a measure of miner profitability.

                       •   Our model shows estimated power cost curves and Bitcoin mining cost curves, as well as the cost to mine 1 BTC using different generations of
                           mining rigs, at different power prices.

                       •   We further plot our model estimates of network Hashrate, power consumption, installed base of mining rigs by generation, and revenue curves
                           per MWh for each generation of rig, at different network Hashrate.

                       •   Finally, we end with our estimates of the geographic distribution of mining capacity and our projections of the network Hashrate.

7                                                                              For exclusive use of BitOoda clients. Do not redistribute.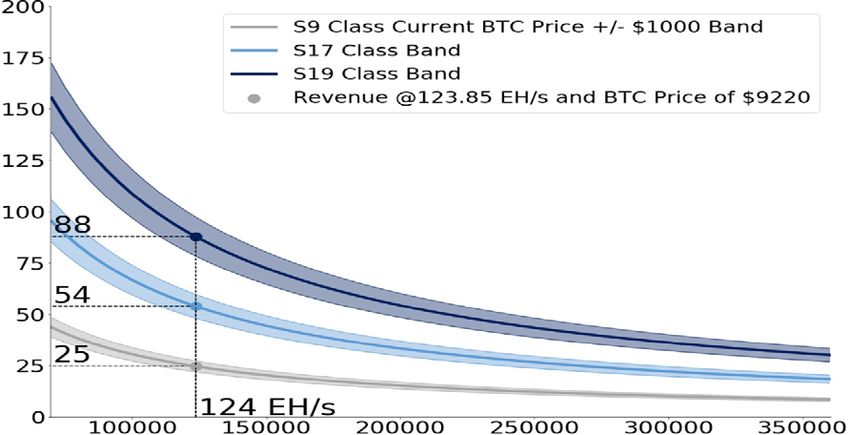
BitOoda Hash™ Daily BTC / PH/s
Dashboard 0.0075BTC ($70)
Sam Doctor
BTC / MWh
147 Blocks 16.5T
Research
AS OF: $ 9220 121.5 EH/s
08:00 AM ET ▼1% ▲1.9% ▲3 ▼5% S9 Class: 0.0027BTC ($25)
July 14, 2020 S17 Class: 0.0058BTC ($54)
BTC Price Hash Rate Blocks Mined Next Diff. est. S19 Class: 0.0095BTC ($88)
BTC Network Power Cost Curve Cash cost to mine 1 BTC BTC Production Cost Curve
9 c/kWh Known $70/ $80/ $90/ $100/ $16,000 Known Data
Lower Bound $10/ $20/ $30/ $40/ $50/ $60/
8 c/kWh Upper Bound
MWh MWh MWh MWh MWh MWh MWh MWh MWh MWh $14,000
Upper Bound Lower Bound
7 c/kWh
$12,000
6 c/kWh We believe 50%+ of S9 Class
Hashrate is currently at $10,000
5 c/kWh
under 3c / kWh power S17 Class $8,000
4 c/kWh
3 c/kWh $6,000
S19 Class
2 c/kWh $4,000
1 c/kWh BTC Price $2,000
0 c/kWh $0
0% 20% 40% 60% 80% 100% 0% 50% 100%
123850 PH/s 6423 MW 2,842,625 Revenue per MWh
22627 PH/s 669 MW 205,696 Mining Stats:
BitOoda Ests
1,531,106
4128 MW
85742 PH/s
S19 Class
1,105,823 S17 Class
1627 MW
15482 PH/s S9 Class
Hashrate Power Consumption Rig Installed Base
Known Capacity Est. capacity share Distribution of Total Hashrate Projections: 260 EH/s in 12, 360 EH/s in 24 months
(BitOoda Est) known Capacity 400000 PH/s
S9 Class
350000 PH/s S17 Class
Canada USA 85.0%
Russia Canada 300000 PH/s S19 Class
613 465 MW China 15.0% 7%
China Russia
MW 250000 PH/s
China Canada 85.0% 50% 8%
731 Kazakhstan 200000 PH/s
455 MW Russia 60.0%
MW Kazakhstan 150000 PH/s
Iran Kazakhstan 60.0% 8%
100000 PH/s
USA 450 MW
Iran 60.0% Iran
1116 50000 PH/s
Iceland 90.0% 8%
MW USA 0 PH/s
Iceland Rest of World 33.2% 14% Iceland
Rest of World 2%
91 MW 165 MW
Rest of World, 3%
Metrics assume Bitmain S19 as a representative net-gen device, unless specified For exclusive use of BitOoda clients. Do not redistribute. Source: BitOoda, Coinmetrics, Kaiko, EIA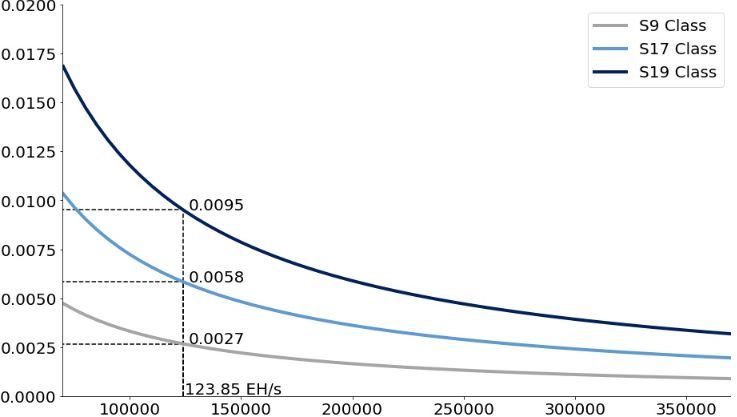
BitOoda Research

                         Network
                       Power Capacity

9                          For exclusive use of BitOoda clients. Do not redistribute.
BitOoda Research
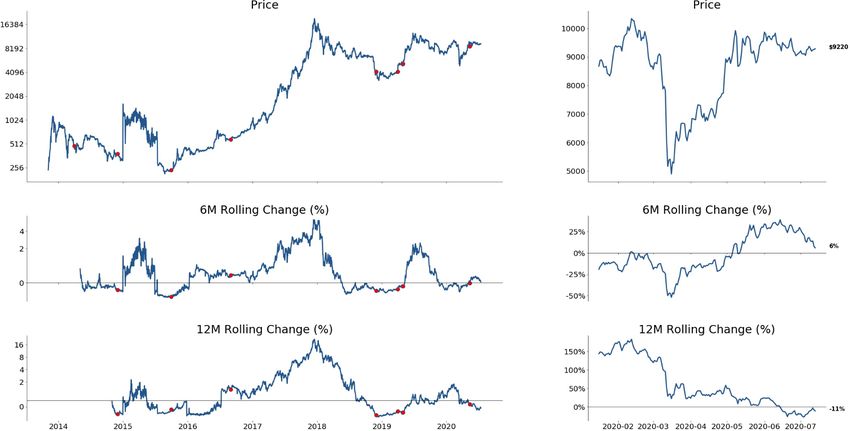
Understanding Miner •
•
Bitcoin price was range bound through the block reward halving in May 2020
Hashrate peaked just prior to the event, and has yet to fully recover from the
Economics amid •
crash immediately afterward. Mining economics have weakened considerably
This report attempts to measure, locate and price power capacity and
Stagnant BTC Price forecast changing miner profitability in the context of potential future
Hashrate and capital constraints
Recent 6 Months
S19
S17 Pro
Pro
Logscale
S15 T17
S2 S9
S5
S7
Logscale
Logscale
Figure: Bitcoin price and rolling changes Source: BitOoda, Blockchain.com, Kaiko, Coinmetrics
Note: Since 2014; data as of 7/14/2020
10 For exclusive use of BitOoda clients. Do not redistribute.BitOoda Research
At least 9.6GW available • The Hashrate peak in early May needed 9.6GW of power consumed by the
Bitcoin mining network, assuming capacity shut-ins that took Hashrate down
to BTC mining network •
to 82EH/s by mid May were all older generation rigs
The Hashrate bottom corresponds to just 3.9GW of power draw
136098 1 Hashrate fell in
PH/s
S17 the week of the
81659
Class BTC halving PH/s
81659
S17
PH/s
S9 Class
2 We assume all Class
54439 54EH/s lost was 81659
3 PH/s older gen S9s PH/s
It would take Hashrate May 10 Hashrate May 17
3.9GW to power
82 EH/s using
only S17 class 9651 MW
equipment
5
S17 Implied power
Class usage fell from
3931 MW 9.6 to 3.9GW
4 3931 MW
5.7GW = 54 EH/s S9 Class
5720 MW S17
of S9 class rigs Class
3931 MW
Power Consumption May 10 Power Consumption May 17
Figure: Bitcoin Hashrate and power consumption at recent peak / trough Source: BitOoda, Blockchain.com, Kaiko, Coinmetrics
Note: We assume a PUE of 1.12 to estimate share of power actively used to mine Bitcoin
11 For exclusive use of BitOoda clients. Do not redistribute.BitOoda Research
Hashrate of 124EH/s •
•
Capacity utilization is 67% of available power
New devices drive efficiency gains
implies 6.4GW and 2.8mm • The upgrade cycle to S19 class rigs should drive hash growth, which we
examine in detail in the Future Outlook section
devices in operation
Next-gen rigs = 18% of
Hashrate => 10% of power
consumption => 7% of operating
devices
123850 PH/s 6423 MW 2,842,625
669 MW 205,696 Mining Stats:
22627 PH/s
BitOoda Ests
1,531,106
4128 MW
85742 PH/s
S19 Class
S17 Class
1,105,823
1627 MW S9 Class
15482 PH/s
Hashrate Power Consumption Rig Installed Base
Figure: Bitcoin Hashrate, power consumption and installed base of rigs Source: BitOoda, Blockchain.com, Kaiko, Coinmetrics
Note: We assume a PUE of 1.12 to estimate share of power actively used to mine Bitcoin
As of 7/14/2020
12 For exclusive use of BitOoda clients. Do not redistribute.BitOoda Research
Miners’
Geographic
Distribution
13 For exclusive use of BitOoda clients. Do not redistribute.BitOoda Research
Bottom up research identifies • We identified about 4.1GW of power through bottom-up research, including
direct conversations with miners, rig manufacturers / dealers, and public
geographic distribution of •
sources such as filings, press releases and miner interviews
Our data spans 153 mining sites, skewed towards the US and Canada
4.1GW of Mining Capacity • Of these 153, we have power prices for 67, totaling ~3GW of capacity
Canada
613 MW
Russia
465 MW
China
731 MW
Kazakhstan
Known 455 MW
Operational
Capacity
Estimated /
4086 MW
Unidentified
42%
5563 MW
58%
Iran
450 MW
USA
1116 MW
Iceland
165 MW
Rest of World
91 MW
Figure: Geographic distribution of surveyed mining capacity Source: BitOoda estimates, Miners, ASIC makers/ resellers, public sources
Note: Some of the underlying data was shared under condition of anonymity
As of 7/14/2020
14 For exclusive use of BitOoda clients. Do not redistribute.BitOoda Research
Geographic Distribution: • Based on conversations with individual miners and resellers, we assess that
about 80-90% of US, Canada and Iceland-based mining capacity has been
Estimated Network •
identified, but perhaps just 15% of Chinese capacity
Applying these rough estimates, we believe China represents 4.9GW or 50%
Power Capacity of all available power for Bitcoin Mining, followed by the USA (14%)
Known Capacity Estimated share of Implied Total Capacity
Distribution capacity identified by Distribution
BitOoda
Canada
721 MW
7%
Canada China
Russia USA 85.0%
613 MW 4873 MW Russia
465 MW China 15.0% 50% 775 MW
China Canada 85.0% 8%
731 MW Kazakhstan
455 MW Russia 60.0%
Kazakhstan 60.0% Kazakhstan
Iran
Iran 60.0% 758 MW
450 MW
8%
USA Iceland 90.0%
1116 MW
Rest of World 33.2%
Iran
Iceland 750 MW
Rest of 8%
165 MW
World Applying “estimated
91 MW known share” of total USA
capacity to imply total 1313 MW
country capacity 14% Iceland
Rest of World 183 MW
274 MW 2%
3%
Figure: Geographic distribution of surveyed and estimated global mining capacity Source: BitOoda estimates, Miners, ASIC makers, Public sources
Note: Some of the underlying data was shared under condition of anonymity
As of 7/14/2020
15 For exclusive use of BitOoda clients. Do not redistribute.BitOoda Research
Bitcoin Network
Cost Curve
16 For exclusive use of BitOoda clients. Do not redistribute.BitOoda Research
Power cost curve • We identified size and power costs for facilities representing roughly 31% of
the estimated maximum power consumption of the Bitcoin network
BTC Mining Network • Extrapolating to the rest of the network, we think 50%+ of capacity is at under
3c/kWh power cost
• The confidence interval / outer bounds for sub-3c power is about 35% - 55%
Power Cost
Known Lower Bound Upper Bound
9 c/kWh
8 c/kWh
7 c/kWh
6 c/kWh
5 c/kWh
4 c/kWh
3 c/kWh
2 c/kWh
1 c/kWh
0 c/kWh
0% 10% 20% 30% 40% 50% 60% 70% 80% 90% 100%
Figure: Power cost curve: Mapping power cost vs. share of network capacity Source: BitOoda estimates, Miners, ASIC makers, Public sources
As of 7/14/2020
17 For exclusive use of BitOoda clients. Do not redistribute.BitOoda Research
Estimated 80% utilization • We believe low-cost miners are running near full capacity, while higher cost
miners are operating at about 2/3 capacity, within the known 31% of
Within known power •
identified capacity
Utilization in sample may be higher than the broader industry, because our
cost sources •
sample may have a more efficient rig mix vs. the general miner population
Weighted average cost to mine 1 BTC ~$6500
Share of Known Total Capacity (if mix = Range of Total Share of Total Wt. Avg Cash Cost
Power Cost Known Capacity
Capacity known capacity mix) Capacity Capacity /BTC
Below 1c/kWh 450 MW 15.1% 1454 MW 450 - 1705MW 5.1% $3,323
1c/kWh -2c/kWh 604 20.2 1951 1269 - 2092 6.9 $4,492
2c/kWh -3c/kWh 198 6.6 635 574 - 771 2.3 $5,250
3c/kWh -4c/kWh 733 24.5 2157 2299 - 2605 8.3 $6,961
4c/kWh -5c/kWh 600 20.1 1766 1797 - 2250 6.8 $8,256
5c/kWh -6c/kWh 280 9.4 858 804 - 960 3.2 $10,102
6c/kWh -7c/kWh 92 3.1 279 92 - 314 1.0 $11,437
Above 7c/kWh 30 1.0 -312 30 - 169 0.3 $13,823
Total 2987 MW 100.0 8788 MW 34.0 $6,561
Sampled power capacity: Available and Utilized
67.0% 79.8%
100.0% 67.0% 602 MW
242 MW
100.0% 198 MW
67.0%
604 MW 2385 MW
85.0% 491 MW 92 MW
450 MW 402 MW
30 MW 67.0%
168 MW 188 MW 67.0% 10 MW
30 MW
61 MW 20 MW
0c/kWh -1c/kWh 1c/kWh -2c/kWh 2c/kWh -3c/kWh 3c/kWh -4c/kWh 4c/kWh -5c/kWh 5c/kWh -6c/kWh 6c/kWh -7c/kWh Greater Than Total
7c/kWh
Figure: Capacity / utilization cost for sampled miners and estimated network power capacity Source: BitOoda estimates, Miners, ASIC makers, Public sources
As of 7/14/2020
18 For exclusive use of BitOoda clients. Do not redistribute.BitOoda Research
3-4c/kWh Modal Power • We extrapolated power capacity at different price points for the 9.6GW of
estimated total Bitcoin mining capacity based on the known prices for the
Cost : Capacity at •
3GW of capacity in our research sample
We estimate upper / lower / mid bounds of capacity based on whether the
different price points mix of unknown 69% of power capacity is at a lower or higher price vs. the
known capacity
Upper Bound
2771 MW
“Likely” Estimate
2369 MW
2313 MW Lower Bound
2250 MW
2299 MW
1951 MW 1939 MW Most capacity is
under 5c /kWh
1705 MW
1819 MW 1797 MW
1454 MW Migratory capacity
during Hydro season Modal
1061 MW
affects the width of power cost
this band
784 MW 884 MW
804 MW
644 MW
574 MW 347 MW
450 MW
169 MW
279 MW
130 MW
128 MW
30 MW
0c/kWh -1c/kWh 1c/kWh -2c/kWh 2c/kWh -3c/kWh 3c/kWh -4c/kWh 4c/kWh -5c/kWh 5c/kWh -6c/kWh 6c/kWh -7c/kWh Greater Than 7c/kWh
Figure: Power distribution: Lower, median and upper bounds of capacity at each power price point Source: BitOoda estimates, Miners, ASIC makers, Public sources
As of 7/14/2020
19 For exclusive use of BitOoda clients. Do not redistribute.BitOoda Research
Cash cost to mine 1 BTC • Based on our cost curve estimates, the median cash expense to mine 1 BTC is
~$5000
• We assess the upper confidence interval on median cost is ~$6000, assuming
the unknown power sources have a higher power cost mix than our known
data
Cost / BTC
Known Data Upper Bound Lower Bound
$16,000
$14,000
$12,000
We assess Median cost to
$10,000 mine 1BTC is likely ~$5000,
and almost certainlyBitOoda Research
Daily Revs vs Cost per PH/s: • The columns in the chart below show the daily operating cost to run each
device class, in 1c / kWh power cost increments
Need sub-2c / kWh to run S9s • The lines show the dollar value of Bitcoin mined per PH/s per day at current
prices, and if BTC were $11000 or $13000
• S9 class rigs need sub-2c / kWh power to be viable, but S17 class is viable up
to 6c / kWh; S19 class up to 8c / kWh
Revenue & Cost Structure @ 124 EH/s Network Hashrate
10c / kWh $302.29 Daily Power Cost per PH/s; 1c / kWh increments
Daily Labor Cost per PH/s
$274.04 Daily Revenue / PH/s at BTC Price = $9220
Daily Revenue / PH/s BTC Price = $11000
$245.79 Daily Revenue / PH/s BTC Price = $13000
Breakeven power prices
for each rig class, at a
$217.54 glance
$189.28
5c / kWh $161.03
$138.49 10c / kWh
Daily Revenue / PH/s BTC $132.78 $125.55
Price = $13000 $112.60
$98.25
$104.53 $99.66
Daily Revenue / PH/s BTC $83.13
$86.72 $84.98 10c / kWh
Price = $11000 $77.04
$73.77 5c / kWh $69.09 $69.68
$76.28
Daily Revenue / PH/s at BTC $60.83 $61.15
Price = $9220 $53.21
$47.89 $45.27 5c / kWh
1c / kWh $48.03 $37.33
$34.95 $29.38
$22.00 1c / kWh $21.44
$19.78 $13.50 1c / kWh
$9.06 $5.56
S9 Class S17 Class S19 Class
Figure: Daily revenue and cash operating costs using different rigs at different power Source: BitOoda, Blockchain.com, Kaiko, Coinmetrics
price, at current Hashrate.
Note: We assume a PUE of 1.12 to estimate share of power actively used to mine Bitcoin
21 For exclusive use of BitOoda clients. Do not redistribute.BitOoda Research
Power Costs:
Effects of China’s
Hydro Season
22 For exclusive use of BitOoda clients. Do not redistribute.BitOoda Research
Hydro Season = • China accounts for as much as 65% of global Hashrate per Cambridge Center
for Alternative Finance; our estimates are somewhat lower at about 50%
Lower Power Cost • Much of this computing power operates at 2.5-3c / kWh in Inner Mongolia
during the dry season
• During flood season, these miners migrate significant capacity to Sichuan and
Yunnan provinces to take advantage of as low as sub- 1c/kWh power
• An S9 rig generates $28 / MWh in revenue, which means that it
Power Cost could be profitable to mine Bitcoin using older generation,
depreciated rigs.
Known Lower Bound Upper Bound
• Furthermore, even with newer equipment, dropping the price of
9 c/kWh electricity from $25-30 to $10 / MWh increases profitability
meaningfully.
8 c/kWh
7 c/kWh • Assuming an additional $7 / MWh as labor / overhead – which
may be high in the Chinese context – the cash contribution for an
6 c/kWh S17 class rig would double from $21 to $41.
5 c/kWh
• For a sample 50MW facility running S17 class equipment, this is
4 c/kWh $4.4 million in incremental cash flow to fund rig upgrades and
capacity expansion, to a total of $8.8 million.
3 c/kWh
Cost curve shifts
• This would allow the S17 class miner to buy over 3500 next gen
2 c/kWh
down and to the right
S19 class rigs, or upgrade / expand 12MW of their capacity.
1 c/kWh during hydro season
• We think the upper end of the cost curve is unaffected: 4c+ /
0 c/kWh kWh power is less migratory.
0% 20% 40% 60% 80% 100%
Figure: Power cost curve shifts during China’s flood season
Source: BitOoda estimates, Miners, ASIC makers, Public sources
23 For exclusive use of BitOoda clients. Do not redistribute.BitOoda Research
Hydro Season enhances • Lower costs = lower consistent selling pressure
capital accumulation,
supporting BTC Price
Appreciation
• During Hydro season, Chinese miners are accumulating capital for reinvestment.
• In the prior example, BTC price / network Hashrate being equal, the hypothetical 50MW miner would have to sell $8M in BTC during the
dry season to meet operating expenses, but just $3.7M during the flood season.
• Across multiple GW of migratory power capacity in China, that is about $1+ billion of incremental BTC accumulated and transferred “off
exchange” between miners and rig manufacturers who accept payment in crypto currency.
• Miners pay for their rigs several months in advance to secure shipment of rigs from suppliers like Bitmain, Canaan or MicroBT. The
suppliers in turn make advance payments for wafer capacity at foundries such as TSMC, with a typical 12-13 week lead time.
• While this BTC does get eventually sold to the market to pay TSMC and other semiconductor foundries in fiat, we believe the
discretionary timing of this sale allows for more favorable trading strategies.
• Absent similar seasonality in fiat flows buying into crypto and BTC in particular, there is consistent fiat flow seeking to absorb less BTC
flow during hydro season. Also, there is a feedback loop where fiat flows increase following BTC price appreciation.
• In our view, this dynamic supports the pattern of higher price appreciation for Bitcoin during the Chinese flood season.
24 For exclusive use of BitOoda clients. Do not redistribute.BitOoda Research
Hydro Season ≠ •
•
Average Hashrate growth is consistent between Flood and Dry seasons
But over 6 years price appreciation appears higher during Flood seasons
Hashrate Growth
Price Dry Price Flood Hashrate (7DMA) Flood Hashrate (7DMA) Dry
$20,000 140000 PH/s
11.0%
24.6%
$18,000 Average
(Since 2014 Dry Season)
Dry Flood 120000 PH/s
$16,000 Price Change 33% 75%
Hashrate (7 Day Mavg) in PH/s
Hashrate Change 87% 85% 84.3% 100000 PH/s
$14,000
Bitcoin Price in USD
$12,000 37.2% (30.5%)
(6.5%) 80000 PH/s
$10,000
(15.5%) 4.3% 60000 PH/s
$8,000
$6,000 40000 PH/s
121.1% (26.7%) (27.1%) 35.0% 36.4% 53.6% 89.2% 347.4%
$4,0001305.9% 414.4% (0.5%) 47.4% 190.8% 48.6% 129.2% 163.5%
(17.0%) 72.2% 20000 PH/s
$2,000 194.7% 80.9%
$0 0 PH/s
11/1/2013 11/1/2014 11/1/2015 11/1/2016 11/1/2017 11/1/2018 11/1/2019 11/1/2020
Figure: Hashrate and BTC price segregated by flood and dry seasons Source: BitOoda, Blockchain.com, Coinmetrics
Note: Since 2014; averages exclude Nov 2013-Oct 2014
As of 7/14/2020
25 For exclusive use of BitOoda clients. Do not redistribute.BitOoda Research
Price changes lead • We examined the correlation between trailing price growth and
Hashrate growth over periods ranging from 15 days to 1 year
Hashrate change • Highest correlation region shows that price appreciation over several
months drives Hashrate growth, with a 4-6 month lag
Correlation Matrix
High
Correlation
Low
Figure: Correlation between price changes and Hashrate changes Source:BitOoda, Blockchain.com,Kaiko, Coinmetrics
Note: Past 12 months
As of 7/14/2020
26 For exclusive use of BitOoda clients. Do not redistribute.BitOoda Research
Bitcoin Network
Future Outlook
27 For exclusive use of BitOoda clients. Do not redistribute.BitOoda Research
260+ EH/s Hashrate •
•
At 10% growth in power capacity, the industry could draw 10.6 GW in 1 year
This is based on a combination of miners’ expansion plans, discounted since
Potential by June 2021 not every planned expansion will come to fruition, and potential shutdown of
higher-priced power capacity
• We believe new devices will be a mix of S17 and, mostly, S19 class
• Hashrate could exceed 260 EH/s in 1 year
We assume half
GW growth from
low is S17 class;
rest is S19 class
=> Hashrate could
exceed 260EH/s
10% power 10616 264222
growth from prior MW PH/s
9651 MW peak = 10.6 GW S19 Efficiency gains =
Class S19 Class
S17
disproportionate share
3343 MW 113133
Class of S19 Hashrate PH/s
3931 MW
S17
Class S17 Class
S9 Class 151089
5720 MW 7274 MW
PH/s
Power Consumption May 10 1Yr Fwd Power Consumption 1 Yr Fwd Hashrate
Figure: Bitcoin Hashrate and power consumption Source: BitOoda estimates, Blockchain.com, Kaiko, Coinmetrics
Note: We assume a PUE of 1.12 to estimate share of power actively used to mine Bitcoin
As of 7/14/2020
28 For exclusive use of BitOoda clients. Do not redistribute.BitOoda Research
~10.6GW power capacity • We believe a negligible quantity of S9 class rigs will remain in operation after
November 2020, barring a large surge in Bitcoin price
Fully utilized by mid 2021 • While some S17 class shipments will continue, a growing share of new rigs
will be S19 class
S9 Class S17 Class S19 Class Available Power
14000 MW
12000 MW
10000 MW
S17 class rigs will start
8000 MW getting replaced as the
power capacity
saturates
6000 MW S9 class rigs got
renewed life but will
phase out post hydro
4000 MW season
2000 MW
0 MW
Figure: Bitcoin power consumption by device class Source: BitOoda, Blockchain.com, Kaiko, Coinmetrics
As of 7/14/2020
29 For exclusive use of BitOoda clients. Do not redistribute.BitOoda Research
Hashrate 260 EH/s in 1 yr • The upgrade cycle should drive Hashrate to 260 EH/s in 1 year, and to
360EH/s in 2 years
Driven by upgrade cycle • Power capacity is the boundary condition: upside to this number could
expand Hashrate faster
• Near term, shipment delays from China, and especially delays from Bitmain,
could pose a downside to our base-case hash estimates
S9 Class S17 Class S19 Class
360 EH/s in 2
400000 PH/s years
350000 PH/s
260 EH/s in 1 year
300000 PH/s
250000 PH/s
160 EH/s by end of
200000 PH/s Hydro Season
150000 PH/s
100000 PH/s
50000 PH/s
0 PH/s
Figure: Bitcoin Hashrate by device class Source: BitOoda, Blockchain.com, Kaiko, Coinmetrics
Note: We assume a PUE of 1.12 to estimate share of power actively used to mine Bitcoin
As of 7/14/2020
30 For exclusive use of BitOoda clients. Do not redistribute.BitOoda Research
Hashrate growth rates Despite Hashrate rising to 360EH/s, we think growth will begin to
will likely moderate…
moderate in 2022
2020-2022E
S19
S17 Pro
HashRate in PH/s Pro
7-Day Moving Average
S15 T17
Logscale
S5 S9
S7
S2
Logscale
Logscale
Figure: Bitcoin Hashrate and rolling changes Source: BitOoda estimates, Blockchain.com, Kaiko, Coinmetrics
Note: Since 2014 ; data as of 7/14/2020
31 For exclusive use of BitOoda clients. Do not redistribute.BitOoda Research
Difficulty could more than Increasing Hashrate could drive difficulty monotonically higher
triple in 24 months
2020-2022E
S19
S17 Pro
Pro
S15 T17
S9
Logscale
S5
S2 S7
Logscale
Logscale
Figure: Bitcoin Difficulty and rolling changes Source: BitOoda estimates, Blockchain.com, Kaiko, Coinmetrics
Note: Since 2014; data as of 7/14/2020
32 For exclusive use of BitOoda clients. Do not redistribute.BitOoda Research
Difficulty growth Difficulty changes are a reflection of changing Hashrate, led by rig
moderates but continues… upgrades, available power capacity growth and, occasionally, by price
declines driving shut-ins of older rigs or higher power cost facilities
2020-2022E
Figure: Bitcoin difficulty reset history Source: BitOoda estimates, Blockchain.com, Kaiko, Coinmetrics
Note: Since Nov 2013, sequential epoch change, %; data as of 7/14/2020
33 For exclusive use of BitOoda clients. Do not redistribute.BitOoda Research
Hashrate = less BTC/PH/s: •
•
As Hashrate rises, 1 PH/s earns a falling share of daily revenue
Thus, at flat BTC prices, profitability erodes, and an increasing proportion of
Weakening economics •
mining capacity – both older rigs and entire facilities – become unviable
At 260EH/s, mining at $19,500 BTC price is about as profitable as atBitOoda Research
BTC Flow per PH/s falls • As shown on previous slide, higher network Hashrate drives weaker
economics
as Hashrate increases • Any offsetting price increase assumptions loom large in the viability of
new capex projects
Pre Halving Post Halving BitOoda Forecast
0.25 BTC
BTC earned per day per PH/s, log scale
0.13 BTC
BTC earned per PH/s per day a
0.06 BTC function of network Hashrate
0.03 BTC
0.02 BTC
0.01 BTC
0.00 BTC
0.00 BTC
0 PH/s 50000 PH/s 100000 PH/s 150000 PH/s 200000 PH/s 250000 PH/s 300000 PH/s 350000 PH/s 400000 PH/s
0.25 BTC
BTC earned per day per PH/s, log scale
0.13 BTC
0.06 BTC
0.03 BTC
0.02 BTC
BTC earned per PH/s per day
0.01 BTC declines over time
0.00 BTC
0.00 BTC
Figure: Daily Bitcoin earned per PH/s over time and as a function of network Hashrate Source: BitOoda estimates, Blockchain.com, Kaiko, Coinmetrics
As of 7/14/2020; historical data since 1/1/2018
35 For exclusive use of BitOoda clients. Do not redistribute.BitOoda Research
Profitability per PH/s • We examine the breakeven profitability on a per PH/s basis at current price
levels
falls as Hashrate • The S9 class can mine profitably at current price of $9220 with 1c/kWh cash
costs at network Hashrate up to 180 EH/s
increases • The next gen S19 class of rigs are profitable at Hashrates up to 295EH/s and
power prices of 3c/kWh
Daily revenue per PH/s @ BTC price = $9220 S9 Class @1 c/kWh S17 Class @2 c/kWh S19 Class @3 c/kWh
$120
$100
Hashrate can grow if:
Daily Revenue and Cash Expense per PH/S
Daily revenue per PH/s @ 1. Price increase shifts the curve up
$80 BTC price = $9220 2. Power prices come down even further
3. New, more efficient rigs come online
Cost per day to run
$60 S9 class device at
1c/kWh power cost
S9 Class @1 c/kWh, $48.01
$40 S17 Class @2 c/kWh, $34.94
S19 Class @3 c/kWh, $29.38
$20
Cost per day to run S19 class device
at 3c/kWh power cost
$0
Figure: Daily Revenue earned and Cash Expense per PH/s as a function of network Hashrate Source: BitOoda estimates, Blockchain.com, Kaiko, Coinmetrics
As of 7/14/2020
36 For exclusive use of BitOoda clients. Do not redistribute.BitOoda Research
BTC Flow / Hashrate • Bitcoin earned per MWh falls with increasing Hashrate, and is a
function of the power efficiency of the rig generation in use
relationship in per • Any mining project must factor in future Hashrate / network power
capacity projections in their budget projections
MWh terms
Release Power Power
Product Hashrate
Date Consumption Efficiency
BTC earned per MWh
Antminer S9 9/1/2016 14 TH/s 1648W 118 W/TH/s
Antminer S17 Pro 5/1/2019 56 3020 54
Antminer S19 Pro 5/11/2020 110 3640 33
Network Hashrate in PH/s
Figure: Bitcoin earned per MWh as a function of network Hashrate Source: BitOoda estimates, Blockchain.com, Kaiko, Coinmetrics
As of 7/14/2020
37 For exclusive use of BitOoda clients. Do not redistribute.BitOoda Research
$60 – 105 Revenue / Revenue per MWh at current 123.85 EH/s Target Hashrate and
$9220 Bitcoin price is ~$54 for S17 class equipment, ~$88 for next gen
MWh for S17 / S19 class S19 class rigs, but just $25 for older S9 class rigs
rigs
10EH/s delta offsets
a $1000 price delta
Revenue in USD per MWh
BTC price needs to be ~$21000 to be margin neutral
at 260 EH/s in 12 months
Network Hashrate in PH/s
Figure: Revenue generated per MWh for different classes of mining rig based on Source: BitOoda estimates, Blockchain.com, Kaiko, Coinmetrics
network Hashrate, and BTC price
Note: We assume a PUE of 1.12 to estimate share of power actively used to mine Bitcoin
As of 7/14/2020
38 For exclusive use of BitOoda clients. Do not redistribute.BitOoda Research
Hashrate Growth
Constraints:
Price, Power,
Production Capacity
39 For exclusive use of BitOoda clients. Do not redistribute.BitOoda Research
$4.5B in 12- month Capex • We assess the installed base of S17 class rigs was ~1.5mm units as of mid-May
2020
Needed to achieve 260 EH/s • Over the next year, an additional $4.5 billion in capex is needed to add
another ~2.3mm rigs to fully utilize the projected 10.6GW of power supply
• While newer S19 / M30 class rigs are preferred, we believe supply constraints
will persist through 2020, leading to continuing sales of S17 class rigs
3,726,496
$7,001 mm
S19 Class
1,028,479
S19 Class
$2,468 mm
2.3mm rigs =
$4.5B Capex
S17 Class
1,239,820
S17 Class
$2,083 mm
Current Current
S17 Class S17 Class
Base Base
1,458,196 $2,450 mm
1Yr Fwd Rig Installed Base Capital Base
Figure: Bitcoin Hashrate and power consumption Source: BitOoda, Blockchain.com, Kaiko, Coinmetrics
Note: We assume a PUE of 1.12 to estimate share of power actively used to mine Bitcoin
40 For exclusive use of BitOoda clients. Do not redistribute.BitOoda Research
Hashrate growth • We focus attention on the internal generation and funding gap, as we
view this as most consequential
constrains capacity
growth
• As Hashrate increases, revenue per PH/s falls, while costs remain the same for a given rig class.
• As a result, internal generation of funds falls, increasing the funding gap over time.
• The price of BTC is thus a critical constraint on the ability of the mining industry to ramp up capacity, as well as on the viability of newly
funded projects.
• A second, related constraint is the availability of funding at reasonable terms to close the gap: funding needs are lower if internal
generation is higher.
• Absent capital constraints, the next constraint is the capacity of rig manufacturers to deliver the volumes needed to achieve our hash
projections.
• Finally, available power capacity is a constraint that sets a (moving) upper limit on rigs in operation. We have modeled a 10% p.a. growth
in total available power at viable price points, from an estimated recent maximum available power of 9.6GW.
• We believe semiconductor capacity will prove sufficient to meet demand. Our model assumes delivery volumes that are well within
historical norms. At peak, Bitmain alone shipped as many as 2.56 million units in 6 months. However, near term supply constrains
remain, including lingering Covid-related supply chain disruptions as well as reported shipment delays at Bitmain related to
disagreements among the founders.
• The key constraint we examine here is internal generation and the funding gap.
41 For exclusive use of BitOoda clients. Do not redistribute.BitOoda Research
Revenue / MWh: Hash • Our conservative model assumes revenue / MWh falls from ~$100 to $60 for
S19 class rigs, even with price appreciating to $19k in 24 months
growth offsets price • We do not factor in any further average power price declines for the network,
but note that both flaring and intermittent / demand response operations are
intended to have average power prices far below the network average
$120
Revenue and Cost / MWh Capex needs fall once
upgrade cycle complete
S19 Class S17 Class Cash Cost
$100
$80
Revenue / MWh bumps up
upon retirement of s9 rigs
after hydro season
$60
$40
$20 Hydro season = lower
network power cost
$0
Figure: Revenue and cost per MWh Source: BitOoda, Blockchain.com, Kaiko, Coinmetrics
Note: We assume a PUE of 1.12 to estimate share of power actively used to mine Bitcoin
As of 7/14/2020
42 For exclusive use of BitOoda clients. Do not redistribute.BitOoda Research
$4.1 B funding gap • Internal generation for the industry assumes BTC price grows steadily to ~$19k
in 2 years, although many industry participants might model a higher price
Over next 18 months • Per our model, the Bitcoin mining industry will need $4.1B in external funding
to support expansion through the end of 2021
• The ability to raise financing is the second boundary condition limiting Hashrate
Weekly Cash Contribution Weekly Capex
$100
Capex far exceeds internal Capex needs fall once
$90
generation upgrade cycle complete
$80
Weekly, in $ millions
$70
$60
$50
$40
$30
$20
$10
$0
$4,500 Cumulative Funding Gap
$4,000
$3,500
$3,000
$ millions
$2,500
$2,000 $4.1 billion funding gap
$1,500
$1,000
$500
$0
Figure: Bitcoin network capex and internal generation Source: BitOoda, Blockchain.com, Kaiko, Coinmetrics
Note: We assume a PUE of 1.12 to estimate share of power actively used to mine Bitcoin
As of 7/14/2020
43 For exclusive use of BitOoda clients. Do not redistribute.BitOoda Research
60k Weekly Shipments • Concerns have been raised about the ability of manufacturers to deliver the
60k units per week built into our Hashrate projections
Achievable: No Capacity • However, Bitmain filings (IPO prospectus, pp 163) reveal they were able to
deliver over 95,000 S9s per week in 2018
Constraint • The industry has the ability to ship >150k devices a week, although we believe
shipments will likely be lumpy based on wafer deliveries from the foundries
S9 Class S17 Class S19 Class
4,500,000
Installed base, in units
4,000,000
3,500,000
3,000,000
2,500,000
2,000,000
1,500,000
1,000,000
500,000
0
60,000
Shipments fall once
40,000
upgrade cycle is
complete
20,000
Weekly units added / removed
0
20,000
S9 class devices S17 class devices start
retired post 2020 getting retired once power
40,000
Hydro season capacity is saturated
60,000
10/18/2020
11/29/2020
12/20/2020
10/10/2021
10/31/2021
11/21/2021
12/12/2021
7/5/2020
9/6/2020
4/4/2021
6/6/2021
8/8/2021
1/2/2022
3/6/2022
5/8/2022
6/14/2020
7/26/2020
8/16/2020
9/27/2020
11/8/2020
1/10/2021
1/31/2021
2/21/2021
3/14/2021
4/25/2021
5/16/2021
6/27/2021
7/18/2021
8/29/2021
9/19/2021
1/23/2022
2/13/2022
3/27/2022
4/17/2022
5/29/2022
6/19/2022
7/10/2022
7/31/2022
Figure: Bitcoin network capex and internal generation Source: BitOoda, Blockchain.com, Kaiko, Coinmetrics
Note: We assume a PUE of 1.12 to estimate share of power actively used to mine Bitcoin
As of 7/14/2020
44 For exclusive use of BitOoda clients. Do not redistribute.BitOoda Research
7nm and 5nm should • The next major step in ASIC technology will come with the ramp up in 5nm
technology. At this node, TSMC, the primary supplier to Bitmain, has a lead
dominate rig shipments •
over Samsung, the other major foundry.
While TSMC is seeing volume orders at both 7nm and 5nm nodes, their
through 2022 •
process geometries look similar to Intel’s 10nm node
We believe Samsung also features a tighter process geometry, so Samsung is
close behind TSMC.
• Samsung recently announced that plans for commercial production on a 3nm
process node would likely be delayed into 2022, while 5nm will likely be the
mainstay of 2021 production (See this news article).
• We believe the dearth of 3nm capacity and likely initial low yields will lead to
5nm processes being the mainstay of ASIC development and production
through 2022.
• Thus S19 class rigs will form the bulk of shipments in the next 24 months,
although incremental design improvements could lead to efficiency gains that
could be reflected in new model lineups.
Figure: Comparison of Intel and TSMC process geometry Source: https://www.eetimes.com/intels-10nm-node-past-present-and-future/
45 For exclusive use of BitOoda clients. Do not redistribute.BitOoda Research
Appendix and
Sources
46 For exclusive use of BitOoda clients. Do not redistribute.BitOoda Research
Appendix: • New equipment offers superior operating performance with
capital and power efficiency gains
Select Equipment • With next generation equipment offering lower cash cost than
the old, the price of a new prior generation rig needs to be
Efficiency Statistics low enough that the total cost to mine, including depreciation is
comparable for both models
• This is what we mean by the “displace” price – the needed price
for a rig to be competitive with the newer rig that is displacing it
Price Date Metrics Price per TH/s
Product
Release Displace Release Displace Hash Rate in Wattage Watts per Release Displace
TH/s TH/s
Figure: Select Bitcoin mining rig details Source: BitOoda, Bitmain, Canaan, MicroBT
Note: Since 2013
47 For exclusive use of BitOoda clients. Do not redistribute.48
BitOoda Research
100
120
140
160
180
20
40
60
80
0
Antminer S9 105 W
Antminer T9 126 W
Antminer S9 Pro 98 W
Antminer T9+ 136 W
Whatsminer M3 167 W
Appendix:
Whatsminer M3X 164 W
DragonMint T1 93 W
AvalonMiner 841 95 W
S9 Class
Ebang E9.3 110 W
Antminer S9 Hydro 96 W
AvalonMiner 921 85 W
GMO miner B2 81 W
GMO miner B3 104 W
Efficiency Statistics
Antminer S9 SE 80 W
Rig Classes based on
Figure: BitOoda classification of rigs into key classes
110 W
Antminer S17 Pro 40 W
Antminer S17e 45 W
Antminer T17 55 W
Ebang Ebit E11++ 45 W
Ebang E12+ 50 W
Whatsminer M10 65 W
Whatsminer M10S 64 W
Whatsminer M21S 60 W
Whatsminer M20S 49 W
S17 Class
Whatsminer M31S 46 W
StrongU STU-U8 46 W
StrongU STU-U8 Pro 47 W
AvalonMiner 1066 60 W
AvalonMiner 1066 65 W
AvalonMiner 1047 64 W
AvlalonMiner 1146 52 W
For exclusive use of BitOoda clients. Do not redistribute.
AvalonMiner 1166 47 W
per TH/s across manufacturers.
53 W
Antminer S19 Pro 30 W
Antminer S19 34 W
“class” rather than individually by model.
Antminer T19 38 W
Whatsminer M30S 38 W
S19 Class
Whatsminer M30S+ 34 W
Whatsminer M30S++ 31 W
• We use Bitmain models as a generic for each class of rig
34 W
• Each generation of mining rigs exhibits similar power efficiency
• Thus, it makes sense to simplify analysis based on “generation” or
Source: BitOoda, Bitmain, Canaan, MicroBT, Halong, GMO, AsicMinerValue.comBitOoda Research
Sources:
Much of the most sensitive data came from • https://www.blockwaresolutions.com/ -popular-mining-farm-among-miners-is-
direct conversations with miners, rig • https://www.bitmain.com/ located-in-canada/
manufacturers, and distributors / resellers as • https://news.bitcoin.com/study-publicly-
well as hosting data providers. The resulting • https://www.canaan.io/
listed-chinese-firms-quietly-participate-in-
data was more detailed than publicly available, • https://www.innosilicon.com/ bitcoin-mining/
but shared on condition that no raw data nor any • https://whatsminer.net/
personally identifiable information would be • https://cointelegraph.com/news/bitfury-to-
published. We have respected that. Where launch-bitcoin-mining-centers-in-paraguay-
possible, we also used public sources to further with-new-partnership
News Sources: • https://askjaenergy.com/2017/12/07/the-
build our overall view of the mining space.
• https://www.londonstockexchange.com/ex pricing-policy-of-landsvirkjun/
change/news/market-news/market-news- • https://bitcoin.com.py/mineria-de-bitcoins-
Core Sources: detail/ARB/14446979.html, en-paraguay/
https://www.theblockcrypto.com/genesis/5
• Coinmetrics.io 4978/argo-blockchain-sees-sizable-increase- • https://www.bloomberg.com/news/feature
• Kaiko.com to-mining-operations-yet-still-trades-at-a- s/2019-11-24/seo-inside-russia-s-largest-
significant-discount-to-peers bitcoin-mine
• Blockchair.com
• https://www.theblockcrypto.com/genesis/5 • https://www.coindesk.com/a-new-york-
• BTC.com power-plant-is-mining-50k-worth-of-
4978/argo-blockchain-sees-sizable-increase-
• Blockchain.com to-mining-operations-yet-still-trades-at-a- bitcoin-a-day
significant-discount-to-peers • https://bravenewcoin.com/insights/layer1-
• https://www.bloomberg.com/press- opens-texas-bitcoin-mining-operation
Company Sources: releases/2019-12-18/cryptostar-corp- • https://www.businesswire.com/news/hom
• https://www.riotblockchain.com/news- announces-new-operations-to-commence- e/20200316005393/en/Northern-Data-AG-
media/press-releases/detail/76/riot- in-nl-canada-positioned-to-become-one-of- Announces-Revenue-Earnings-Forecast
blockchain-announces-march-2020- the-lowest-cost-bitcoin-produce • https://news.bitcoin.com/bitmains-
production-update • https://finance.yahoo.com/news/dmg- cofounder-accused-of-hindering-next-gen-
• https://ir.riotblockchain.com/press- increases-mining-capacity-secures- bitcoin-mining-rig-shipments/
releases/detail/75/riot-blockchain-reports- 130010500.html
2019-financial-results-and • https://www.cryptoworldjournal.com/most
• https://www.hiveblockchain.com/projects/ -popular-mining-farm-among-miners-is-
overview/ located-in-canada/
• https://www.linkedin.com/company/mineb • https://www.theblockcrypto.com/genesis/5
est/about/ 4978/argo-blockchain-sees-sizable-increase-
• https://bits2u.com/us.html to-mining-operations-yet-still-trades-at-a-
significant-discount-to-peers
• https://www.blockwaresolutions.com/
• https://www.cryptoworldjournal.com/most
49 For exclusive use of BitOoda clients. Do not redistribute.BitOoda Research
Disclosures
Purpose General Disclosures investment or transaction decision. The
Information is not a recommendation to engage
This research is only for the clients of BitOoda. Any information (“Information”) provided by in any transaction. The digital asset industry is
This research is not intended to constitute an BitOoda Holdings, LLC, BitOoda Digital, LLC, subject to a range of inherent risks, including but
offer, solicitation, or invitation for any securities BitOoda Technologies, LLC or Ooda not limited to: price volatility, limited liquidity,
and may not be distributed into jurisdictions Commodities, LLC and its affiliated or related limited and incomplete information regarding
where it is unlawful to do so. For additional companies (collectively, “BitOoda”), either in this certain instruments, products, or digital assets,
disclosures and information, please contact a publication or document, in any other and a still emerging and evolving regulatory
BitOoda representative at info@bitooda.io. communication, or on or environment. The past performance of any
through http://www.bitooda.io/, including any instruments, products or digital assets addressed
Analyst Certification information regarding proposed transactions or in the Information is not a guide to future
trading strategies, is for informational purposes performance, nor is it a reliable indicator of
Sam Doctor, the research analyst denoted by an only and is provided without charge. BitOoda is future results or performance.
“AC” on the cover of this report, hereby certifies not and does not act as a fiduciary or adviser, or
that all of the views expressed in this report in any similar capacity, in providing the Ooda Commodities, LLC is a member of NFA and
accurately reflect his personal views, which have Information, and the Information may not be is subject to NFA’s regulatory oversight and
not been influenced by considerations of the relied upon as investment, financial, legal, tax, examinations. However, you should be aware
firm’s business or client relationships. regulatory, or any other type of advice. The that NFA does not have regulatory oversight
Information is being distributed as part of authority over underlying or spot virtual
Conflicts of Interest BitOoda’s sales and marketing efforts as an currency products or transactions or virtual
introducing broker and is incidental to its currency exchanges, custodians or markets.
This research contains the views, opinions, and business as such. BitOoda seeks to earn
recommendations of BitOoda. This report is execution fees when its clients execute BitOoda Technologies, LLC is a member of FINRA.
intended for research and educational purposes transactions using its brokerage “BitOoda”, “BitOoda Difficulty”, “BitOoda Hash”,
only. We are not compensated in any way based services. BitOoda makes no representations or “BitOoda Compute”, and the BitOoda logo are
upon any specific view or recommendation. warranties (express or implied) regarding, nor trademarks of BitOoda Holdings, LLC.
shall it have any responsibility or liability for the
accuracy, adequacy, timeliness or completeness Copyright 2020 BitOoda Digital, LLC. All rights
of, the Information, and no representation is reserved. No part of this material may be
made or is to be implied that the Information reprinted, redistributed, or sold without prior
will remain unchanged. BitOoda undertakes no written consent of BitOoda.
duty to amend, correct, update, or otherwise
supplement the Information.
The Information has not been prepared or
tailored to address, and may not be suitable or
appropriate for the particular financial needs,
circumstances or requirements of any person,
and it should not be the basis for making any
50 For exclusive use of BitOoda clients. Do not redistribute.You can also read