ELECTRICITY GENERATION - FACTS AND FIGURES - VGB PowerTech e.V.
←
→
Page content transcription
If your browser does not render page correctly, please read the page content below
FACTS AND FIGURES

ELECTRICITY GENERATION   2017|2018
FAC TS A N D FI G U R ES                                                                                   EL E C T R I C I T Y G EN ER AT I O N 2017 l 2018

DEVELOPMENT OF THE GLOBAL AND EUROPEAN ELECTRICITY DEMAND

T      he global population is increasing by 78 million people per year, i. e.
       within roughly five decades, the number of people has doubled be-
tween 1960 and today. At present, approximately one quarter of the global
                                                                                 Contents

                                                                                 n Electricity Demand Worldwide and in the EU                        2  – 3
population of nearly 7.5 billion people do not yet have access to electricity.
                                                                                 n Availability of Energy Sources                                        4
Electricity consumption will grow faster than any other form of energy
consumption. The IEA estimates in its “Current Policies” scenario that in        n Unconventional Gas in Europe                                          5
all fields and regions the annual demand will increase by 2.13 % until 2040.     n Renewables (RES) in the EU                                            6
The worldwide gross electricity consumption will increase from 23,809 bil-
                                                                                 n Hydro power, wind energy, biomass                                 7  – 9
lion kWh to 42,511 billion kWh. The “450 Scenario” of the IEA – this
scenario covers a drastic reduction of greenhouse-gas emissions but – also       n Wind energy and secure provision of capacity                  10  – 12
notes an increase up to 34,092 billion kWh. About 13 %, i.e. 3,155 bil-          n Distributed power, Storage technologies                       12  – 13
lion kWh, of electricity globally generated was provided in the European         n Flexible conventional power plants                            14  – 15
Union (EU). A 0.9 % (“Current Policies”) or 0.3 % (“450 Scenario”) p.a.
rise in demand is expected in the EU by 2040.                                    n Nuclear Power Worldwide                                       16  – 17
According to IEA (International Energy Agency) scenarios, fossil fuels will      n Robustness of Nuclear Power Plants                            18  – 19
still account for about 30 to 60 % of electricity generated worldwide in 2040.   n New power generation capacities needed                        20  – 21
Renewable energy sources will play a growing role in the global primary en-
                                                                                 n Directive on national emission ceilings                       22  – 23
ergy consumption structure. Likewise, nuclear power will – despite the po-
litical nuclear phase-out in some countries – maintain an important position     n Global Climate Policy Needed	                                 24  – 25
in global electricity generation and will even grow in some countries.           n VGB: Activities and Members                                   26  – 27
                                                                                 n Imprint                                                             28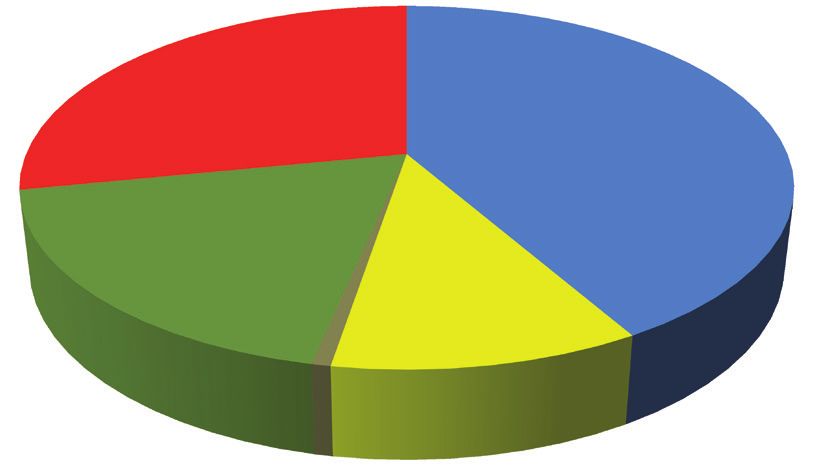
Expected growth in electricity generation in billion (109) kWh worldwide                  Expected growth in electricity generation in billion (109) kWh in the EU

 45,000
                                                                                          4,500
                                                                       Current Policies                                                                         Current Policies
                                                                            +77 %                                                                                   +27 %
 40,000                                                                +2.3 % per year    4,000                                                                 +0.9 % per year

                                                                        450 Scenario                                                                             450 Scenario
                                                                           +23 %          3,500
                                                                                                                                                                     +9 %
                                                                       +1.5 % per year                                                                          +0.3 % per year
 30,000
                                                                                          3,000

                                     Current Policies

                                                                                                                            Current Policies
                                                                       Wind,              2,500

                                                        450 Scenario
                                                                       biomass, solar                                                                         Wind,
                                                                                                                                                              biomass, solar
 20,000

                                                                                                                                               450 Scenario
                                                                       Hydro              2,000
                                                                                                                                                              Hydro
                                                                       Nuclear
                                                                                          1,500                                                               Nuclear
                                                                       Fossil
 10,000                                                                                                                                                       Fossil
                                                                                          1,000

                                                                                            500

      0
                      2014                         2040                                       0
                             Year                                                                            2014                         2040
                                                                                                                    Year

                                                                                                                            Sources: IEA, EU Commission, VGB (own calculations)

                                                                                                                                                                       PAG E 2 – 3
FAC TS A N D FI G U R ES EL E C T R I C I T Y G EN ER AT I O N 2017 l 2018
AVAILABILITY, RANGE AND IMPORT DEPENDENCY OF ENERGY SOURCES
E xisting primary energy reserves and resources, in particular when includ-
ing unconventional sources, are still sufficient in terms of fossil fuels and
uranium around the world. Hard coal and lignite as well as uranium are the
Static range of energy sources worldwide
as well as reserves and resources (in years)
most widespread. oil
= Reserves
Conventional 55 80
However, energy sources have an uneven geographical distribution, which Conventional 80 160 = Resources
means that some countries and regions, including the European Union, are + non-conv.
becoming increasingly dependent on imports. The EU’s fossil fuel reserves Natural gas
Conventional 60 300
amount to about 52,000 million tonnes of coal equivalent (TCE), account-
Conventional 85 600
ing for only 3.5 % of the known reserves worldwide, and consist mainly of + non-conv.
lignite and hard coal. The natural gas and oil reserves amount to approxi- Hard coal 115 2,600
mately 8.75 billion TCE.
Lignite 320 5,500
Europe’s dependency on imported coal will grow from about 40 % today
Uranium
to more than 60 % by 2035. An import dependency of 81 % is expected (< 260 $/kg) 145 315 > 8,000 *
for natural gas and of as much as 88 % for oil. Overall, the share of im- * advanced
fuel cycles
ported energy will increase from about 50 % today to roughly 70 % by 0 50 100 150 > 200 > 1,000 Years
2030.
Underlying causes are the decreasing European energy reserves that can be Sources: BGR, OECD-NEA, VGB
produced at competitive prices. In some countries lignite remains the only Reserves: Known and with current technology economically recoverable sources.
Resources: Reserves and documented but with current technology economically
fuel that can still be mined in the long term from open cast mines at com- not recoverable sources.
petitive costs. Static range: As quotient of amount of reserves and/or resources and current consumption,
it is a snap-shot of the current state of knowledge.THE ROLE OF UNCONVENTIONAL GAS IN EUROPE
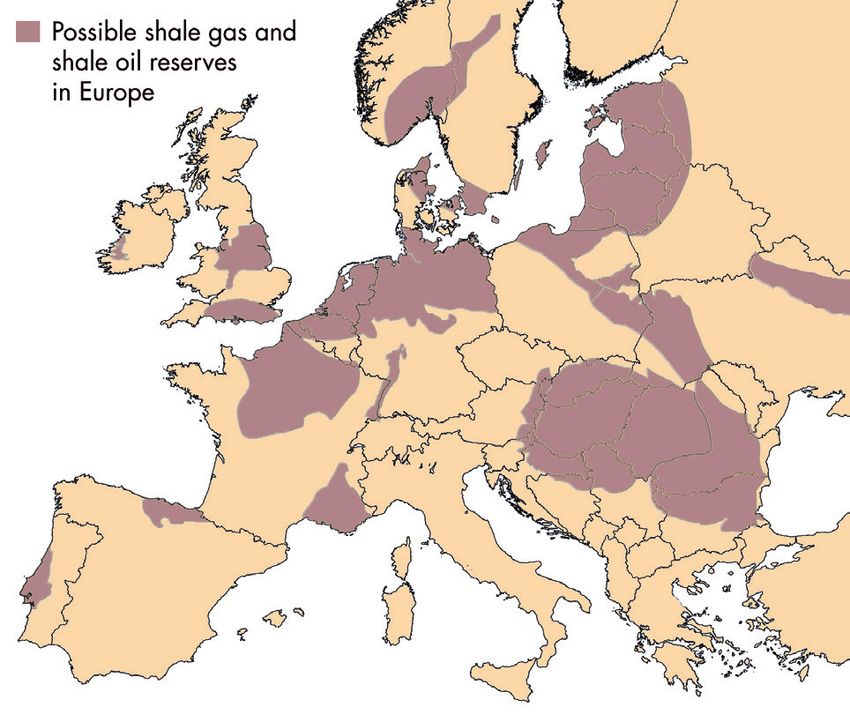
Unconventional gas production, mainly shale gas, which is extracted by
fracking in the United States, has set the global gas market in motion. There
is hardly any other country in the world that has so consistently pushed
forward shale gas extraction than the USA. Since 2007 shale gas production
has been increasing more than six times and according to the US Depart-
ment of Energy (DOE), 1.18 million cubic metres of shale gas were pro-
duced daily in 2015. According to experts it is expected that in a couple of
years, the USA will no longer have to rely on natural gas imports.
In January 2011, the European Commission published an expert report for
the European Parliament and the European Commission and estimated
that the exploitable resources in Europe amount to about 16 trillion cubic
metres (world: 200 trillion cubic metres). Based on scenarios of the Internal
Energy Agency (IEA), the Commission draws the conclusion that in 2035
the share of shale gas will amount to 77 billion cubic metres in the most
favourable case, which would equal to 11 % of the entire EU natural gas
production and which could cover about 3 % of the total primary energy
demand. While some countries have already launched activities to produce
shale gas, other countries like Germany are very critical towards fracking
because of potential risks for humans and the environment.
Source: BGR
PAG E 4 – 5FAC TS A N D FI G U R ES EL E C T R I C I T Y G EN ER AT I O N 2017 l 2018
RENEWABLES – EU’S AMBITIOUS TARGETS FOR 2020
The EU and their member states have set binding, ambitious targets to Sweden 49 Target
53.9
promote the expansion of renewable energy sources. For the electricity sec- Finland 39.3 38 Target reached
reached
tor, the EU expects renewables to account for 34 % by 2020. Latvia
Austria
37.6
33.0 34
40
Since the implementation of the EU Directive for climate protection and Denmark 30.8 30 Target reached
Croatia
energy ‒ often referred to as the “20-20-20 package” ‒ adopted in Decem- Estonia
29.0
28.6
20 Target reached
25 Target reached
ber 2008, the share of renewables in gross final energy consumption has Portugal 28.0 31
Lithuania
increased by an average of 6.5 % per year and reached 16.7 % in 2015, Romania
25.8
24.8
23 Target reached
24 Target reached
almost twice as high as in 2004 (8.5 %). Slovenia 22.0 25 EU-targets for RES till 2020:
Bulgaria
At 53.9 %, Sweden‘s share of renewables was by far the highest in 2015, Italy
18.2
17.5
16 Target reached
17 Target reached 20 % share of renewable
energy in gross final energy
followed by Finland with 39.3 %, Latvia (37.6 %) and Austria (33.0 %). Spain 16.2 20
consumption
Greece 15.4 18
With Sweden, Finland, Denmark, Croatia, the Czech Republic, Estonia, France 15.2 23 10 % share of energy
from renewable sources
Lithuania, Romania, Bulgaria, Italy and Hungary, eleven of the 28 EU Czech Republic 15.1 13 Target reached in transport
Germany
Member States have already met their 2020 targets. The lowest values were Hungary
14.6
14.5
18
13 Target reached
found in Luxembourg and Malta (5.0 % each), the Netherlands (5.8 %) Slovakia 12.9 14 EU
Poland
and Belgium (7.9 %). Cyprus
11.8
9.4 13
15 2015: 16.7 % 2020: 20 %
Energy from renewables will play a key role for the years after 2020. For this Ireland 9.2 16
United Kingdom 8.2 15
reason, the member states have agreed on a new EU target of at least 27 % Belgium 7.9 13 2015
by 2030. Netherlands 5.8 14 Target 2020
Malta 5.0 10
Luxembourg 5.0 11
EU-28 16.7 20
0 10 20 30 40 50 60
Share of renewables of gross final energy consumption in %
Source: Eurostat 2017 (data base: 2016)HYDRO POWER – AN INDISPENSABLE SOURCE OF ENERGY
Hydro power is not only a reliable renewable energy source, but also the
frontrunner in Europe in the generation of electricity from renewable en-
ergy sources. With a production of more than 342 TWh – around 35.5 % Target for RES-electricity Status 2015 – Total: 962 TWh
of the electricity generated from renewable energy sources – hydro power in EU-28 Target in 2020: 1,196 TWh
makes a significant contribution to achieving the EU target of 34 % of 2015 2020
83 target; current targets achieved
In brackets (...): Individual
electricity generation from renewable energy sources by 2020. 29.7 % 34.0 % 304
In addition to the predictable and constant generation of run of river pow-
er plants for base load coverage, the provision of reserve power and peak
load to ensure security of supply and, in particular, control power to main- Wind energy
Hydro power
tain grid stability in an increasingly flexible energy market is becoming
302
more and more important. In Europe, these requirements are primarily met (495; 61 %) 342
by high-efficiency pumped storage and storage hydro power plants with a (355; 96 %)
total installed bottleneck capacity of more than 47,443 MW.
Hydropower is therefore not only an extremely efficient, reliable and stor- 178
(232; 77 %) 108
able form of energy, but also an indispensable renewable source of energy (103; 105 %)
37
which has to be conserved and further developed within the framework of (11; 333 %)
the energy transition.
Biomass
Geothermal Solar energy
Source: Eurostat 2017 (data base: 2016)
PAG E 6 – 7FAC TS A N D FI G U R ES EL E C T R I C I T Y G EN ER AT I O N 2017 l 2018
WIND ENERGY – A MAINSTAY OF THE ENERGY TRANSITION
In order to meet the European Union’s targets for the energy and climate
package by 2020, it is also imperative to further expand the use of wind Wind power:
energy. In Germany at the end of 2016, around 27,270 wind turbines with Capacities in Europe
end of 2016 in MW
a total capacity of 50,019 MW were in operation. At that time, the installed
capacity of wind turbines in Europe was 161,330 MW and worldwide Total Europe*:
FI
486,749 MW. 161,330 MW
NO 1,539
A retrospective analysis of the wind turbine market reveals continuous fur- 838 SE
6,519
ther development of system technology, accompanied by increasing rated ES 310
power, rotor diameter and hub height. From the first small plants with an IR DK LV 63 RU
15
5,227
average output of around 30 kW and rotor diameters of less than 15 m in 2,830
UK NL LT 493
14,542 4,328
the mid-1980s, machines with a rated power of 8 MW and more as well as DE PL
BE
rotor diameters of 160 m have been developed. Wind turbines have already 2,386 50,019 5,782
paid for themselves in terms of energy after three to seven months of op- FR
LU
58
CZ
281
UA
526
SK 3
eration. This means that after this time the turbine has produced as much 12,065 CH 75 AT
2,632 HU RO
energy as is required for its production, operation and disposal. In addition PT
SI HR
329 3,028
to the consistent further development of system technology, the optimiza- 5,316 ES
23,095
IT
9,257
3 422
BG
tion of maintenance strategies in particular will play a decisive role in the 691
future in order to increase technical availability and thus economic effi- GR TR
6,081
2,374
ciency. Especially reliability, weight, costs and efficiency play a key role in
this respect.
CY 158
* Including not listed countries. Source: WindEuropeBIOMASS – THE ALL-ROUNDER
Energy production from biomass is a decisive component of the energy
transition. Currently, 178 TWh of electricity is produced from biomass in
Europe, which means that biomass accounts for 18.1 % of renewable elec- Biomass: Development of electricity generation in the EU
tricity generation. Sweden Finland Germany United Kingdom EU-28
Biomass is used as a fuel in thermal power plants or is fermented to produce 250
methane in biogas plants. Biomass power plants perform the same tasks for
the stability of the electricity grid as fossil-fired power plants. They are suit-
Electricity generation in billion (109) kWh
able for base load as well as for the supply of balancing and control power. 200
In addition, it is also possible to convert coal-fired power plants to biomass
in order to continue using existing sites. Biogas is usually used in gas en-
gines to generate electricity. These can be combined in a virtual power plant 150
and thus participate in the balancing energy market. Another option is the
processing of the biogas to natural gas quality and subsequent feeding into
the natural gas grid. In this context the considerable storage potential of the 100
gas grid is utilised and the gas production and gas utilisation are spatially
and temporally separated.
Biomass power plants and biogas plants can be used both in centralized and 50
distributed systems. Biomass, as an all-round renewable energy source, is
therefore an indispensable component of future energy supply systems.
0
2009 2010 2011 2012 2013 2014 2015 2020
Year
Source: Eurostat
PAG E 8 – 9FAC TS A N D FI G U R ES EL E C T R I C I T Y G EN ER AT I O N 2017 l 2018
CONTRIBUTION OF WIND ENERGY TO THE SECURE PROVISION OF CAPACITY
T he cumulative rated capacity of wind turbines in Germany almost dou-
bled from 26,903 MW at the end of 2010 to 50,019 MW by the end
of 2016. Wind energy accounted for around 12 % of total electricity gen-
For comparison: In 2015, the maximum annual peak load on the German
grid reached 78,200 MW at 5:30 p.m. on 24 November.
The permanently available (secured) capacity of the “German wind portfo-
eration in Germany, of which 10 % was onshore wind energy and 2 % lio” was therefore always below one percent of its nominal capacity. This
offshore wind energy, making it an important renewable energy source in information is also found in the transmission grid operators’ reports on the
Germany. electricity balances from 2012 to 2016, which at the time of the maximum
With regard to the contribution of wind energy to the security of supply, annual wind energy load in Germany assume that, despite the significant
the development of the annual minimum values as a measure of the per- increase in installed capacity, the unavailability of wind energy will remain
manently available capacity over the year is revealing: These values have unchanged at 99 %.
remained at an unchanged low level of 100 MW on average since 2010, The low level of the minimum values can be statistically explained: A look
although the cumulative nominal capacity of the “German wind portfolio” at the frequency distribution of the cumulative power of German wind
has almost doubled within the same time. Obviously, the expectation that turbines in 2016 shows that there is no normal distribution and that low
the minimum value would increase if more wind turbines are built power output appears to occur much more frequently than high power
throughout Germany and thus increasingly allowing for the replacement output.
of conventional power plant capacity has not been met: The expansion of
Wind energy therefore makes virtually no contribution to guaranteed sup-
wind energy in Germany over the last seven years has replaced conven-
ply of electricity. Therefore, additional technologies are still needed to en-
tional ‒ schedulable ‒ power plant capacity of an average of 100 MW.
sure security of supply. Various options are available along the value chain,
such as making conventional power plants more flexible, electricity storage
or demand side management.Key Key
figures for wind
figures energy
for wind in Germany
energy fromfrom
in Germany 2010 to 2016
2010 to 2016 Frequency distribution
Frequency of wind
distribution power
of wind production
power in Germany
production in 2016
in Germany in 2016
Quarter-hourly resolution
Quarter-hourly resolution µ-σ µ-σMeanMean
valuevalue
µ µµ+σ µ+σ Quarter-hourly resolution
Quarter-hourly resolution
60,000
60,000 10 10
55,000
55,000 σ σ σ σ
50,019 9 9
50,019
50,000
50,000 Standard deviation
Standard deviation
8 8
45,000
45,000
Nominal power
Nominal PN 38,557
power PN 38,557 7 7
40,000
40,000
Relative frequency in %
Relative frequency in %
33,834
33,834 6
35,000
35,000 6
Capacity in MW
30,979
Capacity in MW
30,979 29,282
29,282
30,000
30,000
26,903 5 5 Real Real
data data
20162016
26,903 Maximum PMax PMax
Maximum
24,086
24,086 µ = 8,769 MW MW
µ = 8,769
25,000
25,000
21,678 4
21,678 4 σ = 6,852 MW MW
σ = 6,852
20,000
20,000
3 3
15,000
15,000 Arithmetic meanmean
Arithmetic valuevalue
Pµ Pµ
8,7698,769 2 2
10,000
10,000
5,2245,2245,4105,4105,8405,840
4,0994,099
Minimum PMin PMin
Minimum 1 1
5,000
5,000
117 117 115 115 24 24 141 141
0 0 0 0
20102010
20112011
20122012
20132013 20142014
20152015
20162016 0 0 5,000 10,000
5,000 15,000
10,000 20,000
15,000 25,000
20,000 30,000
25,000 35,000
30,000 35,000
Year Year Power in MW
Power in MW
Sources: BMWi, BWE, Germany TSOs, VGB (own calculations) Sources: German TSOs, VGB (own calculations)
PAG E 10 – 11FAC TS A N D FI G U R ES EL E C T R I C I T Y G EN ER AT I O N 2017 l 2018
DISTRIBUTED POWER GENERATION – NEW SUPPLY SYSTEM STRUCTURES
D istributed generation is an essential part of the energy transition and
will increase significantly in the coming years. However, the complex
system of distributed energy supply, consisting of generation – transmission
Growth of distributed power production in different regions
120,000
– distribution – consumption, must be considered in its entirety. North America Western Europe Eastern Europe
Combined heat and power plants are mainly based on the classic piston 100,000
engine process. In addition, fuel cells, micro gas turbines and Stirling en-
gines can open up new fields of application for combined heat and power
Capacity in MW
(CHP). They represent important technical innovations, as they enable the 80,000
use of CHP technology even in the very small power range. This applies in
particular to applications in the local heating sector, but also in the com- 60,000
mercial and industrial sectors.
In connection with the increase in distributed energy generation, these sys-
tems will increasingly have to offer the necessary network services in the 40,000
future, including the provision of control power.
To support the necessary measures, smart metering will now also be intro- 20,000
duced in Germany from 2017 onwards, depending on consumption
(>10,000 kWh/a in 2017; >6,000 Wh/a in 2020 for private house-holds).
It has to be considered that a high standard of IT security must be main- 0
2014 2015 2016 2017 2018 2019 2020 2021 2022 2023
tained for the measurement and control systems.
Year
Source: Navigant ResearchSTORAGE TECHNOLOGIES – AN IMPORTANT COMPONENT OF SYSTEM STABILITY
I n parallel with the increase in decentralized energy supply and the steady
increase in electricity generation from fluctuating renewable energy
sources, there is an urgent need to expand storage capacity in the future.
Specification High capacity High amount of energy
Storage time Seconds Minutes Hours (days)
The systems can be divided into central storage power plants, distributed
small storage facilities, and short or long-term storage facilities. It is also Application
(examples)
Redispatch ˝Black start“ Stand-alone networks,
electricity trading
Voltage stabilisation Uninterruptible
possible to store electrical or thermal energy. A decisive criterion for the power supply Peak-load smoothing
Frequency stabilisation Load balacing
selection of the appropriate storage technology is the time range which is to Soft-hybrides
Batterie-power vehicles
be covered. Choosing the right location also plays an important role. Classification Thermal Local Decentral Central storage
Short-time storage
Market-driven conditions are required for the use of the various storage technologies storage small storage large batteries power plants
technologies. The current possible alternatives include, for example, the Storage
concepts Sensitive storages Double-layer Lead-acid Lead-acid Pumped-storage
expansion of the electricity grid, making the existing power plant port-folio Latent storages capacitors batteries (Pb) batteries (Pb) power plants
Lithium-Ion Lithium-Ion Compressed-air
more flexible, and also the use of demand side management. Chemical
storages
Superconducting
magnetic batteries (LIB) batteries (LIB) power plants
At present, only the use of hydroelectric power in the form of pumped stor- energy storage Nickel-cadmium Natrium-
batteries (NiCd) sulphur
Hydrogen-storage
age power plants is available as a fully developed technology. Large-scale Fly-wheel Nickel-metal- batteries (NaS) power plants
hydrid batteries
battery systems have already proven their technical suitability for use in the (NiMH)
Redox-flow-
batteries (RFB)
Type of storage
control power market and can also be used commercially in niche applica-
Virtual storage
tions. Electrical (electromagnetic or -static field)
Electro-chemical (chemical energy)
Mechanical (kinetic or potential energy)
Source: Fraunhofer ISI (2012)
PAG E 12 – 13FAC TS A N D FI G U R ES EL E C T R I C I T Y G EN ER AT I O N 2017 l 2018
FLEXIBLE CONVENTIONAL POWER PLANTS – GUARANTEEING SECURITY OF SUPPLY
T he CO2 emissions of coal-fired power plants have been gradually re-
duced as a result of technological development. In consequence, the
average global efficiency has risen from roughly 30 % to about 33 %, and
The new power plants currently under construction have therefore been
designed for particularly flexible operation, especially in Germany.
Essential technical criteria for flexibility are stable minimum load, start-up
the consistent application of state-of-the-art technology with an efficiency and shutdown times as well as minimum operation and downtimes, load
level of 44 % to 47 %, the CO2 volume could continue to be significantly gradients and the control ranges in different load scenarios. Another com-
reduced worldwide. In countries with a growing share of fluctuating renew- pletely different aspect is flexibility with regard to quality fluctuations in the
able energy sources in electricity generation, the primacy of efficiency is main fuel and the use of substitute, refuse derived, fuels.
increasingly being replaced by the need for flexibility.
New and appropriately upgraded thermal power plants can contribute to
Generation by conventional plants must adapt quickly and flexibly to the the integration of renewable energies into a modern power supply system
residual load at all times, i.e. be available to compensate for the difference through their flexible operation. The focus of technical developments is on
between consumption and fluctuating feed-in from photovoltaic and wind the exploitation of existing potential for flexible plant operation. Against
energy plants. Short-term feed-in fluctuations are triggered by the rapidly the backdrop of the expansion targets for renewable energy throughout
increasing output of photovoltaic systems. The resulting effects become the Europe, a broad and flexible thermal power plant portfolio will continue to
decisive driver for the day to day feed-in fluctuation with the increasing be indispensible in the future in order to ensure economic efficiency and
intensity of solar radiation from spring onwards. In the medium to long security of supply at all times.
term, the average cycle lies between strong and weak wind phases; in north-
western Europe, it corresponds to about three to five days. Due to limited
interconnection capacities, the necessary flexibility for permanent load bal-
ancing has to be met to a large extent by the power plants in Germany.Flexibility parameters of thermal power plants:
High load gradients, low minimum load,
Flexibility of thermal power plants – State-of-the-art short ramp-up times
1,300 Plant type Hard coal Lignite CCGT Gas turbine
Lignite (e.g. BoA) Nuclear
1,200 Load gradient
2/4/8 2 /Max
4 /capacity
8 4~1,300
/ 8 / 12 8 / 12 / 15
Capacity in MW
Max
in %capacity
per minute~1,000 MW MW
Nuclear power plants Min capacity ~420 MW Min capacity ~520 MW
1,000 ... ramp rate
Max +/-30 MW/min Max ramp rate +/-63 MW/min
in the load range 40 ... 90 50 ... 90 40* ... 90 40* ... 90
of %
Combined Cycle Power Plant (CCGT) Hard coal
800 Minimum load
Max capacity ~2 x 440 MW Max capacity ~800 MW
in % of 40 / 25 / 15 60 / 40 / 20 50 / 40 / 30 * 50 / 40 / 20*
Lignite fired power plants Min capacity ~520*/260** MW Min capacity ~210 MW
nominal capacity
Max ramp rate +/-36 MW/min Max ramp rate +/-20 MW/min
600
Combined Cycle Ramp-up time
Power Plant (CCGT) *in two
hours (h),operation
boiler 3/2/1 6/4/2 1,5 / 1 / 0,5FAC TS A N D FI G U R ES EL E C T R I C I T Y G EN ER AT I O N 2017 l 2018
NUCLEAR POWER – CONTINUED EXPANSION WORLDWIDE
I n 2016, electricity generation from nuclear power was around 2,477 bil-
lion kWh worldwide and slightly above the 2015 figure of about 2,441 bil-
lion kWh. The nuclear-based generation is mainly determined by the shut-
Electricity generation from nuclear power worldwide
100 3,000
downs of Japanese nuclear power plants following the Fukushima event and Electricity generation from nuclear power plants in billion (109) kWh
the political decision in Germany to shut down – first temporarily and then 2,500
permanently – 8 nuclear power plant units. The share of nuclear power in Availability in %
worldwide electricity generation has been roughly at some 11 %. The EU is
Others 2,000
the leading economic area worldwide in nuclear energy production with 14
countries operating nuclear power plants and a production of about 820 bil- Japan
50 1,500
lion kWh.
Since the first commercial nuclear power plant was commissioned in Calder USA
Hall in the United Kingdom in 1956, around 75,310 billion kWh of elec- 1,000
tricity have been produced on a cumulated basis. This corresponds to about
three times the current annual global electricity demand. The growth of 500
EU
nuclear electricity generation in the 1980s is remarkable. During that time,
large power plant projects with unit outputs in excess of 1,000 MW, which 0 0
had been launched in the 1970s due to the pressure of the first oil price 1956 1960 1970 1980 1990 2000 2010
Year
crisis, went into operation and provided considerable generation capacity.
Today, the operation of nuclear power plants is characterised by high avail-
ability with a worldwide average of nearly 80 %. Source: atw – Int. Journal for Nuclear Power 5/2017NUCLEAR POWER: PLANTS, PLANNED SHUTDOWNS, NEW PLANTS AND PROJECTS
USA
France 58 - 2 + 1
99 + 4 + 18 4 +1 +2
4+2
Finland
Hungary
C urrently 450 nuclear power plants with a
total capacity of 421,461 MW are being op-
erated worldwide in 31 countries: another 58
Japan 43 + 2 - 5 37 + 20 + 32 China plants are under construction, while roughly 200
United Kingdom 15 + 10 3 +1 Argentin
plants are being planned or pre-planned to be
Russia 35 + 7 + 16 2 +1 + 4 Brazil
commissioned by 2030 (state December 2016).
Canada 19 + 7 2+2 Mexico
Germany 8 -8 4 +3+2
Following the Japanese events of March 11,
Pakistan
South Korea 25 + 3 + 12 2 South Africa
2011, new built plans were abandoned in Italy
India 22 + 5 + 8 Nuclear power plants worldwide 1-1+1 Armenia
and Switzerland only. This does not apply to the
Ukraine 15 + 2 in operation 2016: 450 1 The Netherlands plants in e.g. East and South East Europe, Asia,
Sweden 10 2+2 Romania states of the Middle East as well as North and
Spain 7 1+1 Slowenia South America. The impact of the current North-
Belgium 7 1+1 Iran American shale gas boom on local power plant
Taiwan, China 6 +2 +4 + 2 UAE structure as well as plant operation and construc-
+4 Poland
Bulgaria 2 +1
+1 Lithuania
tion of new nuclear power plants cannot be esti-
Slowakia 4 +2+2 mated yet.
+4 Vietnam
Switzerland 5
+4 Turkey Long-term planable perspectives in terms of elec-
Czech Republic 6+2 +2 Belarus
tricity generation costs and nuclear fuel supply
motivate investors to launch new construction
New build: 58 Planned shut-downs: 15 Projects: 200 (including projects in further 14 countries)
programmes.
Sources: IAEA, atw – Int. Journal for Nuclear Power, status: 6/2017
PAG E 16 – 17FAC TS A N D FI G U R ES EL E C T R I C I T Y G EN ER AT I O N 2017 l 2018
MEASURES TO INCREASE THE ROBUSTNESS OF NUCLEAR POWER PLANTS
I n the second half of 2011, the 14 EU member states operating nuclear
power plants as well as Switzerland and the Ukraine checked their nuclear
plants for possible design deficiencies with the scope of the “EU stress test”.
The nuclear supervisory authorities of the Länder
have also confirmed within the framework of the
EU stress test that the German nuclear power plants
All plants passed the test; operation did not have to be interrupted and have no design deficiencies and that the necessary
standstills were not needed. In contrast to the site of Fukushima Daiichi, no precaution against damage required according to
design deficiencies were identified in European nuclear power plants. the Atomic Energy Act has been taken.”
At the 6th Convention on Nuclear Safety, which took place in Vienna from Irrespective of this confirmation, operators carry out additional systematic
March 24 to April 6, 2014, the German Government confirmed again the robustness analyses and derive measures to improve control in case of events
high safety level and robustness achieved by German nuclear power plants beyond design, e.g. :
in 2013: ll Provision of additional emergency diesel sets (in Germany nine sets are
usually available per unit) in case of failing AC supply (“station
“Both the results of the EU stress test and the national blackout”),
reviews showed that the German nuclear installations ll Larger diesel reserves which last up to seven days by improved fuel
in the sense of the Convention have safety management on the basis of secure fuel stocks in case emergency power
margins (a high degree of robustness), some of them is needed for an extended period,
even to a considerable degree. This is also due to the ll Third redundancy for water feeding to fuel element storage ponds via a
precautionary and upgrading measures that have fixed device to guarantee cooling of ponds,
been continuously implemented in the past for ll Provision of mobile feeding pumps for steam generators and
additional safety improvement. ll Introduction and implementation of “severe accident management
guidelines”.Plant-specific measures to increase protection of plants against external im-
pacts (earth quake, flooding, volcanic eruptions, extreme weather phenom-
ena, airplane crash) are being taken in nuclear power plants all over the
world. Besides, filtered containment venting systems, hydrogen recombin-
ers, emergency control rooms and crisis centres are also being set up. These
measures had already been standard in German nuclear power plants before
the Fukushima accident.
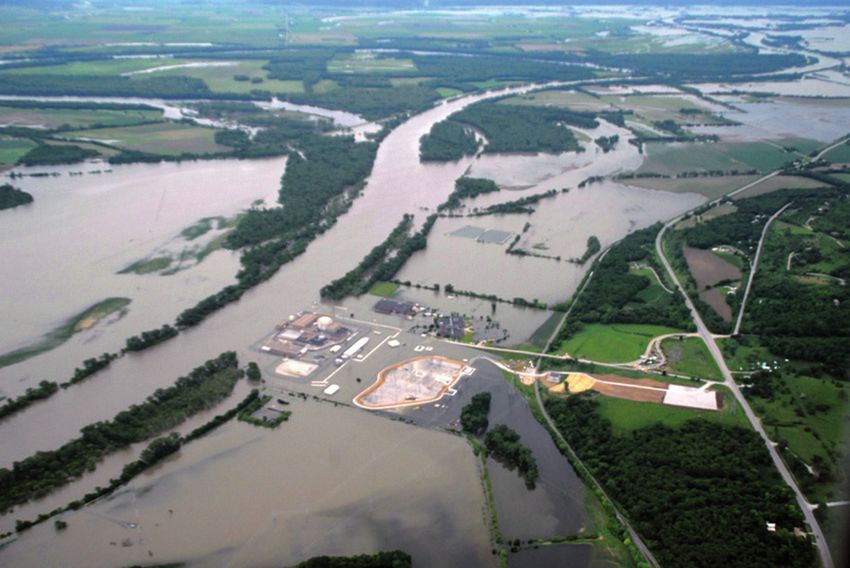
The US Fort Calhoun nuclear power plant is an excellent example for a
plant of robust design against natural external impact like flooding: The
pressurised water reactor is located in the US Federal State of Nebraska at
the river Missouri. The plant has a nominal capacity of 476 MW. In June
2011, the plant had to deal with flooding for several weeks and was able to
cope with the situation thanks to a flooding protection system that had
been installed by the beginning of 2011 according to a recommendation of
the US supervisory authority United States Nuclear Regulatory Commis-
sion (NRC) in 2010 after having assessed the plant´s protection measures.
The plant was taken off the grid during flooding for precautionary reasons.
Despite breaking of an additional mobile flood barrier, the plant had not
In June 2011, the Fort Calhoun nuclear power plant, located in the US Federal State of Nebraska at
been at danger at any time without any accident potential. the river Missouri, had to deal with flooding for several weeks.
Source: U.S. Army Corps of Engineer 4/2013
PAG E 18 – 19FAC TS A N D FI G U R ES EL E C T R I C I T Y G EN ER AT I O N 2017 l 2018
NEW POWER GENERATION CAPACITIES REQUIRED
F or more than two decades, European electricity generation has been in-
vesting predominantly in renewable energy sources and gas-fired power
plants, whereas in the 1970s and 1980s, investments focused on conven-
The future of today´s electricity generating capacities in operation
1,000
tional coal-fired and nuclear power plants. This structural change is above all Other
the result of various financial support systems for renewables in the indi- Geothermal
Capacity in operation in GW*
vidual European countries. 800
Hydro
Conventional power plants in Europe, mainly coal-fired and nuclear power Photovoltaic
plants, have therefore now reached a technical age at which future decom- Waste
600
missioning is foreseeable. The typical technical lifetimes of coal-fired power Peat
plants are about 40 years, those of nuclear power plants about 60 to 80 Biomass
years, and those of hydroelectric power plants about 100 years. In addition, 400 Wind, offshore
it is also foreseeable that in the coming years, renewables capacities will
Wind, onshore
increasingly reach the end of their technical operating life; the service life of
Nuclear
wind power and photovoltaic systems is considered to be 20 to 30 years. 200
Based on typical service life data and individual political decisions (e.g. Oil
phasing out nuclear power in Germany by 2022), it can be estimated that Lignite
by the year 2030 around 30 % of the electricity generation capacities cur- 0 Hard coal
rently in operation in Europe will be decommissioned. By 2050, this figure 2015 2025 2035 2045 2050
Year
will be around 80 %. * ˝Mortality“, Base: Capacities in operation end of 2014
This estimate makes it clear that with today‘s time horizons for planning,
construction and commissioning of power generation plants of 10 years and
more, suitable replacement capacities for a secure electricity supply will
have to be prepared in good time – now. Source: Investment Requirements in the EU electricity sector up to 2050
Chalmers University of Technology, Department of Energy and Environment, Energy TechnologyPLANNED AND ANNOUNCED NEW CONSTRUCTION PROJECTS IN EUROPE
T he need to replace existing power generation capacities in Europe has
led many companies to plan new construction projects. Despite the
massive expansion of energy from renewables, coal, natural gas and nuclear
Projected and announced power plant capacities in Europe
energy continue to be the most important primary energy sources for reliable Share of energy source 2017 Gas (43,740 MW, 30.19 %)
available power generation. Highly efficient new plants are replacing less Oil (0 MW, 0 %)*
efficient power plants. In addition to a significant reduction in CO2 emis-
sions, new power plants will also reduce further emissions and their increased Hard coal (17,450 MW, 12.18 %)
flexibility will contribute to a secure electricity supply and the integration of Lignite and peat (2,260 MW, 1.48 %)
renewable energy into the supply system. However, due to a lack of long-
Nuclear (25,580 MW, 16.79 %)
term political framework conditions across Europe, investment in new ca-
pacities is stalled. Hydro (11,645 MW, 9.28 %)
According to the updated VGB PowerTech new construction statistics, the
Wind (44,617 MW, 29.13 %)
{
technology of gas-fired power plants accounts for the largest share of the
available capacity of conventional plants at around 30 % (approximately Biomass
(391 MW, 0.26 %)
43,740 MW). With a share of approx. 17 % (25.580 MW) these are fol- Residues and waste
lowed by nuclear power plant projects, particularly in Eastern European (120 MW, 0.08 %)
countries. The new construction projects for power plants fired by hard coal Other renewables
and lignite are in third place with a combined share of around 13 % Total: 152,346 MW (120 MW, 0.07 %)
(19,710 MW) of the total capacity.
Projects based on non-schedulable generation technologies continue to fo-
cus on wind power plants with a capacity share of approx. 29 % * without photovoltaic, oil: no projects. Source: Data base VGB, state: 9/2017
(44,617 MW).
SEI T E 20 – 21FAC TS A N D FI G U R ES EL E C T R I C I T Y G EN ER AT I O N 2017 l 2018
DIRECTIVE ON NATIONAL EMISSION CEILINGS
T he EU Directive on National Emission Ceilings (2001/81/EC), or
NEC directive, sets national emission limits for the five air pollutants
sulphur dioxide (SO2), nitrogen oxides (NOx), ammonia (NH3), particulate
The reduction targets for the EU and the EU member states for the period
2020/2029 and from 2030 on-wards are presented in the table (reference
year = 2005).
matter (PM2.5) and volatile organic compounds other than methane (NM- The emission savings achieved in the electricity sector in Germany by 2013
VOC), until 2019. clearly show that the targets for 2020 can be achieved.
A revision of the NEC Directive (new NERC: National Emission Reduc- The upgrading of the plants in the area of power generation has made a
tion Commitment) by the year 2030 was formally confirmed by agreement considerable contribution to this positive interim result. Based on the de-
between the European institutions of the Commission, Council and Parlia- velopment of emissions from thermal power plants in Europe, it can be seen
ment, at the end of 2016. The new NERC Directive contains percentage that a continuous reduction has been achieved since 2005. This is attribut-
reductions compared to the reference year 2005. able to efficiency gains and improvements in flue gas treatment at existing
EU Member States have to ensure compliance with the ceilings through power plants, as well as to the replacement of capacity by new build plants.
national action plans. Looking at the sectors with the highest emissions, Further emission reductions will follow with the adoption of the Large
road transport, for example, it is unlikely to achieve significant reductions Combustion Plants (Best Available Techniques Reference) LCP-BREF
in emissions over the next few years. In this way, attempts are being made document in 2017. The document describes the current state of the art for
to require and realize significantly higher reductions in the area of power large combustion plants and specifies Best Available Techniques – Associ-
generation. The implementation of the NERC Directive will therefore ated Emission Levels (BAT-AEL) for various pollutants. In the national
mainly affect power plants for electricity generation. implementation, which must take place within four years of the publication
of the conclusions, i.e. by 2022, the emission limit values must be incorpo-
rated in national law to ensure compliance with these ranges.EU reduction targets for SO2, NOx and volatile organic compounds (NMVOC)
for the period 2020/2029 and from 2030 (reference year = 2005). Reduction of important emissions from thermal power plants
Reduction SO2 2020/2029 NOx 2020/2029 NMVOC 2020/2029 in public electricity and heat supply in Europe (32 countries)
Region and from 2030 and from 2030 and from 2030
Belgium 43 % 66 % 41 % 59 % 21 % 35 %
120
Bulgaria 78 % 88 % 41 % 58 % 21 % 42 % NOx PM2.5 SOx
Denmark 35 % 59 % 56 % 68 % 35 % 37 %
Germany 21 % 58 % 39 % 65 % 13 % 28 %
Estonia 32 % 68 % 18 % 30 % 10 % 28 % 100
Finland 30 % 34 % 35 % 47 % 35 % 48 %
France 55 % 77 % 50 % 69 % 43 % 52 %
Emissions in % (2005 = 100 %)
Greece 74 % 88 % 31 % 55 % 54 % 62 %
United Kingdom 59 % 88 % 55 % 73 % 32 % 39 %
80
Ireland 65 % 85 % 49 % 69 % 25 % 32 %
Italy 35 % 71 % 40 % 65 % 35 % 46 %
Croatia 55 % 83 % 31 % 57 % 34 % 48 %
Latvia 8% 46 % 32 % 34 % 27 % 38 %
Lithuania 55 % 60 % 48 % 51 % 32 % 47 % 60
Luxembourg 34 % 50 % 43 % 83 % 29 % 42 %
Malta 77 % 95 % 42 % 79 % 23 % 27 %
The Netherlands 28 % 53 % 45 % 61 % 8% 15 %
Austria 26 % 41 % 37 % 69 % 21 % 36 % 40
Poland 59 % 72 % 30 % 39 % 25 % 26 %
Portugal 63 % 83 % 36 % 63 % 18 % 38 %
Romania 77 % 88 % 45 % 60 % 25 % 45 %
Sweden 22 % 22 % 36 % 66 % 25 % 36 %
57 % 82 % 36 % 50 % 18 % 32 % 20
Slovakia
Slovenia 63 % 92 % 39 % 65 % 23 % 53 %
Spain 67 % 88 % 41 % 62 % 22 % 39 %
Czech Republic 45 % 66 % 35 % 64 % 18 % 50 %
Hungary 46 % 73 % 34 % 66 % 30 % 58 % 0
Cyprus 83 % 93 % 44 % 55 % 45 % 50 % 2005 2006 2007 2008 2009 2010 2011 2012 2013 2014
EU-28 total 59 % 78 % 42 % 62 % 28 % 40 % Year
Source: EU Commission Source: EEA (European Environment Agency) 2016
PAG E 22 – 23FAC TS A N D FI G U R ES EL E C T R I C I T Y G EN ER AT I O N 2017 l 2018
CLIMATE POLICY: GLOBAL APPROACH NEEDED
Between 1990 and 2014, the total greenhouse gas emissions (GHGE) in the Current Policies New Policies 450 Scenario
European Union (EU-28) decreased by 20 % (World Bank, state: 2016). At in billion tce
the beginning of 2014, the EU announced new targets for the climate and
2014
2020
2040
2020
2040
2020
2040
energy policy which are to be met by 2030. Compared to the 1990 reference
values, GHGE are to be reduced by 40 % in order to support the global
target of limiting global warming to less than 2 °C. By 2050, GHGE are to Coal 5,609 5,787 7,610 5,580 5,914 5,174 2,857
be reduced by 80 to 95 %. It is also planned to raise the annual upper limit Oil 6,037 6,497 7,717 6,391 6,821 6,207 4,751
(cap) of GHGE from currently 1.74 to 2.2 % for the post-2020 period.
Natural gas 4,133 4,563 6,740 4,487 6,161 4,480 4,716
For the stabilisation and actual reduction of GHGE emissions, action, based
Nuclear 946 1,133 1,474 1,137 1,687 1,164 2,271
on the principle of effectiveness and cost efficiency, has to be taken world-
wide. Cost-efficient measures such as insulation of buildings, fossil-fired Hydro 479 536 736 539 766 540 847
power plants with higher efficiencies, expanded use of renewables or further Biomass 2,030 2,200 2,620 2,204 2,690 2,214 3,300
use of technologies with low GHGE like nuclear energy must be applied with Other 259 456 1,156 0 1,481 513 2,513
priority and without prejudice in order to mitigate the globally increasing renewables
amount of GHGE. Total 19,549 21,170 28,051 20,823 25,523 20,291 21,254
The International Energy Agency (IEA) developed a stabilisation concept Share of 60 % 63 % 70 % 63 % 70 % 63 % 68 %
which is to stabilise GHGE at a value of 450 ppm CO2 in the atmosphere non-OECD
countries
(“450 Scenario”) through a bundle of measures in comparison to the refer-
ence scenario (“Current Policies”). IEA stabilisation concept. Share of the energy sources.
Source: IEA, World Energy Outlook 2016CO2 emissions total and per capita from fossil fuel combustion CO2 emissions from different power plants
for selected regions for 2014 and changes from 1990 to 2012 in g CO2 equivalent per kWh,
calculated for the life cycle of the power plant
t CO2 per capita billion (109) t CO2 per year
BoA technology
Region 0 1 2 3 4 5 6 20
Change Lignite 950 to 1,230
EU-28 6.4
- 20 % 3,241 790 to 1,080
Hard coal
India 1,7
+ 260 % 2,234 Oil 890
USA 16.5
+4 % 5,074 Natural gas 640
143 Gas
China 7.5 combined 410 to 430 Electricity generation with CCS
+ 321 % 10,251 cycle
127 Photovoltaik 35 to 160
World 4.97
+ 75 % 35,837
Nuclear 16 to 23
0 1 2 3 4 5 6 30 8 to 16 Result range due to different
Wind
methods of calculation
Hydro power 4 to 13 and different site implications.
Sources: IEA, World Bank 2017 Sources: PSI Paul Scherrer Institut/Switzerland, ESU-services, VGB (own calculations)
PAG E 24 – 25FAC TS A N D FI G U R ES EL E C T R I C I T Y G EN ER AT I O N 2017 l 2018
VGB POWERTECH E.V.
VGB PowerTech e.V. is the international technical association for generation Structure of the VGB membership:
and storage of power and heat with head office located in Essen (Germany).
Currently VGB has 452 members, comprising operators, manufacturers, and Fossil-fired power plants 238,500 MW
institutions connected with energy engineering. Nuclear power plants 117,500 MW
Our members come from 33 countries and represent an installed power plant Hydro power plants and other renewables 77,000 MW
capacity of 433,000 MW located in Europe. Total 433,000 MW
The activities of VGB PowerTech comprise: EU: 429 members in 20 countries
ll Provision of an international platform for the accumulation, exchange, Austria, Belgium, Croatia, Czech Republic, Denmark, Finland,
and transfer of technical know-how. France, Germany, Greece, Ireland, Italy, Latvia, Luxembourg,
ll Acting as “gate-keeper” and provider of technical know-how for the The Netherlands, Poland, Portugal, Romania, Slovenia, Spain, Sweden
member companies and other associations of our industry.
ll Harmonisation of technical and operational standards.
ll Identification and organisation of joint R&D activities. Other Europe: 11 members in 3 countries
ll Exclusive member access to qualified expert knowledge. Russia, Switzerland, Turkey
ll Representation of members´ interests.
Outside Europe: 12 members in 10 countries
VGB is performing these tasks in close cooperation with EURELECTRIC
Argentina, Australia, China, Japan, Malaysia,
on European-level and further national and international associations.
Mongolia, Morocco, Saudi Arabia, South Africa, USA
Total: 452 members in 33 countriesTASKS OF THE INTERNATIONAL
TECHNICAL ASSOCIATION VGB POWERTECH
General Assembly
VGB PowerTech e. V. supports its members with all technical
issues of generation and storage of electricity and heat in Board Technical Advisory
order to further optimise Scientific Advisory Board Board
of Directors
ll Safety
ll Efficiency Management
ll Environmental friendliness
ll Economic efficiency and Competence Areas for the Generation and Storage of Power and Heat
ll Occupational safety and health protection
Nuclear Renewables Environmental
Power Plant Technology, Technical
The competence areas “Nuclear Power Plants”, “Power Plant Power and Distributed Chemistry, Safe-
Technologies Generation Services
Plants ty and Health
Technologies”, “Renewables and Distributed Generation”,
and “Environmental Technology, Chemistry, Safety and
Health” are dealing with all aspects of nuclear, conventional
and renewable generation. They are cooperating closely to
fully exploit the synergies.
The engineering services of the “Technical Services”, the
VGB Research Foundation, data bases, and publications. e.g.
the technical journal VGB POWERTECH perfectly round
off the portfolio of expertise of VGB PowerTech. VGB Committees
PAG E 26 – 27VGB PowerTech e.V. Editorial: Erland Christensen (responsible),
Deilbachtal 173 Mario Bachhiesl, Ludger Mohrbach, Oliver Then and
45257 Essen · Germany Christopher Weßelmann
October 2017
Phone: +49 201 8128 – 0 www.vgb.org · info@vgb.org
Fax: +49 201 8128 – 302You can also read


