THE EFFECTIVENESS OF DIFFERENT HEATING SYSTEMS IN NEW ZEALAND HOUSEHOLDS - DIVA
←
→
Page content transcription
If your browser does not render page correctly, please read the page content below
The effectiveness of different heating
systems in New Zealand households
A study of energy performance by IDA Indoor Climate
and Energy

Julia Flink
Autumn 2015-11-18
Bachelor thesis in Energy Technologies, 15 credits
Bachelor of Science Programme in Energy Engineering, 180 Credits
Supervisor: Mark Murphy
PREFACE
This Bachelor Thesis is a final assessment in the Bachelor Program Energy Technology at
Umea University in Sweden. I have chosen to do my bachelor thesis in New Plymouth, New
Zealand as collaboration between Powerco, Umea University and myself.

The Bachelor thesis consists of a research project performed for the distribution company
Powerco in New Plymouth during autumn 2015.

I would like to thank my supervisor Daniel Gnoth at Powerco for giving me the opportunity to
do my thesis at Powerco in New Plymouth and for making this project possible. I also want to
thank my supervisor Mark Murphy for support regarding the program IDA ICE.

Julia Flink, November 18th 2015

 I
ABSTRACT
The energy demand is a complex issue for householders in New Zealand, since a large
number of dwellings were built before energy efficiency regulation came into force in 1979.
To heat the average New Zealand home takes a lot of energy, and therefore many
householders choose to limit their heating space.

Powerco, New Zealand’s second-largest distribution company is conducting a two-year study,
called Powering tomorrow’s homes. The project aims to uncover opportunities to shift peak
loads on Powerco’s electricity network, by using a range of networks surveys. The dwellings
that have been chosen to contribute to this study have gone through a large retrofit in 2014.

This study has been limited to verifying the effectiveness of three different heating systems,
within three houses in New Zealand. It has been based on global data such as climate,
temperature, humidity, design of the house and the family’s different behavioural patterns.

Three case models have been established in the program IDA ICE, to simulate and calculate
the amount of used and delivered energy for space heating. Thereafter four main energy
simulations were conducted to study the heating system before the intervention, after the
intervention and a trial to see which heating system that is best suitable for each house. The
new settings together with the original heating systems were also calculated. The simulations
are also limited to summer respective winter because the heating systems are used differently
depending on season. Data of location and climate files have been limited to Auckland and
Wellington.

The results show that the most energy efficient heating system for dwelling A is the heat
pump and infrared panel it uses today and for dwelling C its dwelling A’s heating system.
Data demonstrate that the most effective heating system for dwelling B varies depending on
climate, showing that dwelling C’s gas heating is more efficient for a warmer humid climate
in Auckland and that dwelling A’s heat pump is better for a colder climate in Wellington.
Comparison between the new settings and the old heating system (two radiators) shows that
dwelling A’s new heating system (infrared panel & a heat pump), requires less delivered
energy than the old heating system. Dwellings B’s new heating system (gas fire, an infrared
panel & a radiator) is the most effective in Auckland however the old heating system (an air
source heat pump, oiled-filled radiators & a gas wall heater) is the most energy efficient in
Wellington. Dwelling C’s new heating system (gas central heating & a gas fire) has a lower
delivered energy than the old heating system (gas fire, two heat pumps, radiators and heating
panels) for summer in Auckland, while it has a higher delivered energy for winter in both
Wellington and Auckland, and also summer in Wellington.

In conclusion, the new heating systems deliver warmer, more comfortable dwellings for less
delivered energy than the previous. This presents an opportunity for Powerco to use newer gas
heating to curb electricity load, and also shows the opportunity to use heat pumps to reduce
peak demand through increased energy efficiency.

KEYWORDS: Dwellings, Energy efficiency, Heating system, Powerco, New Zealand

 II

TABLE OF CONTENTS

1. INTRODUCTION .............................................................................................................................................. 1
 1.1 BACKGROUND .................................................................................................................................. 1
 1.2 PURPOSE AND OBJECTVE ................................................................................................................ 1
 1.3 OUTLINE............................................................................................................................................. 1
 1.4 RESEARCH QUESTIONS ............................................................................................................... 2
 1.5 SCOPE AND LIMITATIONS .............................................................................................................. 2
2. LITERATURE REVIEW .................................................................................................................................. 2
 2.1 IDA INDOOR CLIMATE AND ENERGY ........................................................................................... 2
 2.2 THE ENERGY BALANCE .................................................................................................................. 3
 2.2.1 HEAT TRANSPORT IN A STRUCTURE ...................................................................................... 4
 2.3 HEATING SYSTEM ............................................................................................................................ 6
 2.3.1 GAS FIRE ........................................................................................................................................ 6
 2.3.2 AIR SOURCE HEAT PUMP ............................................................................................................. 6
 2.3.3 INFRARED PANEL ...................................................................................................................... 7
 2.3.4 RADIATOR .................................................................................................................................. 8
 2.3.5 GAS CENTRAL HEATING .......................................................................................................... 8
3. METHOD .......................................................................................................................................................... 10
 3.1 DWELLING A .................................................................................................................................. 10
 3.1.1 3D CONSTRUCTION OF DWELLING A .................................................................................... 11
 3.1.2 HEATING SYSTEM ....................................................................................................................12
 3.1.3 AIR HANDLING UNIT ...............................................................................................................13
 3.1.4 PLANT ........................................................................................................................................14
 3.1.5 THE INDOOR CLIMATE ............................................................................................................14
 3.1.6 DEFAULTS ................................................................................................................................. 15
 3.1.7 SCHEDULE OF OCCUPANTS .................................................................................................... 17
 3.1.8 HOLIDAYS ................................................................................................................................. 17
 3.1.9 THERMAL BRIDGES ................................................................................................................. 17
 3.1.10 SITE SHADING AND ORIENTATION ..................................................................................... 18
 3.1.11 EXTRA ENERGY AND LOSSES .............................................................................................. 18
 3.1.12 GROUND PROPERTIES ........................................................................................................... 18
 3.2 DWELLING B ....................................................................................................................................19
 3.2.1 3D CONSTRUCTION OF DWELLING B ................................................................................... 20
 3.2.2 HEATING SYSTEM ....................................................................................................................21
 3.2.3 AIR HANDLING UNIT .............................................................................................................. 22
 3.2.4 PLANT ....................................................................................................................................... 23
 3.2.5 INDOOR CLIMATE ................................................................................................................... 23
 3.2.6 DEFAULTS ................................................................................................................................ 25
 3.2.7 SCHEDULE OF OCCUPANTS ................................................................................................... 25
 3.2.8 HOLIDAYS ................................................................................................................................ 26
 3.2.9 THERMAL BRIDGES ................................................................................................................ 26
 3.2.10 SITE SHADING AND ORIENTATION ..................................................................................... 26
 3.2.11 EXTRA ENERGY AND LOSSES .............................................................................................. 26
 3.2.12 GROUND PROPERTIES ........................................................................................................... 26
 3.3 DWELLING C ................................................................................................................................... 27
 3.3.1 3D CONSTRUCTION OF DWELLING C ................................................................................... 28
 3.3.2 HEATING SYSTEM ................................................................................................................... 29
 3.3.3 AIR HANDLING UNIT ...............................................................................................................31
 3.3.4 PLANT ........................................................................................................................................31
 3.3.5 THE INDOORCLIMATE .............................................................................................................31
 3.3.6 DEFAULTS ................................................................................................................................ 33
 3.3.7 SCHEDULE OF OCCUPANTS ................................................................................................... 34

 III
3.3.8 HOLIDAYS ................................................................................................................................ 34
 3.3.9 THERMAL BRIDGES ................................................................................................................ 34
 3.3.10 SITE SHADING AND ORIENTATION ..................................................................................... 34
 3.3.11 EXTRA ENERGY AND LOSSES .............................................................................................. 35
 3.3.12 GROUND PROPERTIES ........................................................................................................... 35
4. WEATHER DATA & SIMULATIONS ......................................................................................................... 36
 4.1 PERFORMANCES OF SIMULATIONS ............................................................................................ 36
5. RESULT AND ANALYSIS ............................................................................................................................. 37
 5.1 AFTER INTERVENTION.................................................................................................................. 37
 5.2 NEW SETTINGS WITH ORIGINAL HEATING SYSTEM ................................................................ 40
 5.3 COMPARISON OF HEATING SYSTEMS IN DIFFERENT BUILDINGS ...........................................41
 5.3 BEFORE INTERVENTION ............................................................................................................... 43
6. DISCUSSION .................................................................................................................................................... 45
7. CONCLUSION ................................................................................................................................................. 48
8. FURTHER WORK ........................................................................................................................................... 49

LIST OF FIGURES
Figure 1 Gas fire B-vent [8] ........................................................................................................................... 6
Figure 2 Non-ducted ASHP [12] .................................................................................................................... 7
Figure 3 Range of electromagnetic spectrum [14] ............................................................................................ 8
Figure 4 Dwelling A-Tauranga [19] .............................................................................................................. 10
Figure 5 Case model of dwelling A................................................................................................................ 11
Figure 6 Dwelling A – Division of zones ....................................................................................................... 11
Figure 7 Ventilation system in dwelling A [23] ..............................................................................................13
Figure 8 Dwelling B- New Plymouth [32] ......................................................................................................19
Figure 9 Case model of dwelling B ............................................................................................................... 20
Figure 10 Dwelling B- Division of zones ...................................................................................................... 20
Figure 11 Dwelling C – Wellington [32] ....................................................................................................... 27
Figure 12 Case model of dwelling C ............................................................................................................. 28
Figure 13.Dwelling C- Ground floor + First floor .......................................................................................... 28
Figure 14 Result-After intervention summer ................................................................................................. 37
Figure 15 Result-After intervention winter .................................................................................................... 39
Figure 16 Result- New defaults with original heating-system ......................................................................... 40
Figure 17 Dwelling A with B & C’s heating system .......................................................................................41
Figure 18 Dwelling B with A & C’s heating system .......................................................................................41
Figure 19 Dwelling C with A & B’s heating system ..................................................................................... 42
Figure 20 Result- Before intervention ........................................................................................................... 43
Figure 21 Result-Energy difference between before and after intervention ...................................................... 44

LIST OF TABLES
Table 1 Available areas of dwelling A ...........................................................................................................12
Table 2 Indoor climate-After intervention dwelling A ..................................................................................... 15
Table 3 Indoor climate- Before intervention dwelling A ................................................................................. 15
Table 4 Elements of construction- Dwelling A ...............................................................................................16
Table 5 Schedule of occupants-Before intervention dwelling A ....................................................................... 17
Table 6 Schedule of occupants- After intervention dwelling A ........................................................................ 17
Table 7 Available areas in dwelling B ............................................................................................................21
Table 8 Indoor climate- After intervention dwelling B ................................................................................... 24
Table 9 Indoor climate- Before intervention dwelling B ................................................................................. 24
Table 10 Element of construction- Dwelling B .............................................................................................. 25
Table 11 Schedule of occupants- Before intervention dwelling B ................................................................... 26
Table 12 Schedule of occupants- After intervention dwelling B ..................................................................... 26

 IV
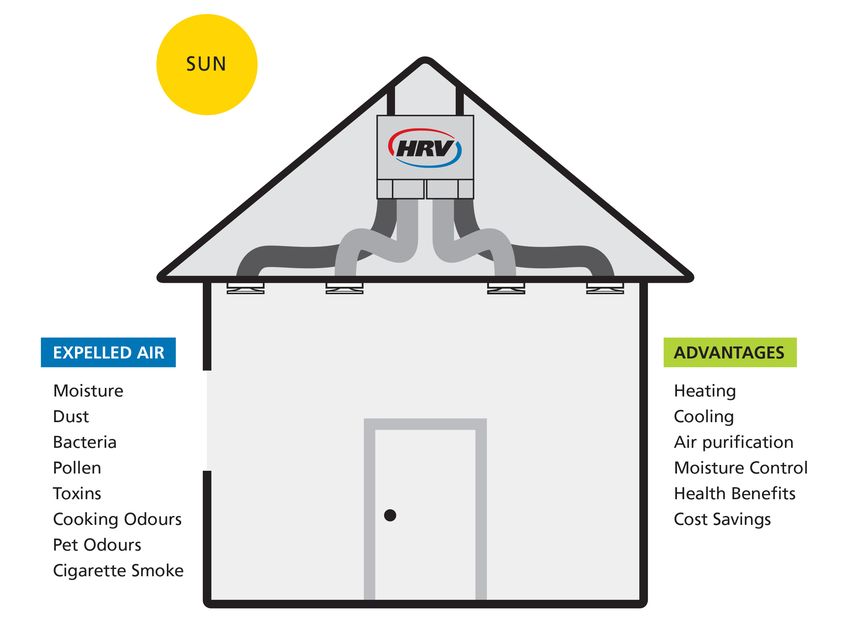
Table 13 available areas in dwelling C .......................................................................................................... 29
Table 14 Indoor climate-After intervention dwelling C .................................................................................. 32
Table 15 Indoor climate- Before intervention dwelling C ............................................................................... 32
Table 16 Elements of construction -Dwelling C ............................................................................................ 33
Table 17 Schedule of occupants-Before intervention dwelling C .................................................................... 34
Table 18 Schedule of occupants-After intervention dwelling C ...................................................................... 34
Table 19 Daily average temperatures ............................................................................................................ 36

 V
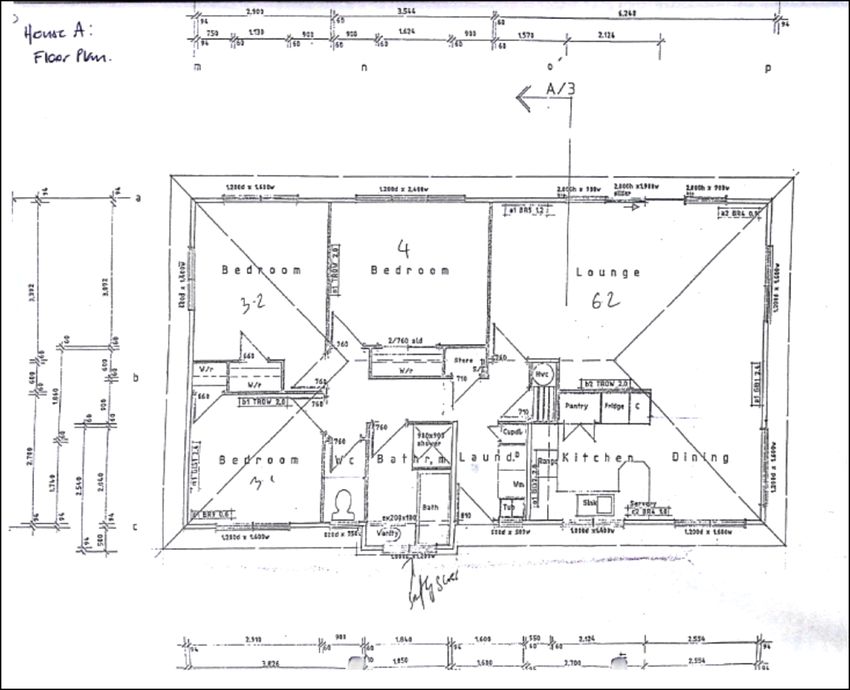
APPENDICES

A1. Monthly and daily hot- water consumption
A2. Energy consumption dwelling A
A3. Energy consumption dwelling B
A4. Energy consumption dwelling C
A5. Schedule of doors and windows
A6. Defaults
A7. Floor plans

 VI
NOMENCLAUTURE

Designation Symbol Unit
Effect P [W]
Area A [m2]
Thermal conductivity U-value [W/m2K]

Celsius degrees g [°C]
Thermal resistance R-value [m2*K]
Volume V [m3]

Frequency f [Hz]
Voltage E [V]

ABREVIATIONS
COP: Coefficient of performance

ASHP: Air source heat pump

VAV: Variable ventilation air flows

IFC: Digital data file

BIM: Building information model

LPG: liquid petroleum gas

 VII

1. INTRODUCTION
1.1 BACKGROUND
The energy demand is a complex issue for householders in New Zealand, since a large
amount of dwellings were built before energy efficiency regulation came into force in 1979
[1]. According to IEA report 1995, New Zealand had the lowest space heating intensity
(measured as energy per square meter per degree day of all countries studied) [2].

To heat the average New Zealand home takes a large amount of energy (approximately 11.4
kWh/year of which space heating stands for 34%) and therefore numerous of the householders
choose to limit their heating to a single room in the house [3]. With reference to the New
Zealand Energy and Strategy (2011-2021) many householders want to do adjustments and
invest in new technology to improve their homes, but lack the capital and understanding [4].

 Powerco, New Zealand’s second-largest distribution company is conducting in a two-year
study, called Powering tomorrow’s homes. The project aims to uncover opportunities to shift
peak loads on Powerco’s electricity network, by using a range of networks surveys. The
program consists of three smart houses, all located on the North island of New Zealand.
Homes in Tauranga, New Plymouth and Wellington have been selected to participate in this
programme.

The purpose of this program is to gain knowledge and understanding of the network impacts
from consumer responses to future price structures (such as peak or time of use pricing). The
trial therefore invested in smarter heating technology as well as insulation, smarter
electronics/appliances and PV. The program then included extensive monitoring of electricity,
gas and water use and other conditions i.e. temperature and humidity over a two-year period.

The dwellings underwent substantial technology and retrofit. The households were also found
to be somewhat represented of national energy cultures as energy easy, energy extravagant
and energy efficient [5].

1.2 PURPOSE AND OBJECTVE
The aim of this study is to analyse the effectiveness of different heating systems to shift
energy use during peak times within three houses in New Zealand. The different heating
methods were compared according to how much delivered-and used energy each heating
systems require to heat the dwellings, including heat retention. The study was based on global
data such as climate, temperature and humidity. It will also be based on the design of the
house and behavioural patterns. This is to determine which space heating system is best
suitable for each house.

1.3 OUTLINE
The first chapter presents a literature review about the simulation tool IDA ICE, information
about the energy balance and the heat transport in a structure. The first chapter also describes
the main principle of each heating systems. This is to establish an understanding and
knowledge of how each heating system works.

Julia Flink
Umea University, Bachelor thesis 15 hp
Bachelor in energy technology
Supervisor: Mark Murphy
 1
The following chapter, the method, is the main chapter in this report. It explains how the three
case models have been constructed, followed by input data for each house. The fourth chapter
contains information about global data and how the simulations have been performed. It is
followed by the results, discussion, conclusion and further work chapters.

1.4 RESEARCH QUESTIONS
 - Which heating system consumes most energy?
 - Which heating system is the most energy efficient at saving delivered and used
 energy, for three “typical” New Zealand households?
 - Has the climate a crucial role in the heating system?
 - How much energy is required to keep the same comfort level as after intervention, in
 combination with the original heating system?
 - How energy effective is the new heating system at saving energy compared to the old
 heating systems?
 - Which heating system is best suitable for each dwelling?

1.5 SCOPE AND LIMITATIONS
This study will be limited to verifying the energy efficiency of three different heating systems,
within three houses in New Zealand. Four main energy calculations and simulations have
been made to study the heating systems before the intervention, after intervention and a trial
to see which heating system is best for each house. The new settings together with the original
heating system have also been calculated. Every simulation and energy calculation will be
based on global data such as climate, temperature and humidity, design of the house and the
family’s’ different behavioural patterns. The simulations are also limited to summer
respective winter because the heating systems are used differently depending on season.

Data of location and climate files are limited to Auckland and Wellington in the program IDA
ICE.

2. LITERATURE REVIEW
This chapter presents a literature review about the simulation tool used in this study and basic
information about each heating system. This is to give the reader a necessary and basic
understanding.

2.1 IDA INDOOR CLIMATE AND ENERGY
IDA Indoor Climate and Energy (IDA ICE) is an innovative simulation tool developed by
EQUA Simulations AB. It’s a dynamic program used to study a building’s energy
consumption and thermal indoor climate [6].

Buildings can be created in the program, or one can import 3D building information model
(BIM) via IFC files. One can construct a building by creating ‘building bodies’ and individual
or multiple zones within the building. Building bodies describes the inner face of the external
walls and the zones encircle the building bodies creating an internal wall [6].

Julia Flink
Umea University, Bachelor thesis 15 hp
Bachelor in energy technology
Supervisor: Mark Murphy
 2
IDA ICE is divided in to three levels, wizard level, standard level and expert level. In this
bachelor thesis the model is defined at standard level, which implies that some settings are
already inserted to the program when opening a new model.

The following text describes some of the signal sources used as input to the control algorithm
in IDA ICE [6]:

 - Used Energy: The energy used by a component/radiator/zone - system’s energy. It will
 normally be reduced by distribution and emission losses before it reaches the occupied
 space.
 - Delivered Energy: The delivered energy is the energy purchased by the household,
 which is shown in the utility bills.
 - Setpoint: The temperature controller for heating and cooling in each zone.
 - Plant: Supply and return water for the model.

2.2 THE ENERGY BALANCE
In order to get a knowledge and understanding of this study, it’s relevant to recognize factors
that affect the heating system as the energy balance.

A building’s energy balance consists of supplied energy as individual heating, solar radiation,
heat from the building's heating system, heat from lighting and household appliances. The
energy balance also includes of abducted energy, which occurs by sewage, ventilation,
leakage and transmission through the building envelope.

An average New Zealand household has annual energy consumption on 11.4 kWh/year,
where approximately 34 % stand for space heating, 29 % water heating, 19 % appliances, 10
% refrigeration and 8% lights [3]. When it comes to the heat losses, 42% is lost through the
roof if there isn’t any insulation in the ceiling, 24% is lost thought the wall and the floor
accounts for around 10% [7].

A building’s power balance:

 !"! = ! + ! (1)

Where:
Q ! − Heat from the active heating system radiators, gas fire etc. [W]
Q ! − Free heat (insolation, heat from occupants, heat from equipment) [W]

 !"! = !"#$% + !"#$ + !" (2)

Where:
Q !"#$% − Transmission losses including thermal bridges in the envelope
Q !"#$ − Ventilation losses
Q !" − Air leakage through the building envelope or the ventilation

Julia Flink
Umea University, Bachelor thesis 15 hp
Bachelor in energy technology
Supervisor: Mark Murphy
 3
The equation for transmission losses !"#$% :

 !"#$% = ! !" !" − !"
= ( ! ! + Ѱ! ! + ! ) !" − !" = !"#$% ( !" − !" ) (3)

Where:
 !
U! − the heat transfer century
 !! !
A − Area m2
 !
Ѱ! − The Thermal conductivity of a linear thermal bridge
 !"
l! − The lenght of heat transfer (thermal bridge)
 !
F!"#$% − Heat loss factor for the transmission
 !

The equation for ventilation losses, when the outside air doesn’t get heated !"#$ :

 !"#$ = ! ( !" − !" ) (4)

Where:
 kg
ρ − Is the density of the air
 m!
 J
c! − ℎ ℎ ℎ
 kgK
 !!
V − ℎ ℎ
 !
T − Temperature [K]

2.2.1 HEAT TRANSPORT IN A STRUCTURE
According to the second law of thermodynamics, heat transfers from parts with a higher
temperature to parts with a lower temperature. This movement of heat occurs by radiation,
convection and conduction. Conduction is when heat is transferred through a material by
contact with another material. Convection on another hand is when air get heated and become
less dense than the surrounding air. The heated air rises upwards while the less dense air and
the cooler air flows downwards. This causes a temperature difference, which also is called
convection. Radiation is when heat is radiated across the air and then absorbed by another
body or material [8].
2.2.1.1 THERMAL RESISTANCE OF A HOMOGENOUS MATERIAL
For a structure divided into different layers of material, the heat resistance (R) is calculated
for the thickness of each layer (d). Thermal resistance describes the layers insulating ability,
and its unit is (m2k/W).

Below are formulas for calculating the thermal resistance, the sum of several layers.
 !
 1 = (5)
 !

 = the individual thickness of the material ( )

Julia Flink
Umea University, Bachelor thesis 15 hp
Bachelor in energy technology
Supervisor: Mark Murphy
 4
 = the material’s thermal conductivity ( ⁄ )

 = ∑ 1 + 2 + 3 + 4 + ⋯ (6)

To calculate the total heat resistance, one must also account the ceiling, walls and floor that
are facing the air. This is a result of radiation and convective heat transfer.

 = 0,13 m K/W -The structures of inner surfaces
 2

 = 0,04 m2K/W-The structures of outer surfaces

 = + ∑ + i (7)

When the heat resistance of the different layers are summarized and a total resistance is
calculated according to equation (3), the heat transfer coefficient is calculated U = (W/m2K).

 !
U=! (8)
 !"#

U-value is defined as the inverse of the total thermal resistance of the structure. The heat flux
Q (W) is obtained by multiplying the U-value, the temperature difference of the air inside and
out, multiplied by the current area.

 = ·A· ( − ) (9)

Julia Flink
Umea University, Bachelor thesis 15 hp
Bachelor in energy technology
Supervisor: Mark Murphy
 5
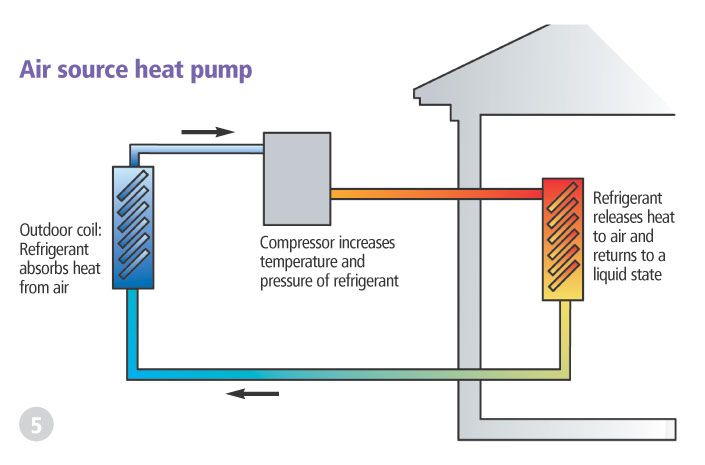
2.3 HEATING SYSTEM
This section gives information about the main principles of the present space heating systems.

2.3.1 GAS FIRE
Gas fires are comparable to traditional fireplaces, but as a replacement for wood, it uses gas.
Gas fireplaces can be driven by natural gas or propane. There are three main types of gas
fireplaces [7]:

 • B-vent fireplaces draw the air from inside and then vent the flames fumes outside the
 house.
 • Ventless gas fireplaces uses air inside the room for combustion, and then it releases all
 heat and exhaust back into the house again.
 • Direct vent fireplace draws the air from outside of the home, and vent it directly out
 through a wall or the ceiling.

The main focus in this bachelor thesis will be on B-vent, also named natural draft gas
fireplaces.
2.2.1.1 MAIN PRINCIPLES
A natural draft gas fireplace often uses a converted traditional chimney or a vent pipe that
runs up from the component and out on the side of the house. Figure 1 below illustrates the
main principles of a B-vent pipe.

The system uses air from the surrounding area to create combustion inside the appliance,
which thereafter creates a natural route for the air and flue gases to go up through the vent-
pipe/ chimney. The walls are heated when the hot gases travel up through the chimney/ vent-
pipe, which provide radiant and convection heat to the house [8].

Figure 1 Gas fire B-vent [8]

2.3.2 AIR SOURCE HEAT PUMP
An air source heat pump (ASHP) extracts heat energy from the air outside and transfers it
inside the house. The main system one can choose is a ducted-heat pump, which heats the
whole house through vents in the ceiling or non-ducted that mainly heats one area of the
Julia Flink
Umea University, Bachelor thesis 15 hp
Bachelor in energy technology
Supervisor: Mark Murphy
 6
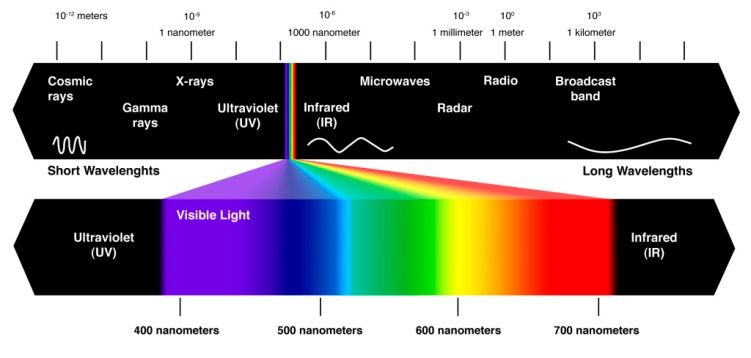
house. One can also choose between split systems, multi-split systems or packaged units [8].
The majority of households in New Zealand have a split system, and the main focus in this
thesis will be on non-ducted split-systems [10].

ASHP can be used for heating and cooling, during winter the system absorbs heat from
outside and releases it inside the building and during summer it work in reverse, extracting
heat from inside and driving it outside [10].

2.3.2.1 MAIN PRINCIPLES
A non-ducted ASHP with split system is usually powered by electricity. It uses a refrigerant
system involving 3 components: an outdoor unit contains the condenser and compressor, and
an indoor unit that contains the air handler. The outdoor system first condenses the air from
vapour into liquid by cooling it, then the compressor increases the pressure and temperature of
the air reducing its volume. Thereafter it continues to the indoor unit, which circulates the air
across the room [11]. Figure 2 shows an image of an air source heat pump.

Figure 2 Non-ducted ASHP [12]

2.3.2.2 EFFICIENCY OF AN AIR SOURCE HEAT PUMP
The efficiency of heating and cooling an air source heat pump is measured by the Coefficient
of Performance (COP). The COP is the relationship between used and delivered energy. It is
an indication of the heat that the air source heat pump can produce for a certain amount of
energy. If the heat pump has a COP on 4, the heat pump produces 4 units of heat energy for
every 1 unit of electricity it consumes [13].

 !!
Coefficient of performance = !!!!!

2.3.3 INFRARED PANEL
An infrared panel converts all the electrical energy into heat. It provides heat by heating the
surrounding surface as walls, floors and ceiling, which is radiated back into to the room.
Infrared is a form of electromagnetic radiation, figure 3 below shows where the range of
electromagnetic spectrum is.

Julia Flink
Umea University, Bachelor thesis 15 hp
Bachelor in energy technology
Supervisor: Mark Murphy
 7
Figure 3 Range of electromagnetic spectrum [14]

There are three types of infrared heaters:

 • Near infrared panels operate at 1300 °C and emit heat radiation between 780 nm to
 1400 nm.
 • Medium infrared panels that’s operated between 1400 nm and 3000 nm, and emit
 temperatures between 500-800 °C
 • Far infrared panels operate in the wavelengths above 3000 nm and emit temperatures
 of 100 °C [15].

This thesis is only looking into far infrared heaters.
2.3.3.1 MAIN PRINCIPLES
Infrared panels send out infrared waves through the air, when the wave reaches a surface its
energy excites the molecules in the object, warming the object [16]. The far infrared heaters
make no visible light; both humans and animals absorb the far infrared because of their 80 %
water composition [14].

2.3.4 RADIATOR
Radiators provide heat by convection and radiation. The three main types are oil- filled
radiators, radiators with electric coil and hot water based radiators [17].

An oil-filled radiator is electrically heated and uses oil as a heat reservoir, rather than a fuel
source. It’s an efficient portable heater providing both radiant and convection heat to spaces
within the house [18].

Radiators with electric coil uses direct electricity to generate power during cold periods. Hot
water based radiators are usually included in a central heating system providing heat from a
lower level. Hot water based radiators are often linked, in a shunt system, which affects how
much delivered heating the radiators will provide. The shunt system allows one to control the
temperature of each room in the dwelling [17].

2.3.5 GAS CENTRAL HEATING
Gas central heating provides heat from a central boiler by transferring warm air through
ducted vents in several rooms of the house, or heated water is piped to radiators through the
house.

The boiler can be powered by natural gas, liquid petroleum gas (LPG), diesel or wood. The
most common type of heat boilers in New Zealand is the gas boiler, because of its
accessibility to natural gas on the north island [19].
Julia Flink
Umea University, Bachelor thesis 15 hp
Bachelor in energy technology
Supervisor: Mark Murphy
 8
2.3.5.1 MAIN PRINCIPLES
When the gas reaches the gas boiler, it goes through a valve and into the sealed combustion
chamber through small jets. Thereafter an electric ignition sets the gas on fire. The system
contains of a heat exchanger that is connected to a water pipe. The heat exchanger receives
the heat energy from the gas jet and heats the water until it reaches a certain level.

The hot water is then transferred to several radiators around the house, which provides heat to
each room [20].

Julia Flink
Umea University, Bachelor thesis 15 hp
Bachelor in energy technology
Supervisor: Mark Murphy
 9
3. METHOD
In order to simulate and calculate the amount of used and delivered energy for space heating,
three case models were established in the simulation tool IDA ICE. This chapter contains
information and data for each house before and after intervention in 2014. The data includes
floors plans, heating system, ventilation system, hot water system, defaults, thermal bridges,
ground properties, energy losses and occupants. The purpose of the description is so the
verification of the model can be performed. Note that some of the defaults information are
already defined in IDA ICE as the standard level was used.

Data and documentation was mainly received from Powerco, sensors inside the dwellings and
by interviewing the householders.

3.1 DWELLING A
Dwelling A is located in Tauranga, on the upper east coast of New Zealand. The house was
built 1998 with additions throughout the Program, 2014. It has an area on 91.96 m2. Dwelling
A has one storey, which includes 3 bedrooms, kitchen, lounge and a bathroom. The heating
system consists of an infrared panel, which is located in one of the bedrooms and an air
source heat pump, which is located in the living room. Unlike other New Zealand houses,
house A heats the whole house with the heat pump, instead of one single room [21].

Before the additions were made, house A had an annual energy consumption of 6102 kWh per
year and today they reduced it to 5693 kWh. The family living in the house consist of a
younger couple and their child. According to the program “Powering tomorrows homes” the
family belong to “value consumer”, which means they are energy efficient when it comes to
energy consumption. A picture of the dwelling A is shown in figure 4.

Figure 4 Dwelling A-Tauranga [19]

Julia Flink
Umea University, Bachelor thesis 15 hp
Bachelor in energy technology
Supervisor: Mark Murphy
 10
3.1.1 3D CONSTRUCTION OF DWELLING A
Figure 5 shows a 3D construction of the dwelling A in IDA ICE with and without cut plane.
The Constructions is based on floor plans with measurement for walls, roof height, doors and
windows. The height of the house is 2.7 m [21]. The floor plan can be found in appendix A6.

Figure 5 Case model of dwelling A

The house consists of 7 rooms, but the case model has been divided in to 8 zones. This is
because a small area of the house protrudes (zone 5). The building is therefore divided into 2
building bodies and into 8 zones to establish the real case building. Figure 6 below shows the
divisions of the zones.

Figure 6 Dwelling A – Division of zones

Julia Flink
Umea University, Bachelor thesis 15 hp
Bachelor in energy technology
Supervisor: Mark Murphy
 11
Table 1 indicates the available area of each zone in dwelling A.
Table 1 Available areas of dwelling A
 Zone Available area [m2] Name of the zone
 1 41.13 Kitchen and lounge
 2 12.86 Bedroom 1 (master)
 3 12.11 Bedroom 2 (spare)
 4 12.54 Laundry and entrance
 5 0.99 Vanity
 6 8.57 Bedroom 3 (child)
 7 2.59 Bathroom
 8 1.14 WC
 Total 91.96

3.1.2 HEATING SYSTEM
This section describes the heating system before and after intervention. The former space
heating system consisted of a hot water based radiator and an oil-filled radiator. The present
heating system includes an infrared panel and an air source heat pump. The air source heat
pump is used for heating the whole house while the infrared panel is used for zone 6 [21].
3.1.2.1 AFTER INTERVENTION
The following section describes the heating system after intervention. The main principles for
each heating system are described in chapter 2.
3.1.2.1.1 AIR SOURCE HEAT PUMP
The air source heat pump is a non-ducted Daikin Split system air conditioner with a maximum
power on 6 kW. It’s mainly used in winter, but also for cold evenings during summer. It’s
located in zone 1 (kitchen, lounge). The compressor type is a hermetically sealed swing type,
but because that couldn’t be found in IDA ICE the compressor type Ashrae Ce 100 was used.
The monthly-consumed energy can be found in appendix A2.

Unlike the system described earlier in chapter 2 and section 2.2, the Daikin split system air
conditioner uses the latest inverter technology, which means it has a higher COP. The inverter
technology is unified into the outdoor unit. The difference between an inverter to non-inverter
system is that the system will gradually increase the capacity instead of running on full load.
The advantages by having this system is that it will reach a faster comfort temperature in the
room, while it also saves 1/3 of the normal start-up time [22].
3.1.2.1.2 INFRARED PANEL
The infrared panel is an Infracomfort heating panel with a maximum power of 360 W. The
panel is located in zone 6 (the child’s bedroom), and it’s mainly used during evenings [19].
The monthly-consumed energy can be found in appendix A2.
Unlike other heating panels this panel uses a newer technology using less input to heat a
surface. The heating panel can also maintain a higher humidity at 40 %-55% and therefore the
air doesn’t dry up [21].

Julia Flink
Umea University, Bachelor thesis 15 hp
Bachelor in energy technology
Supervisor: Mark Murphy
 12
3.1.2.2 BEFORE INTERVENTION
This section describes the former space heating system in dwelling A. The main principles for
each heating system are described in chapter 2.
3.1.2.2.1 OIL-FILLED RADIATOR
The radiator was a 4 bar Goldair with a rated power of 2.5 kW, it was located in zone 1
(kitchen, lounge) [21].
3.1.2.2.2 HOT WATER BASED RADIATOR
The hot water based radiator was a Dimplex with a rated power of 1.0 kW. The radiator used
to be in zone 6 (child’s bedroom) [21].

3.1.3 AIR HANDLING UNIT
The ventilation system utilized in dwelling A is a positive pressure forced air system. The
system is located on the roof of the building and provides filtered air to the whole building. It
takes dry and warm air from the roof space and distributes it evenly through the building. The
incoming air is filtered by nano fibre filter before it enters the building. Filtered air enters and
replaces stale indoor air.
 The system is it’s a variable (VAV) system, which controls and circulates the air by
removing pollens, dust and other containments. Air is replaced 2-4 times per hours. The
system also prevents condensations and mould [23]. The air-handling unit in IDA ICE is set
to variable (VAV) excluding a heat exchanger. It’s the same ventilation system before and
after intervention. Figure 7 shows and image on the ventilation system in dwelling A.

Figure 7 Ventilation system in dwelling A [23]

Julia Flink
Umea University, Bachelor thesis 15 hp
Bachelor in energy technology
Supervisor: Mark Murphy
 13
3.1.4 PLANT
The hot water cylinder is a 3 kW with a volume of 0.18 m3. The hot water is electrically
coiled and scheduled between 23-07, 13-15 Hrs. The house does not have a chillier device.
The average hot water consumption has been calculated through an average of summer and
winter. The amount of hot water consumed last summer was 27.5 L/ per occupant a day, and
winter 46.2 L/ per occupant a day [21]. The monthly hot-water consumption can be found in
appendix A1.

3.1.5 THE INDOOR CLIMATE
The indoor climate describes the average temperature and humidity inside the house. There
are four temperature- sensors in dwelling A, two in zone 6 (the child’s bedroom) and two in
zone 1 (kitchen, and lounge). These four temperature-sensors sense the temperature and
humidity in the rooms. There are two sensors in each room, one in the lower part of the room
and the other higher. Throughout the calculations an average temperature, from the
temperature from the highest and the lowest part of the room, is used.
3.1.5.1 AFTER INTERVENTION
The indoor climate for the summer has been calculated by averaging the min and max
temperatures for each day. This mean was used as the max temperature in the IDA ICE
program. This was to obtain a realistic temperature setting, as the temperature would not
usually be on max in the dwelling. Zones without temperature-sensors have been set to the
same temperature as zone 6.

In winter the average mean temperature for zone 6, used the max temperatures for the
calculation. This is because zone 6 usually had the absolute max temperature. The rest of the
zones have been assumed to have a similar indoor climate as zone 6 [21]. Table 2 shows the
indoor climate for dwelling A.

Julia Flink
Umea University, Bachelor thesis 15 hp
Bachelor in energy technology
Supervisor: Mark Murphy
 14
One can schedule the setpoint for heating and cooling controller in IDA ICE. In this case
model the setpoint for each zone during summer is scheduled 7-8.30, 16-20 Hrs and for winter
it’s always on to maintain the min-and maximum temperature inside the house.

Table 2 Indoor climate-After intervention dwelling A
 Summer Zone 1 2 3 4 5 6 7 8
 Max T [ᵒC] 23.4 22.9 22.9 22.9 22.9 22.9 22.9 22.9
 Min T [ᵒC] 20.9 20.5 20.5 20.5 20.5 20.5 20.5 20.5
 Max Hum [%] 59.6 61.6 61.6 61.6 61.6 61.6 61.6 61.6
 Min Hum [%] 51.9 54.8 54.8 54.8 54.8 54.8 54.8 54.8
 Outdoor T [ᵒC] 22.6
 Outdoor Hum [%] 64.7
 Winter Zone 1 2 3 4 5 6 7 8
 Max T [ᵒC] 16.4 17.5 17.5 17.5 17.5 19.2 17.5 17.5
 Min T [ᵒC] 14.1 15.6 15.6 15.6 15.6 15.6 15.6 15.6
 Max Hum [%] 63.4 57.4 57.4 57.4 57.4 66.4 57.4 57.4
 Min Hum [%] 57.9 50.0 50.0 50.0 50.0 50.0 50.0 50.0
 Outdoor T [ᵒC] 11.9
 Outdoor Hum [%] 75.4

3.1.5.2 BEFORE INTERVENTION
Data for temperatures and humidity’s before intervention is calculated through three tests
during the winter of 2014. The months that have been tested are June, July and August. The
tests have been carried out over a 10 days period [21]. The indoor climate for summer is
assumed to be the same as after intervention, because there is no data for that period. Table 3
shows the indoor climate before intervention. The setpoint is scheduled the same after
intervention.
Table 3 Indoor climate- Before intervention dwelling A
 Winter Zone 1 2 3 4 5 6 7 8
 Max T [ᵒC] 20.2 20.0 20.0 20.0 20.0 20.0 20.0 20.0
 Min T [ᵒC] 13.8 15.2 15.2 15.2 15.2 15.2 15.2 15.2
 Max Hum [%] 65.5 65.0 65.0 65.0 65.0 65.0 65.0 65.0
 Min Hum [%] 54.3 49.1 49.1 49.1 49.1 49.1 49.1 49.1
 Outdoor T [ᵒC] 12.3
 Outdoor Hum [%] 70.2

3.1.6 DEFAULTS
The following section includes information about elements of construction, doors and
windows and generator efficiencies before and after intervention.
3.1.6.1 ELEMENTS OF CONSTRUCTION
Elements of construction describe the different layers of the walls, floor and roof. The
external wall consists of bevel back weatherboard with cavity and building paper [24]. The
internal wall includes two layers of plasterboard [24] and insulation [25]. The external floor
has a top layer of floor covering while the internal floor has been assumed to include concrete
Julia Flink
Umea University, Bachelor thesis 15 hp
Bachelor in energy technology
Supervisor: Mark Murphy
 15
[26] and insulation [27]. The roof was made from Pink batts insulation [28], skillion profiled
metal and building paper [24].
The overall heat transfer coefficients have been calculated by equations (5,6 8) for each layer,
where the thickness is adjusted to achieve the right U-value for IDA ICE. Table 4 indicates
the material and U-value for each layer. The elements of construction are the same before
after intervention. The calculations of defaults can be found in appendix A6.
Table 4 Elements of construction- Dwelling A
 U-value [W/m2K]
Element Material
External
walls Bevel back weatherboard with cavity + building paper 0.56
Internal
walls Plasterboard, Insulation 0.53
External
floor Floor covering 2.50
Internal
floor Concrete underfloor + Insulation Pink batts 0.53
 Double layer, pink batts over insulfluff + skillion profiled metal + building
Roof paper 0.21
Window Single glazing 4.80
Doors Wood 3.70

3.1.6.2 DOORS AND WINDOWS
The doors are assumed to be wooden with a U-value of 3.70 W/m2K [29] and the windows
are single glazed with a U-value 4.80 W/m2K [30]. Table 4 indicates the U-value of windows
and doors.

Doors in zone 1, 2 were usually kept closed before intervention and the rest of the doors
except from zone 4 and 5 were kept open during daytime and closed in the evenings. The
main difference through intervention according to the householder is that the doors in zone 1
and 2 nowadays are kept open all the time [21]. The schedules of the doors are assumed to be
the same during winter and summer.

The windows have been scheduled depending on the season. During summer windows are
opened 1 h/day and during winter they are closed. All the windows except zone 5 have
drawings, which are closed 21-07. The schedule for doors and windows can be found in
appendix A3.
3.1.6.3 GENRATOR EFFICIENCIES
As for generator efficiencies one can choose between fuel, district heating and electric in IDA
ICE. Before intervention, dwelling A had two radiators that both required electricity to be
powered. The current heating system consists of an air source heat pump and a heating panel,
where the ASHP has an electric driven motor and a COP of 4.08, the heating panel is also
electrical powered, therefore the generator efficiencies are set to electric.

Julia Flink
Umea University, Bachelor thesis 15 hp
Bachelor in energy technology
Supervisor: Mark Murphy
 16
3.1.7 SCHEDULE OF OCCUPANTS
The schedule of occupants indicates the number of people for each zone, and it’s assumed to
be the same during summer and winter. The family living in dwelling A consists of a younger
couple and their child. The activity level for adults is 1.5 MET while the child has an activity
level of 1.7 MET [31]. The value for clothing is set according to standard settings in IDA
ICE, 0.85 ± 0.25 clo/occupant.
3.1.7.1 DWELLING A- BEFORE INTERVENTION
According to the householder, one of them used to be home with their child during the
weekdays. They used to spend most of their time in zone 1 (kitchen, lounge) as they were
usually just heating one area [21]. Table 5 below shows the schedule of occupants before
intervention, the schedule is assumed to be the same during winter and summer.

Table 5 Schedule of occupants-Before intervention dwelling A

3.1.7.2 DWELLING A – AFTER INTERVENTION
The activity level in zone 1 is lower than before intervention. The only days that activity is
higher in zone 1 are Wednesdays and Fridays because one of the adults regularly comes home
for lunch. The other zones except zone 6 are the same as before intervention [21]. Table 6
shows the schedule of occupants after intervention.
Table 6 Schedule of occupants- After intervention dwelling A

3.1.8 HOLIDAYS
Holidays like Easter, Christmas, winter breaks and labour weekends have the same schedule
as the other days during the year. This is to simplify the model.

3.1.9 THERMAL BRIDGES
Thermal bridges are poorly insulated areas, which usually occur around windows and doors.
Dwelling A is a relatively new house, with insulation for the internal floor, walls and ceiling.
Thermal bridges may occur in the dwelling around the big single glazed window. One can set
Julia Flink
Umea University, Bachelor thesis 15 hp
Bachelor in energy technology
Supervisor: Mark Murphy
 17
thermal bridges from none to very poor in IDA ICE. In this case model thermal bridges are set
as typical because dwelling A is relatively new, and wouldn’t be expected to be poor or very
poor. Thermal bridges are assumed to be the same before and after intervention.

3.1.10 SITE SHADING AND ORIENTATION
The orientation of the building is 315 °. There is some minor potential of shading in winter
from carport, but this has not been calculated in this case model [21].

3.1.11 EXTRA ENERGY AND LOSSES
Extra energy and losses defines losses due to hydronic and air handling units in the
distribution system, hot water and other energy uses. One can set extra energy and losses from
none to very poor in IDA ICE. The losses for this case model are assumed to be typical.

3.1.12 GROUND PROPERTIES
These are parameters and conditions below the house, the default in IDA ICE is set to a
temperature of 10 °C. Ground layers under basement slab and outside basement walls are set
to default soil [21].

Julia Flink
Umea University, Bachelor thesis 15 hp
Bachelor in energy technology
Supervisor: Mark Murphy
 18
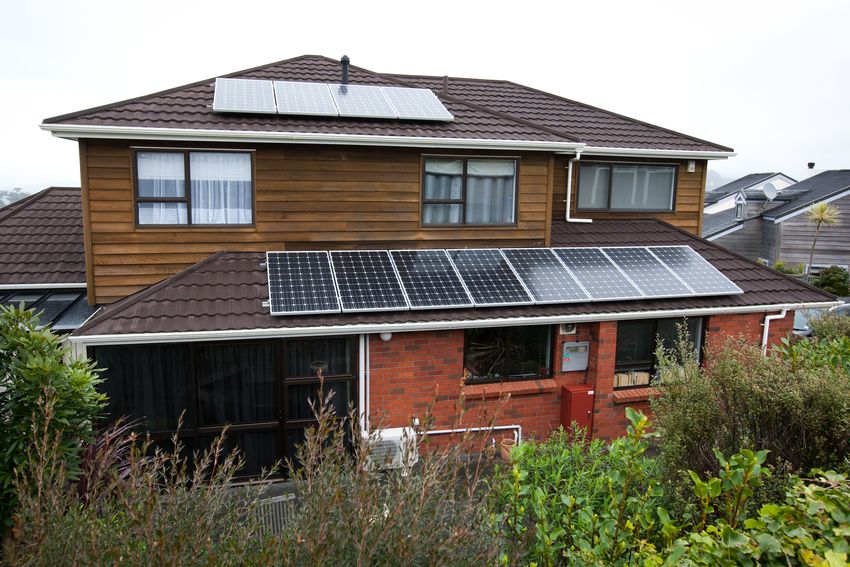
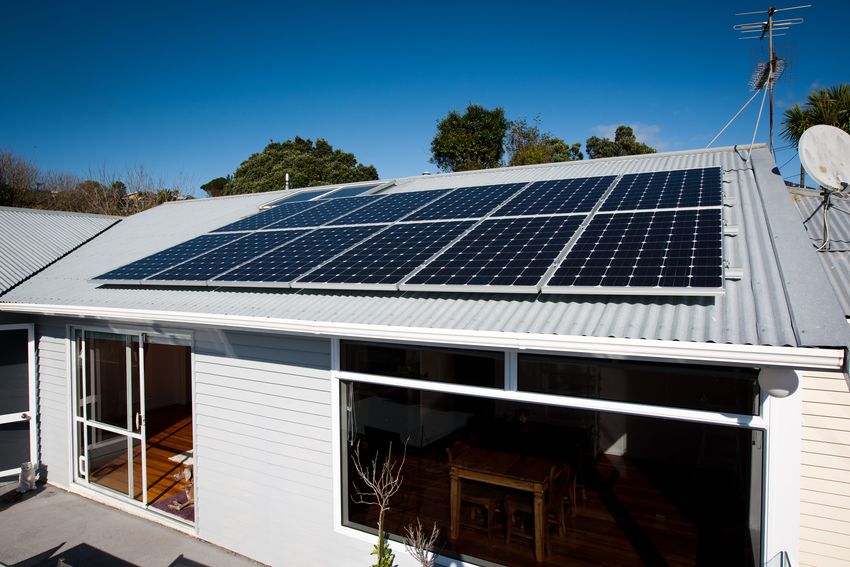
3.2 DWELLING B
Dwelling B is located in New Plymouth and has an area on 169 m2. The house was built in
1960’s with major additions and re-cladding 1990. House B has a single storey, which
includes 2 bedrooms, 2 living rooms, 2 bathrooms and a kitchen area. The heating system
consists of a gas fire, located in the bigger living room, an infrared panel and a radiator
located in one of the bedrooms [32].

The annual energy consumption before the intervention was 9102 kWh/year and today it’s
increased to 9107 kWh/ year. The family living in house B used to consist of two adults and
according to the smart house program they belonged to energy easy, which meant their energy
use was quite high. However today it is one middle-aged adult living in house B [32].

Figure 8 below shows a picture taken of dwelling B. The picture is taken from the backyard
with the deck pointing towards north.

Figure 8 Dwelling B- New Plymouth [32]

Julia Flink
Umea University, Bachelor thesis 15 hp
Bachelor in energy technology
Supervisor: Mark Murphy
 19
3.2.1 3D CONSTRUCTION OF DWELLING B
Figure 9 shows a 3D construction of the dwelling A in IDA ICE with and without cut plane.
The construction is based on floor plans with measurements for walls, roof height, door and
windows [32]. The overall height of the house is 2.5 m. The floor plan of dwelling B can be
found in appendix A6.

Figure 9 Case model of dwelling B

The house consists of 9 rooms, and therefore the case model has been divided into 9 zones.
The dwelling is divided into 9 building bodies because of the dissymmetry. Figure 10 below
gives an overview of the zones in the building.

Figure 10 Dwelling B- Division of zones

Julia Flink
Umea University, Bachelor thesis 15 hp
Bachelor in energy technology
Supervisor: Mark Murphy
 20
Table 7 indicates the available area of each zone in dwelling B.

Table 7 Available areas in dwelling B
 Zone Available Area [m2] Name of the zone
 1 14.52 Back bedroom
 2 10.49 Back living room
 3 46.49 Dinning and kitchen area
 4 11.81 Office
 5 5.48 Bathroom
 6 6.52 Laundry
 7 39.58 Main living room
 8 25.52 Master bedroom, en suite
 9 8.88 Foyer
 Total 169.29

3.2.2 HEATING SYSTEM
This section consists of information about the present and original space heating system.
Before the intervention dwelling B had an air source heat pump, two oil- filled radiators and a
gas wall heater. The present heating system involves a gas fire, an infrared panel and an
electric radiator [31].

3.2.2.1 AFTER INTERVENTION
The following section describes the heating system after the intervention. The main principles
of each heating system are described in chapter 2.
3.2.2.1.1 GAS FIRE
The Rinnai Neo gas fire is the first natural draft gas fire available in New Zealand with a
greater than 4 star energy rating across all installations [33]. It is located in zone 7 and used
mainly in the winter, but also during summer [32]. Rinnai Neo has a maximum power on
6940 kWh and a heating efficiency on 0.8.The energy consumption has been calculated
through the power bills, which is shown in appendix A3.
3.2.2.1.2 ELECTRIC RADIATOR
This is an electric radiator on 230 V and 50 Hz [34]. It’s located in zone 3 and has a
maximum power on 1200 W. A3 shows the monthly-consumed energy.
3.2.2.1.3 INFRARED PANEL
The infrared panel is the same as in dwelling A (chapter 3 section 1.2). The panel is located in
zone 3 (spare bedroom) and has a maximum power on 360 W [35]. A2 shows the monthly-
consumed energy.
3.2.2.2 BEFORE INTERVENTION
This section presents the heating system before intervention. The main principles for each
heating system are described in chapter 2.
3.2.2.2.1 AIR SOURCE HEAT PUMP
The air source heat pump used in dwelling B was a Fujitsu Nocria Inverter, which is a high
wall mounted heat pump with split system as described in chapter 2, section 3. The Fujitsu
Nocria Inverter has a complex swing action, and can swing both horizontally and vertically. It
Julia Flink
Umea University, Bachelor thesis 15 hp
Bachelor in energy technology
Supervisor: Mark Murphy
 21
You can also read