Verification of the GreenCap Solutions AS Environmental Control System
←
→
Page content transcription
If your browser does not render page correctly, please read the page content below
Verification of the GreenCap Solutions AS
Environmental Control System
Yield and quality of greenhouse tomatoes

                                                               NIBIO REPORT | VOL. x | NO. x | 2021

Michel Verheul and Henk Maessen
Division of Food Production and Society, Department of Horticulture, Særheim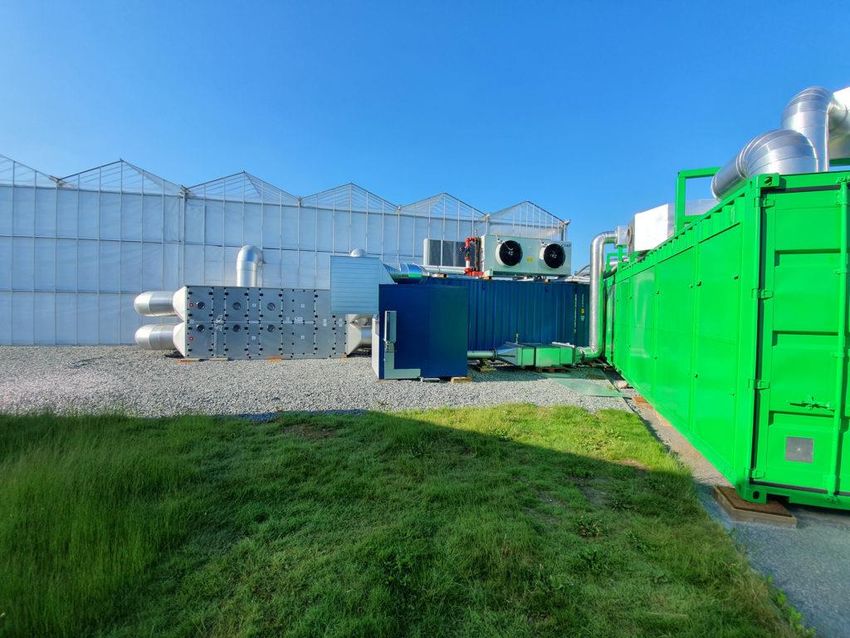
TITTEL/TITLE

Verification of the GreenCap Solutions AS Environmental Control System: Yield and quality of
greenhouse tomatoes.

FORFATTER(E)/AUTHOR(S)

Michel Verheul and Henk Maessen

DATO/DATE:       RAPPORT NR./   TILGJENGELIGHET/AVAILABILITY:                  PROSJEKTNR./PROJECT NO.:   SAKSNR./ARCHIVE NO.:
                 REPORT NO.:

04.07.2021      Vol/no/year     Confidential                                  51150                       Archive number

ISBN:                               ISSN:                                      ANTALL SIDER/              ANTALL VEDLEGG/
                                                                               NO. OF PAGES:              NO. OF APPENDICES:

978-82-17-[xxxx-x]                  2464-1162                                  No of pages                Attachments

OPPDRAGSGIVER/EMPLOYER:                                         KONTAKTPERSON/CONTACT PERSON:
GreenCap Solutions AS                                           Jarle Skjæveland

STIKKORD/KEYWORDS:                                              FAGOMRÅDE/FIELD OF WORK:

Stikkord norske                                                 Bærekraftig veksthusproduksjon

Keywords                                                        Sustainable greenhouse production

SAMMENDRAG/SUMMARY:

Å møte det økende matbehovet fra en voksende global befolkning krever nye og bærekraftige
produksjonsmetoder. Hydroponiske veksthusproduksjonssystemer gir de beste forholdene for å
maksimere fotosyntese, noe som kan resultere i høye avlinger og produktkvaliteter for frukt og
grønnsaker hele året, hvor som helst i verden. Veksthusproduksjon er imidlertid svært
ressurskrevende. Den krever naturgass for oppvarming og for CO 2 tilførsel til plantene, noe som
resulterer i relativt høye CO2-utslipp. For å kunne utvikle bærekraftige veksthus produksjons
systemer er det nødvendig å komme med løsninger som kan redusere CO2-fotavtrykket.
Det patenterte GreenCap Solutions AS Environmental Control Systemet (ECS) erstatter oppvarming
fra naturgass med varme fra solen, fanget av veksthuset. I tillegg fanger den CO 2 fra luften utenfor
veksthuset. Den tradisjonelle metoden for å ventilere et veksthus, ved å åpne vinduene, erstattes av
en kontrollert luftbevegelse som fjerner overskuddsvarme og fuktighet, og opprettholder optimal
temperatur, fuktighet og CO2-konsentrasjonsnivå for fotosyntese.
Målet med eksperimentene som ble presentert i denne rapporten var å verifisere GreenCap Solutions
AS Environmental Control Systems teknologi for produksjon og kvalitet av veksthus tomater. Vi
sammenlignet et tradisjonelt sesongbasert produksjonssystem med et tradisjonelt helårs
produksjonssystem med tilleggslys, og et nytt helårs produksjonssystem med tilleggslys regulert av
ECS-systemet. Det ble gjennomført to eksperimenter mellom 2019-2020 med fullvokste og
produserende tomatkulturer med standard runde tomatsorter.
Resultatene bekreftet at ECS-systemet kunne regulere klimatiske forhold (dvs. temperatur, CO 2-
konsentrasjon og relativ fuktighet) til et ønsket optimalt nivå for fruktproduksjon og -kvalitet. Ved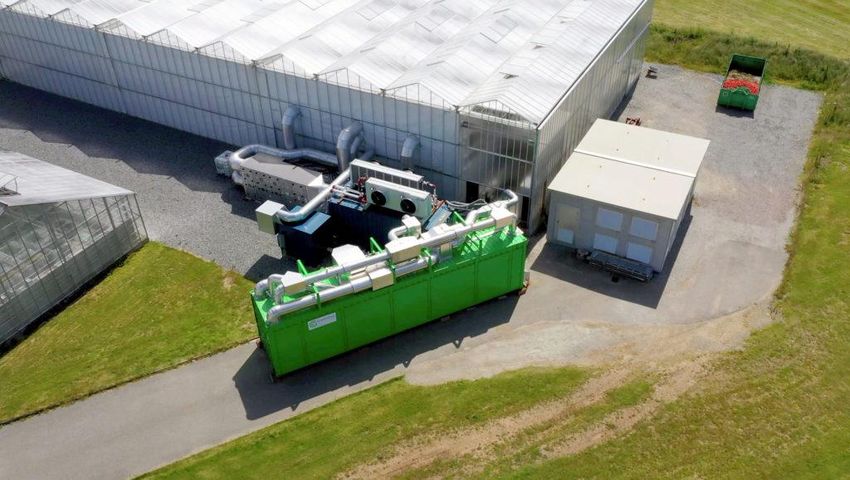
bruk av ECS forble vinduene lukket, CO2-konsentrasjonen holdt seg på et høyt nivå (1200 ppm),
relativ fuktighet ble holdt på et ønsket nivå på 75-85%, og temperaturen ble regulert uavhengig av
utetemperaturen og innstrålingen. Det var ikke behov for å bruke fossilt drivstoff til oppvarming
eller CO2-forsyning. Resultatene viste at CO2-fotavtrykket for veksthusene ved bruk av ECS-systemet
falt dramatisk. Det tradisjonelle sesongbaserte produksjonssystemet registrerte 4,1 kg CO 2e per kg
produserte tomater. I helårsproduksjonssystemet regulert av ECS-systemet, falt dette tallet til rundt
0 kg CO2e per kg produserte tomater.
Tomatavlingen økte fra 42 kg m-2 år-1, i et tradisjonelt sesongbasert produksjonssystem (med 26
høsteuker), til 116 kg m-2 år-1, i et tradisjonelt helårs produksjonssystem med tilleggslys (med 46
høsteuker), til 151 kg m-2 år-1, i det ECS-regulerte helårs produksjonssystemet med tilleggslys.
Avlingsforskjeller mellom de to helårs produksjonssystemene kan i stor grad forklares med
forskjeller i CO2-konsentrasjon i veksthusluften (500-600 ppm i det tradisjonelle systemet og 1000-
1200 ppm i ECS-systemet). I tillegg var tomatens fruktkvalitet, størrelse og smak betydelig bedre i
det ECS-regulerte produksjonssystemet sammenlignet med det tradisjonelle sesongbaserte
produksjonssystemet.
Resultatene viste også at ECS-produksjonssystemet kunne oppnå enda høyere tomatavlinger. Nye
produksjonssystemer krever ofte optimalisering av planteegenskaper for å utnytte nye muligheter for
avling og fruktkvalitet. I eksperimentene våre testet vi effekten av en høyere plantetetthet og
forskjellige avblading strategier i tillegg til effekten av ekstra LED belysning mellom planteradene.
Ved å bruke ECS-produksjonssystemet i kombinasjon med høy plantetetthet og installasjon av LED
mellombelysning, fant vi en maksimal avling på 168 kg m-2 år-1. Til sammenligning økte ikke
produksjonen ved å installere LED mellombelysning i det tradisjonelle helårsproduksjonssystemet.
I tillegg til en reduksjon i CO2-utslipp og en betydelig forbedring av fruktens kvalitet, størrelse og
smak, bruker veksthusgrønnsaker som dyrkes med ECS-systemet svært lite vann og har mindre
behov for kjemiske plantevernmidler. Våre eksperimenter viste at vann som ble fordampet av
plantene, omtrent 90% av det totale vannopptaket, kunne samles opp fra veksthusluften av ECS-
systemet. På grunn av de lukkede vinduene og den kontrollerte temperaturen og relative fuktigheten
i veksthuset, hadde vi ikke behov for kjemisk planteproduksjon.
Vi konkluderer med at det patenterte GreenCap Solutions AS Environmental Control System
regulerer klimatiske forhold i et veksthus til ønsket optimalt nivå for fruktproduksjon og kvalitet,
uavhengig av klimaforhold utenfor veksthuset. Systemet reduserer CO2-fotavtrykket fra
veksthusproduksjon dramatisk ved å ta vare på solenergien og fange CO2 fra uteluften. Ved å holde
vinduene lukket øker CO2-konsentrasjonen i veksthuset, noe som forbedrer avling og
produktkvaliteten. Vann som fordampes av plantene samles opp for å bli gjenbrukt og behovet for
kjemiske produksjonsmidler reduseres.
I jakten på effektive og bærekraftige matproduksjonssystemer er GreenCap AS Environmental
Control System en spill-endrende teknologi som kan endre veksthusproduksjon verden rundt.

LAND/COUNTRY:             Norway
FYLKE/COUNTY:             Rogaland
KOMMUNE/MUNICIPALITY:     Klepp
STED/LOKALITET:           Særheim
GODKJENT /APPROVED   PROSJEKTLEDER /PROJECT LEADER

    [Name]

   NAVN/NAME

                           MICHEL J. VERHEUL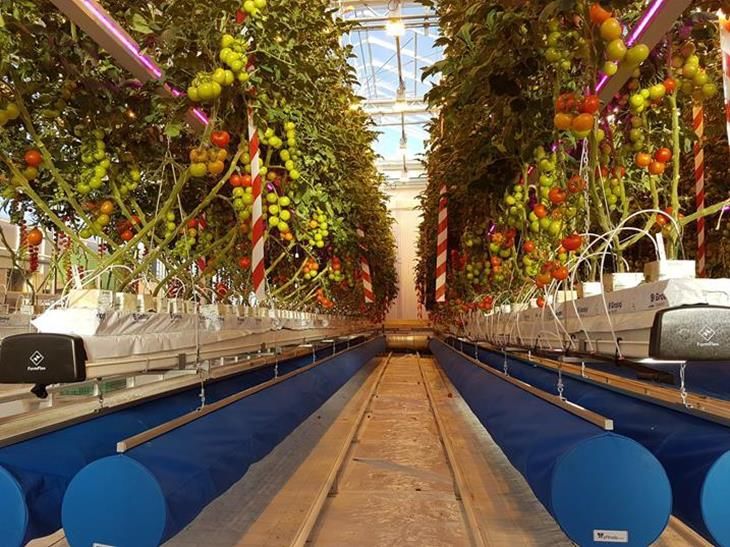
Summary
Meeting the rising food demand of a growing global population requires new and sustainable
production methods. Hydroponic greenhouse production systems provide the best conditions for
maximizing photosynthetic performance, resulting in high yields and product qualities for fruits and
vegetables all year round, anywhere in the world. However, greenhouse production is highly resource
demanding. It requires (natural) gas for heating and CO2 supply to plants, resulting in relatively high
CO2 emissions. In order to develop sustainable greenhouse production systems, it is necessary to come
up with solutions that can reduce their CO2 footprint.
The patented GreenCap Solutions AS ECS system replaces heating from natural gas with captured
solar energy from the greenhouse air. In addition, it captures CO2 from the air outside the greenhouse.
The traditional method of ventilating greenhouses, by opening the windows, is replaced by a controlled
air movement that removes surplus heat and humidity, and maintains optimal temperature, humidity
and CO2 concentration levels for photosynthesis.
The goal of the experiments presented in this report was to verify GreenCap Solutions AS
Environmental Control System’s technology for the production and quality of greenhouse tomatoes.
We compared a traditional seasonal production system with a traditional year-round production
system using supplemental light, and a new year-round production system using supplemental light
regulated by the ECS system. Two experiments were performed between 2019-2020 with fully-grown
and producing tomato crops, using standard round tomato varieties.
The results confirmed that the ECS system could regulate climatic conditions (i.e temperature, CO 2
concentration and relative humidity) to a desired optimal level for fruit production and quality. Using
ECS, windows remained closed, CO2 concentration remained at a high level (1200 ppm), relative
humidity was kept at a desired level of 75-85%, and the temperature was regulated independently from
the outside temperature and radiation. There was no need to use fossil fuel for heating nor CO2 supply.
Results showed that the CO 2 footprint for the greenhouses using the ECS system fell dramatically. The
traditional seasonal production system recorded 4.1 kg CO 2e per kg of tomatoes produced. In the year-
round production system regulated by the ECS system, this figure dropped to around 0 kg CO 2e per kg
of tomatoes produced.
Tomato yield increased from 42 kg m-2y-1, in a traditional seasonal production system (with 26
harvesting weeks), to 116 kg m-2y-1, in a traditional year-round production system (with 46 harvesting
weeks) using supplemental light, to 151 kg m-2y-1, in the ECS-regulated year-round production system
using supplemental light. Yield differences between the two year-round production systems could
largely be explained by differences in CO2 concentration in the greenhouse air (500-600 ppm in the
traditional system and 1000-1200 ppm in the ECS system). In addition, the fruit quality, size and taste
of the tomatoes were significantly better in the ECS-regulated production system compared to the
traditional seasonal production system.
Results also showed that the ECS production system could generate even higher tomato yields. New
production systems often require the optimization of plant properties to exploit new opportunities for
plant yield and fruit quality. In our experiments we tested the effects of adding LED inter-light
between the plant rows, as well as higher plant densities and different defoliation strategies. Using the
ECS production system in combination with a high plant density and installation of LED inter-light
between the plant rows, we found a maximum yield of 168 kg m-2y-1. In comparison, adding LED inter-
light in the traditional year-round production system did not increase production.

NIBIO REPORT X (X)                                                                                      5
In addition to a decrease in CO2 emissions and a substantial improvement in the quality, size and taste
of the fruit, greenhouse crops grown using the ECS system have high water use efficiency and less need
for chemical plant protection agents. Our experiments revealed that water generated by the
transpiration of the plants, roughly 90% of the water uptake, was collected from the greenhouse air by
the ECS system. Due to the closed windows and the controlled temperature and relative humidity in
the greenhouse air, we had no need for chemical plant production.
We conclude that the patented GreenCap Solutions AS Environmental Control System regulates the
climatic conditions in a greenhouse to the desired optimal level for fruit production and quality,
independent of outside conditions. It dramatically decreases the CO2 footprint from greenhouse
production by capturing CO2 from the outside air and solar heat energy from the inside. By keeping the
windows closed, CO2 concentration in the greenhouse air is increased and in turn yield and product
quality is improved. Water transpired from the plants is collected to be reused and the need for
chemical plant production agents is reduced.
In the quest for effective and sustainable food production systems, the GreenCap AS Environmental
Control System is a game-changing technology that can transform greenhouse production worldwide.

6                                                                                     NIBIO REPORT X (X)
Content
1 Introduction ................................................................................................................................ 8
2 Background and rationale for the study..................................................................................... 9
3 Materials and Methods ............................................................................................................ 12
    3.1 Experimental setup ........................................................................................................................................ 12
        3.1.1 Plant materials .................................................................................................................................. 13
        3.1.2 GreenCap Solutions AS Environmental Control System (ECS)........................................................... 14
        3.1.3 Light conditions ................................................................................................................................. 14
    3.2 Regulation of climatic conditions and irrigation ............................................................................................ 15
    3.3 Plant care and plant vigour measurement .................................................................................................... 16
    3.4 Harvest .......................................................................................................................................................... 16
    3.5 Quality Analysis of Fruits ............................................................................................................................... 16
    3.6 Statistics......................................................................................................................................................... 17

4 Results and discussion .............................................................................................................. 18
    4.1 Experiment 1 (2019) ........................................................................................................................................ 19
         4.1.1 Climatic conditions ............................................................................................................................ 19
         4.1.2 Yield ................................................................................................................................................... 19
         4.1.3 Fruit Quality ...................................................................................................................................... 23
    4.2 Experiment 2 (2020) ...................................................................................................................................... 24
         4.2.1 Climatic conditions ............................................................................................................................ 24
         4.2.2 Yield and quality ................................................................................................................................ 26
    4.3 Environmental Performance ......................................................................................................................... 30

5 Conclusions ............................................................................................................................... 31

NIBIO REPORT X (X)                                                                                                                                                    7
1 Introduction
Cooperation between NIBIO and GreenCap Solutions AS started in 2016. GreenCap Solutions AS had
just patented their system for CO2 capture and was looking for practical applications. NIBIO had just
started with the ambitious project BioFresh (www.biofresh.no) supported by the Norwegian Research
Council. Our common goal was to develop new sustainable, resource effective and profitable
production systems for future food production. We focussed on vegetable production in (semi-) closed
greenhouses using renewable resources. Traditionally, greenhouses in northern conditions are heated
using natural gas or propane. Availability of solar energy, captured in a greenhouse, and hydroelectric
energy, used for supplemental lighting during large parts of the year in Norway, can, in theory, reduce
the use of gas for heating to zero. However, in greenhouse production, gas is not only burned for
heating, but also for providing CO 2 to the crop. Thus, CO2 capture from the outside air is seen as the
missing link to develop a fossil free greenhouse production system. Building a system allowing
complete control of the greenhouse air temperature, CO2 concentration and humidity, along with the
control of water uptake in hydroponically grown plants, will control the process of photosynthesis in
plants and may start a revolution in greenhouse production systems.
In order to test and verify such a system, the GreenCap Solutions AS ECS was connected to the new
research greenhouse facilities at NIBIO Særheim, which were finished in 2018. NIBIO was assigned to
test and verify the ECS for a tomato production for GreenCap Solutions AS within the innovation
project: ‘Climate neutral greenhouse production through a Smart Environmental Control System
(2019-2021)’, supported by the Bionær program of the NRC (project number 296287). The presented
NIBIO report summarizes results of verifications for two years and two production cycles for tomato.

Photo 1: Closed loop growing system ECS Z255 installed at NIBIO Særheim (Photo: GreenCap Solutions AS)

8                                                                                                   NIBIO REPORT X (X)
2 Background and rationale for the study

Modern food production for an increasing population with high demands on food quality require new
and sustainable production methods. Plant production in controlled environments in greenhouses is
an intensive production method that can produce high amounts of fresh, safe, and healthy high quality
vegetables year-round. Greenhouse production is often located in the vicinity of population areas, thus
reducing transport, and increasing product quality. However, greenhouse production is a resource
demanding production. Under northern conditions, greenhouses use (natural) gas to heat the
greenhouse and to provide CO2 fertilisation to the plants. This in spite of the fact that a greenhouse
receives about to times the amount of energy that is needed during a year from solar radiation. The
challenge is that this energy is received during the day and in summer, while it is needed during the
night and in winter.
A controlled environment in a greenhouse gives the opportunity to optimize the process of
photosynthesis, that requires light, CO2, water, and nutrients, for suitable plants grown at a suitable
temperature. Usually, water and nutrient management is controlled and optimized. However, light
conditions change during the day and season. More light requires more CO 2 to keep maximum
photosynthesis. In addition, a greenhouse collects solar energy. In many occasions, the greenhouse air
temperature becomes too high for plant production, and ventilation is needed. Ventilation not only
causes a loss of energy, but also of CO2. This event occurs often at high levels of solar radiation, thus
resulting in suboptimal photosynthesis and growth. The patented GreenCap Solutions AS ECS system
removes the captured solar energy and stores this in a water buffer. In addition, it captures CO2 from
the air outside of the greenhouse. The standard ventilation, by opening of the windows, is replaced by
a controlled air movement that removes the surplus of heat and humidity and returns air with an
optimal level of temperature, humidity and CO2 concentration. Using the GreenCap Solutions AS ECS
system, ventilation can be controlled, and the CO2 level in the greenhouse air can be adjusted to the
light level in order to obtain maximum photosynthesis. CO2 is used effectively for plant growth and not
lost to the outside air.
The project ‘Bioeconomic production of fresh greenhouse vegetables in Norway (BioFresh) (2016-
2021)’, supported by the Norwegian Research Council (project number 296287) has directed focus on
future production of greenhouse vegetables in (semi-) closed greenhouses. The project aimed to
increase sustainable, resource effective and profitable production and use of fresh, healthy, high
quality vegetables. We investigated new innovative biological techniques that interact with new
technology ((semi-)closed greenhouses) thus dramatically reducing the use of fossil energy, CO2
emissions, use and emissions of mineral fertilizers and chemical plant protection agents. To achieve
this, modern equipment for monitoring of plant growth and regulation of greenhouse climate was
developed and tested in a research greenhouse at NIBIO Særheim. Innovation will only occur if new
technological developments will give rise to economic and/or environmental value. Experimental
research, modelling approaches and life cycle analysis (LCA) were used to quantify these values
(Naseer et al., 2021).
More than 50% of the energy captured by a greenhouse is lost due to ventilation through the opening
of the windows (Vadiee and Martin, 2012). Closing the windows increases the not only the
temperature and relative humidity inside the greenhouse, but also the vertical differences in
temperature and humidity. This causes a stress situation for vertically trained plants like in a tomato
and cucumber crop and related problems with plant growth and development as well as pests and
diseases. In one of the first experiments in the BioFresh project, we installed a simple forced air
circulation system in the greenhouse that redistributed hot and dry air from the top of the greenhouse

NIBIO REPORT X (X)                                                                                        9
to underneath the plants. Due to this simple system, we could reduce the energy use mainly during
spring and autumn, giving a total reduction of 20% on a yearly basis (Verheul, 2017).
The next step to redistribute energy from day to night was to install a heat exchanger in combination
with a water buffer. A heat exchanger can capture the excess of heat during the day and store this is a
water buffer. Water from the water buffer can be used at night to heat the greenhouse, using a heat
pump. Heat exchangers and heat pumps are generally energy effective with a coefficient of
performance (COP) of three or more, which means that the energy output is three times or more the
energy input. Measurements and calculations showed that the use of a heat exchanger and heat pump
in a greenhouse reduced energy consumption with 50% (Righini et al., 2019).
An additional advantage of closing the windows and using a heat exchanger and heat pump is the
possibility to increase the CO2 concentration in the greenhouse. Due to high levels of photosynthesis,
growth, development, and production, often 10-20 times higher than comparable productions in the
open field, greenhouses are regarded as CO2 sinks. In greenhouse tomato and cucumber production,
an increase in yield of 20-30% can be expected when increasing the CO2 concentration from outside
level (400 ppm) to 1000 ppm (Nederhoff, 1994).
Greenhouse production of vegetables can cause high CO2 emissions, mainly due to the use of fossil
fuels (Verheul and Thorsen, 2010). The use of electricity from renewable resources will reduce CO2
emissions in greenhouse production drastically. In Norway, green electricity is available from
hydroelectric power plants. Green electricity can thus be used for both heat exchangers, heat pumps,
forced ventilation systems and additional lighting. However, when reducing the use of fossil fuels, the
availability of CO2 in greenhouse production becomes a challenge.
GreenCap Solutions AS developed a patented system to extract CO2 from the outside air to be released
with a high concentration (3000 ppm) in the greenhouse air. This was combined with an
environmental control system (ECS) acting like a heat exchanger and a forced ventilation system. The
ECS blows air with a desired temperature, humidity, and CO2 concentration underneath the plants in
the greenhouse and removes air with a changed temperature, humidity, and CO2 concentration from
the top of the greenhouse. In the ECS system, air is dried, CO2 is added, and temperature is regulated
before air again is recycled to the greenhouse. In this way, the air volume in the greenhouse is recycled
15 times per hour. The Environmental Control System provides for the first time in history a complete
control of the CO2 concentration in a (semi-) commercial greenhouse.
Year-round plant production in the north requires supplemental lighting, even in summertime. The
production of tomatoes in new production systems requires a new optimisation of plant properties to
exploit new opportunities for plant yield and fruit quality. Earlier experiments have shown that the
yearly tomato yield in Norway increased from 40 kg m-2 in a standard seasonal production to 120 kg m-
2 in an optimized year round production method (Verheul et al., 2012). In the Netherlands, a

production level of 80 kg m-2 per year is considered to be high, while a level of 20 kg m-2 and year is
high in Spain. In a year-round production system in Norway, tomatoes are normally planted with two
plantings a year and a plant density of four plants per m2.
Both high pressure sodium (HPS) lamps and systems with light emitting diodes (LED) are used as
supplemental light sources. HPS lamps are usually mounted 1.5 m above the canopy. An advantage of
LED systems is their low radiative heat emission, that allows to place the fixtures closer to the plants,
often between plant rows in vertically trained hedge grown crops like tomato and cucumber. Earlier
investigations have shown that including LED inter-light increases production dependent on the
amount of HPS top light (Verheul et al., 2021). Installing an amount of 60 W m-2 LED inter-light to an
installed amount of 161 W m-2 of HPS top-light increased tomato yield with about 23%. However, the
same amount of LED inter-light did not increase production when 242 W m-2 of HPS light was

10                                                                                      NIBIO REPORT X (X)
installed (Verheul et al., 2021). It was concluded that other factors than light became limited. The CO2
concentration in the greenhouse air might be such a factor.
The goal of the experiments presented in this report was to verify the GreenCap Solutions AS
Environmental Control System for the production and quality of greenhouse tomatoes. In order to
demonstrate effects of CO2 addition and the ECS system, we eliminated light as limiting factor by
including supplemental HPS top-light. Two experiments were performed in fully grown and producing
tomato crops: one in 2019 and one in 2020. In 2019, a traditional seasonal production system (1) was
compared to a traditional production system using supplemental high pressure sodium (HPS) lamps
as top-light (2) and a production system using supplemental HPS top-light, while regulated by the ECS
system (3). In 2020 the comparison of production system 2 and 3 was repeated, while testing
additional effects of plant density, LED inter-light, and defoliation strategies to assess their effects on
yield and quality. The inclusion of supplemental HPS top-light provided a more even and controlled
light environment and thus an ideal environment to verify the ECS system. Supplying and controlling
the CO2 concentration, temperature, and relative humidity in the greenhouse potentially result in
maximum photosynthesis where plant properties can be adjusted to attain maximum yield and quality.
We started to investigate strategies to achieve maximum yield and quality given the unique possibility
to control all factors in the photosynthesis process. High yields and quality will reduce the investment
costs per unity of product and thus give rise to increase the economic and environmental value of the
GreenCap Solutions AS ECS system.

Photo: GreenCap Solutions AS

NIBIO REPORT X (X)                                                                                       11
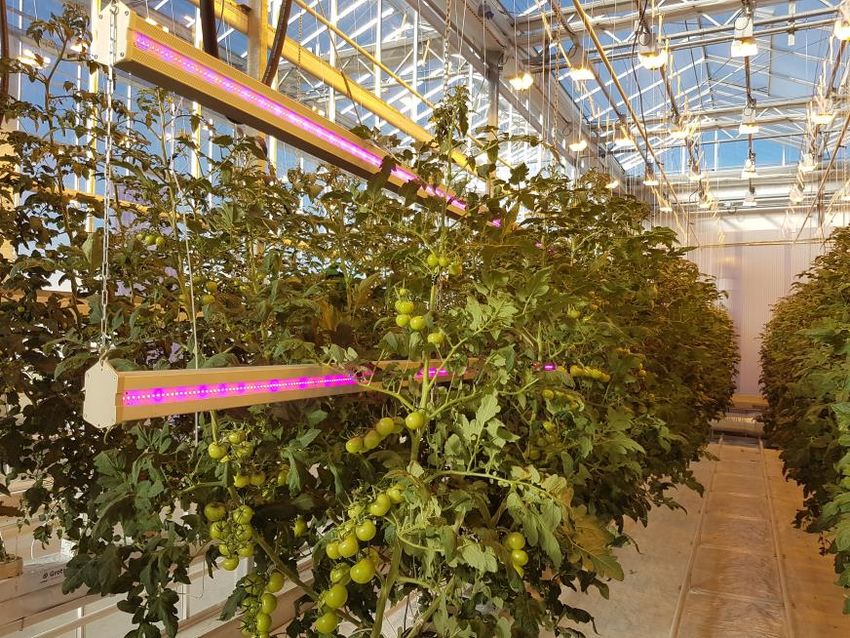
3 Materials and Methods
3.1 Experimental setup

The experiments were conducted in three identical and adjacent greenhouse compartments of each
224 m2 (17.5 m x 12.8 m) with a gutter height of 6.0 m in the research greenhouse facilities at NIBIO
Særheim, located in southwestern Norway (58o47’N, 5o41’E). One of the compartments was connected
to the GreenCap Solutions AS Environmental Control System (ECS). The greenhouse climate in the
two control compartments was regulated and controlled by a standard horticultural computer (Priva
Connext) and in the ECS compartment regulated by the ECS system with the standard horticulture
computer as a back-up. Climate conditions were registered every 5 minutes.

Photo 2: Tomato production in the research greenhouse compartment at NIBIO Særheim connected to the GreenCap
Solutions AS Environmental Control System (ECS). Photo: Michel Verheul, NIBIO.

We tested and verified the ECS system in fully grown and producing tomato crops in two experiments:
1.      2019: Comparison of (1) a traditional seasonal production system, (2) a traditional production
system using supplemental high pressure sodium (HPS) lamps as top-light and (3) a production

12                                                                                             NIBIO REPORT X (X)
system using supplemental HPS top-light, while regulated by the ECS system. In all three production
systems, parts of the plants were given supplemental light using light emitting diodes (LED), installed
between the plants (phot0 2). Comparison of the three production systems lasted from week 29-36 (8
weeks).
2.       2020: Comparison of (1) a tomato production using HPS supplemental light regulated by the
ECS system to (2) a control tomato production using HPS supplemental light regulated by a standard
horticultural computer (Priva Connext). In the production system regulated by the ECS system, we
tested additional effects of LED inter-light, plant density and defoliation strategies to assess their
effects on yield. Comparison of the two productions systems lasted from week 6 to week 39 (33 weeks)

3.1.1 Plant materials
For experiment 1, tomato plants (Lycopersicon esculentum Mill.), of a round variety ‘Dometica’ (Rijk
Zwaan) were raised in 0.5 L rockwool cubes and planted with a plant density of 4.0 plants per m -2 on
the 12th of March 2019, at the time that the 2nd truss reached anthesis.
For experiment 2, tomato plants (Lycopersicon esculentum Mill.), of the round varieties ‘Livento’ (Rijk
Zwaan) and ‘Caroleza’ (Enza Zaden), both grafted on rootstocks ‘DRO141TX’ (De Ruiter Seeds) giving
two stems per plant, were raised in 0.5 L rockwool cubes and planted with two different plant
densities, 5.44 stems or 6.93 stems per m-2, on the 7th of February 2020, at the time that the 2nd truss
reached anthesis. Plants were grafted on rootstocks to assure best possible root growth and water
uptake during the experiment that lasted 33 weeks.
The three tomato varieties used were all round tomato types that can be harvested individually or in
clusters. The varieties ‘Dometica’ and ‘Livento’ have comparable genetic backgrounds and are normally
harvested in Norway with an average fruit weight of 75-85 g. The variety ‘Caroleza’ has a different
genetic background and is normally harvested with an average fruit weight of 80-90 g. Plants of
‘Dometica’ and ‘Livento’ are characterised by vegetative growth that favours development of roots,
shoots and leaves for a strong plant structure and high assimilation. The variety ‘Caroleza’ is
characterised by a generative growth, favouring flowering and fruit formation. A balance between
vegetative and generative growth is needed in order to sustain tomato plant growth and productivity.
All plants were planted in the research greenhouse on standard rockwool slabs (90 cm x 10 cm x 15
cm) placed on gutters at 80 cm height from the ground floor. On each rockwool slab, eight plants were
planted and trained as a high wire culture in a V-row system (Peet and Welles, 2005). The distance
between rows was 90 cm and the distance between gutters was 180 cm.
Tomato flowers were pollinated by bumblebees from nests placed inside the greenhouse. Pollination
was checked daily. Plants were lowered weekly by 20-30 cm, side shoots were removed, and three
mature leaves were removed below the truss with fruits reaching turning stage (Gierson and Kader,
1986). The trusses were pruned to seven fruits per truss just after the fruit set of each truss.
In experiment 2, two defoliation strategies were used: (1) removal of one of three leaves between the
uppermost trusses on each stem, or (2) removal of three of six leaves between the two uppermost
trusses on each stem. Leaves were removed once a week, synchronized to a truss development rate of
approximately one per week, resulting in a number of leaves per truss of (1) 2 or (2) 1.5.
Plant vigour (stem diameter, increase in plant length, leaf length of the last fully developed leaf,
number of leaves on the plant) and fruit development (flowering rate, truss development rate, number
of trusses and fruits on the plant) was measured once a week on two replications of each six plants per
production system. Stem diameter was measured at plant height one week before, approximately 25
cm below the shoot apex.

NIBIO REPORT X (X)                                                                                      13
3.1.2 GreenCap Solutions AS Environmental Control System (ECS)
In experiment 1, the GreenCap Solutions AS Environmental Control System (ECS) was switched on in
week 23. Plant were allowed to acclimate during 6 weeks before yield registration. In experiment 2, the
GreenCap Solutions AS Environmental Control System (ECS) was switched on from the start of the
experiment. For further description of the ECS system: https://greencap-solutions.com

3.1.3 Light conditions
Plants were subjected to natural sunlight as well as two levels of high pressure sodium (HPS) lamps
(Philips GP Plus 600 and 750 W, Gavita Nordic AS, Norway), with an efficacy of 1.8 µmol
photosynthetic active radiation (PAR) per joule of electricity, mounted at a height of 6 meter, 1.5 meter
above the top of the canopy, and two rows of LED lamps (Union Power Star 160 W, Munich, Germany)
with 450 and 660 nm wavelength bands at a diode energy ratio of 20/80 and an efficacy of 2.2 µmol J-1
(Table 1). In 2020, Union Power Star 160 W LED lamps were replaced by Philips Greenpower 100 W
LED lamps (Philips Greenpower 100 W LED Interlight DRB HO 250cm GEN3) with an efficacy of 3.0
µmol J-1 (Table 2). LED lamps were installed between plants in a V-row system at two heights (65 and
130 cm from the rockwool block) (as shown in Paponov et al., 2020). Using this set-up, 97% of the
light from HPS and LED lamps is intercepted by the plants (Paponov et al, 2020).
In an establishing phase of four weeks after planting, plants were grown under sunlight and a
maximum of 12 hours of HPS lamps. HPS lamps were switched off automatically when the incoming
natural light intensity from outside the greenhouse was more than 300 W m-2. At the time that the top
of the plant reached the hight of 150 cm from the rockwool cube, part of the plants were also submitted
to LED lamps at two heights (65 and 130 cm from the rockwool block) switched on during 18h per day
(06:00-24:00). The daylength of HPS lamps was increased to maximum of 18h per day (06:00-24:00).
Global radiation was measured with a Kipp solarimeter. The daily light integral (DLI, mol m −2 d−1) for
global radiation was estimated based on a light efficacy of 2.2 μmol J-1 and a light transmission factor
of 0.65 from outside radiation to the top leaves of the crop due to the greenhouse cover and installed
lamps. Light intensity (PPFD: Photosynthetic Photon Flux Density) inside the greenhouse was
measured with an Apogee MQ 301 line quantum sensor (Apogee Instruments Inc.).

Table 1: Overview of the experimental setup for experiment 1 (2019). ECS: GreenCap Solutions AS Environmental Control
System, HPS: high pressure sodium lamps, LED: light emitting diodes.
       Production system                ECS                     HPS Top light                LED inter-light
                                                                242 W m-2 installed          60 W m-2 installed
1      Control                          No                      No                           Yes (+) or No (-)
2      Control + HPS                    No                      No                           Yes (+) or No (-)
3      ECS + HPS                        Yes                     Yes                          Yes (+) or No (-)

Table 2: Overview of the experimental setup for experiment 2 (2020) ECS: GreenCap Solutions AS Environmental Control
System, HPS: high pressure sodium lamps, LED: light emitting diodes.

14                                                                                                  NIBIO REPORT X (X)
Production system ECS HPS Top light LED inter-light Plant Leaves
(242 W m-2 (44 W m-2 density /truss
installed) installed) (Plants m-2)
1 Control No Yes No 5.44 2 or 1.5
2 ECS Yes Yes No 5.44 2 or 1.5
3 ECS + PD Yes Yes No 6.93 2 or 1.5
4 ECS + LED Yes Yes Yes 5.44 1.5
5 ECS + LED + PD Yes Yes Yes 6.93 1.5
3.2 Regulation of climatic conditions and irrigation
Temperature control:
Increased light intensity increases the optimal temperature for plant growth (Verheul et al, 2020). The
same might be expected for increased CO2 concentration. In order to secure optimum temperature for
the different production systems in the experiments, plant vigour was measured once a week on two
replications of each six plants for each production system. Temperature set points, including two
temperature levels during the day, a night drop after switching of the light for about two hours and
another temperature during the rest of the night, were adjusted each week for each compartment
based on plant vigour measurements. In order to keep a good vigour in each compartment, the
temperature was adjusted to keep the thickness of the stem, measured at the height of plants one week
before, in all production systems between 10 and 12 mm (Navarette et al., 1997).
Regulation of temperature, relative humidity and CO 2 concentration
The ECS system regulated temperature, relative humidity and CO2 concentration using predefined
setpoints. The temperature setpoints in experiment 1 were a day temperature of 24 oC (18 h), a pre-
night temperature of 18 oC (1.5 h) and a night temperature of 19 oC (4.5 h) giving a measured 24h
temperature of 23.8 oC. The temperature setpoints in experiment 2 were a day temperature of 25 oC
(18 h), a pre-night temperature of 17 oC (1.5 h) and a night temperature of 19 oC (4.5 h) giving a
measured 24h temperature of 23.2 oC. Control compartments were heated using conventional heating
pipes, and windows were opened and closed to regulate temperature and relative humidity. Ventilation
tubes were placed beneath the plants to ensure optimal stirring of the greenhouse air. In all
compartments, windows were opened at 1 oC above the temperature set point. Pure CO2 was supplied
with a maximum capacity of 125 kg ha-1 h-1 during daytime. In experiment 1, pure CO2 was provided
with a set point of 1000 ppm when the windows were closed. In experiment 2, CO2 was provided by the
ECS system with a setpoint of 900 ppm (from week 6 to week 17) that was adjusted to 1200 ppm (from
week 18 to week 39), supplemented with pure CO2 when necessary, when the windows were closed.
CO2 set point was reduced linearly depended on window opening to 600 ppm at maximum ventilation.
CO2 of greenhouse air was measured at 5 minutes interval with a gas analyser (Priva CO 2 monitor
Guardian +). Air temperature and relative humidity were measured by dry- and wet-bulb
thermocouples placed in ventilated boxes that shielded against direct solar radiation and placed in the
middle of the canopy at a height of 1.5 meter. Thermocouples were calibrated before the start and
controlled at the end of the experiment. Temperature (oC), relative humidity (%), CO2 concentration
(ppm) and window opening (%) were registered every 5 minutes. Heat energy consumption in each of
the three greenhouse compartments was measured with energy flow meters (Sontex Superstatic 789,
Sontex Switzerland).
Irrigation
NIBIO REPORT X (X) 15Plants were drip irrigated when necessary with a complete nutrient solution based on standardized recommendations (de Kreij et al., 1999) containing the following: 26.43 mM NO3, 1.68 mM NH4, 2.23 mM P, 8.72 mM K, 10.63 mM Ca, 2.71 mM Mg, 2.67 mM S, 0.3 mM Na, 0.1 mM Cl and micronutrients with the following concentrations: 63 µmol Fe, 27 µmol Mn, 10 µmol Zn, 68 µmol B, 6 µmol Cu and 1.6 µmol Mo. The electrical conductivity of the nutrient solution was 3.6 mS cm -1, the pH was 5.9, and the daily drainage percentage was 30%. Irrigation and drainage were registered continuously using a weighing scale (Priva GroScale) combined with a drainage sensor. 3.3 Plant care and plant vigour measurement Tomato flowers were pollinated by bumblebees from nests placed inside the greenhouse. Pollination was checked daily. Plants were lowered weekly by about 30 cm, side shoots were removed, and three mature leaves were removed below the truss with fruits reaching turning stage (Gierson and Kader, 1986). The trusses were pruned to seven fruits per truss just after the fruit set of each truss. No pests or diseases were observed. Plant vigour (stem diameter, increase in plant length, leaf length of the last fully developed leaf, number of leaves on the plant) and fruit development (flowering rate, truss development rate, number of trusses and fruits on the plant) was measured once a week on two replications of each six plants per production system. Stem diameter was measured at plant height one week before, approximately 25 cm below the shoot apex. Dry matter accumulation was assessed based on weekly measurements of plant length, number of leaves and number of fruits. The number of harvested leaves ware registered. During the experiments, ripened fruits and leaves were harvested for determination of fresh and dry weight (dried at 70°C for 96h) and leaf area (measured with a LiCor LI 3000 leaf area meter). Measurements were used to calculate specific leaf area (SLA, in m-2 leaf area g-1 dry weight) and leaf area index (LAI, in m2 leaf area m-2 floor area). 3.4 Harvest Harvesting of individual fruits started week 17 in 2019 (experiment 1) and week 13 in 2020 (experiment 2), 6 weeks after planting. The number and weight of fruits was measured for eight repetitions, each with twelve (experiment 1), 16 or 20 plants (experiment 2) for each production system. Ripened fruits, grade 8-9 on a colour scale from 1-12 (Bama AS), were harvested two times per week. Final destructive harvests were performed on 16 September 2019 (experiment 1) or 30 September 2020 (experiment 2) on ten randomly selected plants for each production system. All remaining fruits, leaves and stem were harvested for determination of fresh and dry weight (dried at 70°C for 96h) and leaf area (measured with a LiCor LI 3000 leaf area meter). Dry matter accumulation and distribution was calculated for plants at final harvest. Total dry matter production and distribution included dry matter of earlier harvested leaves and fruits. 3.5 Quality Analysis of Fruits Samples for fruit quality assessment were collected on 04.09.2019. Each sample consisted of twelve tomato fruits selected from the pool of fruits collected from plants for each individual production system. Tomatoes with equal size and ripeness grade 8 were chosen for further analysis. Ripeness of the harvested fruits was determined visually by using a colour scale from 1 – green to 12 - deep red (provided by Bama AS). 16 NIBIO REPORT X (X)
For each tomato, firmness was measured in scale from 1 to 100, where 100 - means full firmness and 1
- complete lack of firmness using a Durofel firmness tester (Agro Technologies, France). Each
individual fruit was measured at three locations on pericarp in the middle of fruit inner chambers.
Afterwards, each tomato was cut on four parts and homogenized with a handheld blender to the
uniform mixture. The fresh homogenized samples were used for estimation of soluble solid content
(SSC) and total titratable acidity (TTA). Measurements of firmness, SSC and TTA were performed the
same day as harvesting, following the procedures published by Mitcham and co-workers (Mitcham et
al. 1996; Verheul et al. 2015).
Soluble solid content (expressed as °Brix) was measured with a digital refractometer PR-101α
(ATAGO, Japan). Total titratable acidity was determined using an automatic titrator 794 Basic Titrino
(Metrohm, Switzerland) and expressed as percent of citric acid equivalents (CAE) per FW.

3.6 Statistics
Statistical differences in yield, plant characteristics and fruit quality parameters were evaluated using
general linear model (ANOVA) followed by Turkey`s multiple comparisons test using Minitab 19
software (Minitab Ltd, UK).

Photo: NIBIO

NIBIO REPORT X (X)                                                                                      17
4 Results and discussion
Results from experiment 1 and 2 show that the production system using the ECS system, in
comparison to standard control production systems, can regulate climatic conditions, like
temperature, CO2 concentration and relative humidity to an optimum level for production. By using
the ECS system, windows remained closed, CO2 concentration remained at a high level (1200 ppm), no
energy was lost, relative humidity was kept at a desired level of 75-85%, and temperature was
regulated independent of outside temperature and radiation to a level optimal for fruit production and
quality. All our observations confirm that the ECS system has worked properly as planned. The
Environmental Control System provides for the first time in history a complete control of the CO 2
concentration in a (semi-) commercial greenhouse. The inclusion of supplemental light and the control
on temperature, relative humidity and irrigation provides a situation that may result in maximum
photosynthesis where plant properties can be adjusted to attain maximum yield and quality.
The production of tomatoes in new production systems requires a new optimisation of plant properties
to exploit new opportunities for plant yield and fruit quality (Verheul et al., 2012). In the first
experiment in 2019, we compared yield and fruit quality in three production systems: (1) a traditional
seasonal production system, (2) a traditional production system using supplemental high pressure
sodium (HPS) lamps as top-light and (3) a production system using supplemental HPS top-light, while
regulated by the ECS system. In all three production systems, parts of the plants were given
supplemental light using light emitting diodes (LED), installed between the plants. Until now, the
production system 2 was regarded as an extremely high yielding production method, resulting in a
tomato yield of 120 kg m-2 and year in practical production (Verheul et al., 2012). Results of
experiment 1 show that, without optimisation of plant properties to production system 3, yield
increased from 1.63 kg m-2 week-1 in production system 1 to 2.81 kg m-2 week-1 in production system 2
and 3.14 kg m-2 week-1 in production system 3. Interestingly, yield in production system 3 increased to
3.43 kg m-2 week-1 by adding LED light between plants, while yield in production system 2 was
unaffected. A yield of 3.43 kg m-2 week-1 equals a year-round yield of 158 kg m-2 with 46 harvesting
weeks. Production systems 2 and 3 were repeated in experiment 2 in 2020. In addition, effects of plant
density and defoliation strategies were included to start optimizing plant properties to the ECS
production system. Again, LED inter-light was added in production system 3. Results from experiment
1 were confirmed in experiment 2. Again, yield increased, this time from 2.51 kg m-2 week-1 in
production system 2 to 2.93 kg m-2 week-1 in production system 3. Increase of plant density, a first
adaptation of the production system to the ECS production system, resulted in a yield of 3.28 kg m-2
week-1 in production system 3. Again, yield in production system 3 increased by addition of LED to
3,45 kg m-2 week-1. This was comparable to the results of 2019. In addition, a combination of LED and
an increase in plant density in production system 3 increased yield even to 3.65 kg m-2 week-1. This
represents a yield of 168 kg m-2 with 46 harvesting weeks. Other than expected, a reduction in the
leaf/truss ratio while using a high plant density reduced yield. Since the result of 3.65 kg m-2 week-1
was attained with a crop with less leaves, an even higher yield might be expected using a high density
crop with more leaves per plant. Results also show that fruit quality, size, and taste characteristics,
increased from production system 1 to 2 and 3.

18                                                                                    NIBIO REPORT X (X)
4.1 Experiment 1 (2019)

4.1.1 Climatic conditions
The average daily light integral (DLI) and the daily variation of light intensity (Photosynthetic Photon
Flux Density, PPFD) received by the plants from different light sources, is shown in Figure 1. During
week 29-36, the average DLI from global radiation, HPS and LED light received by the plants was
respectively 19.2, 18.6 and 8.4 mol m-2d-1. HPS light was used to compensate for a lack of solar
radiation during the beginning and end of the day and was minimal at noon. I sum, the total amount of
DLI from solar radiation and HPS light was 37.7 mol m-2d-1, enough to secure high photosynthetic
rates in tomato (Moe et al., 2005). LED light was applied with a constant daily amount, 18 hours a day,
as planned.
Other climatic conditions are shown in figure 2 and 3. The main difference between using ECS and the
other production systems was the high CO2 concentration in the air during the day in the ECS system.
Results also show that the windows remained closed when using the ECS system. In spite of this fully
closure of the windows, both temperature and relative humidity were kept on a constant level during
the day and switched quickly to the target setpoint level from day to night and from night to day. All
these observations confirm that the ECS system has worked properly as planned.
Temperature was regulated optimal regarding plant vigour. Stem diameter was used as a measure
(Navarette et al., 1997; Verheul et al., 2021), and temperature was regulated to keep a stem diameter in
all production systems between 10 and 12 mm. Addition of HPS light increased plant vigour, and a
higher air temperature was required, compared to production systems without HPS light, to keep the
stem diameter below 12 mm. The amount of solar energy reaching the plants during the weeks 29-36
required a considerable amount of ventilation to reduce air temperature for keeping stem diameter
above 10 mm, especially for plants in production systems without HPS light.
Relative humidity was kept between 70 and 85% in most cases. During the day, relative humidity was
kept most constant in the ECS production system. High levels of relative humidity in the morning in
the production systems without HPS light might reduce yield due to problems with grey mould
(Botrytis cinerea). Low levels of relative humidity at the end of the day in the production system with
HPS but without ECS may point to reduced transpiration and photosynthesis of plants.

4.1.2 Yield
Results of experiment 1 show that tomatoes grown in the Environmental Control System have
significantly higher yield compared to tomatoes grown under standard conditions (Fig 4a). Results
show also that addition of LED inter-light increases yield for tomatoes grown in the Environmental
Control System and in a standard production system without HPS top-light, but not in the standard
production system with HPS top-light (Fig4a).
The average fruit size in a tomato crop depends on genetic and environmental factors. Higher light
intensities and CO2 concentrations as well as lower plant densities will usually increase fruit size to a
genetic maximum. The average fruit weight for the variety ‘Dometica’ grown in Norway is 75-85 g.
Norwegian sales organisations consider round shaped fruits bigger than 47mm in diameter as 1st grade
fruits, while fruits less than 47 mm diameter are considered as 2nd grade fruits.
In this experiment, a higher yield was related to a higher number of 1st grade fruits (Fig 4b) and a
higher average fruit weight (Fig 4c). Tomatoes grown in the Environmental Control System obtained
the highest numbers of first grade fruits and the highest average fruit weights. In contrary, most 2 nd
grade fruits were counted in tomatoes grown in a standard production system without HPS top-light.

NIBIO REPORT X (X)                                                                                        19
This indicates that the chosen plant density (4 plants m-2) was too high for this production system with
only natural light and a CO2 concentration of 525 ppm. Indeed, a lower plant density is often chosen in
commercial greenhouses in Norway. Results show that adding LED inter-light to this production
system will increase fruit size and the number of 1st grade fruits and thus increases yield.
Tomatoes grown in a standard production system with HPS top-light received more light compared to
the standard production system without HPS top-light at otherwise comparable conditions (Fig 1,2,3).
This resulted in the present experiment in both a significant higher fruit size and fruit number, and
thus in a significant higher yield, compared to the standard production system without HPS top-light
(Fig 4). More light not only increased average fruit weight, but also increased the number of fruits on
the truss reaching 1st grade size.
Additional LED inter-light in the standard production system with HPS top-light had, however, no
significant effect on fruit size, fruit number and yield. Earlier investigations have already shown that,
in a standard production system with HPS top-light, the positive effect of supplemental LED inter-
light decreases at higher amounts of HPS top-light and is not significant at an installed amount of HPS
top-light of 242 W m-2 (Verheul et al., 2021).
Tomatoes grown in the Environmental Control System with HPS top-light received both more light
and more CO2 compared to the other production systems at otherwise comparable conditions
(Fig1,2,3). This resulted in the present experiment in both a significant higher fruit size and fruit
number, and thus in a significant higher yield, compared to the standard production system with HPS
top-light (Fig 4). More light and more CO2 not only further increased average fruit weight, but also
increased the number of fruits on the truss reaching 1st grade size. In contrary to the standard
production system with HPS top-light, additional LED inter-light in Environmental Control System
with HPS top-light resulted in a significant further increase in fruit number and yield. Obviously, CO 2
is the minimum factor for fruit number and yield at the investigated light levels. The use of the
Environmental Control System releases CO2 as minimum factor and results in high yields.

Figure 1: Light conditions at plant level in the greenhouse. Left: Weekly average for the daily light integral (DLI) for natural
irradiance (Global radiation) and light treatments with light-emitting diode (LED) inter-lighting (60 W m-2 installed) and high
pressure sodium (HPS) top-light (242 W m-2 installed). Right: Daily variation of the light intensity (Photosynthetic Photon
Flux Density, PPFD) of global radiation, LED and HPS light (on average for week 29-36).

20                                                                                                          NIBIO REPORT X (X)
Figure 2: Weekly averages for temperature (oC), relative air humidity (%), CO2 concentration (ppm) and ventilation opening
(% lee-side) in three tomato production systems in week 29-36.

Figure 3: Daily variations of temperature (oC), relative air humidity (%), CO2 concentration (ppm) and ventilation opening (%
lee-side) in three tomato production systems (average for week 29-36).

NIBIO REPORT X (X)                                                                                                         21
Total yield (g m-2 week-1):

       Control                                         e
                                                            d

 Control + HPS                                                                        c                             -LED
                                                                                          c
                                                                                                                    +LED
     ECS + HPS                                                                                    b
                                                                                                              a

                 0    500       1000          1500         2000           2500       3000              3500

                 Number of fruits > 47 mm(m-2 week-1):

       Control                       e
                                                       d

 Control + HPS                                                                   c                                  -LED
                                                                                     c
                                                                                                                    +LED
     ECS + HPS                                                                                     b
                                                                                                              a

                 0    5         10           15        20            25        30             35              40

                                Average fruit weight (g):

       Control                                                            d
                                                                                 c

 Control + HPS                                                                                b                     -LED
                                                                                              b
                                                                                                                    +LED
     ECS + HPS                                                                                        a
                                                                                                          a

                 0   10     20       30           40        50        60         70           80              90

                     Number of fruits
Figure 4: Yield and fruit quality (size) of greenhouse tomatoes grown in three different production systems with and without LED inter-light (Control: Standard production system without HPS top-light, Control + HPS: Standard production system with HPS top-light, and ECS + HPS: New production system with HPS top-light using the GreenCap Solutions AS Environmental Control System). Significance was confirmed by one-factor repeated-measures analysis of variance (ANOVA) at p < 0.05. Treatments with different letters are significant different. 4.1.3 Fruit Quality The soluble solid content (SSC), the total titratable acidity (TTA) and fruit firmness are key characteristics for tomato quality and can be related to the consumers perception of taste (Verheul, 2015). Results from the present experiment show that both HPS top-light and LED inter-light increased the SSC, despite an increased fruit size, while TTA was not affected (Table 4). This is confirmed in earlier experiments, that show that SSC and the ratio between SSC and TTA are increased due to increased light intensity from both HPS and LED lamps (Slimestad and Verheul, 2005; Pan et al., 2019; Kim et al., 2020; Verheul et al., 2021). Interestingly, TTA was significantly higher for tomatoes grown in the ECS production system compared to the control. Both high SSC and high TTA are related to better consumer perceptions of taste (Verheul, 2015). Fruit firmness decreased when HPS top light was used. This was confirmed in earlier investigations (Verheul et al., 2021). Decreasing values of fruit firmness from production system 1 to 6 might also be partly related to increased fruit size. Table 3: Tomato quality characteristics for fruits collected on 04.09.2019 grown in three different production systems. Significance was confirmed by one-factor repeated-measures analysis of variance (ANOVA) at p < 0.05. Treatments with different letters are significant different. Production system LED inter-light SSC (oBrix) TTA e Firmness (0-100) Control No 4,63 (c) 0,458 (b) 81 (b) Control Yes 4,91 (b) 0,473 (b) 84 (a) Control + HPS No 5,06 (ab) 0,479 (b) 78 (c) Control + HPS Yes 5,28 (a) 0,481 (b) 75 (d) ECS+HPS No 5,21 (a) 0,513 (a) 75 (d) ECS+HPS Yes 5,13 (ab) 0,513 (a) 73 (d) Photo: GreenCap Solutions AS NIBIO REPORT X (X) 23
You can also read