Task Force on Climate-related Financial Disclosures - Forward-Looking Financial Sector Metrics Consultation
←
→
Page content transcription
If your browser does not render page correctly, please read the page content below

Task Force on
Climate-related
Financial Disclosures
Forward-Looking Financial
Sector Metrics
Consultation

                            October 2020
Contents

A. Background and Purpose                                                                                    1

B. Scope and Approach                                                                                        2

C. Forward-Looking Financial Sector Metrics                                                                  3

1. Carbon and Emissions Metrics                                                                              4

2. Other Metrics                                                                                             5

3. Challenges of Forward-Looking Information                                                                 5

D. Metric for Consideration: Implied Temperature Rise                                                        7

1. Overview                                                                                                  7

2. Potential Benefits                                                                                        8

3. Current Challenges                                                                                        9

Appendix 1: Examples of Implied Temperature Rise Disclosure                                                 13

Appendix 2: Examples of Climate Value-at-Risk Disclosure                                                    18

Appendix 3: Glossary                                                                                        20

Appendix 4: References                                                                                      22

The Task Force gratefully acknowledges the work of Generation Investment Management’s David Blood
(Task Force Member), AXA’s Sylvain Vanston (Task Force Member), and the TCFD Secretariat’s Mara Childress
in the development of this consultation.
The Task Force on Climate-related Financial Disclosures

                            A. Background and Purpose
                            In its 2019 status report, the Task Force on                                      As anticipated, disclosure practices and the
                            Climate-related Financial Disclosures (Task Force                                 use of disclosures by financial market
                            or TCFD) identified specific areas it intended                                    participants have continued to evolve since 2017.
                            to explore to support implementation of its                                       In the context of a growing frequency of physical
                            disclosure recommendations, issued in June                                        climate-related impacts and the availability
                            2017.1 One of the areas was related to clarifying                                 of new research, tools, and resources
                            elements of the Task Force’s supplemental                                         for assessing climate-related risks and
                            guidance, which was issued at the same time as                                    opportunities, there is increasing interest in
                            its final recommendations in 2017.2 In reviewing                                  forward-looking climate-related information
                            financial institutions’ disclosure practices —                                    to inform financial decision-making.6, 7
                            especially as they relate to metrics and targets                                  Additionally, 120 countries plus the European
                            — and in consideration of market and industry                                     Union have announced that they are working
                            developments, the Task Force determined that                                      toward achieving net-zero greenhouse gas (GHG)
                            insights gained through a public consultation                                     emissions by 2050 — an indication of potential
                            on current options would be useful in better                                      shifts in business models and capital flows that
                            understanding the evolution of metrics and                                        the financial sector seeks to understand.8, 9
                            targets reporting by asset owners, asset
                            managers, banks, and insurance companies.                                         From October 29, 2020, to January 27, 2021,
                                                                                                              the Task Force will hold a public consultation
                            The Task Force's supplemental guidance for                                        on decision-useful, forward-looking metrics
                            the financial sector encouraged asset managers                                    to be disclosed by financial institutions. Several
                            and asset owners to disclose to their clients or                                  considerations for such metrics are described
                            beneficiaries, respectively, the metrics they use                                 in Section C. Forward-Looking Financial Sector
                            to assess climate-related risks and opportunities                                 Metrics, as context for the consultation.
                            as well as other metrics they believe are useful                                  In particular, a metric that has gained interest
Table of Contents           for decision-making.3 In addition, the Task Force                                 from the financial sector since the Task Force
                            recommended asset managers and asset owners                                       issued its supplemental guidance — referred
                            disclose a specific carbon footprint metric — the                                 to as “implied temperature rise associated with
A.                          weighted average carbon intensity.4 Importantly,                                  investments” (ITR) — is described at a high
Background and Purpose      when the Task Force issued its supplemental                                       level in Section D. Metric for Consideration:
                            guidance in 2017, it was aware of limitations                                     Implied Temperature Rise for consideration in
B.                          of carbon footprinting and intensity metrics                                      the consultation. The Task Force also seeks to
Scope and Approach          and viewed them as a first step in the                                            understand alternative forward-looking metrics
                            development of metrics for disclosure by                                          that could be disclosed by financial institutions
                            financial sector companies.5                                                      in line with the TCFD recommendations.
C.
Forward-Looking
Financial Sector Metrics

D.
Metric for Consideration:
Implied Temperature Rise

Appendices                  1
                                TCFD, 2019 status report, June 5, 2019.
                            2
                                TCFD, Implementing the Recommendations of the Task Force on Climate-related Financial Disclosures, June 29, 2017.
                            3
                                 he supplemental guidance also notes that asset managers and asset owners should provide a description of the methodology
                                T
                                used for the metrics disclosed.
                            4
                                 he Task Force recommended this metric be disclosed, where data are available or can be reasonably estimated, for each fund,
                                T
                                product, or investment strategy.
                            5
                                 he 2017 TCFD supplemental guidance for asset owners and asset managers stated: “The Task Force views the reporting of
                                T
                                weighted average carbon intensity as a first step and expects disclosure of this information to prompt important advancements in
                                the development of decision-useful, climate-related metrics.” It also noted that “Such [weighted average carbon intensity] metrics
                                should not necessarily be interpreted as risk metrics.”
                            6
                              Intergovernmental Panel on Climate Change, Global Warming of 1.5°C: Summary for Policymakers, World Meteorological
                            Organization, October 2018.
                            7
                                Boyd, Emma Howard, “Climate Change: Is Your Equities Portfolio Too Hot to Touch?,” Financial Times, July 16, 2019.
                            8
                                 OP25 Chile UN Climate Change Conference, Climate Ambition Alliance: Nations Renew their Push to Upscale Action by 2020
                                C
                                and Achieve Net Zero CO2 Emissions by 2050, December 11, 2019.
                            9
                                 ewClimate Institute, Germanwatch, and 2° Investing Initiative, Developing Criteria to Align Investments with 2°C Compatible Pathways,
                                N
                                May 2015.
                                                                                                                                                                          1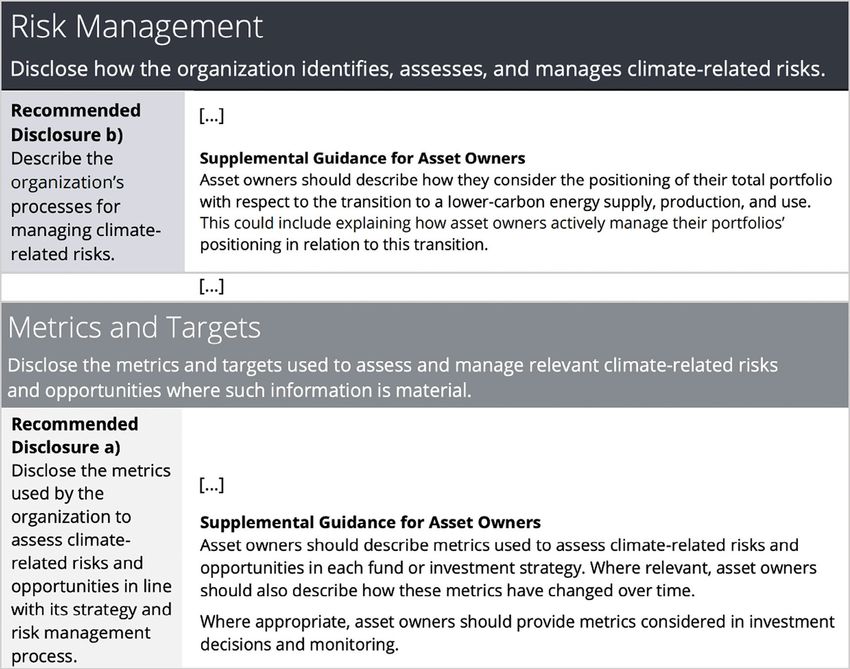
The Task Force on Climate-related Financial Disclosures

                            B. Scope and Approach
                            In response to growing interest and new                   investors that disclose forward-looking
                            disclosure from several large institutional               climate-related metrics to better understand
                            investors, the Task Force formed a working                available metrics and the potential benefits and
                            group to consider the benefits and challenges             challenges of disclosure. Finally, the working
                            of disclosure of implied temperature rise and             group developed a set of questions for public
                            other forward-looking climate-related metrics.            consultation, to ensure that a broad range of
                            The Task Force members participating in the               perspectives inform the Task Force’s future work.
                            working group contributed expertise from asset            The Task Force will take consultation responses
                            management firms, pension funds, banks, and               into consideration to determine whether further
                            credit rating agencies.                                   TCFD financial sector guidance on forward-
                                                                                      looking metrics is needed.
                            Working-group members spoke to several
                            methodology providers and institutional

                             Box B1
                             TCFD Public Consultation
                             The Task Force's 90-day public consultation solicits input on forward-looking climate-related metrics for the
                             financial sector. The consultation asks questions about the usefulness and challenges of such metrics and
                             what may be necessary to enhance their comparability, transparency, and rigor. The Task Force encourages
                             the public to respond to the consultation at fsb-tcfd.org between October 29, 2020, and January 27, 2021.

Table of Contents

A.
Background and Purpose

B.
Scope and Approach

C.
Forward-Looking
Financial Sector Metrics

D.
Metric for Consideration:
Implied Temperature Rise

Appendices

                                                                                                                                             2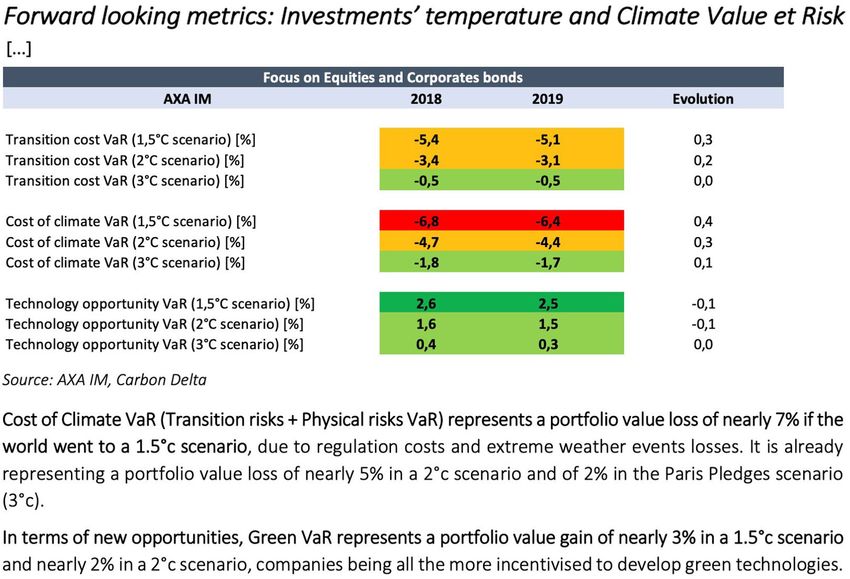
The Task Force on Climate-related Financial Disclosures

                            C. Forward-Looking Financial Sector Metrics
                            Through public consultation, the Task Force aims                               Investors and other users of disclosure rely on
                            to better understand the evolution of metrics                                  climate-related metrics to better understand
                            used and disclosed by companies in the four                                    risk and evaluate progress toward established
                            financial groups that were identified in its 2017                              targets and objectives.10 They may also use
                            supplemental guidance: asset owners, asset                                     select metrics for discussion and engagement
                            managers, banks, and insurance companies.                                      with portfolio companies. The absence of
                            Such metrics may focus on carbon and other                                     widely available, high-quality historical climate-
                            emissions or other financially relevant factors.                               related information contributes to the need for
                            Figure C1 provides excerpts of the Task Force’s                                better forward-looking approaches. In addition
                            guidance for asset owners on metrics used to                                   to private sector innovation for metrics to
                            assess climate-related issues and how they                                     better understand climate-related financial
                            consider forward-looking information on a lower-                               impacts, there are increasing regulatory
                            carbon transition.

                            Figure C1

                            Excerpt of TCFD Guidance for Asset Owners

Table of Contents

A.
Background and Purpose

B.
Scope and Approach

C.
Forward-Looking
Financial Sector Metrics

D.
Metric for Consideration:
Implied Temperature Rise

Appendices

                            TCFD, Implementing the Recommendations of the Task Force on Climate-related Financial Disclosures, p. 36

                            Note: Some content has been removed, denoted by […].

                            10
                                  he Task Force recommends that organizations disclose metrics used to assess climate-related risks and opportunities in line with
                                 T
                                 their strategy and risk management processes, under Metrics and Targets a), as well as the targets used to manage climate-related
                                 risks and opportunities, under Metrics and Targets c), where material, historical, and forward-looking metrics can serve as key
                                 inputs for an organization’s target setting and for evaluating progress against those targets over time.
                                                                                                                                                                      3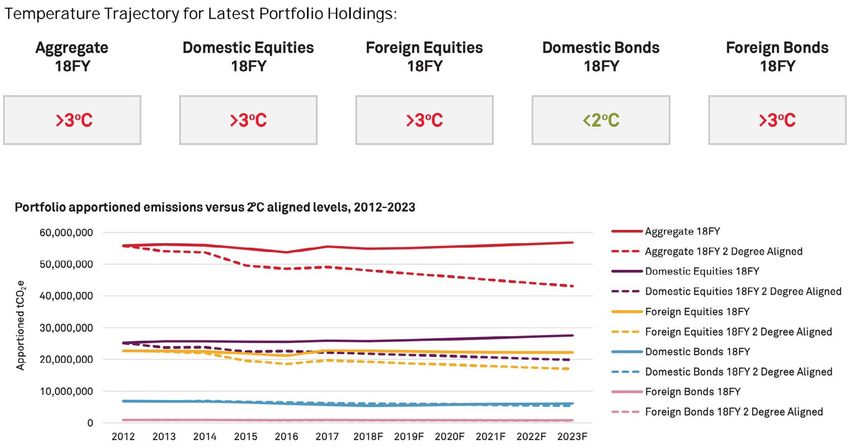
The Task Force on Climate-related Financial Disclosures

                            expectations for firms to demonstrate a forward-                                   with international climate agreements and
                            looking understanding of climate-related risk.11                                   national policy goals. For example, in December
                                                                                                               2019, 120 countries and the European Union
                            It is important to note that, similar to the use of                                announced that they are working to achieve
                            multiple traditional financial valuation metrics                                   net-zero emissions by 2050 — an early indication
                            in mainstream financial decision-making, no                                        of potential future policy and regulatory changes
                            single climate-related metric can fully describe                                   for companies in those jurisdictions.12
                            the position of a company, product, fund, or
                            investment strategy in relation to climate. The                                    Even today’s highest-emitting companies could
                            metrics explored in the consultation would                                         take actions to significantly alter their future
                            be intended to complement, not replace,                                            emissions trajectories, and consequently the
                            existing disclosures in alignment with the TCFD                                    relevant climate-related risks and opportunities
                            recommendations. The Task Force welcomes                                           they face. Many investors and other users of
                            input on all forward-looking metrics that could                                    disclosure therefore seek to better evaluate
                            help to better inform capital allocation decisions.                                how carbon exposures associated with their
                                                                                                               investments could evolve over time.

                                                                                                               As described in Section D. Metric for
                            1. CARBON AND EMISSIONS METRICS                                                    Consideration: Implied Temperature Rise, a
                                                                                                               few large financial institutions have started to
                            Weighted average carbon intensity and other
                                                                                                               calculate and disclose an “implied temperature
                            carbon footprinting metrics provide some
                                                                                                               rise” associated with investments. This is one
                            visibility into the carbon exposure of certain
                                                                                                               approach to considering the position of their
                            assets at a fixed point in time. Although still
                                                                                                               assets in relation to the transition to a lower-
                            useful for decision-making, past carbon
                                                                                                               carbon economy. Other financially focused
                            exposures provide little insight into potential
                                                                                                               approaches may relate to potential costs
                            future exposure. This is particularly the case
                                                                                                               associated with carbon emissions, such as
                            as a growing number of companies are
                                                                                                               unpriced carbon cost or carbon earnings at risk.14
                            announcing planned changes to products,
                            strategies, and future emissions targets in line
Table of Contents

A.
Background and Purpose
                            “Emissions are a prime driver of rising global temperatures
                            and, as such, are a key focal point of policy, regulatory, market,
B.                          and technology responses to limit climate change. As a result,
Scope and Approach
                            organizations with significant emissions are likely to be impacted
                            more significantly by transition risk than other organizations.
C.
Forward-Looking             In addition, current or future constraints on emissions, either
Financial Sector Metrics    directly by emission restrictions or indirectly through carbon budgets,
                            may impact organizations financially.” 13
D.
Metric for Consideration:
Implied Temperature Rise

Appendices

                            11
                                  or example, the Monetary Authority of Singapore released consultation papers for banks, asset managers, and insurance companies
                                 F
                                 in June 2020, which included proposed requirements on forward-looking climate-related tools and metrics. An excerpt from the
                                 consultation for banks is as follows: “4.5 At the portfolio level, MAS proposes for the bank to develop tools and metrics to monitor
                                 and assess its exposures to environmental risk. For example, these metrics may be used to assess the bank’s portfolio exposures
                                 to geographical areas and sectors with higher environmental risk, measure the carbon intensity of customers in high-risk sectors,
                                 or consider the impact of environmental risk on its collateral valuations. MAS also proposes for the bank to develop capabilities in
                                 scenario analysis and stress testing to assess the impact of environmental risk on its risk profile and business strategies, and explore
                                 its resilience to financial losses. These scenarios should incorporate forward-looking information to complement historical data, as the
                                 latter might systemically underestimate potential risks, in view of the uncertainties and long-term horizon associated with changes in
                                 the environment.” Monetary Authority of Singapore, Proposed Guidelines on Environmental Risk Management (Banks), 2020.
                            12
                                  OP25 Chile UN Climate Change Conference, Climate Ambition Alliance: Nations Renew their Push to Upscale Action by 2020 and Achieve Net
                                 C
                                 Zero CO2 Emissions by 2050, December 11, 2019.
                            13
                                 TCFD, Implementing the Recommendations of the Task Force on Climate-related Financial Disclosures, 2017, p. 17.
                            14
                                 S&P Global, Trucost Carbon Earnings at Risk: Forward-looking Estimates of Financial Risk, 2019.
                                                                                                                                                                            4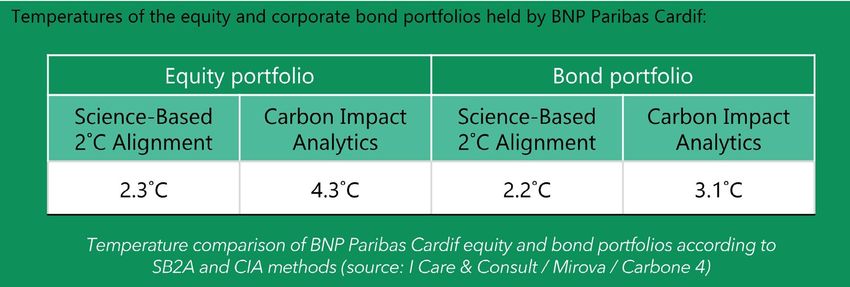
The Task Force on Climate-related Financial Disclosures

                                                                                                                 aligned” products includes forward-looking
                            2. OTHER METRICS                                                                     assessments of “transition” activities as defined
                            Financial sector organizations may also use                                          by the Taxonomy.
                            forward-looking metrics to assess climate-related
                                                                                                                 Similarly, the 2020 consultation on the European
                            risk and opportunity outside of carbon exposure.
                                                                                                                 Central Bank’s Guide on climate-related
                            Other forward-looking metrics could focus on
                                                                                                                 and environmental risks notes that financial
                            physical climate-related risk, future valuations of
                                                                                                                 institutions are expected to disclose “the amount
                            specific assets, and applications of climate within
                                                                                                                 or percentage of carbon-related assets in each
                            more traditional financial valuation metrics.
                                                                                                                 portfolio in € millions or as a percentage of
                            One example of a forward-looking financial                                           the current portfolio value and, to the extent
                            metric is climate Value-at-Risk (climate VaR).                                       possible, a forward-looking best estimate of this
                            Value-at-Risk metrics are estimates of the risk of                                   amount or percentage over the course of their
                            loss for investments and have become standard                                        planning horizon [emphasis added].”18 Other
                            for measuring financial risk.15 VaR is calculated                                    Metrics may emerge as outputs from climate-
                            by assessing the amount of a potential loss,                                         related scenario analysis and stress testing that
                            the probability of occurrence for the amount of                                      are integrated into financial stability monitoring
                            loss, and the relevant timeframe. Climate VaR                                        and supervision.19
                            aims to assess potential financial sensitivity to
                            climate-related risks and opportunities, with an
                            output expressed as a numeric value or range                                         3. CHALLENGES OF FORWARD-LOOKING
                            in a selected currency. For example, in 2016,                                        INFORMATION
                            one study used integrated assessment models
                            to estimate that the “expected [climate VaR] of                                      Certain challenges might limit the extent to
                            global financial assets today is 1.8% [or US$2.5                                     which current forward-looking metrics are useful
                            trillion] along a business-as-usual emissions                                        for financial decision-making — and necessitate
                            path. However, the 99th percentile climate                                           further innovations or refinements to make such
                            VaR is 16.9%, or US$24.2 trillion.”16 Additional                                     metrics more suitable and robust. In particular:
                            information on Climate VaR and examples of
Table of Contents                                                                                                • Lack of Reliable Emissions Data. Poor
                            disclosure are provided in Appendix 2: Examples
                            of Climate Value-at-Risk Disclosure.                                                   quality and availability of historical emissions
A.                                                                                                                 data is currently a significant obstacle to
Background and Purpose      Public sector efforts to better understand                                             the calculation of carbon-related metrics.
                            climate-related risks within the financial system                                      For example, the share of MSCI world index
                            may also lead to greater disclosure of forward-                                        companies — collectively around 60% of
B.
                            looking metrics. The European Union’s Taxonomy                                         world market capitalization — that disclose
Scope and Approach
                            Regulation for environmentally sustainable                                             their GHG emissions has stalled at around
                            activities (Taxonomy) requires “financial market                                       50% in recent years.20 CDP currently provides
C.                          participants offering financial products in the                                        estimated data for around a third of the Scope
Forward-Looking             EU” to disclose a metric on “the proportion of                                         1 GHG emissions and slightly more than half
Financial Sector Metrics    underlying investments that are Taxonomy-                                              of Scope 2 GHG emissions from the over
                            aligned, expressed as a percentage of the                                              5,000 companies it covers.21 In particular, few
                            investment, fund or portfolio.”17 Under the                                            companies report Scope 3 GHG emissions,
D.
Metric for Consideration:   regulation, the determination of “taxonomy-                                            although they could account for more than
Implied Temperature Rise

Appendices

                            15
                                 Jorion, Phillipe, How Informative Are Value-at-Risk Disclosures?, The Accounting Review, October 2002.
                            16
                                  ietz, Simon; Bowen, Alex; Dixon, Charlie; and Gradwell, Phillip, ‘Climate Value at Risk’ of Global Financial Assets, Nature Climate Change,
                                 D
                                 676–679, 2016.
                            17
                                  uropean Parliament and the Council of the European Union, “Regulation (EU) 2020/852 of the European Parliament and of the Council
                                 E
                                 of 18 June 2020 on the establishment of a framework to facilitate sustainable investment, and amending Regulation (EU) 2019/2088,”
                                 Official Journal of the European Union, June 18, 2020.
                            18
                                  uropean Central Bank, Guide on climate-related and environmental risks: Supervisory expectations relating to risk management and
                                 E
                                 disclosure, May 2020.
                            19
                                  ee, for example, the Bank of England’s Discussion Paper on a biennial exploratory scenario for climate-related risk and the climate
                                 S
                                 scenarios produced by the Central Banks and Supervisors’ Network for Greening the Financial System.
                            20
                                 Climate Finance Leadership Initiative, Financing the Low-Carbon Future, 2019.
                            21
                                 CDP, CDP Full GHG Emissions Dataset 2019 Summary, 2019.
                                                                                                                                                                                 5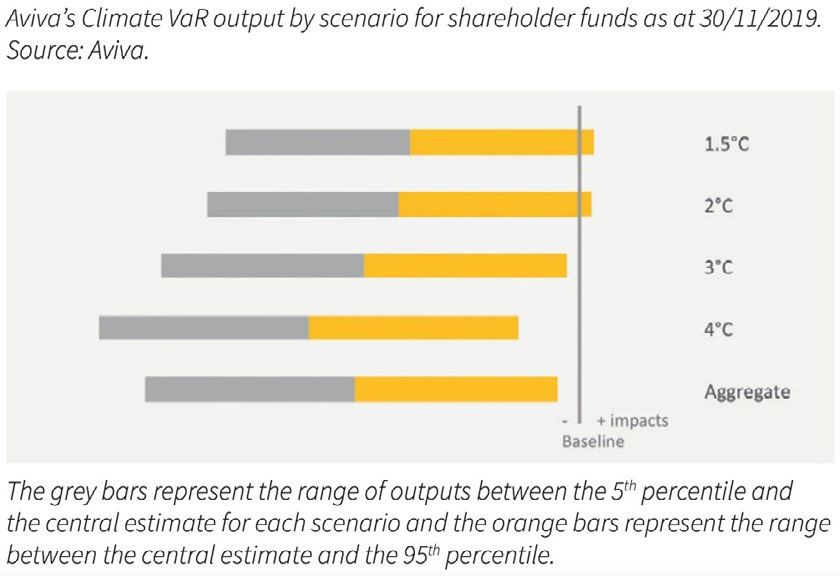
The Task Force on Climate-related Financial Disclosures
50% of the carbon footprint for companies in of jurisdictions offer safe-harbor protections for
many industries.22, 23 Many forward-looking forward-looking disclosures made in good faith
carbon and emissions metrics rely on past using the best information reasonably available
GHG emissions data to estimate future trends at the time.25
and, therefore, a lack of historical data can
exacerbate uncertainty in future assumptions. • Complexity of Calculation. Until other
Conversely, when including all scopes of GHG challenges are addressed, there may be a large
emissions in calculations related to a range of resource burden associated with calculating
companies across a portfolio, investors and and disclosing forward-looking metrics, which
others must often take precautions to avoid often require the assistance of one or more
double or triple counting of emissions, which external data and methodology providers.
could overstate potential climate-related risk.24
• Suitability for Public Disclosure. Financial
• Lack of Transparency and Comparability. sector organizations may use several forward-
Many forward-looking methodologies are new looking metrics in various states of maturity
and evolving, and there is little transparency as inputs to capital allocation decisions.
from methodology providers on how they However, while useful internally, those
are calculated or compare to each other. metrics may be considered proprietary or
Where methodologies are publicly described, may not meet an organization’s quality
differences across data providers can still standard for public disclosure.
make resulting disclosures difficult to compare
Similar challenges are relevant to forward-
for investors and others evaluating climate
looking climate assessments outside of metrics.
exposure across their holdings. For forward-
However, the disclosures resulting from those
looking metrics to be more useful in financial
assessments can still be useful. For example, in
decision-making, disclosure must be based on
its recommended disclosure Strategy c) the Task
transparent and comparable methodologies.
Force recommends that organizations describe
• Reliance on Assumptions and Future the resilience of their strategy, taking into
Uncertainty. Calculations of forward-looking consideration different climate-related scenarios,
Table of Contents metrics are complex and require many including a 2°C or lower scenario. Climate-related
methodological choices and assumptions. scenario analysis has become more widely used
Some assumptions attempt to compensate and robust since the Task Force released its
A. recommendations in 2017. In a 2019 TCFD survey
for existing data gaps, such as past emissions
Background and Purpose on effective disclosure aligned with the TCFD
trends or comparable and reliable company-
specific targets. Other assumptions rely on recommendations, a select group of expert
B. climate scenarios and transition pathway users most often rated disclosure aligned with
Scope and Approach models, the details of which can vary widely Strategy c) “Very Useful.”26
despite representing similar outcomes. In
Greater availability of high-quality emissions
particular, uncertainty around future climate-
C. data, future climate-related targets and
Forward-Looking related policy can contribute to greater
strategies, and convergence around business-
Financial Sector Metrics variation in transition pathway models.
relevant climate-related scenarios or transition
pathways are needed to serve as a foundation
Even with perfect historical information and
D. for developing more forward-looking metrics
mature, widely accepted, and transparent
Metric for Consideration: that are useful for financial decision-making.
methodologies, assessing potential future
Implied Temperature Rise The Task Force encourages further work in these
outcomes remains an uncertain exercise. It
areas and welcomes insights on how challenges
is important to note that forward-looking
related to forward-looking financial sector
Appendices disclosures are not intended to be exact
metrics could be addressed.
predictions or forecasts that would expose an
organization to litigation risk. In fact, a number
22
ccording to data available through the Bloomberg Professional Service, only 8% of the nearly 11,500 companies in the BESGPRO Index
A
report Scope 3 GHG emissions.
23
Kepler Cheuvreux, Carbon Compass: Investor Guide to Carbon Footprinting, November 23, 2015, pp. 20–23.
24
In addition, emissions-focused metrics may lead to emphasis from clients or other stakeholders on near-term reductions in the metrics
and, consequently, incentivize divestment over engagement to achieve those reductions quickly.
25
taker, Alexia; Garton, Alice; and Barker, Sarah, Concerns misplaced: Will compliance with the TCFD recommendations really expose companies
S
and directors to liability risk?, Commonwealth Climate and Law Institute, September 2017, pp. 10–11.
26
TCFD, 2020 status report, November 2020.
6
The Task Force on Climate-related Financial Disclosures

                               D. Metric for Consideration:
                               Implied Temperature Rise
                               A new climate-related metric that several                                                 degree rating, ITR incorporates current GHG
                               institutional investors have begun to use and                                             emissions or other data and assumptions to
                               disclose is implied temperature rise (ITR).27                                             estimate expected future emissions associated
                               Implied temperature rise metrics aim to provide                                           with the selected entities. Then, the estimate
                               a forward-looking view of carbon exposure that                                            is translated into a projected increase in
                               can be applied to a wide range of industries,                                             global average temperature (in °C) above
                               companies, and asset classes.                                                             preindustrial levels that would occur if all
                                                                                                                         companies in corresponding sectors had the
                               In its consultation, the Task Force seeks broad                                           same carbon intensity as the selected asset(s).
                               input on whether, and how, ITR disclosure would
                               be useful in financial decision-making. It also                                           The ITR metric is expressed in a single
                               seeks input on which types of organizations                                               temperature unit or range that is comparable
                               might disclose ITR, which types of investments                                            to widely understood potential climate
                               an ITR disclosure could address, as well as its                                           outcomes (e.g., 1.5°C, 2°C, 3.5°C). As
                               limitations, potential challenges, and what might                                         summarized in Appendix 1: Examples of
                               be needed to improve its usefulness.                                                      Implied Temperature Rise Disclosure, a few
                                                                                                                         large asset owners and asset managers
                                                                                                                         currently disclose the implied temperature
                                                                                                                         rise of their portfolios. The extent to which ITR
                               1. OVERVIEW                                                                               is forward-looking depends on whether the
                               An implied temperature rise metric attempts to                                            calculation methodology uses only historical
                               estimate a global temperature rise associated                                             emissions data or if it also takes projected
                               with the greenhouse gas emissions of a single                                             GHG emissions into account. An example of
Table of Contents              entity (e.g., a company) or a selection of entities                                       disclosure on implied temperature rise over
                               (e.g., those in a given investment portfolio, fund,                                       two years is provided in Figure D1.

A.                             or investment strategy). Expressed as a numeric
Background and Purpose

B.
Scope and Approach             Figure D1

                               Example of Implied Temperature Rise Disclosure
C.
Forward-Looking
                                                5.0
Financial Sector Metrics                                                                                                                                               4.6°C 4.6°C

                                                                                                                      4.0°C 4.0°C
                                                4.0
                                                                                                                                                    3.5°C 3.6°C
                            Warming Potential

D.
Metric for Consideration:                               2.9°C 2.8°C        3.0°C 3.0°C          3.0°C                               2.9°C 2.8°C
                                                3.0                                                     2.8°C
Implied Temperature Rise
                                                2.0
Appendices
                                                1.0

                                                      AXA Corporate       Benchmark          AXA Sovereign   Benchmark    AXA Aggregate            Benchmark         AXA Divested
                                                         Assets           Corporate              Debt      Sovereign Debt                          Aggregate          Coal Assets
                                                                            Assets

                                                 2018        2019

                                                 AXA, 2020 Climate Report: renewed action in a time of crisis, p. 2

                               27
                                        he ITR metric may be referred to by other names including portfolio warming, warming potential, degree warming, portfolio alignment,
                                       T
                                       portfolio temperature, and temperature score.
                                                                                                                                                                                     7
The Task Force on Climate-related Financial Disclosures
While ITR can be used as an impact metric Disclosure by different types of organizations
or communication and engagement tool, its within the financial sector may align with
disclosure could also provide insight on climate- different user needs as follows:
related risks and opportunities associated with
select assets to better inform capital allocation • Disclosure by Asset Owners. Whether
decisions. In alignment with the Task Force’s asset owners invest directly or through asset
supplemental guidance, a few asset owners that managers, they bear the outcomes of climate-
currently consider ITR “in investment decisions related transition and physical risks to which
and monitoring” or “the positioning of their their investments are exposed. Similarly, asset
total portfolio with respect to the transition owners can benefit from the potential returns
to a lower-carbon energy supply, production, on the investment opportunities associated
and use,” including how they “actively manage with a low-carbon transition. Climate-related
their portfolios’ positioning in relation to this disclosure by asset owners allows beneficiaries
transition,” have begun to disclose ITR.28, 29 and other audiences to assess the asset
owners’ investment strategies and approaches
However, the ITR metric is new and still evolving. to managing their portfolios.
There are several technical and methodological
challenges related to calculating ITR, no ITR disclosure could help asset owners’
commonly agreed terminology to refer to the beneficiaries make a forward-looking
metric, and little understanding of advancements assessment of an asset owner portfolios’
that would be needed to improve the usefulness exposure to climate-related risks, their
of ITR disclosures. ability to capitalize on opportunities in the
low-carbon transition over time, and overall
investment strategy. Moreover, asset owners
sit at the top of the investment chain and
2. POTENTIAL BENEFITS therefore their disclosure of ITR may encourage
Based on input from several institutional investors better forward-looking disclosure across the
that use and disclose implied temperature rise, as investment chain, from other asset owners,
well as data and methodology providers, the Task asset managers, and underlying companies.
Table of Contents An example of an asset owner’s perspective
Force understands that ITR disclosure has the
potential to be useful in several ways. Appendix 1: on its ITR disclosure is described in Figure
A. Examples of Implied Temperature Rise Disclosure A1-1 (p. 13) in Appendix 1: Examples of Implied
Background and Purpose describes perspectives on the ITR metric from an Temperature Rise Disclosure.
asset owner and two insurance companies that
• Disclosure by Asset Managers. Asset
disclose ITR metrics.
B. managers’ clients, as owners of the underlying
Scope and Approach assets within a portfolio, bear the potential
Proponents of ITR disclosure note that it could
represent a proxy for climate-related transition transition and physical risks to which their
C. risks or opportunities associated with a selected investments are exposed. Similarly, they
Forward-Looking portfolio, fund, or investment strategy. For enjoy the potential returns on opportunities
Financial Sector Metrics example, ITR disclosure could inform the position associated with the transition to a lower-carbon
of an investment in relation to 1.5–2°C legislation economy. Clients and shareholders of asset
and targets, or assist users with identifying managers may use ITR disclosures as a proxy
D. to evaluate potential climate-related risks
Metric for Consideration:
investment opportunities in line with their own
objectives. ITR disclosure could help the clients and opportunities within portfolio allocation
Implied Temperature Rise decisions or as a key performance indicator
and beneficiaries of financial institutions assess
strategic resilience and inform investment within an investment mandate.
Appendices strategies and portfolio allocation. ITR ratings
provided over time could also provide insight As major clients of asset managers, asset
into progress against strategic objectives or owners may depend on information from
targets. Although the underlying calculations asset managers to calculate and disclose
can be complex, the output could be used as a their own ITR assessment. An example of
directional indicator when compared to national disclosure on the implied temperature rise of
emissions policies or commitments. a shareholder equity portfolio is described in
Figure A1-2 (p. 14) in Appendix 1: Examples of
Implied Temperature Rise Disclosure.
28
TCFD, Implementing the Recommendations of the Task Force on Climate-related Financial Disclosures, 2017, p. 17.
29
Novethic, 173 Shades of Reporting: Climate Spin-Off Season III, 2019.
8The Task Force on Climate-related Financial Disclosures
• Disclosure by Banks and Insurance - Some methodologies use company-specific
Companies. Banks and insurers serve a historical emissions data while others take a
variety of beneficiaries and stakeholders, “top-down” approach to allocate emissions
some of whom could use disclosure of ITR as based on sectoral or geographical data.
a directional proxy for exposure to climate-
related risks. As such, disclosure of ITR by - Methodologies vary in their use of Scope 1,
banks and insurers could also indicate how Scope 2, and/or Scope 3 GHG emissions. Some
well positioned these institutions are to capture use only Scope 1 data, while others use Scope
opportunities for the transition to a low-carbon 1 and 2, and yet others take Scope 1, 2, and 3
economy. Users of disclosure must be able GHG emissions into account.
to distinguish among banks’ and insurance
- Certain methodologies take cumulative
companies’ exposures and risk profiles to
historical GHG emissions into account while
make informed financial decisions.30
others incorporate point-in-time assessments
However, current disclosures from banks
of emissions intensity.
and insurance companies often omit key
parts of the business, for example capital - Some methodologies incorporate company-
market financing for banks and underwriting specific future emissions targets, while others
portfolios for insurers. In part, this is due to take a “top-down” approach to estimate future
a lack of consistent ITR methodologies for emissions based on sector or geography. Of
lending and insurance portfolios. those that incorporate emissions targets,
there are different criteria for the types of
targets that can and cannot be used.
3. CURRENT CHALLENGES
- Methodologies may incorporate different
While ITR may have potential to be an climate-related scenarios or emissions
informative metric, its calculation, disclosure, and pathways, or even utilize internal proprietary
use are currently subject to several significant future emissions pathways.
challenges. Implied temperature rise is a newly
- Certain methodologies may be better suited
Table of Contents
developed metric and therefore methodologies
to assessing certain asset classes and may
and approaches are still evolving. Further work
vary in whether some asset classes are able to
and input from preparers and users of disclosure
A. be assessed at all.
will likely be needed to improve its quality and
Background and Purpose availability. In addition to challenges generally Different methodologies will lead to different
applicable to forward-looking metrics described ITR estimates that are not directly comparable.
B. in Section C.3. Challenges of Forward-Looking Variations in methodologies may also lead to
Scope and Approach Information, ITR disclosure is currently subject under- or overestimates of implied temperature
to the following: rise, and consequently an exaggerated
C. indication of climate-related risk.
• Variation in Approaches and Outcomes.
Forward-Looking In response to recent interest in ITR, several
Financial Sector Metrics NGOs and companies — including 2° Investing
Initiative, Arabesque, Carbon Delta, CDP, MSCI,
D. Science Based Targets Initiative, and Trucost
Metric for Consideration: — are developing a range of ITR calculation
Implied Temperature Rise methodologies. The methodologies vary widely
in their approaches, for example:
Appendices
30
TCFD, Implementing the Recommendations of the Task Force on Climate-related Financial Disclosures, 2017, p. 23.
9The Task Force on Climate-related Financial Disclosures
• Coverage Limitations. Currently, calculation
of ITR seems to be feasible only for certain
carbon-intensive sectors (e.g., utilities, oil
and gas, and road transport) or specific asset
classes rather than for a fully diversified
portfolio. For example, of the ITR disclosure
examples provided in Table A1-1 (p. 13) of
Appendix 1: Examples of Implied Temperature
Rise Disclosure none specify 100% portfolio
coverage. Moreover, some available
methodologies may only include a limited
number of technologies and indicators, while
other important levers/indicators that are
needed to understand transition risks and
opportunities in certain sectors may not be
included. Assessing other factors, such as
the company’s business model, historical
performance, and management actions, may
also be relevant but not taken into account in
today’s methodologies.
Challenges are to be expected in the
development of new forward-looking metrics.
The Task Force recognizes that multiple
initiatives, comprised of investors and others,
are working to encourage more consistent ITR
disclosure and address its challenges.31, 32, 33
Table of Contents
A.
Background and Purpose
B.
Scope and Approach
C.
Forward-Looking
Financial Sector Metrics
D.
Metric for Consideration:
Implied Temperature Rise
Appendices
31
or example, the Net-Zero Asset Owners Alliance, an international group of 27 institutional investors, has formed a working group that
F
is exploring methodologies related to the low-carbon transition including implied temperature rise metrics.
32
In December 2019, the Bank of England published a discussion paper proposing that, as part of a climate stress test, banks and insurers
submit to the Bank the implied temperature rise associated with their exposures. The stress test would not be prescriptive about how
to calculate ITR and would not require firm-level public disclosure.
33
s background to support public input to the TCFD consultation, an external team of analysts from several financial institutions have
A
prepared an analytical report on ITR and other forward-looking climate assessment methodologies for the financial sector. Their report
will be released on November 9, 2020 and sets out common building blocks across different methodologies, key judgments along which
methods differ, and initial views on best practices.
10The Task Force on Climate-related Financial Disclosures
Appendix 1: Examples of Implied
Temperature Rise Disclosure
Certain financial institutions have begun to disclose implied temperature rise (ITR) estimates
over the past two years, including the nine organizations listed in Table A1-1. As shown in the
comparison, the estimates address various portions of the organizations’ portfolios and were
developed in collaboration with several methodology providers.
Table A1-1
Comparison of Select ITR Disclosures34
Methodology Location of
Organization Disclosed ITR Coverage Emissions Provider Disclosure
Aviva 2.9°C (all) 80% of Scope 1 only Carbon Delta Aviva, Aviva
aggregate Climate-Related
(incl. equities, Financial
corporate credit, Disclosure
sovereign, 2019, Metrics
real estate, and Targets
infrastructure) Summary, p. 3
Table of Contents AXA 3.2°C (equity) 95% coverage Scope 1 only Carbon Delta AXA, 2020
Climate Report,
A. p. 19
2.8°C (corporate 70% coverage
Background and Purpose debt)
B. 2.8°C (sovereign 99.7% coverage Beyond Ratings
Scope and Approach debt)
C. Banque de >3°C >70% of equity Not specified Trucost, 2° Banque
Forward-Looking France portfolios Investing de France,
Financial Sector Metrics Initiative Responsible
Investment
D. Report 2020,
Metric for Consideration: p. 18
Implied Temperature Rise
BNP Paribas 2.3–4.3°C Not specified Not specified Science-Based BNP Paribas,
Appendices Cardif (equity) 2°C Alignment 2019 TCFD
(lower bound), Report, p. 41
Carbon Impact
2.2–3.1°C Not specified Not specified
Analytics (upper
(bonds)
bound)
Continued on next page
34
nderlying methodologies for calculating implied temperature rise vary from vendor to vendor. Example disclosures listed in Table A2-1
U
did not specify targets used within the ITR calculations.
11The Task Force on Climate-related Financial Disclosures
Table A1-1: Comparison of Select ITR Disclosures
(Continued)
Methodology Location of
Organization Disclosed ITR Coverage Emissions Provider Disclosure
CNP 2.8°C ca 78% coverage Scope 1, 2, and 3 Carbone 4 CNP Assurances,
2018 CSR
Report, p. 41
Government >3°C ca 50%–60% of Scope 1 and 2 Trucost GPIF, GPIF
Pension each asset class Climate Related
Investment Risk Assessment
Fund (GPIF) 2019, p. 28
Ircantec 2.1°C (equity) Not specified Not specified I Care & Consult, Ircantec, Climate
Beyond Ratings, Actions and ESG
3°C (bonds) Not specified Not specified Carbone 4 Report, p. 35
Legal & General 2.9°C (equity) Not specified Legal & General,
Not specified Carbon Tracker TCFD Report
3.1°C (bonds) Not specified 2019, p. 12
Table of Contents SCOR 3.7–3.8°C 85% of portfolio Not specified Carbone 4 Scor, 2018
Climate Report,
p. 37
A.
Background and Purpose
B.
Scope and Approach
C.
Forward-Looking
Financial Sector Metrics
D.
Metric for Consideration:
Implied Temperature Rise
Appendices
12The Task Force on Climate-related Financial Disclosures
Excerpts from an asset owner’s disclosure of ITR are provided in Figure A1-1.
Figure A1-1
Asset Owner Perspective on ITR Disclosure
In 2019, the Japanese Government Pension Investment Fund (GPIF), the world’s largest pension fund,
undertook and disclosed the results of a climate-related portfolio risk assessment. The resulting report
includes a variety of disclosures such as carbon footprint metrics, fossil fuel and stranded asset exposure
metrics, and implied temperature rise metrics, referred to as “temperature trajectory” in the report.
GPIF worked with the data provider Trucost to provide ITR ratings at an aggregate level for all assets under
management as well as for various asset classes and sectors within its portfolio. The disclosure covers
a ten-year period (2012–2023) to show current information, historical changes, and future projections.
Table of Contents
A.
Background and Purpose
B.
Scope and Approach
C.
Forward-Looking GPIF’s report describes the relevance of the ITR metrics as follows: “Companies with emissions significantly
Financial Sector Metrics above what is required to be in line with a low-carbon transition pathway, are likely to be impacted more by
current or future constraints on GHG emissions. The [disclosure] presented aims to highlight leaders and
laggards at the company level, as well as overall portfolio performance and performance by sector.”
D.
Metric for Consideration: However, GPIF also notes that current data gaps limit the usefulness of ITR in decision-making. A lack of
Implied Temperature Rise emissions data on some asset classes allows GPIF to estimate ITR only for about 50%–60% of their assets.
Appendices
GPIF, GPIF Climate Related Portfolio Risk Assessment, pp. 28–31
13The Task Force on Climate-related Financial Disclosures
Excerpts from an insurance company’s disclosure of ITR are provided in Figure A1-2.
Figure A1-2
Insurance Company Perspective on ITR Disclosure
Aviva Group, a diversified fund manager and general insurance and pension provider, has included an ITR
rating since 2018 in its annual climate-related disclosures. Aviva’s reports include a wide range of metrics for
climate transition and physical risk, including levels of investment in green assets, carbon foot printing,
climate Value-at-Risk, and weather-related losses.
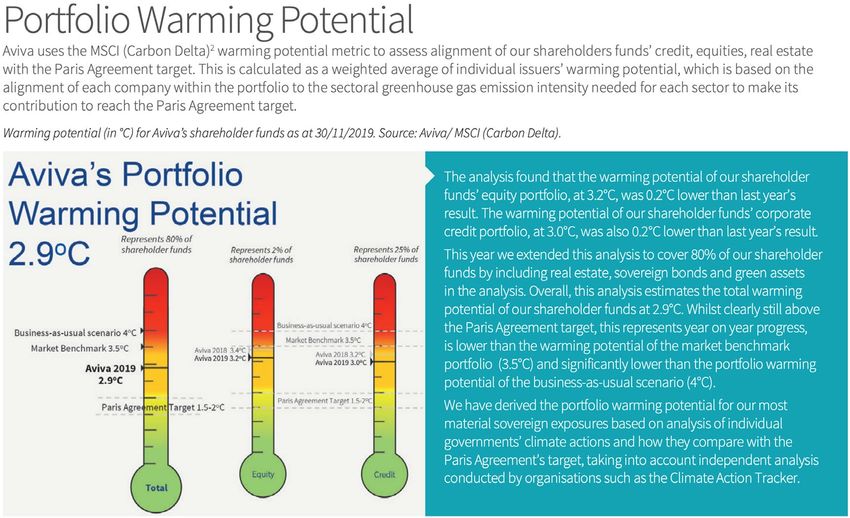
Aviva worked with Carbon Delta to derive its ITR rating for its shareholders funds’ credit, equities, and real
estate as a weighted average of individual issuers’ warming potential. As shown below, Aviva reports its 2019
rating alongside its 2018 rating to show Aviva’s year-to-year progress.
Table of Contents
A.
Background and Purpose
B.
Scope and Approach
C.
Forward-Looking
Financial Sector Metrics
Aviva describes its use of ITR ratings as exploratory, noting that Aviva “is exploring the uses of a number
D.
of different emerging metrics designed to help analyse the alignment of investment portfolio to the Paris
Metric for Consideration:
Agreement’s target of limiting the global temperature rise to well below 2°C. However, we fully anticipate
Implied Temperature Rise
that these approaches will evolve over time and be improved in the light of new research, data and
emerging best practice. We have fed this analysis into investment strategy reviews of our business.”
Appendices
Aviva notes that the level of coverage of its ITR rating continues to evolve. Aviva discloses that only 80%
of shareholder funds were analyzed, which nonetheless represents an increase in coverage from 2018
due to the inclusion of real estate, sovereign bonds, and green assets.
Aviva, Aviva Climate-Related Financial Disclosure 2019, Metrics and Targets Summary, p. 3
Aviva, Aviva Climate-Related Financial Disclosure 2019, p. 17
14The Task Force on Climate-related Financial Disclosures
Excerpts from an insurance company’s disclosure of ITR are provided in Figure A1-3.
Figure A1-3
Insurance Company Perspective on ITR Disclosure
BNP Paribas Cardif, the international insurance company associated with BNP Paribas Group, has published
information on the temperature alignment of its directly owned equity and bond portfolios since 2017.
Due to a lack of methodological consensus, BNP reports results from two different providers: Carbon
Impact Analytics and the Science-Based 2°C Alignment. While both methodologies are largely based on the
International Energy Agency’s 2°C scenario (2DS), they yield significantly different results. These differences
are largely due to how Carbon Impact Analytics’ method reflects current carbon performance of companies,
without adjusting for potential or promised reduction efforts.
BNP notes that it “presents the results of both methods to foster discussion in the marketplace. By
researching and assimilating new appropriate metrics, climate-related goals can be incorporated in long-
term investment decisions.”
Table of Contents
A.
Background and Purpose
B.
Scope and Approach
C.
Forward-Looking
Financial Sector Metrics
D.
Metric for Consideration:
Implied Temperature Rise
Appendices
BNP Paribas, BNP Paribas TCFD Report 2019, p. 41
15The Task Force on Climate-related Financial Disclosures
Appendix 2: Examples of Climate
Value-at-Risk Disclosure
Value-at-Risk (VaR) measures the size of the loss model the returns to different asset classes
a portfolio may experience, within a given time in different countries or regions. It is model-
horizon, at a particular probability. Climate VaR and data-intensive, and it is unclear whether
quantifies the size of loss attributable to climate- the uncertainty inherent in providing this
related financial risks by comparing the value of high level of detail would provide particularly
assets in a world with climate change relative to accurate estimates.
the same world without climate change.35
• A top-down approach uses a simple macro-
Given that Climate VaR is a relatively new metric, economic model that has been integrated
there are few available methodologies and those with emissions and climate modules. A small
that are available are not yet fully transparent or number of integrated assessment models of
comparable. Generally, estimates of climate VaR climate change exist, which have been built in
could take a bottom-up or top-down approach: order to estimate the economic cost of climate
change. However, these can be conservative in
• A bottom-up approach would be built their estimates as they can fail to fully account
around a relatively detailed portfolio analysis for the full range and deep uncertainty of
model, which takes as its input various climate impacts.
macroeconomic variables and goes on to
Figure A2-1
Excerpt from an Asset Manager’s Climate VaR Disclosure
Table of Contents
A.
Background and Purpose
B.
Scope and Approach
C.
Forward-Looking
Financial Sector Metrics
D.
Metric for Consideration:
Implied Temperature Rise
Appendices
AXA Investment Managers, Article 173 – TCFD combined report, p. 35
35
Economist Intelligence Unit, The Cost of Inaction: Recognising the Value at Risk from Climate Change, 2015.
16The Task Force on Climate-related Financial Disclosures
A few financial institutions have disclosed include examples of climate VaR disclosures
information on their use of climate VaR from an asset manager and an insurance
and climate VaR estimates related to their company, respectively.
portfolios. Figure A2-1 (p. 16) and Figure A2-2
Figure A2-2
Excerpt from an Insurance Company’s
Climate VaR Disclosure
Aviva’s Climate VaR measure
Climate-related risks and opportunities have the potential to affect insurers’ balance sheets as well as the
long-term business model. Traditional approaches based largely on backward looking analysis may need to
be refined or enhanced to capture these risks going forward. In order to address this challenge, Aviva has
developed a Climate VaR measure, in conjunction with the UNEP FI investor pilot project and Carbon Delta
as well as Elseware (a risk management and quantification expert consultancy). This measure enables the
potential business impacts of future climate-related risks and opportunities to be assessed in each of the
IPCC scenarios and in aggregate (see Appendix for more details of our Climate VaR methodology) as well as
providing an indication of the resilience of our strategy…
Calculated on a like for like basis the YE18 and YE19 Climate VaRs are similar, indicating that Aviva’s overall
exposure to climate-related risks and opportunities remains broadly unchanged.
Figure 9 compares a plausible range of outcomes (5th to 95th percentile) from our Climate VaR analysis for
the different scenarios considered. Consistent with last year, Aviva is most exposed to the business-as-usual
(BAU) 4°C scenario where physical risk dominates, negatively impacting long-term investment returns on
equities, corporate bonds, real estate, real estate loans and sovereign exposures. The aggressive mitigation
Table of Contents
1.5°C and 2°C scenarios are the only scenarios with potential upside. Physical risk impacts are more limited
but there is still downside risk on long-term investment returns from carbon intensive sectors (for example
A. utilities) as a result of transition policy actions. This is offset partially by revenues on new technologies from
Background and Purpose some sectors (for example automotives).
When aggregated together to determine an
B. overall impact of climate-related risks and
Scope and Approach opportunities across all scenarios, the plausible
range is dominated by the results of the 3°C and
4°C scenarios, reflecting that neither existing nor
C. planned policy actions are sufficiently ambitious
Forward-Looking to meet the 1.5°C Paris Agreement target. In
Financial Sector Metrics the 1.5°C scenario transition risk is larger than
physical risk (see figure 10) even after taking into
account mitigating technology opportunities. In
D.
the 2°C scenario, transition and physical risks are
Metric for Consideration:
somewhat balanced, whereas in the 3°C and 4°C
Implied Temperature Rise
scenarios physical risk dominates…
We will continue to develop and incorporate
Appendices
Climate VaR into our overall strategy, risk
management and reporting frameworks. In
particular, we will further refine and improve our
Climate VaR approach in the light of new research
and data as well as emerging best practice
including using output from the UNEP FI Insurance
TCFD pilot.
Aviva, Aviva Climate-Related Financial Disclosure 2019, pp. 14–15
17The Task Force on Climate-related Financial Disclosures
Appendix 3: Glossary
CLIMATE-RELATED OPPORTUNITY refers to GREENHOUSE GAS (GHG) EMISSIONS
the potential positive impacts related to climate SCOPE LEVELS38
change on a company or organization. Efforts
to mitigate and adapt to climate change can • Scope 1 refers to all direct GHG emissions.
produce opportunities for companies, such as
• Scope 2 refers to indirect GHG emissions
through resource efficiency and cost savings, the
from consumption of purchased electricity,
adoption and utilization of low-emission energy
heat, or steam.
sources, the development of new products and
services, and building resilience along the supply • Scope 3 refers to other indirect emissions
chain. Climate-related opportunities will vary not covered in Scope 2 that occur in the value
depending on the region, market, and industry chain of the reporting company, including both
in which an organization operates. upstream and downstream emissions. Scope
3 emissions could include: the extraction and
CLIMATE-RELATED RISK refers to the
production of purchased materials and fuels,
potential negative impacts of climate change
transport-related activities in vehicles not
on a company or organization. Physical risks
owned or controlled by the reporting entity,
emanating from climate change can be event-
electricity-related activities (e.g., transmission
driven (acute) such as increased severity
and distribution losses), outsourced activities,
of extreme weather events (e.g., cyclones,
and waste disposal.39
droughts, floods, and fires). They can also relate
to longer-term shifts (chronic) in precipitation IMPLIED TEMPERATURE RISE (ITR) refers
and temperature and increased variability in to an estimate of a global temperature
weather patterns (e.g., sea level rise). Climate- rise associated with the greenhouse gas
related risks can also be associated with the emissions of a single entity (e.g., a company)
transition to a lower-carbon global economy, the or a selection of entities (e.g., those in a given
Table of Contents most common of which relate to policy and legal investment portfolio, fund, or investment
actions, technology changes, market responses, strategy). Expressed as a numeric degree
and reputational considerations. rating, ITR metrics incorporate current GHG
A.
Background and Purpose emissions or other data and assumptions to
CLIMATE VALUE-AT-RISK measures the size
estimate expected future emissions associated
of the loss a portfolio may experience, within a
with the selected entity or entities. Then the
B. given time horizon, at a particular probability
estimate is translated into a projected increase
Scope and Approach attributable to climate-related financial risks.
in global average temperature (in °C) above
GOVERNANCE refers to “the system by which preindustrial levels that would occur if all
C. an organization is directed and controlled companies in corresponding sectors had the
Forward-Looking in the interests of shareholders and other same carbon intensity as the selected asset(s).
Financial Sector Metrics stakeholders.”36 “Governance involves a set
NET-ZERO refers to achieving an equal balance
of relationships between an organization’s
between GHG emissions produced and GHG
D. management, its board, its shareholders, and
emissions removed from the atmosphere.
Metric for Consideration: other stakeholders. Governance provides the
Implied Temperature Rise structure and processes through which the RISK MANAGEMENT refers to a set of
objectives of the organization are set, progress processes that are carried out by a company
against performance is monitored, and results or organization’s board and management
Appendices are evaluated.” 37 to support the achievement of its objectives
by addressing its risks and managing the
combined potential impact of those risks.
36
Cadbury, A., Report of the Committee on the Financial Aspects of Corporate Governance, London, 1992.
37
rganisation for Economic Co-operation and Development (OECD), G20/OECD Principles of Corporate Governance, OECD
O
Publishing, Paris, 2015.
38
orld Resources Institute and World Business Council for Sustainable Development, The Greenhouse Gas Protocol: A Corporate
W
Accounting and Reporting Standard (Revised Edition), March 2004.
39
orld Resources Institute and World Business Council for Sustainable Development, The Corporate Value Chain (Scope 3)
W
Accounting and Reporting Standard, April 16, 2014.
18You can also read


