Identifying potentially high risk areas for environmental pollution in the Baltic sea
←
→
Page content transcription
If your browser does not render page correctly, please read the page content below
Boreal Environment Research 19: 140–152                      © 2014
ISSN 1239-6095 (print) ISSN 1797-2469 (online)	Helsinki 25 April 2014

Identifying potentially high risk areas for environmental
pollution in the Baltic Sea

Andreas Lehmann*, Hans-Harald Hinrichsen and Klaus Getzlaff

            GEOMAR Helmholtz Centre for Ocean Research Kiel, Germany (*corresponding author’s e-mail:
            alehmann@geomar.de)

            Received 4 July 2012, final version received 16 May 2013, accepted 27 Mar. 2013

            Lehmann, A., Hinrichsen, H.-H. & Getzlaff, K. 2014: Identifying potentially high risk areas for environ-
            mental pollution in the Baltic Sea. Boreal Env. Res. 19: 140–152.

            The study aims at the identification of areas in the Baltic Sea from where potential pollu-
            tion is transported to vulnerable regions. Generally, there is higher risk of ship accidents
            along the shipping routes and along the approaching routes to the harbors. The spread-
            ing of harmful substances is mainly controlled by prevailing atmospheric conditions and
            wind-induced local sea surface currents. Especially, spawning, nursery and tourist areas are
            considered high-vulnerable areas. With sophisticated high resolution numerical models,
            the complex current system of the Baltic Sea has been simulated, and with subsequent
            drift modeling areas of reduced risk or high-risk areas for environmental pollution could
            be identified. In a further step, optimum fairways of reduced risk could be obtained by fol-
            lowing probability minima of coastal hits or maxima for the time it takes to reach the coast.
            The results could be useful for environmental management for the maritime industry to
            minimize the risk of environmental pollution in case of ship accidents.

Introduction                                               pollution at open sea is generally more effective
                                                           and less expensive than in shallow coastal areas.
Marine ecosystems are usually divided into open                Since the political change in eastern Europe
sea and coastal areas. The latter are generally            more than 20 years ago, the intensity of interna-
known as the major life reproduction areas and             tional cargo shipping has drastically increased,
play a major role in restoring natural resources           and is expected to increase further in future
for human consumption. Thus, they are most                 (BACC Author Team 2008). Presently, traffic in
vulnerable to accidental discharges of harm-               the Baltic Sea is heavy, accounting for approxi-
ful substances and can be considered examples              mately 15% of the world’s cargo transportation.
of “highly valuable” sea regions. Variations in            A growing tendency in cargo transportation was
atmospheric forcing conditions result in variabil-         recorded for the most recent years, especially
ity of ocean circulation and hence in spatio-tem-          with respect to oil tankers (HELCOM 2010). In
poral differences of transport patterns of these           the Baltic Sea including the Kattegat, 76 ports
substances. Thus, from these results, probably             handle more than 1 million tonnes of cargo per
spatio-temporal separations of “high” and “low”            year. The busiest port is St. Petersburg, Russia,
areas of pollutional risk probability could be             with more than 14 500 ship operations per
identified. However, combating environmental               year. The number of ship operations (passages,
Editor in charge of this article: Kai Myrberg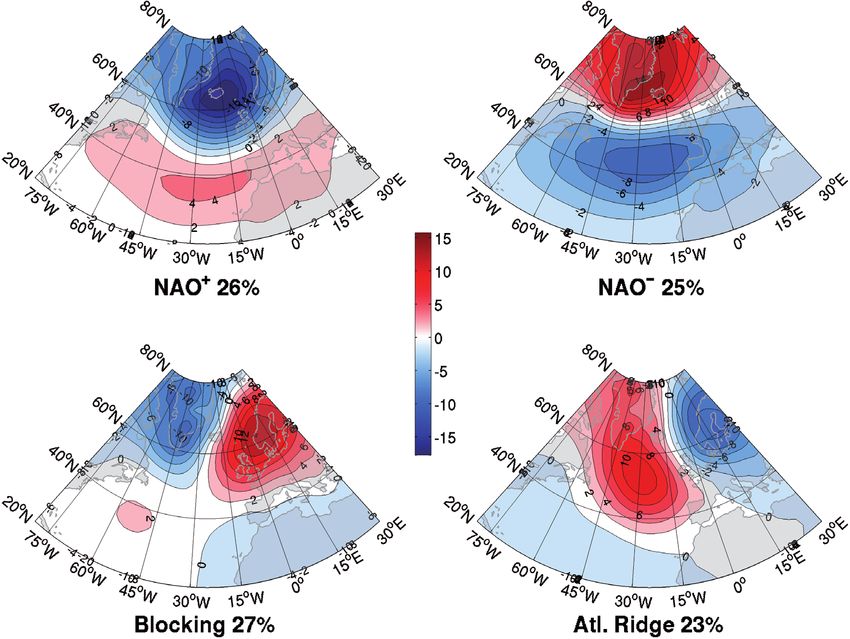
Boreal Env. Res. Vol. 19    • Identifying high risk areas for environmental pollution in the Baltic Sea   141

excluding ferry traffic) is estimated at 150 000              The work presented here consequently fol-
per year (Gollasch and Leppäkoski 2007), and             lows the ideas of BalticWay and applies the
it is assumed that shipping activities will con-         method to the whole Baltic Sea including the
siderably increase in the near future (Höglund           Skagerrak and Kattegat.
and Meier 2012). Therefore, energetic measures                The main aim of this study was to identify
have been applied in recent years by HELCOM              areas that are at high and low risk of pollution in
(Helsinki Commission) and IMO (International             the Baltic Sea in relation to atmospheric forcing
Maritime Organisation) to minimize harmful               conditions and ocean circulation patterns. Thus
impacts of maritime shipping on the Baltic Sea           objectives were to perform (i) long-term risk
environment. Nevertheless, the Baltic’s narrow           assessments of different areas in the Baltic Sea,
straits and shallow waters, many of them cov-            (ii) to analyze their intra- and inter-annual vari-
ered by ice for prolonged periods in winter,             ability, and (iii) to identify areas of intrinsically
make navigation very challenging, and increase           small probability of coastal pollution by using
the risk of shipping accidents. The main envi-           the concept of equiprobability lines (Soomere et
ronmental effects of shipping and other activities       al. 2010). Finally, risk probability of coastal hits
at sea include air pollution, illegal deliberate         along these fairways were compared with that
and accidental discharges of oil, hazardous sub-         obtained along the most frequently used cargo
stances and other wasters, and the unintentional         ship routes in the Baltic Sea (HELCOM 2010).
introduction of invasive alien organisms via ship
ballast waters or hulls. Shipping also adds to the
problem of eutrophication of the Baltic Sea with         Methods and concepts
its nutrient inputs from sewage discharges and
nitrogen oxides (NOx) emissions (see HELCOM              On the basis of 3-dimensional numerical model
2010 for details).                                       simulations of the whole Baltic Sea including the
    This work has been a part of the BONUS+              Skagerrak and Kattegat (Fig. 1), we used drift
BalticWay project. The core objective of Baltic-         model simulations to identify areas from where
Way was to establish key components of reliable,         potential pollution is transported to vulnerable
robust, and low cost technology for the environ-         regions. Circulation and drift models were oper-
mental management of shipping, offshore and              ated subsequently. The advantage of an offline
coastal engineering activities. The existence and        subsequent processing of drift models is that
location of areas of reduced risk was established        drifters can be released freely within the 3D
through the use of massive numerical simula-             model fields and drift tracking can be forward or
tions. The method used contained four compo-             backward (Hinrichsen et al. 1997, Lehmann and
nents: (i) an eddy-resolving circulation model,          Javidpour 2010, Lehtiniemi et al. 2012).
(ii) a scheme for tracking of trajectories of                Simulated hydrodynamic data to construct
water or pollution particles, (iii) a technique for      highly resolved spatio-temporal flow fields were
the calculation of quantities characterizing the         provided by the existing Kiel Baltic Sea Ice
potential of different sea areas to supply adverse       Ocean model (BSIOM, Lehmann et al. 2002).
impacts, and (iv) routines to construct the opti-        The model domain comprises the entire Baltic
mum fairway. The aim was to obtain prob-                 Sea including the Skagerrak and Kattegat with
abilities of pollution transport to the vulnerable       an improved horizontal resolution of 2.5 km
areas or the time pollution takes to reach these         and 60 vertical levels specified. BSIOM has
areas (Soomere et al. 2010, 2011b). Recently,            been proven to simulate the Baltic Sea hydro-
this method has been applied to the southwest-           graphic and hydrodynamical conditions realisti-
ern Baltic Sea and the Kattegat. In general, the         cally (e.g. Lehmann et al. 2002, 2012, Hinrich-
northern side of the Darss Sill area and the west-       sen et al. 2009). BSIOM was forced by realistic
ern domains of the Kattegat were safer to travel         atmospheric conditions for the period 2002–
than the opposing coasts. The largest variability        2010, taken from the Swedish Meteorological
of obtained probabilities was found between in-          and Hydrological Institute (SMHI Norrköping,
and outflow situations (Lu et al. 2012).                 Sweden) meteorological database (L. Meuller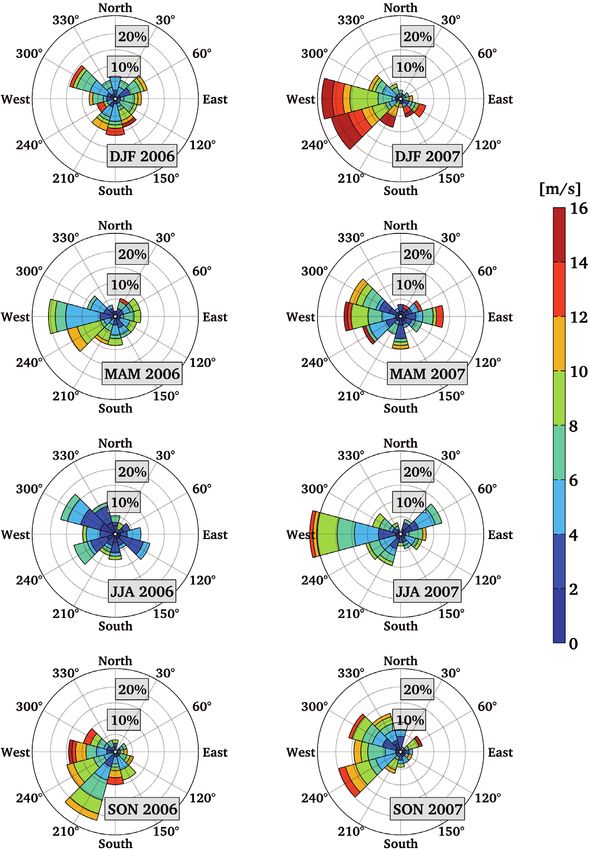
142                                                         Lehmann et al.   •   Boreal Env. Res. Vol. 19

                                                                                   Fig. 1. Map of the Baltic
                                                                                   Sea.

pers. comm.) which covers the whole Baltic             of this study was to mainly simulate the prop-
drainage basin on a regular grid of 1° ¥ 1° with a     agation of toxic substances or oil spills which
temporal increment of 3 hours.                         specific densities are usually lower than those of
    For our drift model simulations, three-di-         the surrounding water masses. The 10-day drift
mensional velocity fields were extracted (daily        period was obtained as an appropriate period
means) to be used for a Lagrangian particle            for adequate risk analysis estimates of semi-per-
tracking exercise on toxic and harmful sub-            sistent transport patterns in the Gulf of Finland
stances in the Baltic Sea. Daily means were            (Viikmäe et al. 2010). Thus, every year was cov-
used to average out surface current variability        ered by at least 3650 days of drift tracking. For
due to inertial waves. For the particle tracking,      the subsequent statistical analysis, 3650 days ¥
subsequent daily mean current fields were lin-         68 215 drifters were analyzed. The high number
early interpolated to allow for a three-hour time      of drift data guarantied a good resolution of
step. Although drifters can be placed at every         temporal and spatial variability of the Baltic Sea
location within the model domain (Hinrichsen et        current system.
al. 1997), for our purpose drifters were launched          To identify high risk areas in the Baltic Sea
on the basis of the models horizontal resolution       from where pollution is most likely transported
which is 2.5 km resulting in a total number of         to the coastal zone, we followed the statisti-
68 215 drifters for each release. The trajecto-        cal method proposed by Soomere et al. (2010,
ries of the simulated drifters obtained from the       2011b). From a set of particle trajectories, var-
Eulerian flow fields were computed using a 4th         ious maps of probabilities of hits in vulnerable
order Runge-Kutta scheme (Press et al. 1992).          regions, or maps of time it takes for the adverse
For every day of the year, a full set of drifters      impact to reach these regions could be produced.
was released and subsequently tracked for a            Also, the concept of the equiprobability line was
10-day period. Coastal hits were detected if           used to characterize optimum fairways in elon-
drifting particles for the first time entered a grid   gated basins (Soomere et al. 2010). The method
cell adjacent to land. The drifters remained fixed     for identifying the optimum fairway consists of
in the sea surface layer, because the purpose          four basic steps. The 3-dimensional dynamics of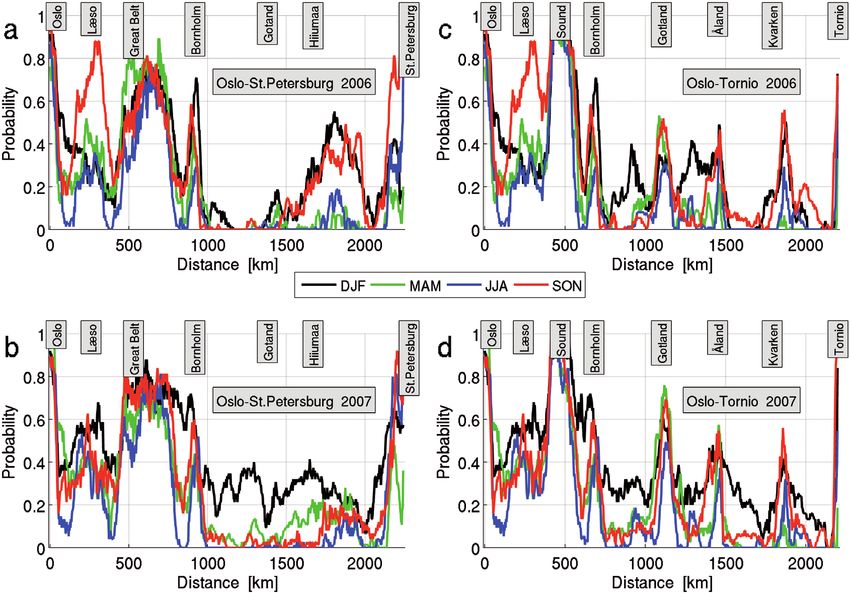
Boreal Env. Res. Vol. 19 • Identifying high risk areas for environmental pollution in the Baltic Sea 143
ocean currents is simulated numerically, and the and Deser (2009) concluded that a large amount
results of the simulation were used to construct of within-season variance exists in the atmos-
Lagrangian trajectories of selected water parti- pheric circulation of the North Atlantic and that
cles. Together with a cost function, these trajec- most winters are not dominated by any particular
tories are used to construct maps characterizing regime alone. Similar large-scale atmospheric
the distributions of environmental risks associ- circulation patterns can be found over the whole
ated with different coastal areas (Andrejev et al. year but they are not as pronounced as during
2011, Soomere et al. 2011a, 2011b). Coastal hits the winter season. Generally, the high variability
(environmental area of high risk) were defined in atmospheric circulation patterns force corre-
when drifters move into the coastal area of sponding responses of the Baltic Sea circulation.
2.5 km off the coast. Thus, risk areas are a func- Lehmann et al. (2002) showed that different
tion of the distance from the point of release to atmospheric climate regimes force different cir-
the coast, the atmospheric forcing and underly- culation regimes in the Baltic Sea. The resulting
ing current fields which are mainly wind-driven circulation patterns heavily depend on the direc-
or topographically steered. Based on the analysis tion and strength of the prevailing winds.
of the Lagrangian trajectories, the results were A key aspect of this study was to analyze
used to construct (i) risk probability areas which intra- and inter-annual variability in terms of
are prone to serve as a source of coastal pollu- risk assessment in the Baltic Sea. Therefore, we
tion, and (ii) time requirements of water particle selected two years, namely 2006 and 2007, show-
transport towards coastal areas. ing strong seasonal as well as annual variability
in the atmospheric wind situation (Fig. 3). The
most prominent differences for these two years
Results exist during the winter (Dec.–Feb.) and summer
(June–Aug.) seasons. While during the winter
Atmospheric variability season of 2006, occurrences of wind directions
were rather equally distributed between easterly,
The climate of the Baltic area (Fig. 1), and thus southerly and westerly winds, in 2007 strong
the current system in the Baltic Sea, is con- (> 10 m s–1) and intense westerly wind situations
trolled by large pressure systems that govern occurred with a total frequency of more than 30%.
the air flow over the continent. From the cluster During the summer of 2006, rather calm condi-
analysis of winter (Dec.–Mar.) daily mean sea tions existed with wind speed rarely exceeding
level pressure (SLP) anomalies, using NCEP/ 8 m s–1, whereas during the summer of 2007 the
NCAR re-analysis data for the period 1949– predominant wind direction was westerly with
2008 (Kalnay et al. 1996) four winter climate a total frequency more than 25%. Additionally
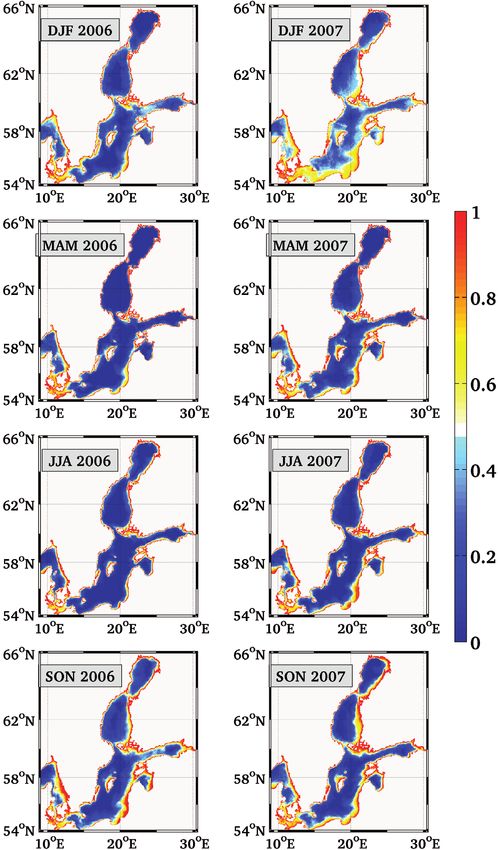
regimes could be identified (Fig. 2; Lehmann during the spring (Mar.–May), the major change
et al. 2011). Two of the climate regimes cor- appeared to be an increase in wind speed in the
respond to the positive and negative phases of predominant wind directions from 2006 to 2007,
the North Atlantic Oscillation (NAO), while the while during the autumn (Sep.–Nov.) a slight
third and fourth regimes display strong anticy- shift in the predominant wind directions occurred
clonic ridges over Scandinavia (the ‘Blocking’ within the westerly wind regime. These differ-
regime) and off western Europe (the ‘Atlantic ent wind situations, especially during the winter
Ridge’ regime). In the period 1948–2008, all season (Dec.–Feb.), were strongly connected to a
four regimes occurred with about the same fre- negative (2006 partly also a “Scandinavian block-
quency between 23% and 27%. The total con- ing” situation) and a positive (2007) NAO indexes
tribution of the ‘Blocking’ and ‘Atlantic Ridge’ on the large-scale winter atmospheric conditions
pattern was between 48%–50% and the total (Fig. 2; Lehmann et al. 2011, Cattiaux et al.
contribution of the NAO pattern was between 2010). Therefore, we expect to understand the
50%–52%. However, the relative contributions connection of spatio-temporal variability of areas
of the four patterns were different for different of high/low environmental risk and changes in
decades and years (Getzlaff et al. 2011). Hurrel atmospheric conditions by comparing results from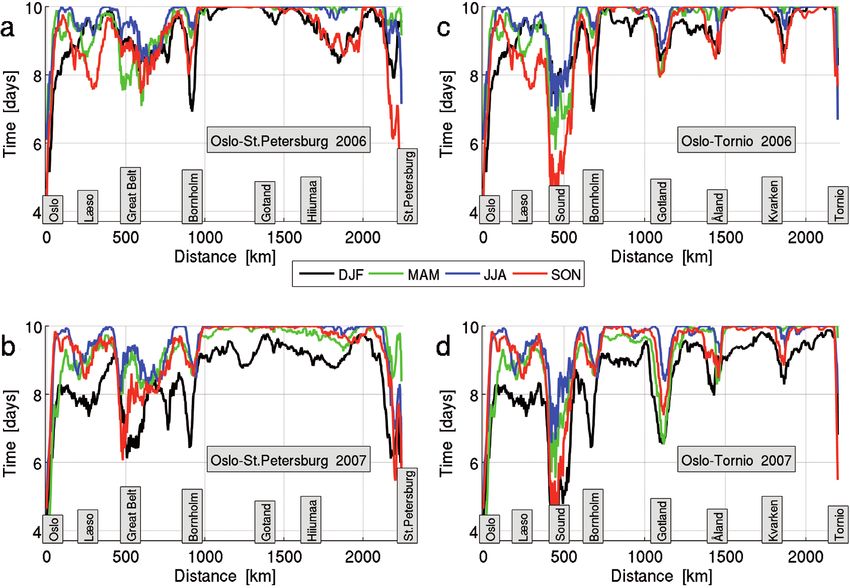
144                                                           Lehmann et al.   •   Boreal Env. Res. Vol. 19

Fig. 2. Winter (Dec.-Mar.) climate regimes derived from the cluster analysis of daily mean SLP from NCEP/NCAR
re-analysis data for the period 1948–2008.

seasonally averaged ensembles of drifter simula-         short time periods and, furthermore, they exhibit
tions for the years 2006 and 2007.                       much stronger probability gradients as compared
                                                         with offshore regions. It should be noted that gen-
                                                         erally the eastern and southern coasts of the Baltic
Particle probabilities to hit the coastal                Sea reveal relatively high probabilities of pollu-
environment                                              tion for 10-day drift periods as compared with the
                                                         western and northern coasts. The reason is that
The spatio-temporal long-term mean distribution          in the long-term, average southwesterly winds
of the particle probability to hit coastal environ-      cause offshore transport off the western and north-
ments (Fig. 4) revealed relatively low values in         ern coasts and onshore transport on the opposite
most of the offshore regions of the Baltic Sea           coasts (Lehmann et al. 2012).
(p < 20%). These low values of the probability of            In contrast to the assessment of spatio-tem-
coastal hits are obviously linked to the relatively      poral long-term patterns, variability in the occur-
large size of the open Baltic and the relatively         rence of high risk probability areas depends on
short time (10 days) of particle tracking. Areas         the prevailing currents the drifters are exposed
predicted to have the highest probability to hit         to. During calm atmospheric conditions, wind
coastal environments are the narrow straits of           drift is suggested to be small and the dispersion
the western Baltic, coastal regions as well as the       is forced by the residual circulation only. Thus,
vicinities of different islands in the central Baltic.   drifters remain relatively close to the positions
They also correspond to coastal hits in relatively       where they were released. Strong wind causes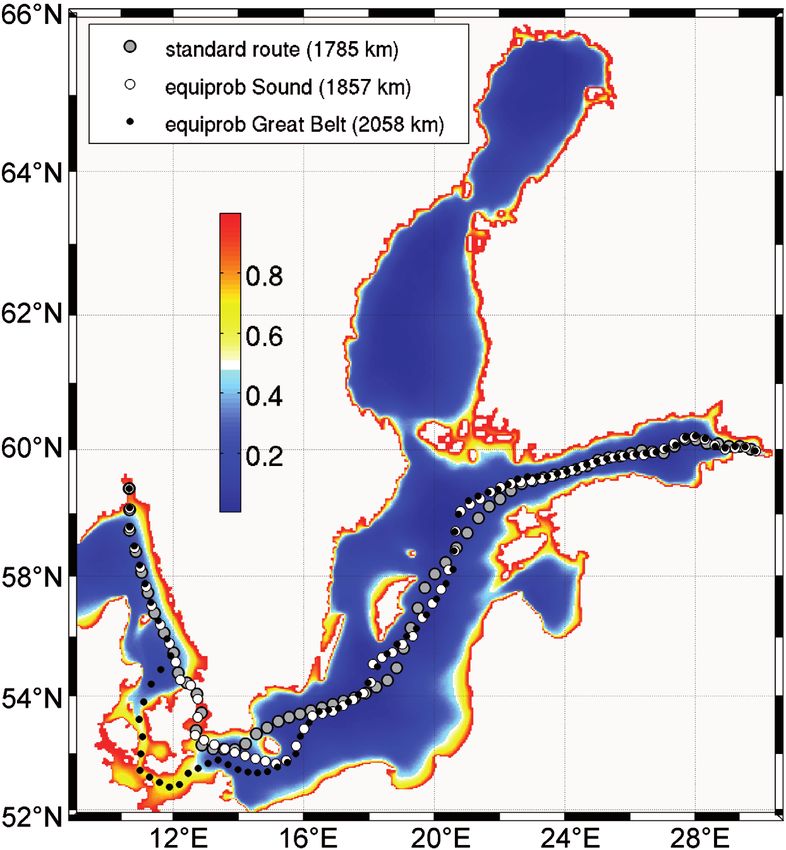
Boreal Env. Res. Vol. 19     • Identifying high risk areas for environmental pollution in the Baltic Sea   145

Fig. 3. Seasonally aver-
aged distribution of 10-m-
wind direction and magni-
tude at the south eastern
coast of Sweden near
Ystad for the year 2006
(left-hand-side column)
and 2007 (right-hand-side
column), based on the
3-hourly SMHI meteo-
rological database. DJF
= Dec., Jan., Feb.; MAM
= Mar., Apr., May; JJA =
June, July, Aug.; SON =
Sep., Oct., Nov.

fast drift and increases the risk that pollution will     Feb.) of the year 2006 differered from that in
hit the coast.                                            the winter period of the year 2007. While we
    To account for the different atmospheric              find intense wind events during the winter of
forcing conditions the probability of drifters to         2006, the winter of 2007 presents even stronger
hit the coast if launched in the whole Baltic Sea         and more persistent wind forcing from west to
area as well as along ship routes was calculated          southeast. This leads to an increase in the prob-
for different years. Mean seasonal probability            ability distribution for particles hitting the coast.
maps of coastal pollution were determined from            In the winter of 2006, the largest parts of the
model simulation for the years 2006 and 2007              main basins such as the Bornholm Basin, Baltic
(Fig. 5). Here, the response of the particle drift        Proper, Sea of Bothnia and Bay of Bothnia (see
to the atmospheric surface forcing becomes clear          Fig. 1 for reference) indicate low risk (p < 20%)
(compare Fig. 5 with Fig. 3). The distribution            areas away from the coast. Contrary, during the
of high risk areas in the winter period (Dec.–            winter of 2007 only smallest areas of the south-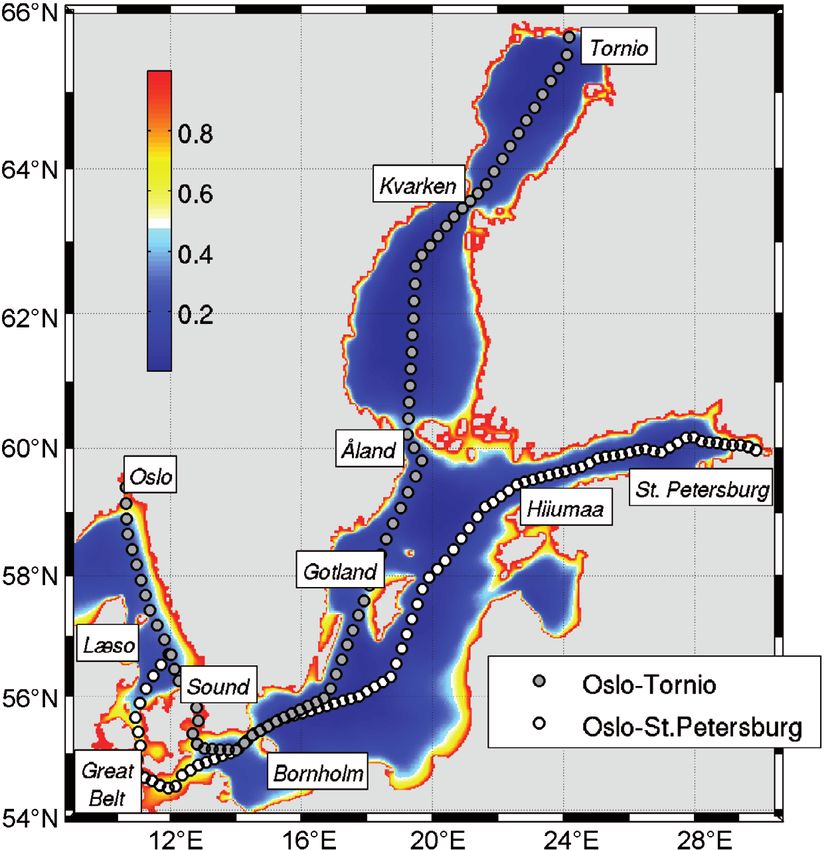
146                                                         Lehmann et al.   •   Boreal Env. Res. Vol. 19

                                                                                  Fig. 4. Average probability
                                                                                  to reach the coast for an
                                                                                  ensemble of daily particle
                                                                                  releases in 2002–2010
                                                                                  computed for 10-day
                                                                                  particle drift. The dotted
                                                                                  lines indicate two major
                                                                                  frequently used shipping
                                                                                  routes from Oslo to St.
                                                                                  Petersburg (SR1; white
                                                                                  dots) and from Oslo to
                                                                                  Tornio (SR2; gray dots).

ern Åland Sea, the Bothnian Sea and the Bay            ties of coastal regions and islands with distances
of Bothnia indicate low risk areas. The whole          to coastal environments not exceeding 50 km.
Arkona Basin indicates high risk (p > 60%) areas       Due to stronger westerly wind forcing during the
for particles hitting the coast within 10 days after   spring and summer of 2007, for the coastlines of
release. The Bay of Gdańsk and the Gulf of Riga        Poland, the Baltic countries, Russia and Finland
are under high risk during that period. Due to         as well as the western coast of Gotland we iden-
recurrent strong wind forcing from the south and       tify weaker probability gradients, indicating risk
southeast, high risk (p > 60%) of coastal hits was     of coastal pollution potentially starting farther
found for the east coast of Sweden up to the area      away from the coasts. The Belt Sea as well as
north of Stockholm. The situation of high risk         the western part of the Arkona Basin persistently
areas during the winter of 2007 is completely          showed high risk areas of coastal hits for all
different to the long-term annual mean (Fig. 4)        main seasons presented here.
and therefore highly important in the context of           During the autumn (Sep.–Nov.), relatively
seasonal and inter-annual variability.                 strong wind forcing mainly of variable direc-
    Despite the ephemeral nature of the atmos-         tions generate weak probability gradients along
pheric forcing conditions, probability pat-            all western coastlines producing higher risk (p
terns for the spring (Mar.–May) and summer             > 40%) areas farther off the coast. Nevertheless,
(June–Aug.) of 2006 are relatively stable, which       along the east coast of Sweden only low risk of
appeared quite similar as compared with the            coastal hits was found.
long-term annual mean (Fig. 4). Due to rela-               Regarding the shipping routes from Oslo to
tively low wind forcing mainly of variable direc-      St. Petersburg (SR1) as well as from the same
tion, in the central and northern Baltic high risk     destination to Tornio (SR2; see Fig. 4 for the
areas (p > 60%) were located only in the vicini-       positions of the shipping routes), generally high
Boreal Env. Res. Vol. 19 • Identifying high risk areas for environmental pollution in the Baltic Sea 147 Fig. 5. Average sea- sonal probability to reach the coast for ensembles of daily particle releases for 2006 (left-hand-side column) and 2007 (right- hand-side column) com- puted for 10-day particle drift. DJF = Dec., Jan., Feb.; MAM = Mar., Apr., May; JJA = June, July, Aug.; SON = Sep., Oct., Nov. risk probability to hit the coast appeared if the inter-annual variability of this high risk prob- shipping route was located close to shallow ability occurred close to the islands of Læsø, water and coastal regions: Læsø, Great Belt, Bornholm and Gotland as well as close to Kvar- Bornholm, and Hiiumaa along track SR1, as well ken. The existence of the permanently appearing as Læsø, Sound, Bornholm, Gotland, Åland and high risk area in the Sound, close to 100%, rec- Kvarken along SR2 (Fig. 6). Highest intra- and ommends to choose an alternative route via the
148                                                               Lehmann et al.   •   Boreal Env. Res. Vol. 19

Fig. 6. Average probability to reach the coast for ensembles of daily particle releases along frequently used ship-
ping routes from Oslo to St. Petersburg (a and b) and from Oslo to Tornio (c and d) for the years 2006 (a and c) and
2007 (b and d) computed for 10-day particle drift.

Great Belt, for which a permanent high risk area            of the probabilities are quite similar, however,
was obtained as well, but taking this route would           the total distances of the optimum fairways are
reduce the risk by approximately 20%. Accord-               about 6% and 17% greater for the routes through
ingly, along the shipping routes, the durations             the Sound and Great Belt, respectively. As we
for water particles to reach coastal environments           used the same shipping routes from Oslo to the
were 4–6 days in the Sound and Great Belt area              entrance of the Sound and Great Belt there are
(Fig. 7) and about 7 days near Bornholm and                 no differences for Oslo and Læsø (Fig. 9). A risk
Gotland. While most of the other parts along the            reduction of about 25% is obtained if the route
routes were less critical with durations greater            through the Great Belt is chosen. A further risk
than 8 days.                                                reduction up to 25% can be achieved if the route
    In the next step, we analyzed the conse-                through Bornholm Gat is avoided (Fig. 9).
quences of current-induced propagation of sub-
stances released from ships, aiming to route
ships along less dangerous paths. Following the             Discussion and conclusions
concept of equiprobability lines (Andrejev et
al. 2011, Soomere et al. 2011c), we calculated              In this study, we investigated the quantification
the environmentally safest fairways for cargo               of environmental risks associated with variable
transports from Oslo through the Sound and the              current-driven transport of harmful substances
Great Belt each to St. Petersburg for the annual            released from offshore sources. Our approach
mean risk probability distribution. When these              made use of spatio-temporal variations of ocean
fairways are compared with the frequently used              current patterns obtained from a high-resolu-
shipping route (Fig. 8), the general appearance             tion circulation model of the entire Baltic Sea.
Boreal Env. Res. Vol. 19 • Identifying high risk areas for environmental pollution in the Baltic Sea 149
Fig. 7. Average time to reach the coast for ensembles of daily particle releases along frequently used shipping
routes from Oslo to St. Petersburg (a and b) and from Oslo to Tornio (c and d) for the years 2006 (a and c) and
2007 (b and d) computed for 10-day particle drift. The maximum time to reach the coast (10 days) does not always
represent the real propagation time, but reflects that in the model experiment particles were only tracked during 10
days.
The baroclinic Rossby-radius of deformation senting an innovative low-cost technology of
is approximately 3–10 km after Fennel et al. environmental management of shipping and off-
(1991), thus the hydrodynamic model grid size shore activities (see also Soomere et al. 2011c).
is fine enough to capture physical features and The impact of the wind-induced surface drift on
processes where rotational effects are important. the transport of particles representing accidental
Generally, it was expected from our results that discharges of harmful substances was analyzed
strong temporal and spatial variability appears for two contrasting years (2006 and 2007). The
for the probability of coastal hits as well as for findings of our study indicate that variations in
the time required for particles to reach coastal the mean drift distances between the years and
areas. However, despite the existence of non-per- with respect to drift durations can be high, but
sistent circulation patterns in the various areas in surprisingly for the latter yielded no statistically
the Baltic (Lehmann et al. 2002), we showed independent results. This means that particle
that well-defined optimum locations for low risk transport depends on atmospheric conditions in
cargo transports exist in many parts along the terms of the strength and the direction of the pre-
most frequently used ship routes. Nevertheless, vailing forcing. Whereas for many regions of the
in some areas, only small deviations from these Baltic does not necessarily provide any reliable
locations could result in a rapid increase in the predictions when particles would reach coastal
risk for coastal environments (Soomere et al. areas. Generally, for most areas of the Baltic
2011b). Sea, discharges of harmful substances released
In principle, our study aimed to develop a along the major shipping routes, do not repre-
scientific platform for the entire Baltic Sea pre- sent worst-case scenarios, because during short150 Lehmann et al. • Boreal Env. Res. Vol. 19
Fig. 8. Average probability
to reach the coast for an
ensemble of daily particle
releases in 2002–2010
computed for 10-day par-
ticle drift. The dotted lines
indicate the frequently
used shipping route from
Oslo to St. Petersburg
(gray dots) and two envi-
ronmentally safer fairways
for the same connection
one using the direct path
through the Sound (white
dots) while the other one
uses the even safer fair-
way through the Great
Belt (black dots).
1
standard route
0.9 equiprobability safer fairway
through the Sound
0.8 equiprobability safer fairway
through the Great Belt
Probability for coastal hit
0.7
0.6
0.5
0.4
0.3
0.2
Fig. 9. Average probabil-
0.1 ity to reach the coast for
ensembles of daily parti-
0 cle releases in 2002–2010
at specific way-points
o
sø
lt
lm
nd
aa
g
Be
sl
r
bu
ho
Læ
la
m
O
along different shipping
ot
iiu
at
rs
rn
G
re
e
H
Bo
et
G
routes from Oslo to St.
.P
d/
un
St
Petersburg.
SoBoreal Env. Res. Vol. 19 • Identifying high risk areas for environmental pollution in the Baltic Sea 151
periods coastal pollution could not be expected. identify relevant risk categories which are widely
However, in the western Baltic (Lu et al. 2012) as known. Thus, knowledge obtained from our mod-
well as in the areas close to islands of Bornholm eling exercise can be compared with existing
and Gotland, particle releases close to their coasts concepts and results (Soomere et al. 2011c).
have to be seen as high risk probability areas. Independently of the specific results obtained
The present study suggests the applicability from this risk analysis of coastal pollution, the
of hydrodynamic models to assess the drift and study demonstrates that hydrodynamic models
resulting spatial distributions of oil pollutants provide an effective tool to account for the pas-
and other harmful substances in the Baltic Sea. sive movements of particles. Instead of iden-
Because of the highly spatially and temporally tifying high-risk coastal pollution areas, the
resolved release locations of drifters (68 215 per model is also suitable to identify areas with low
daily release), the capacity of the model enables probability of pollution impact, i.e. areas with
to realistically simulate Lagrangian dispersion low numbers of coastal hits. Hence, our model
in the Baltic to a high degree of confidence. approach might be helpful for the establish-
Our model approach does not explicitly incor- ment of “Marine Protected Areas” by using the
porate horizontal diffusion velocities, because information on “coastal areas with low risk of
the circulation in the Baltic, especially at the sea pollution” obtained from long-term spatial distri-
surface where the harmful substances mainly butions of harmful substances.
occur, is primarily wind-driven. Because of the Our modeling approach is quite simplistic
ephemeral nature of the wind conditions over and should be seen as a baseline exercise to be
the Baltic, the current fields are only slightly followed by more detailed and comprehensive
influenced by small-scale processes not resolved analyzes. More detailed structured maps of prob-
by our hydrodynamic model. In case baroclinic abilities can be obtained if the horizontal resolu-
currents become more important, transport and tion of the underlying circulation model is further
retention is mainly determined by the spatial increased (Andrejev et al. 2011), but this would
distribution of the mass field (i.e. temperature lead to even higher computational costs. The
and salinity). However, incorporating diffusion entire method is already computationally cost-
velocities will not generally alter drift patterns intensive. On the other hand, an easier parametri-
or reduce the uncertainty in the drift velocities, zation of transport processes responsible for the
it only could give a general impression of small identification of high and low risk areas would
scale processes on the variability of the spatial be desirable. These areas may be identified from
distributions of drifting particles. simplified but online-accessible physical forcing
Our numerical simulations provide detailed parameters, e.g. the Baltic Sea Index (BSI) (Leh-
information about the current patterns that allows mann et al. 2002, Hinrichsen et al. 2003). Gener-
to identify features of transport, which can be ally, drift model approaches are numerical tools
inferred neither from theoretical analyzes nor which might also be able to recapture observed
from extensive field experiments. The model patterns of environmental pollution in the Baltic
results are expected to substantially improve Sea. Taking into account ocean current forecast
our understanding of the current patterns in the fields defined as a model’s operational mode
Baltic Sea, thus leading to a better understand- could provide real-time assessments of spatio-
ing of meteorological forcing on pollution trans- temporal distributions of e.g. accidentally dis-
port. Secondly, our modeling approach reflects charged harmful substances. Furthermore, such
the high degree of the predictive capacity of a tool could potentially be utilized as monitoring
circulation and operational models. We focused technique to back-track substances from observa-
on current-induced drift of harmful substances tional locations to their initial sources.
released into the environment by ship accidents. Soomere et al. (2011c) suggested minimum
The outcome of our approach could potentially values of probability of coastal hits as an obvi-
contribute to the formulation of mathematical, ous measure of environmental gain. On the other
engineering and technological problems being hand, sailing along environmentally safest fair-
understandable for a wide range of experts to ways could result in significantly longer ship152 Lehmann et al. • Boreal Env. Res. Vol. 19
routes and hence in higher volumes of petrol ers. Marine Pollution Bulletin 64: 1375–1385.
Hurrel J.W. & Deser C. 2009. North Atlantic climate vari-
needed for transportation (Soomere et al. 2011d). ability: the role of the North Atlantic Oscillation. Jour-
Hence, conditionally optimized fairways should nal of Marine Systems 78: 28–41.
consider a balance between ecological and eco- Kalnay E., Kanamitsu M., Kistler R., Collins W., Deaven D.,
nomical gains. Gandin L., Iredell M., Saha S., White G., Woollen J.,
Zhu Y., Leetmaa A., Reynolds R., Chelliah M., Ebisu-
Acknowledgements: This work was jointly financed by zaki W., Higgins W., Janowiak J., Mo K.C., Ropelewski
funding from EU FP7 Framework Programme under Grant C., Wang J. Jenne R. & Joseph D. 1996. The NCEP/
Agreement no. 217246 made with the Baltic Sea research NCAR 40-years reanalysis project. Bulletin of the Amer-
and development programme BONUS and the Federal Min- ican Meteorological Society 77: 437–470.
istry of Education and Research, BMBF under grant no. Lehmann A., Hinrichsen H.-H. & Krauss W. 2002. Effects of
03F0495A, and by the EU FP7 framework project VEC- remote and local atmospheric forcing on circulation and
TORS (grant no. 266445). upwelling in the Baltic Sea. Tellus 54A: 299–316.
Lehmann A. & Javidpour J. 2010. Potential pathways of
invasion and dispersal of Mnemiopsis leidyi A. Agassiz
1865 in the Baltic Sea. Hydrobiologia 649: 107–114.
References Lehmann A., Getzlaff K. & Harlaß J. 2011. Detailed assess-
ment of climate variability in the Baltic Sea area for the
Andrejev O., Soomere T., Sokolov A. & Myrberg K. 2011. perido 1958 to 2009. Climate Research 46: 185–196.
The role of the spatial resolution of a three-dimensional Lehmann A., Myrberg K. & Höflich K. 2012. A statistical
hydrodynamic model for marine transport risk assess- approach to coastal upwelling in the Baltic Sea based on
ment. Oceanolgia 53: 309–334. the analysis of satellite data for 1990–2009. Oceanolo-
BACC Author Team 2008. Assessment of climate change for gia 54: 369–393.
the Baltic Sea Basin. Springer Verlag-Berlin. Lehtiniemi M., Lehmann A., Javipour J. & Myrberg K.
Cattiaux J., Vautraud R., Cassou C., Yiou P., Masson-Del- 2012. Spreading and physico-biological reproduction
motte V. & Codron F. 2010. Winter 2010 in Europe: a cold limitations of the invasive American comb jelly Mnemi-
extreme in a warming climate. Geophysical Research opsis leidyi in the Baltic Sea. Biological Invasions 14:
Letters 34: L20704, doi:10.1029/2010GL044613. 341–354.
Fennel W., Seifert T. & Kayser B. 1991. Rossby radii Lu X., Soomere T., Stanev E.V. & Murawski J. 2012.
and phase speeds in the Baltic Sea. Continental Shelf Identification of environmentally safe fairway in the
Research 11: 23–36 South-Western Baltic Sea and Kattegat. Ocean Dynam-
Getzlaff K., Lehmann A. & Harlaß J. 2011. The response of ics 62: 815–829.
the general circulation of the Baltic Sea to climate vari- Press W.H., Teukolsky S.A., Vetterling W.T. & Flannery B.P.
ability. BALTEX Newsletter 14: 13–16. 1992. Numerical recipes in Fortran 2nd ed. Cambridge
Gollasch S. & Leppäkoski E. 2007. Risk assessment and University Press, New York.
management scenarios for ballast water mediated spe- Soomere T., Viikmäe B., Delpeche N. & Myrberg K. 2010.
cies introductions into the Baltic Sea. Aquatic Invasions Towards identification of areas of reduced risk in the
2: 313–340. Gulf of Finland, the Baltic Sea. Proceedings of the Esto-
HELCOM 2010. Maritime activities in the Baltic Sea — an nian Academy of Sciences 59: 156–165.
integrated thematic assessment on maritime activities Soomere T., Delpeche N., Viikmäe B., Quak E., Meier
and response to pollution at sea in the Baltic Sea Region. H.E.M. & Döös K. 2011a. Patterns of current-induced
Baltic Sea Environment Proceedings 123: 1–64. transport in the surface layer of the Gulf of Finland.
Hinrichsen H.-H., Lehmann A., St.John M. & Brügge B. Boreal Environment Research 16(suppl. A): 49–63.
1997. Modelling the cod larvae drift in the Bornholm Soomere T., Berezovski M. & Quak E. 2011b. Modelling
Basin in summer 1994. Continental Shelf Research 17: environmentally friendly fairways using Lagrangian tra-
1765–1784. jectories: a case study for the Gulf of Finland, the Baltic
Hinrichsen H.-H., Böttcher U., Köster F.W., Lehmann A. & Sea. Ocean Dynamics 61: 1669–1680.
St.John M.A. 2003. Modelling the influence of atmo- Soomere T., Andrejev O., Myrberg K. & Sokolov A. 2011c.
spheric forcing conditions on Baltic cod early life stages: The use of Lagrangian trajectories for the identification
distribution and drift. Journal of Sea Research 49: of environmentally safe fairways. Marine Pollution Bul-
187–201. letin 62: 1410–1420.
Hinrichsen H.-H., Kraus G., Böttcher U. & Köster F. 2009. Soomere T., Andrejev O., Sokolov A. & Quak E. 2011d.
Identifying eastern Baltic cod nursery grounds using Management of coastal pollution by means of smart,
hydrodynamic modelling: knowledge for the design of placement of human activities. Journal of Coastal
Marine Protected areas. ICES Journal of Marine Science Research, Special Issue 64: 951–955.
66: 101–108. Viikmäe B., Soomere T., Viidebaum M. & Berezovski M.
Höglund A. & Meier H.E.M. 2012. Environmentally safe 2010. Temporal scales for transport patterns in the Gulf
areas and routes in the Baltic proper using Eulerian trac- of Finland. Estonian Journal of Engineering 16: 211–227.You can also read