The Burden of Diabetes in Illinois - Prevalence, Mortality, and Risk Factors 2012
←
→
Page content transcription
If your browser does not render page correctly, please read the page content below

The Burden of Diabetes in Illinois
Prevalence, Mortality, and Risk Factors
2012
This publication was supported in part by Cooperative Agreement CDC-RFA-DP09-901 from
the U.S. Centers for Disease Control and Prevention. Its contents are solely the responsibility of
the authors and do not necessarily represent the official view of the U.S. Centers for Disease
Control and Prevention.

Suggested citation: The Illinois Diabetes Burden 2012, Division of Chronic Disease Prevention
and Control, Office of Health Promotion, Illinois Department of Public Health.
Table of Contents
Executive Summary ...................................................................................................................................... 1
Introduction ................................................................................................................................................... 3
Types of Diabetes ......................................................................................................................................... 4
Prevalence of Diabetes in Illinois ................................................................................................................. 6
   Prevalence by Demographics .................................................................................................................... 6
   Prevalence by Socioeconomic Status and Other Status ............................................................................ 7
Diabetes in Children ................................................................................................................................... 10
   Weight Status of Children ....................................................................................................................... 10
   Nutrition and Physical Activity Status of Children ................................................................................ 11
Gestational Diabetes ................................................................................................................................... 13
Diabetes Mortality ...................................................................................................................................... 14
Risk Factors for Diabetes ............................................................................................................................ 16
   Prediabetes .............................................................................................................................................. 16
   Weight Status .......................................................................................................................................... 17
   Tobacco Use............................................................................................................................................ 19
   Alcohol Consumption ............................................................................................................................. 20
   Other Chronic Conditions ....................................................................................................................... 21
Complications from Diabetes...................................................................................................................... 22
Illinois Hospital Discharge Data ................................................................................................................. 24
Economic Costs .......................................................................................................................................... 26
Quality of Life............................................................................................................................................. 27
Access to Health Care ................................................................................................................................. 30
Projected Prevalence and Trend .................................................................................................................. 31
Diabetes Commission ................................................................................................................................. 32
Data Sources ............................................................................................................................................... 33
Bibliography ............................................................................................................................................... 35
Glossary of Terms ....................................................................................................................................... 36
List of Figures and Tables
Figure 1: Diabetes Prevalence in Adults, Illinois and the United States, 1995-2010
Figure 2: Percentage of Adults with Diabetes by Demographics, Illinois, 2010
Figure 3: Percentage of Adults with Diabetes by Socioeconomic Status and Other Status, Illinois,
2010
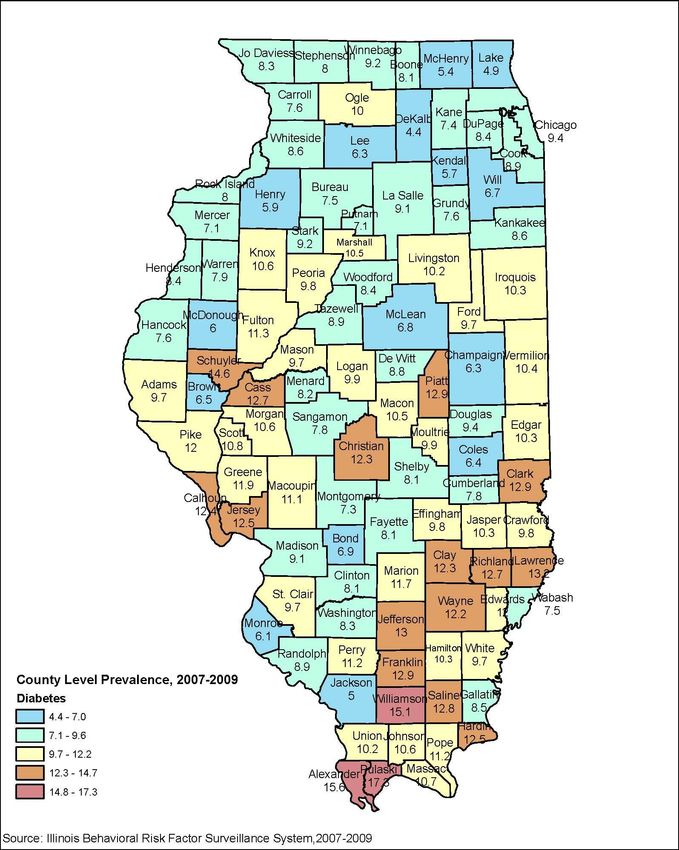
Figure 4: Percentage of Illinois Adults with Diabetes by County, Illinois, 2007-2009
Figure 5: Percentage of Illinois School Students Who Are Obese, Illinois, 2009
Figure 6: Percentage of Illinois School Students Who Are Overweight, Illinois, 2009
Figure 7: Percentage of Illinois School Students Who Ate Fruits and Vegetables Five or More
Times in the Past Seven Days, Illinois, 2009
Figure 8: Percentage of Students Who Were Physically Active for a Total of at Least 60 Minutes
per Day on Five or More of the Past Seven Days, Illinois, 2009
Figure 9: Percentage of Live Births with Diabetic Mothers by Race and Ethnicity, Illinois, 1989-
2009
Figure 10: Age-Adjusted Diabetes Mortality Rate per 100,000, Illinois and United States, 2000 –
2009
Figure 11: Age-Adjusted Diabetes Mortality Rate per 100,000 by Age-Group, Illinois, 2000 –
2009
Figure 12: Age-Adjusted Diabetes Mortality Rate per 100,000 by Gender and Race/Ethnicity,
Illinois, 2000-2009
Figure 13: Percentage of Adults with Prediabetes by Demographics, Illinois, 2010
Figure 14: Weight Status of Adults With and Without Diabetes, Illinois, 2010
Figure 15: Prevalence of Diabetes with an Overlay of Overweight and Obesity Status by County,
Illinois, 2007-2009
Figure 16: Smoking Status of Adults With and Without Diabetes, Illinois, 2010
Figure 17: Alcohol Consumption Status of Adults With and Without Diabetes, Illinois 2010
Table 1: Chronic Conditions of Adults With and Without Diabetes, Illinois, 2010
Figure 18: Percentage Change in Hospital Discharges for Type 1 Uncontrolled Diabetes Mellitus
Codes, Illinois, 2005-2010
Figure 19: Percentage Change in Hospital Discharges for Type 2 Uncontrolled Diabetes Mellitus
Codes, Illinois, 2005-2010
Figure 20: General Health Status among Adults With and Without Diabetes, Illinois, 2010
Figure 21: Physical Health Status among Adults With and Without Diabetes, Illinois, 2010
Figure 22: Life Satisfaction among Adults With and Without Diabetes, Illinois, 2010
Figure 23: Disability, Activity Limitation among Adults With and Without Diabetes, Illinois,
2010
Table 2: Immunization, Physical Activity and Fruit/Vegetable Consumption among Adults
With and Without Diabetes, Illinois, 2010
Figure 24: Health Care Access among Adults With and Without Diabetes, Illinois, 2010
Figure 25: Forecast: Percent of Adults with Diabetes, Illinois and the United States, 2010-2020Executive Summary
In 2009, the Robert Wood Johnson Foundation reported that Illinois ranked fourth nationally
with 20 percent of children meeting the definition of obesity and or overweight. In Illinois, the
number of all ages diagnosed with diabetes has more than doubled, reaching approximately
800,000 in 2011 with an additional 500,000 people who are not aware they have the disease,
according to the state’s Behavior Risk Factor Surveillance System (BRFSS) data. The 2012
Burden of Diabetes in Illinois report attempts to quantify the impact of this disease by outlining
the prevalence, risk factors, costs, mortality, prevention, quality of life, and projected future
trends.
Type 1 diabetes (insulin dependent) and type 2 (non-insulin dependent) diabetes are a chronic
disease that can harm other body organs and cause kidney failure, blindness, heart attacks and
strokes, and amputations. According to the U.S. Centers for Disease Control and Prevention
(CDC), diabetes is the seventh leading cause of death in the United States. Approximately, 8.3
percent of the U.S. population, or 25.8 million people (all ages), have diabetes. Of these,
approximately 7 million people do not know they have diabetes; making them at risk to
develop other health complications due to their unmanaged diabetes.
The prevalence of diabetes increases with age according to the 2010 BRFSS. Of Illinois adults
with diabetes, 11.4 percent are between 45-64 years of age; 19.8 percent are 65 years of age or
older. The prevalence of diabetes is higher among females than males. Diabetes is more
prevalent in certain population sub-groups. In 2010, the prevalence of diagnosed diabetes was
higher among non-whites, as compared to whites. Hispanics/Latinos have a higher prevalence
than non Hispanics/Latinos. In addition, people with a disability have a higher prevalence of
diagnosed diabetes than those without a disability.
The major risk factors for pre-diabetes or developing diabetes include being overweight or
obese; physically inactive; unhealthy diet; tobacco use; age; ethnicity; chronic conditions, such
as high cholesterol; hypertension; and family history. Approximately 10 percent of Illinois
adults over the age of 65 years have prediabetes. The risk for developing prediabetes also is
higher for non-whites compared to whites, females compared to males, and non-
Hispanics/Latinos compared to Hispanics/Latinos.
1Health care disparities include persons with diabetes who are uninsured or underinsured,
especially in Illinois rural communities. Diabetes increases the risk for additional chronic
diseases. For example, the highest risk is high blood pressure at 71 percent in adults with
diabetes versus 23 percent of adults without diabetes and high cholesterol at 61 percent in
adults with diabetes versus 36 percent without diabetes. The American Diabetes Association
(ADA) estimates medical expenses for people with diabetes are more than two times higher
than for people without diabetes. In the United States in 2007, direct medical costs for diabetes
were $116 billion, with $58 billion attributed to disability, work loss, and premature mortality.
Hospitalization rates in Illinois show that ketoacidosis, which is preventable with blood sugar
management, is the single most major complication of both type 1 and type 2 diabetes.
The adult mortality rate for diabetes in 2007 (the most recent available data) was 23.7 per
100,000 compared to the U.S. rate of 22.2 per 100,000. African Americans with diabetes have
the highest mortality rate for both females (33.2 per 100,000) and males (30.2 per 100,000),
according to the Illinois Department of Public Health’s Center for Health Statistics. Death rates
also vary by sex and race.
It is estimated that by 2020 the number of adults with diabetes will increase 43 percent
nationally and 25 percent for Illinois. These projections emphasize the importance of access to
medical care, developing a healthy lifestyle, and the importance of self-management of diabetes
and other chronic diseases. Many complications of diabetes can be prevented or delayed by
controlling blood glucose, blood pressure, and high cholesterol through lifestyle changes.
2Introduction
In Illinois, according to the Illinois Behavior Risk Factor Surveillance System (BRFSS) data,
over the past 20 years, the number of people with diagnosed diabetes has more than doubled to
approximately 800,000 in 2011 and an additional 500,000 people who are not aware that they
have the disease. Diabetes is the seventh leading cause of death in the United States. The U.S.
Centers for Disease Control and Prevention (CDC) estimates that 8.3 percent of the U.S.
population or 25.8 million people (all ages) have diabetes. Of these approximately 7 million
people do not know they have diabetes; making them at risk to develop other health
complications due to their unmanaged diabetes.
Diabetes is a chronic, progressive condition. The term diabetes refers either to a deficiency of
insulin or to the body's decreased ability to use insulin. Insulin, a hormone secreted by the
pancreas, allows glucose (sugar) to enter body cells and be converted to energy. Insulin also is
needed to synthesize protein and to store fats. In uncontrolled diabetes, glucose and lipids (fats)
remain in the bloodstream and, in time, damage the body's vital organs and contribute to heart
disease, stroke, vision loss, kidney disease and nerve damage.
Diabetes complications are preventable. The American Diabetes Association (ADA) estimates
that medical expenses for people with diabetes are more than two times higher than for people
without diabetes. ADA estimated that the total direct and indirect costs of diabetes in the
United States in 2007 was approximately $174 billion; of which $116 billion was the direct
medical expenditures and $58 billion was attributable to disability, work loss and premature
mortality. In Illinois, the cost of diabetes in 2006 was an estimated $7.3 billion, which includes
excess medical costs of $4.8 billion attributed to diabetes, and lost productivity valued at $2.5
billion.
3Types of Diabetes
Type 1 Diabetes
Type 1 diabetes is sometimes called insulin-dependent, immune-mediated, or juvenile-onset
diabetes and accounts for 10 percent of diabetes cases. It is caused by an autoimmune reaction
where the body’s defense system attacks the insulin-producing cells. People with type 1
diabetes produce very little or no insulin. The disease can affect people of any age, but usually
occurs in children or young adults. People with this form of diabetes need injections of insulin
every day in order to control their blood glucose levels.
Type 2 Diabetes
Type 2 diabetes accounts for at least 90 percent of diabetes cases. Type 2 diabetes is called
non-insulin dependent diabetes or adult-onset diabetes and is characterized by insulin resistance
and relative insulin deficiency. The diagnosis of type 2 diabetes usually occurs after the age of
40, but can occur earlier, especially in populations with high diabetes prevalence. Type 2
diabetes can remain undetected for many years and the diagnosis is often made from associated
complications or incidentally through an abnormal blood or urine glucose test. It is often, but
not always, associated with obesity, which itself can cause insulin resistance and lead to
elevated blood glucose levels. Type 2 diabetes is preventable by managing risk factors. Thirty
minutes of moderate physical activity five-days-a-week and eating a variety of foods that are
low in fat along with reducing the amount of calorie intake each day are recommended by the
CDC and the American Diabetes Association.
Gestational Diabetes
Gestational diabetes mellitus (GDM) is a form of diabetes consisting of high blood glucose
levels during pregnancy. GDM affects the mother in late pregnancy, after the baby's body has
been formed, but while the baby is busy growing. One in 25 pregnancies develops GDM, which
usually disappears after pregnancy. Untreated or poorly controlled GDM can have a negative
impact on the baby and lead to Macrosomia, also known as big baby syndrome. Macrosomia is
defined as a fetus or infant that weighs more than 4,000 grams (8 lb 13 oz) to 4,500 grams (9 lb
15 oz) regardless of gestational age. Women with GDM and their offspring are at an increased
4risk of developing type 2 diabetes later in life. Approximately half of women with a history of
GDM develop type 2 diabetes within five to 10 years after delivery.
5Prevalence of Diabetes in Illinois
The percentage of adult Illinoisans with diagnosed diabetes rose from 5.4 percent in 1995 to 8.5
percent in 2010, an increase of nearly 60 percent in the last 15 years. Nationwide the diabetes
prevalence has nearly doubled during the same time period from 4.4 percent to 8.3 percent. An
additional 464,520 Illinois adults (5.2%) have been told they have pre-diabetes.
Figure 1: Diabetes Prevalence in Adults, Illinois and the United States, 1995-2010
10%
8%
Percent of Adults
6%
4%
2%
0%
1995 1996 1997 1998 1999 2000 2001 2003 2004 2005 2006 2007 2008 2009 2010
Illinois 5.4% 5.8% 7.0% 6.2% 6.4% 6.2% 6.6% 7.3% 6.0% 7.9% 8.1% 8.8% 8.3% 8.2% 8.5%
United States 4.4% 4.5% 4.8% 5.4% 5.7% 6.2% 6.6% 7.2% 7.1% 7.3% 7.5% 8.1% 8.3% 8.4% 8.3%
Source: Behavioral Risk Factor Surveillance System, 1995-2010
Prevalence by Demographics
The prevalence of diabetes increases with age. Of Illinois adults with diabetes, 11.4 percent are
between 45-64 years of age and 19.8 percent are 65 years of age or older. The prevalence of
diabetes is higher among females (8.6%) than males (8.3%). Diabetes is more prevalent in
certain population sub-groups. In 2010, the prevalence of diagnosed diabetes was higher among
non-whites (11.0%), as compared to whites (7.4%). Hispanics/Latinos (10.2%) also had higher
prevalence than non Hispanics/Latinos (8.3%). People with a disability have a higher
prevalence of diagnosed diabetes than those without a disability (15.2% vs 6.8%, respectively).
6Figure 2: Percentage of Adults with Diabetes by Demographics, Illinois, 2010
Age Group Gender Race Ethnicity Disability
25%
19.8%
Percent of Adults
20%
15.2%
15%
11.4% 11.0% 10.2%
10% 8.3% 8.6% 7.4% 8.3%
6.8%
5% 3.6%
0%
Source: Illinois Behavioral Risk Factor Survelliance System, 2010
Prevalence by Socioeconomic Status and Other Status
The prevalence of diabetes also is associated with socioeconomic factors, such as income and
education. Of Illinois adults with household income less than $15,000, 15 percent have diabetes
compared to 5.6 percent who have an income higher than $50,000. The prevalence of diabetes is
higher for adult Illinoisans with less than a high school degree (17.1%) compared to those who
have graduated from college (5.9%). More retired adults have diabetes (21.7%) compared to
those who are employed (5.3%). The prevalence is highest for widowed adults (20.7%)
compared to the ones who are married (8.4%).
7Figure 3: Percentage of Adults with Diabetes by Socioeconomic Status and Other Status,
Illinois, 2010
Income-Level Education-Level Employment-Status Marital-Status
25%
21.7%
20.7%
20%
Percent of Adults
17.1%
15.0%
15% 12.7%
12.2%
9.7%
10% 8.0% 8.4% 8.2% 8.4% 8.2%
5.6% 5.9% 5.3% 4.7%
5% 3.9%
0%
Source: Illinois Behavior Risk Factor Survelliance System, 2010
8Figure 4: Percentage of Illinois Adults with Diabetes by County, Illinois, 2007-2009
9Diabetes in Children
SEARCH for Diabetes in Youth is a multicenter study funded by CDC and the National
Institutes of Health to examine diabetes (type 1 and type 2) among children and adolescents in
the United States. SEARCH findings for 2002-2005 (the most recent data available) include:
Among youth aged 10 years or older, the rate of new cases was 18.6 per 100,000 each
year for type 1 diabetes and 8.5 per 100,000 for type 2 diabetes.
Non-Hispanic white youth had the highest rate of new cases of type 1 diabetes (24.8 per
100,000 per year among those younger than 10 years and 22.6 per 100,000 per year
among those aged 10 to19 years). Among non-Hispanic white youth aged 10 to 19
years, the rate of new cases was higher for type 1 than for type 2 diabetes.
For Asian/Pacific Islander and American Indian youth aged 10 to 19 years, the rate of
new cases was greater for type 2 than for type 1 diabetes. Among non-Hispanic black
and Hispanic youth aged 10 to 19 years, the rates of new cases of type 1 and type 2
diabetes were similar.
Weight Status of Children
In Illinois, there has been an unprecedented growth in the weight of the children in recent years.
Illinois currently ranks fourth in the U.S. with 20 percent of the state’s children meeting the
definition for obese, defined as having a Body Mass Index (BMI) above 95 percent, according
to the Robert Wood Johnson Foundation: Obesity 2009 report. Only Mississippi, Georgia and
Kentucky have higher rates of childhood obesity.
According to the Illinois 2009 Youth Risk Behavior Survey (YRBS), 35 percent of Illinois
children are overweight or obese. Black students have the highest rates of obesity (20.5%) and
overweight (20.2%). More obese students are found in 12th grade (13.6%) than in lower grades,
while the greatest percent of overweight children (16.1%) are in 11th grade. The greatest
percentage of students that are overweight are those that are age 15 or younger (15.1%). This
same group also has the smallest percentage of students that are obese (9.6%).
10Figure 5: Percentage of Illinois School Students Who Are Obese, Illinois, 2009
Age Grade Race/Ethnicity
25%
Percent of Students
20%
15% 13.3% 13.6%
12.3% 12.0% 11.3%
9.6% 10.0% 9.7%
10% 8.8%
5%
0%
Source: Illinois Youth Risk Behavior Survey, 2009
Figure 6: Percentage of Illinois School Students Who Are Overweight, Illinois, 2009
Age Grade Race/Ethnicity
25%
20.2%
Percent of Students
20% 18.0%
16.1% 16.7%
15.1% 14.6%
15% 12.4% 12.5% 13.0%
11.7%
10%
5%
0%
Source: Illinois Youth Risk Behavior Survey, 2009
Nutrition and Physical Activity Status of Children
About 17.7 percent of Illinois middle and high school students ate fruits and vegetables five or
more times per day during the past seven days and 47.2 percent engaged in some form of
physical activity for more than 60 minutes per day during the last seven days.
11Figure 7: Percentage of Illinois School Students Who Ate Fruits and Vegetables Five or
More Times in the Past Seven Days, Illinois, 2009
Age Grade Race/Ethnicity
30%
24.1%
25%
Percent of Students
21.4%
18.8% 19.9%
20% 18.7% 18.1% 18.1%
16.3% 15.4%
15.0%
15%
10%
5%
0%
Illinois Youth Risk Behavior Survey, 2009
Figure 8: Percentage of Students Who Were Physically Active for a Total of at Least 60
Minutes per Day on Five or More of the Past Seven Days, Illinois, 2009
Age Grade Race/Ethnicity
60%
50.6% 51.9%
47.5% 46.7% 49.0%
46.3%
Percent of Students
50% 42.9% 44.6%
41.5% 39.4%
40%
30%
20%
10%
0%
Source: Illinois Youth Risk Behavior Survey, 2009
12Gestational Diabetes
The rate of gestational diabetes in Illinois has increased from 2.1 percent in 1989 to 4.5 percent
in 2009, according to birth certificate data from the Illinois Adverse Pregnancy Outcomes
Reporting System, doubling over this 20 year time period. Gestational diabetes is more
common among groups with a higher prevalence of diabetes overall. The prevalence rates, over
this time period, were highest for Asians and Hispanics with each population group showing an
increase of 80 percent and 176 percent respectively.
Figure 9: Percentage of Live Births with Diabetic Mothers by Race and Ethnicity,
Illinois, 1989-2009
8%
7%
6%
Percentof Live Births
5%
4%
3%
2%
1%
0%
89 90 91 92 93 94 95 96 97 98 99 00 01 02 03 04 05 06 07 08 09
All 2.1 2.0 2.2 2.3 2.1 2.1 2.1 2.0 2.2 2.2 2.5 2.7 3.0 3.4 3.1 3.3 3.6 3.9 4.2 4.4 4.5
Asian 4.0 3.7 3.7 3.6 4.1 3.8 4.0 3.2 3.5 4.6 4.7 4.8 5.7 6.6 5.7 6.2 6.8 6.0 6.9 7.0 7.2
Black 1.1 0.8 1.3 1.3 1.4 1.5 1.6 1.6 1.7 1.8 1.9 2.0 2.4 2.3 2.2 2.2 2.4 2.8 3.1 3.2 3.2
Hispanic 2.1 1.8 1.9 2.0 2.0 2.0 2.1 1.8 2.1 2.3 2.8 3.2 3.5 4.2 4.1 4.1 4.7 4.8 5.4 5.8 5.8
White 2.4 2.4 2.5 2.6 2.4 2.2 2.2 2.2 2.3 2.2 2.4 2.6 2.9 3.1 2.8 3.0 3.2 3.6 3.8 3.8 4.0
Source: Adverse Pregnancy Outcomes Reporting System, Division of Epidemiological Studies, 1989-2009
13Diabetes Mortality
In 2009, the diabetes mortality rate was 20.5 per 100,000 for Illinois compared to the national
rate of 20.9 per 100,000, according to the National Center for Health Statistics. In the ten year
time period, 2000-2009, diabetes was the 5th leading cause of death and responsible for almost
3 percent of all deaths in Illinois and the U.S. Over this same time period, diabetes mortality
rates significantly decreased in Illinois (2.3 percent) and nationally (2.1 percent).
Figure 10: Age-Adjusted Diabetes Mortality Rate per 100,000, Illinois and United States,
2000-2009
30
Age-Adjusted Rate per 100,000
25
20
15
10
5
0
2000 2001 2002 2003 2004 2005 2006 2007 2008 2009
US 24.9 25.3 25.5 25.4 24.6 24.8 23.4 22.6 21.9 20.9
Illinois 24.9 25.5 24.6 24.5 24.4 23.9 21.8 22.0 21.5 20.5
Source: National Center for Health Statistics, Data Release April 2012
Diabetes mortality rates increase with age. The National Center for Health Statistics data
indicates adults over the age of 85 years have the highest mortality rate for diabetes in Illinois
(311.6 per 100,000) and the U.S. (307.2 per 100,000). The number of diabetes deaths for the
75-84 age group was higher for Illinois (170.4 per 100,000) compared to the U.S. (167.5 per
100,000). Diabetes mortality for all other age groups in Illinois was lower compared to the U.S.
14Figure 11: Age-Adjusted Diabetes Mortality Rate per 100,000 by Age, Illinois and United
States, 2000-2009
350
Age-Adjusted Rate per 100,000
300
250
200
150
100
50
0
25-34 35-44 45-54 55-64 65-74 75-84 85+
US 1.6 4.6 13.2 36.3 84.9 167.5 307.2
IL 1.3 3.9 11.9 33.6 82.1 170.4 311.6
Source: National Center for Health Statistics, Data Release April 2012
Diabetes mortality rates also vary by sex and race/ethnicity. Males (27.0 per 100,000) have a
higher mortality rate than females (20.6 per 100,000). By race/ethnicity, black, non-Hispanics
have the highest mortality rate for both males (43.5 per 100,000) and females (37.7 per
100,000). This is followed by Hispanic males (30.3 per 100,000) and females (25.9 per
100,000) and white, non-Hispanic males (24.6 per 100,000) and females (17.8 per 100,000).
Figure 12: Age-Adjusted Diabetes Mortality Rate per 100,000 by Sex and Race/Ethnicity,
Illinois, 2000-2009
50
Age-Adjusted Rate per 100,000
40
30
20
10
0
White, Non- Black, Non-
All Races/Ethnicity Hispanic
Hispanic Hispanic
Male 27.0 24.6 43.5 30.3
Female 20.6 17.8 37.7 25.9
Source: National Center for Health Statistics, Data Release April 2012
15Risk Factors for Diabetes
Prediabetes
People with impaired glucose tolerance (IGT) and/or impaired fasting glucose (IFG) are known
as prediabetic and have an increased risk of developing diabetes. People with prediabetes have
glucose levels that are higher than normal but not high enough to indicate diabetes. Most
people with prediabetes are at a high risk of developing type 2 diabetes, heart diseases, and
stroke. About 79 million American adults aged 20 years and above had prediabetes in 2010.
According to the 2010 BRFSS, prediabetes increases with age and approximately about 10
percent of Illinois adults over the age of 65 years have prediabetes. The risk for developing
prediabetes also is higher for non-whites (6.4%) compared to whites (4.9%), females (5.8%)
compared to males (4.7%), and non-Hispanics/Latinos (5.4%) compared to Hispanics/Latinos
(3.6%). About 9.8 percent of adults with a disability have prediabetes.
Figure 13: Percentage of Adults with Prediabetes by Demographics, Illinois, 2010
Age-Groups Race Gender Ethnicity Disability
12%
9.9% 9.8%
10%
Percent of Adults
8.0%
8%
6.4%
5.8% 5.4%
6% 4.9% 4.7% 4.3%
3.6%
4%
2.5%
2%
0%
Source: Illinois Behavioral Risk Factor Survelliance System, 2010
16Weight Status
People who are obese and/or do not exercise regularly are at an increased risk of developing
diabetes. Comparing Illinois adults with and without diabetes among the BRFSS respondents,
the obesity rate among adults with diabetes (56%) is higher than among adults without diabetes
(25.5%). The overweight status is similar for adults with diabetes (30%) and without diabetes
(34%). A smaller percentage of adults with diabetes are categorized as underweight or normal
weight (14%) compared to adults without diabetes (41%).
Figure 14: Weight Status of Adults With and Without Diabetes, Illinois, 2010
60%
50%
Percent of Adults
40%
30%
20%
10%
0%
Underweight/Normal Overweight Obese
Adults with diabetes 14% 30% 56%
Adults without diabetes 41% 34% 25%
Source: Illinois Behavioral Risk Factor Surveillance System, 2010
17Figure 15: Percentage of Illinois Adults with Diabetes with Overweight and Obesity Status by
County, Illinois, 2007-2009
18Tobacco Use
Tobacco usage increases the risk for developing diabetes, as it increases blood sugar levels that
lead to insulin resistance and consequently diabetes. According to 2010 BRFSS data, 13
percent of Illinois adults with diabetes are current smokers and 38 percent are former smokers.
The percentage of adults with diabetes who have never smoked (49%) are less than adults
without diabetes (61%) who have never smoked.
Figure 16: Smoking Status of Adults With and Without Diabetes, Illinois, 2010
70%
60%
Percent of Adults
50%
40%
30%
20%
10%
0%
Smoker Former Smoker Non-Smoker
Adults with diabetes 13% 38% 49%
Adults without diabetes 17% 22% 61%
Source: Illinois Behavioral Risk Factor Surveillance System, 2010
19Alcohol Consumption
Chronic alcohol use causes chronic inflammation of the pancreas (pancreatitis), which impairs
its ability to secrete insulin, resulting in diabetes. A lower percentage of Illinois adults with
diabetes report acute/binge drinking (11%) when compared to adults without diabetes (19%).
Figure 17: Alcohol Consumption Status of Adults With and Without Diabetes, Illinois,
2010
20%
15%
Percent of Adults
10%
5%
0%
At Risk for At Risk for Chronic
Acute/Binge Drinking Drinking
Adults with diabetes 11% 3%
Adults without diabetes 19% 5%
Source: Illinois Behavioral Risk Factor Surveillance System, 2010
20Other Chronic Conditions
People with high triglycerides, high blood pressure and high cholesterol are at an increased risk
for developing diabetes. According to the 2010 Illinois BRFFS survey, adults with diabetes had
a higher percentage of high blood pressure (71%) and high cholesterol (61%) compared to
adults without diabetes. Similarly, there were relatively higher percentages of adults with
diabetes who had a heart attack (14%), had chronic obstructive pulmonary disease-COPD (8%),
and had a stroke (10%) compared to the adults without diabetes. A higher percentage of adults
with diabetes had arthritis (47%) compared to adults without diabetes. Adults with diabetes also
had marginally higher chances of having asthma (13%) and cancer (15%), when compared to
adults without diabetes.
Table 1: Other Chronic Conditions of Adults With and Without Diabetes, Illinois, 2010
Chronic Conditions Adults with Adults without
Diabetes Diabetes
Have High Blood Pressure 71% 23%
Have High Cholesterol 61% 36%
Have Chronic Obstructive Pulmonary Disease (COPD) 8% 4%
Had Heart Attack 14% 3%
Had Stroke 10% 2%
Currently have Asthma 13% 9%
Have Arthritis 47% 24%
Have Cancer 15% 7%
Source: Illinois Behavioral Risk Factor Surveillance System, 2010
21Complications from Diabetes
Diabetes increases the risk for many serious health problems. Too much glucose in the blood
can lead to serious irreversible health problems, including heart disease and damage to the
nerves and kidneys. However, through early detection, improved delivery of care, better
education, and other lifestyle changes, the onset of these conditions can be delayed. Some of
the common complications and health risks of diabetes are highlighted below.
Diabetic Nephropathy/Ketoacidosis (Kidney Damage)
Diabetes can damage the blood vessels in the kidneys so they can no longer filter out waste.
This damage is called diabetic nephropathy. Diabetes is the most common cause of kidney
failure, accounting for nearly 44 percent of new cases. Nearly 26 million people in the United
States have type 2 diabetes and nearly 180,000 people are living with kidney failure as a result
of diabetes. People with kidney failure must undergo dialysis, an artificial blood-cleaning
process, or transplantation to receive a healthy kidney from a donor. In 2005, care for patients
with kidney failure cost the United States nearly $32 billion.
Diabetic Neuropathy (Nerve Damage)
Diabetic neuropathies are a family of nerve disorders caused by diabetes. People with diabetes
can, over time, develop nerve damage throughout the body. Symptoms may include pain,
tingling, or numbness in the hands, arms, feet, and legs. Nerve problems can occur in every
organ system, including the digestive tract, heart, and sex organs. About 60 to 70 percent of
people with diabetes have some form of neuropathy. People with diabetes can develop nerve
problems at any time, but risk rises with age and longer duration of diabetes.
Diabetic Retinopathy (Eye Problems)
Diabetes can damage and weaken the small blood vessels in the retina. This damage is called
diabetic retinopathy. When the blood vessels of the retina are damaged, fluid can leak from
them and cause swelling. The swelling and fluid can cause blurry vision and make it hard for
you to see. If retinopathy gets worse, it may lead to blindness. People who have diabetes should
have an eye exam once a year.
22Heart Disease and Stroke
People who have diabetes are at greater risk for heart disease and stroke. The risk is even
greater for people who have diabetes and smoke, have high blood pressure, have a family
history of heart disease, or are overweight. Heart disease and stroke are the most common
causes of morbidity and mortality among people with diabetes.
23Illinois Hospital Discharge Data
According to Illinois hospital discharge data, diabetes ketoacidosis is the single most major
complication for both type 1 and type 2 diabetes. The incidence of diabetes ketoacidosis
increased by 236.1 percent between 2005-2010 for uncontrolled type 1 diabetes and by 90.8
percent for type 2 diabetes in the same time range. The second major complication from
diabetes is nerve damage and is called diabetes neuropathy. The incidence of diabetes
neuropathy increased by 63.6 percent for type 1 diabetes and by 82.8 percent for type 2
diabetes between 2005-2010.
Figure 18: Percentage Change in Hospital Discharges for Type 1 Uncontrolled Diabetes
Mellitus Codes, Illinois, 2005-2010
250% 236.1%
200%
150%
Percent Change
100%
58.2% 63.6%
50%
31.1%
16.9%
-1.9%
0%
No Ketoacidosis Renal Opthalmic Neurological Pheripheral Other
Complications Complications Complications Complications Circulatory Complications
-50%
-41.7%
Source: Illinois Hospital Discharge Data, Division of Policy, Planning, Statistics, Department of Public Health, 2010
24Figure 19: Percentage Change in Hospital Discharges for Type 2 Uncontrolled Diabetes
Mellitus Codes, Illinois, 2005-2010
100%
90.8%
90% 82.8%
80%
Percent Change
67.7% 66.0%
70%
60%
47.4%
50%
40%
29.8% 27.1%
30%
20%
10%
0%
No Ketoacidosis Renal Opthalmic Neurological Pheripheral Other
Complications Complications Complications Complications Circulatory Complications
Source: Illinois Hospital Discharge Data, Division of Policy, Planning, Statistics, Department of Public Health, 2010
25Economic Costs
The American Diabetes Association’s (ADA) Diabetes Cost Calculator estimates the costs of
diabetes at the national and state levels. People with diagnosed diabetes, on average, have
medical expenditures that total approximately 2.3 times higher than the expenditures would be
in the absence of diabetes. Direct costs pertain to the medical expenditures incurred with
treating and controlling the symptoms and the complications of diabetes. Indirect costs include
increased factors, such as absenteeism, reduced productivity, and lost productive capacity due
to early mortality. According to the ADA, the estimated total cost of diabetes in 2007 for the
United States was $174 billion, including $116 billion in excess medical expenditures and $58
billion in reduced national productivity. The total cost of diabetes for people in Illinois in 2006
was estimated at $7.3 billion. This estimate includes excess medical costs of $4.8 billion
attributed to diabetes, and lost productivity valued at $2.5 billion.
26Quality of Life
Quality of life is an important consideration for people with diabetes. The Illinois BRFSS
survey asked participants, people with and without diabetes, about their access to health care
and their quality of life.
The estimated mean of healthy days last month was higher for adults without diabetes (24 days)
compared to adults with diabetes (19 days), which indicates persons with diabetes had fewer
healthy days each month due to their disease.
When compared to adults without diabetes, a lower percentage of adults with diabetes reported
a general health status of excellent/very good health (16.4%). Furthermore, a higher percentage
of adults with diabetes report fair health (69.5%) and poor health (14.1%) when compared to
adults without diabetes.
Figure 20: General Health Status among Adults With and Without Diabetes, Illinois, 2010
80%
Percent of Adults
60%
40%
20%
0%
Excellent/
Good /Fair Poor
Very Good
Adults with diabetes 16.4% 69.5% 14.1%
Adults without diabetes 57.1% 39.8% 3.1%
Source: Illinois Behavioral Risk Factor Surveillance System, 2010
There is a difference between adults with and without diabetes, when asked about the number
of days during the last month when their physical health was not good. Only 42 percent of the
adults with diabetes said their physical health was good last month compared to 64.4 percent of
the adults without diabetes. A higher percentage of adults with diabetes (30.7%) said their
physical health was not good last month for 8-30 days compared to adults without diabetes
(10.7%).
27Figure 21: Physical Health Status among Adults With and Without Diabetes, Illinois,
2010
70%
60%
Percent of Adults
50%
40%
30%
20%
10%
0%
None 1-7 Days 8-30 Days
Adults with diabetes 42.0% 27.3% 30.7%
Adults without diabetes 64.4% 24.9% 10.7%
Source: Illinois Behavioral Risk Factor Surveillance System, 2010
The percentage of adults with diabetes who said that they were satisfied with their life (93.6%)
was lower than adults without diabetes (96.1%).
Figure 22: Life Satisfaction among Adults With and Without Diabetes, Illinois, 2010
100%
Percent of Adults
80%
60%
40%
20%
0%
Very Satisfied/Satisfied Dissatisfied/Very Dissatisfied
Adults with diabetes 93.6% 6.4%
Adults without diabetes 96.1% 3.9%
Source: Illinois Behavioral Risk Factor Surveillance System, 2010
A higher percentage of adults with diabetes have a disability (15%) compared to adults without
diabetes (3.5%). Additionally a higher percentage of adults with diabetes reported activity
limitations due to any health problem (31.6%) compared to adults without diabetes (16.3%).
28Figure 23: Disability, Activity Limitation among Adults With and Without Diabetes,
Illinois, 2010
40%
Percent of Adults
30%
20%
10%
0%
Activity Limitation Due
Disability
to Health Problems
Adults with diabetes 31.6% 15.0%
Adults without diabetes 16.3% 3.5%
Source: Illinois Behavioral Risk Factor Surveillance System, 2010
A higher percentage of adults with diabetes received both their flu vaccine (56%) and
pneumonia vaccine (50%) when compared with adults without diabetes. A lower percentage of
adults with diabetes reported no exercise in the past 30 days (65%) than adults without diabetes
(75%). Consuming at least five servings of fruits/vegetables a day is similar for adults with
diabetes (24%) and those without diabetes (22%). Similarly, only 65 percent of the adults with
diabetes reported they engage in some form of exercise in the last 30 days compared to adults
without diabetes (76%).
Table 2: Physical Activity, Immunization and Fruit/Vegetable Consumption among
Adults with and Without Diabetes, Illinois, 2010
Adults with Adults without
diabetes diabetes
Had any exercise in the past 30 days 65% 76%
Had flu vaccination in past 12 months 56% 37%
Had a pneumonia shot 50% 24%
Had at least five or more servings of fruits/vegetables 24% 22%
29Access to Health Care
A higher percentage of adults with diabetes (16.7%) avoided medical care in the last 12 months
due to costs, which makes it more difficult for them to get appropriate care and assistance with
the management of their condition. A higher percentage of adults with diabetes said that they
have a primary care physician (94.7%) compared to adults without diabetes (83.4%). However,
a lower percentage of adults with diabetes (8.5%) had any health care coverage compared to
adults without diabetes (91.5%). Proper access to health care for both diagnosed and
undiagnosed diabetes will have a large impact on the ability to reduce the burden of diabetes in
present and future years.
Figure 24: Health Care Access among Adults With and Without Diabetes, Illinois, 2010
100%
80%
Percent of Adults
60%
40%
20%
0%
12 Months: No Doctor Have a Primary Care Have Health Care
Visit Due to Cost Physician Coverage
Adults with diabetes 16.7% 94.7% 8.5%
Adults without diabetes 12.9% 83.4% 91.5%
Source: Illinois Behavior Risk Facotr Surveillance System, 2010
30Projected Prevalence and Trend
Using the current prevalence data from the CDC National Diabetes Fact Sheet 2011 and the
Illinois BRFFS survey (1995-2010), the projected diabetes prevalence in 2020 will be 11.9
percent nationally and 10.6 percent for Illinois; an estimated increase of 43 percent nationally
and 25 percent for Illinois. These forecasts underscore the importance of health promotion and
prevention strategies at the state and local levels to better prevent and to control the prevalence
of this disease and its associated complications.
Figure 25: Forecast: Percent of Adults with Diabetes, Illinois and the United States, 2010-
2020
25%
20% Trend Projection
Percent of Adults
15%
11.9%
10% 10.6%
5%
Illinois US
0%
1996
2005
1995
1997
1998
1999
2000
2001
2003
2004
2006
2007
2008
2009
2010
2011
2012
2013
2014
2015
2016
2017
2018
2019
2020
Source: Behavioral Risk Factor Surveillance System, 1995-2010; Forecasts Analysis in SAS 9.1 Version
31Diabetes Commission
The Illinois State Diabetes Commission, created in 2006 by Illinois Public Act 094-0788 is
mandated to:
hold public hearings to gather information from the general public on issues pertaining
to the prevention, treatment and control of diabetes;
develop a strategy for the prevention, treatment and control of diabetes; and
examine the needs of adults, children, racial and ethnic minorities, and medically
underserved populations who have diabetes.
The Diabetes Commission consists of physicians board certified in endocrinology, including a
physician with expertise and experience in the treatment of childhood diabetes and a physician
with expertise and experience in the treatment of adult onset diabetes; health care professionals
with expertise and experience in the prevention, treatment and control of diabetes;
representatives of all organizations or groups that advocate on behalf of persons suffering from
diabetes; and members of the public diagnosed with diabetes.
32Data Sources
Behavioral Risk Factor Surveillance System (BRFSS)
The Behavioral Risk Factor Surveillance System (BRFSS) is a federally-funded surveillance
system tracking health risks throughout the entire United States. The Illinois Behavioral Risk
Factor Surveillance System (BRFSS) is conducted and administrated by the Illinois Department
of Public Health in collaboration with the CDC. Illinois follows the CDC guidelines and
standards by using a Disproportionate Stratified Sample (DSS) method to randomly select land-
based telephone numbers in every county throughout the state of Illinois. For more information
on BRFSS survey methodology, refer to http://www.cdc.gov/brfss/faqs.htm#2. In addition to
the BRFSS, Illinois regularly conducts risk factor surveillance of each county. The county level
data is used extensively at the sub-state/local governmental areas to formulate public health
policies and prevention and health promotion programs.
Hospital Discharge Data
The Department’s Center for Health Statistics, maintains hospital discharge data. The data is
based on ICD-9 codes for diabetes and associated chronic complications that could be
attributed to diabetes mellitus. Hospitalization or hospital discharge refers to any discharge
from a non-federal, short-stay, acute-care hospital in Illinois. Hospitalizations are expressed as
numbers of discharges, not as unduplicated patients, which, as a result, means a single patient
with multiple hospitalizations can be counted more than once. Illinois hospital discharge data
are based upon inpatient hospitalizations and do not include outpatient data. The numbers
supplied are individual discharge counts. No consideration is given to any type of rate
calculation.
Mortality Data
Mortality data was obtained from the National Center for Health Statistics through SEER*Stat
software developed by the National Cancer Institute. The mortality data available through
SEER*Stat includes all causes of death, not just cancer deaths. Mortality data can be obtained
from 1969-2009 at the national, state, and county level. Racial categories that can be selected
are white, black, other, American Indian/Alaska Native, Asian or Pacific Islander, or unknown.
Ethnicity categories were added to the data in 1990. There are 19 age categories that can be
33selected. From SEER*Stat software the frequency, crude rate, age-adjusted rate, crude rate
trend, and age-adjusted rate trend can be calculated for all causes of death. The standard error
and confidence intervals are also calculated in this software to determine significance. For this
report, the mortality all cause of death, aggregated with state, total U.S. 1990-2009 data was
used. The data in this software was released in April 2012. For more information refer to
http://www.seer.cancer.gov/mortality/.
The Adverse Pregnancy Outcomes Reporting System (APORS)
The Adverse Pregnancy Outcomes Reporting System (APORS) registry records the number of
Illinois infants born with birth defects whose mothers had gestational diabetes in their
pregnancies. Illinois infants born with adverse pregnancy outcome, including birth defects and
congenital anomalies and other serious neonatal conditions, are recorded in the APORS
registry. Each year in Illinois, APORS obtains information on thousands of such births
throughout the state. APORS is the most complete source of data on birth defects that currently
exists in Illinois. APORS is a component of the Illinois Health and Hazardous Substances
Registry administered by the Illinois Department of Public Health Division of Epidemiologic
Studies. All hospitals in Illinois, except federal and military hospitals, are mandated to
participate.
The Illinois Youth Risk Behavior Survey
The Youth Risk Behavior Survey (YRBS) focuses on priority health-risk behaviors established
during youth that result in the most significant mortality, disability, and social problems during
both youth and adulthood. Topics include nutrition, tobacco use, alcohol and other drug use,
physical activity, injuries, and sexual behavior resulting in sexually transmitted diseases and
pregnancy. It uses a controlled sample design so data may be weighted for analysis. YRBS
includes a national school-based survey conducted by CDC and state, territorial, and tribal as
well as local surveys conducted by state, territorial, local education and health agencies, and
tribal governments. In Illinois, the YRBS survey is administered by Childrens’ Health Data Lab
(CHDL), part of the Children Memorial Research Center, Northwestern Feinberg School of
Medicine. For more information, refer to http://www.chdl.org/yrbs.htm
34Bibliography
SEARCH for Diabetes in Youth: http://www.searchfordiabetes.org/
National Center for Health Statistics: http://www.cdc.gov/nchs
National Institute of Diabetes and Digestive and Kidney Diseases (NIDDK):
http://www2.niddk.nih.gov/
National Institute of Health (NIH); U.S. Department of Health and Human Services:
http://www.nih.gov/
National Diabetes Education Program; U.S. Department of Health and Human Services:
http://www.ndep.nih.gov/
International Diabetes Federation (IDF): http://www.idf.org/
American Diabetes Association, Diabetes Cost Calculator: http://www.diabetes.org/
Medscape: http://www.medscape.com/
1998-2011 Mayo Foundation for Medical Education and Research (MFMER).
http://www.mayoclinic.com/health/type 2-diabetes/DS00585/DSECTION=risk-factors
Centers for Disease Control and Prevention, Diabetes Public Health Resource:
http://www.cdc.gov/diabetes/
National Diabetes Factsheet 2011: http://www.cdc.gov/diabetes/pubs/pdf/ndfs_2011.pdf
Health Resources and Services Administration: http://www.hrsa.gov/
National Diabetes Information Clearinghouse: http://diabetes.niddk.nih.gov/
American Association of Diabetes Educators: http://www.diabeteseducator.org/
Agency for Healthcare Research and Quality: http://www.ahrq.gov/browse/diabetes.htm
Centers for Medicare & Medicaid Services: http://cms.hhs.gov/
WebMD: http://diabetes.webmd.com/tc/Prediabetes-What-Happens
Illinois Department of Public Health; Office of Policy, Planning, and Statistics, Illinois
Hospital Discharge Database, 2005-2010 Data
Illinois Department of Public Health, Burden of Heart Disease and Stroke in Illinois-2007.
http://www.idph.state.il.us/heartstroke/index.htm
Illinois Department of Public Health, Division of Vital Statistics, 2007 database
Illinois Department of Public Health, Diabetes Prevention and Control Program.
http://www.idph.state.il.U.S./diabetes/index.htm
Illinois Department of Public Health, Behavior Risk Factor Surveillance Survey, 2010 Data.
http://app.idph.state.il.U.S./brfss/default.asp
Illinois Department of Public Health, Division of Epidemiologic Studies, Adverse Pregnancy
Outcomes Reporting System (APORS)
Illinois Youth Risk Behavior Survey: Children Health Data Lab: Children Memorial Research
Center, Northwestern Feinberg School of Medicine. http://www.chdl.org/yrbs.htm
Kaiser Family Foundation. State Health Facts, 2007, www.statehealthfacts.org.
35Glossary of Terms
Acidosis - Acidosis is an increased acidity in the blood and other body tissue (e.g., an
increased hydrogen ion concentration).
Blood glucose – Glucose is a simple sugar and the primary fuel for body cells. It is absorbed
from some foods (or produced from starchy ones), absorbed into the cells (for about two
thirds of cells, this is under control of insulin), stored temporarily in the liver as glycogen,
made in starvation from the glycerin backbone of triglycerides, and from a few amino acids.
Glucose metabolism anomalies are the cause of diabetes Mellitus.
Blood pressure – The pressure of the blood in the circulatory system, often measured for
diagnosis since it is closely related to the force and rate of the heartbeat and the diameter
and elasticity of the arterial walls.
Blood sugar – Another commonly used name for blood glucose.
Blood vessels – Tubes which carry blood around the body. They come in three types- arteries,
veins, and capillaries. Capillaries are always tiny; the others vary from large (centimeters in
diameter) to quite small (slightly smaller than the diameter of a red blood cell).
Cardiovascular – Pertaining to the heart and vascular system (blood vessels).
Cholesterol – A waxy substance related to the steroid chemicals that serve as a substrate for
many things including cell membrane construction. It is also involved in the transport of fat
(e.g., lipids) in the blood. Cholesterol is manufactured in the body and is absorbed from
food in the diet. Furthermore, some diet elements seem to be connected with higher body
production of cholesterol (e.g., saturated fat).
Chronic – Present over a long period of time. Diabetes and arthritis are examples of chronic
diseases as there is yet no cure for either.
Complications of diabetes – Harmful effects that may happen when a person has diabetes.
Some acute effects, such as hypoglycemia or hyperglycemia, can happen any time and
usually can be resolved quickly. Others develop when a person has had diabetes for a time
(often years, or even decades). These include damage to the retina of the eye (retinopathy),
blood vessels (angiopathy), the nervous system (neuropathy), or the kidneys (nephropathy).
Coronary disease – Interference with the heart's blood supply, typically by clogging of
coronary, or other, arteries. Ischemia means lack of oxygen that necessarily follows from
one or more blocked arteries.
Diabetes Mellitus – A disease that occurs when the body is not able to use dietary
carbohydrates (e.g., sugar, starch) as it should. Caused by lack of insulin, inability to
respond to insulin, or both.
Diabetes Mellitus type 1 – A chronic condition in which the pancreas makes little or no
insulin because the beta cells have been destroyed. About two-thirds of body cells require
insulin to absorb glucose and in its absence, they will not be able to use the glucose (blood
sugar) for energy. Type 1 diabetes usually comes on abruptly, although the damage to the
beta cells may begin much earlier. Typical signs of type 1 diabetes are a great thirst,
hunger, a need to urinate often, and loss of weight. To treat the disease, the person must
inject insulin and test blood glucose frequently. Type 1 diabetes usually occurs in children
and adults under age 30.
36Diabetes Mellitus type 2 – The most common form of diabetes mellitus. About 90 to 95
percent of people who have diabetes in the developed world have Type 2 diabetes. Unlike
type 1 diabetes, in which the pancreas makes no insulin, people with type 2 diabetes
produce some insulin, sometimes even large amounts. However, either their bodies do not
produce enough insulin or their body cells are resistant to insulin (see Insulin Resistance).
People with type 2 diabetes can often control their condition by losing weight through diet
and exercise. If not, they may need to combine insulin or a pill with diet and exercise.
Generally, type 2 diabetes occurs in people who are over age 40. Most of the people who
have this type of diabetes are overweight.
Diabetic ketoacidosis (DKA) – See acidosis
Diabetic nephropathy – See Nephropathy
Diabetic neuropathy – See Neuropathy
Diabetic retinopathy – Damage to the retina caused by growth of very small blood vessels.
The proliferative variety is dangerous and often leads to blindness. It has been the leading
non traumatic cause of blindness in adults in the developed world for much of the 20th
century.
Diagnosis – A decision as to the cause of some symptoms or problem. In the case of diabetes,
the tests are clear. If you do not have high blood glucose at times (e.g., when fasting), you
shouldn't be diagnosed as diabetic, though perhaps as "prediabetic." Everyone has higher
glucose levels for one or two hours after eating food that contains some types of
carbohydrates.
Dialysis – Providing kidney function artificially. This requires an artificial kidney (a dialysis
machine) and relatively long periods hooked up to the machine every few days. It is not
equivalent to a working kidney, but is sufficient to maintain life, sometimes for extended
periods.
Epidemiology – The study of the transmission of diseases.
Fats – Food substances that are the chief energy storage mechanism in organisms, such as
plants and animals. Fat molecules are composed of fatty acid chains attached to a glycerol
backbone, usually in threes.
Gestational diabetes mellitus (GDM) – A type of diabetes mellitus can occur when a woman
is pregnant. During pregnancy (usually late term), the woman may have glucose (sugar) in
her blood at a higher than normal level. When the pregnancy ends, the blood glucose levels
return to normal in about 95 percent of cases. It must be treated carefully by a physician for
it is dangerous to both mother and child. If treated properly, there are usually no lasting
effects on either. Women who have had an episode of GDM are at higher risk of developing
type 2 diabetes later on.
Glucose – A simple sugar that is the chief carbohydrate fuel in food. In the dextrose form
isomer, it is the chief product of photosynthesis in plants.
Glucose tolerance test – A test to see if a person has diabetes. The test is usually given in a
lab or doctor's office in the morning before the person has eaten. A first sample of blood is
taken from the person. Then the person drinks a liquid that has a measured amount of
glucose in it (typically 75 grams). After one hour, a second blood sample is drawn, and,
after another hour, a third sample is taken. The object is to see how well the body deals with
the glucose in the blood over time without interference from other foods. Depending on the
laboratory, the number and spacing of samples may vary.
37You can also read