Evaluating the Risk of Epidemic Thunderstorm Asthma: Lessons from Australia - MDPI
←
→
Page content transcription
If your browser does not render page correctly, please read the page content below
International Journal of
           Environmental Research
           and Public Health

Article
Evaluating the Risk of Epidemic Thunderstorm
Asthma: Lessons from Australia
Sharon L. Campbell 1,2 , Paul D. Fox-Hughes 3 , Penelope J. Jones 1 , Tomas A. Remenyi 4 ,
Kate Chappell 1 , Christopher J. White 4,5,6 and Fay H. Johnston 1,2, *
 1    Menzies Institute for Medical Research, University of Tasmania, 1 Liverpool St, Hobart, TAS 7000, Australia;
      sharon.campbell@utas.edu.au (S.L.C.); penelope.jones@utas.edu.au (P.J.J.); kate.chappell@utas.edu.au (K.C.)
 2    Public Health Services, Department of Health (Tasmania), 25 Argyle St, Hobart, TAS 7000, Australia
 3    Bureau of Meteorology, GPO Box 727, Hobart, Tasmania 7001, Australia; paul.fox-hughes@bom.gov.au
 4    Antarctic Climate and Ecosystems Cooperative Research Centre, University of Tasmania, 20 Castray
      Esplanade, Hobart, TAS 7000, Australia; tom.remenyi@utas.edu.au (T.A.R.);
      chris.white@utas.edu.au (C.J.W.)
 5    School of Engineering, University of Tasmania, Private Bag 65, Hobart, TAS 7001, Australia
 6    Department of Civil and Environmental Engineering, University of Strathclyde, James Weir Building,
      75 Montrose Street, Glasgow G1 1XJ, UK
 *    Correspondence: fay.johnston@utas.edu.au; Tel.: +61-3-6226-7726

 Received: 16 January 2019; Accepted: 1 March 2019; Published: 7 March 2019

 Abstract: Epidemic thunderstorm asthma (ETA) is an emerging public health threat in Australia,
 highlighted by the 2016 event in Melbourne, Victoria, that overwhelmed health services and
 caused loss of life. However, there is limited understanding of the regional variations in risk.
 We evaluated the public health risk of ETA in the nearby state of Tasmania by quantifying the
 frequency of potential ETA episodes and applying a standardized natural disaster risk assessment
 framework. Using a case–control approach, we analyzed emergency presentations in Tasmania’s
 public hospitals from 2002 to 2017. Cases were defined as days when asthma presentations exceeded
 four standard deviations from the mean, and controls as days when asthma presentations were
 less than one standard deviation from the mean. Four controls were randomly selected for each
 case. Independently, a meteorologist identified the dates of potential high-risk thunderstorm events.
 No case days coincided with thunderstorms during the study period. ETA was assessed as a very
 low risk to the Tasmanian population, with these findings informing risk prioritization and resource
 allocation. This approach may be scaled and applied in other settings to determine local ETA risk.
 Furthermore, the identification of hazards using this method allows for critical analysis of existing
 public health systems.

 Keywords: asthma; thunderstorm; public health; risk; hazard

1. Introduction
     Epidemic thunderstorm asthma (ETA) is seen as an emerging public health threat in Australia
and other parts of the world, creating the need to develop a sustained level of community resilience
and preparedness in affected regions [1].
     The mechanism of ETA, described in detail elsewhere [2–4], involves the concurrent presence
of (a) aeroallergens (e.g., pollen, ruptured pollen, or fungal spores), (b) specific weather conditions
(thunderstorms and strong wind gusts), and (c) a susceptible population group who are sensitized to
the aeroallergen and have a history of allergic rhinitis or asthma [5] (see Figure 1).

Int. J. Environ. Res. Public Health 2019, 16, 837; doi:10.3390/ijerph16050837       www.mdpi.com/journal/ijerph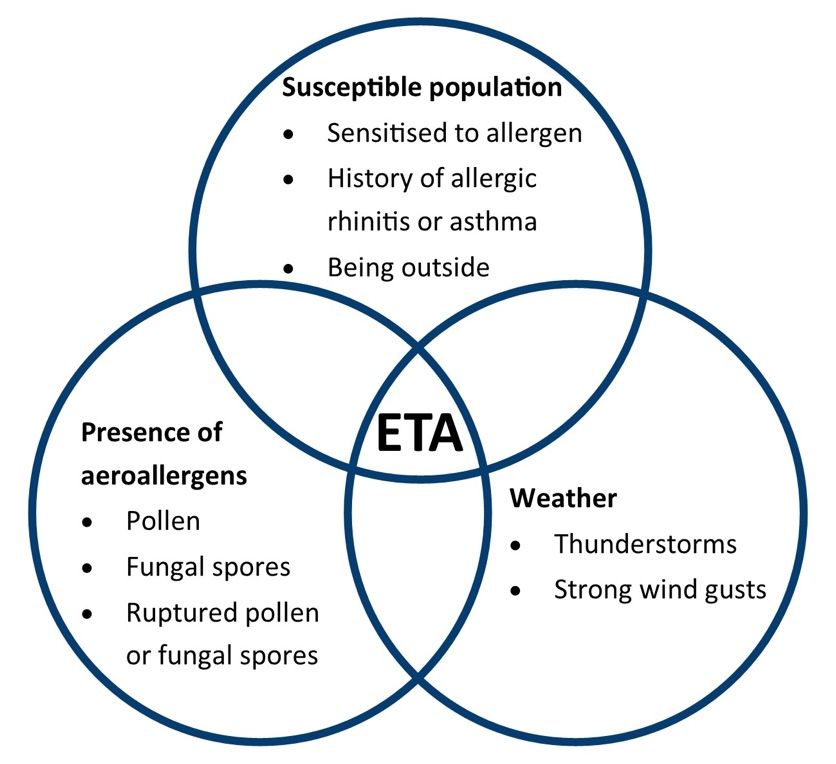
Int. J. Environ. Res. Public Health 2019, 16, 837 2 of 12
Int. J. Environ. Res. Public Health 2019, 16, x FOR PEER REVIEW 2 of 12
Figure 1. Intersection
Figure between
1. Intersection aeroallergens,
between specific
aeroallergens, weather
specific conditions,
weather and a susceptible
conditions, population,
and a susceptible
giving rise to a potential epidemic thunderstorm asthma (ETA) event (adapted from [5]).
population, giving rise to a potential epidemic thunderstorm asthma (ETA) event (adapted from [5]).
DueDue to the requirement
to the requirementfor for the concurrentpresence
the concurrent presence of these
of these threethree components,
components, ETA are
ETA events events
are very
very rare,
rare, having
having been recordedon
been recorded ononly
only1010occasions
occasionsininsoutheastern
southeastern Australia:
Australia: seven seven
times times
in in
Melbourne (Victoria), and once in Canberra (Australian Capital Territory),
Melbourne (Victoria), and once in Canberra (Australian Capital Territory), Newcastle (New South Newcastle (New South
Wales),
Wales), and andWagga Wagga Wagga
Wagga (New
(New SouthWales),
South Wales),respectively
respectively [5].[5].Twelve
Twelvenotable
notableevents
eventshave beenbeen
have
recorded
recorded in other
in other areas
areas of the
of the world[5],
world [5],with
withaanumber
number of of additional
additionalstudies
studies also showing
also showing a positive
a positive
association
association between between
asthmaasthma presentations
presentations and thunderstorm
and thunderstorm eventsevents [6]. These
[6]. These may may potentially
potentially indicate
indicate further previously undetected ETA events.
further previously undetected ETA events.
Each of the Australian events has caused an increase in emergency department presentations
Each of the Australian events has caused an increase in emergency department presentations and/or
and/or admissions [5]. The most striking of these events occurred in Melbourne, Victoria, on 21
admissions
November [5]. 2016,
The which
most striking
caused an ofexceptional
these events occurred
level of demand in Melbourne,
on ambulance Victoria, on 21services
and hospital November
2016,and
which caused an exceptional level of demand on ambulance and
a number of deaths [1,7]. This event was widely publicized, with considerable media hospital services and a number
of deaths [1,7]. This
commentary event was
provided widely
about publicized, with
the community impact, considerable
emergencymedia commentary
response, and stepsprovided
needed to about
the community impact,ofemergency
reduce the impact this event inresponse,
the futureand steps
[8–10]. In needed
response, toareduce the impact
substantial researchofinvestment
this eventin in the
futureforecasting
[8–10]. In and predicting
response, these events
a substantial was provided
research investment by in
theforecasting
Victorian Government
and predicting [11].these
In addition
events was
to research
provided assessing Government
by the Victorian the public health impact,
[11]. In addition thistorare eventassessing
research was examined, in health
the public detail, impact,
from a this
meteorological perspective [12].
rare event was examined, in detail, from a meteorological perspective [12].
The The thunderstormcomplex
thunderstorm complex associated
associatedwith withthe 2016 Melbourne
the 2016 event moved
Melbourne eventsouth
moved and crossed
south and
Bass Strait, passing over northern Tasmania (including the population centers of Burnie and
crossed Bass Strait, passing over northern Tasmania (including the population centers of Burnie
Launceston). Investigations at the time showed no increase in ambulance or emergency department
and Launceston). Investigations at the time showed no increase in ambulance or emergency
activity in those Tasmanian regions, in contrast to the severe health outcomes in Melbourne.
department
However, activity in those Tasmanian
the severity regions, event—and
of the Melbourne in contrast toitstheproximity
severe health outcomes in Melbourne.
to Tasmania—prompted
However, the severity of the Melbourne event—and its proximity to
significant local concern about the potential for an ETA event to occur in the state. This Tasmania—prompted significant
was
localhighlighted
concern about the potential for an ETA event to occur in the state. This
by the extensive traditional and social media response to a subsequent thunderstorm was highlighted by the
extensive
asthma traditional and social
warning issued by the media response
Tasmanian to a subsequent
Department of Healththunderstorm
and Human Services asthmaone warning
year laterissued
by the[13–15]. In this Department
Tasmanian context, publicofhealth
Health policymakers
and Human identified
Services a gap
oneinyear
understanding
later [13–15].howIn and where
this context,
publicthese events
health occur in Tasmania,
policymakers and to
identified whatindegree
a gap they pose a how
understanding risk. This
and study
whereseeksthese toevents
redressoccur
this in
gap and create an assessment methodology that can be applied across
Tasmania, and to what degree they pose a risk. This study seeks to redress this gap and create an other at-risk regions.
assessment methodology that can be applied across other at-risk regions.
1.1. Study Location
Tasmania is the only island state of Australia. Melbourne, Victoria, lies approximately 300 km
north of the state’s north coast, separated by Bass Strait. The majority of the Tasmanian population
resides in a regional or remote classified area [16]. The state’s total population in 2016 was 510,000,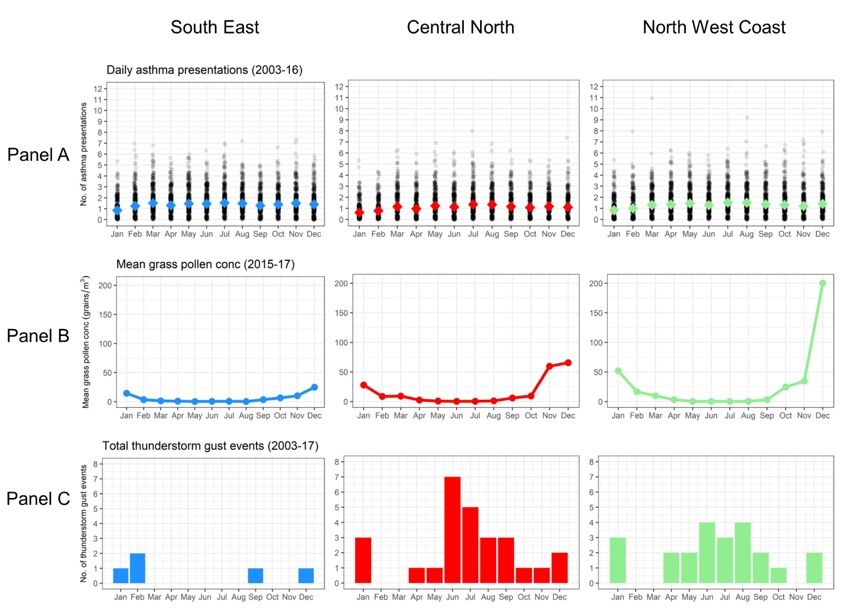
Int. J. Environ. Res. Public Health 2019, 16, x FOR PEER REVIEW 3 of 12
1.1. Study Location
Int. J. Environ. Res. Public Health 2019, 16, 837 3 of 12
Tasmania is the only island state of Australia. Melbourne, Victoria, lies approximately 300 km
north of the state’s north coast, separated by Bass Strait. The majority of the Tasmanian population
with the majority
resides of theor
in a regional population residingarea
remote classified in one
[16].ofThe
three major
state’s centers:
total Hobartin(population
population 204,000),
2016 was 510,000,
Launceston (population 84,150), or Burnie–Devonport (population 70,000) [17].
with the majority of the population residing in one of three major centers: Hobart (population
Tasmania
204,000), has four(population
Launceston major public hospitals
84,150), located in the (population
or Burnie–Devonport most densely populated
70,000) [17]. regions of
the state—one
Tasmania located
has fourin major
Hobart (Royal
public Hobartlocated
hospitals Hospital);
in theone
mostin densely
Launceston (Launceston
populated regions General
of the
Hospital); and two in the Burnie–Devonport region (the Mersey Community
state—one located in Hobart (Royal Hobart Hospital); one in Launceston (Launceston General Hospital and the North
West Regional
Hospital); andHospital).
two in the Each of these hospitals
Burnie–Devonport has(the
region an emergency department.
Mersey Community Hospital and the North
West Regional Hospital). Each of these hospitals has an emergency department.
1.2. Thunderstorms in Tasmania
1.2. Thunderstorms in Tasmania
In contrast to continental southeastern Australia, Tasmania has a more maritime and temperate
climate,Inwith
contrastlessto frequent
continentalthunderstorms
southeastern Australia,
overall Tasmania
[18]. Inhas a more maritime
particular, Tasmaniaand experiences
temperate
climate,
fewer ‘drywith less frequent
microburst’ thunderstorms that
thunderstorms overall [18].
can In particular,
potentially Tasmania
generate experiences
strong windfewer
gusts‘dry[19].
microburst’ thunderstorms that can potentially generate strong wind
Furthermore, the Tasmanian topography and predominantly westerly flowing air mass influence gusts [19]. Furthermore, the
theTasmanian
occurrencetopography
and location andofpredominantly
thunderstormswesterly
across theflowing
state.air massstorms
More influence
are the occurrence
reported in theandwest
andlocation
north of of thunderstorms
the state as air across the state.
is forced More storms
to ascend whenare reported
these in the west
air masses and north
encounter theofTasmanian
the state
as air is forced
landmass, and this to ascent
ascendiswhen these air
conducive to masses encounter the
the development Tasmanian landmass,
of thunderstorms and this
under some ascent
conditions.
is conducive to the development of thunderstorms under some conditions. In contrast, these same
In contrast, these same westerly winds descend along the contour of the landscape into southeastern
westerly winds descend along the contour of the landscape into southeastern Tasmania, rendering
Tasmania, rendering thunderstorms less common in this region [18,20].
thunderstorms less common in this region [18,20].
1.3. Pollen in Tasmania
1.3. Pollen in Tasmania
With respect to pollen abundance, there are both similarities and differences between Tasmania
With respect to pollen abundance, there are both similarities and differences between Tasmania
and mainland southeastern Australia that are relevant for understanding ETA risk. Grass pollen—and,
and mainland southeastern Australia that are relevant for understanding ETA risk. Grass pollen—
in particular, rye grass pollen—is the major aeroallergen implicated in previous Australian
and, in particular, rye grass pollen—is the major aeroallergen implicated in previous Australian
thunderstorm asthma events [3,5,21]. Although levels are typically lower than in mainland
thunderstorm asthma events [3,5,21]. Although levels are typically lower than in mainland
southeastern
southeastern Australia
Australia[22],
[22],grass
grasspollen
pollen is
is prevalent across Tasmania
prevalent across Tasmaniaduring
duringthe
thepeak
peakseason
seasonof of
November to January [23,24] (see Figure 2, Panel B). As rye grass is an important pasture
November to January [23,24] (see Figure 2, Panel B). As rye grass is an important pasture grass species grass
species
[25], a[25], a significant
significant proportion
proportion of this of
is this
highlyis highly
likely tolikely to grass-derived.
be rye be rye grass-derived. Beyond
Beyond grass grass
pollen,
pollen, Tasmania
Tasmania also also experiences
experiences seasonally
seasonally highhigh loads
loads of several
of several other
other aeroallergens,
aeroallergens, including
including Betula
Betula
(birch), Cupressaceae (cypress), and Plantago
(birch), Cupressaceae (cypress), and Plantago (plantain) [23,24]. These have peak seasons that areare
(plantain) [23,24]. These have peak seasons that
different
differentfrom
from peak
peakgrass
grasspollen
pollenseason.
season. Overall,
Overall, this means Tasmaniaexperiences
means Tasmania experiencesgenerally
generally high
high
pollen conditions—though
pollen conditions—though notnot
necessarily
necessarilyhigh
highgrass pollen
grass concentrations—from
pollen concentrations—from approximately
approximately July
July through
through to January
to January [24]
[24] (see (see Figure
Figure 3). 3).
Figure 2. Daily asthma presentations (Panel A), mean grass pollen concentrations (Panel B), and total
thunderstorm asthma gust events (Panel C) for each of the relevant Tasmania forecast districts (South
East, Central North, and North West Coast).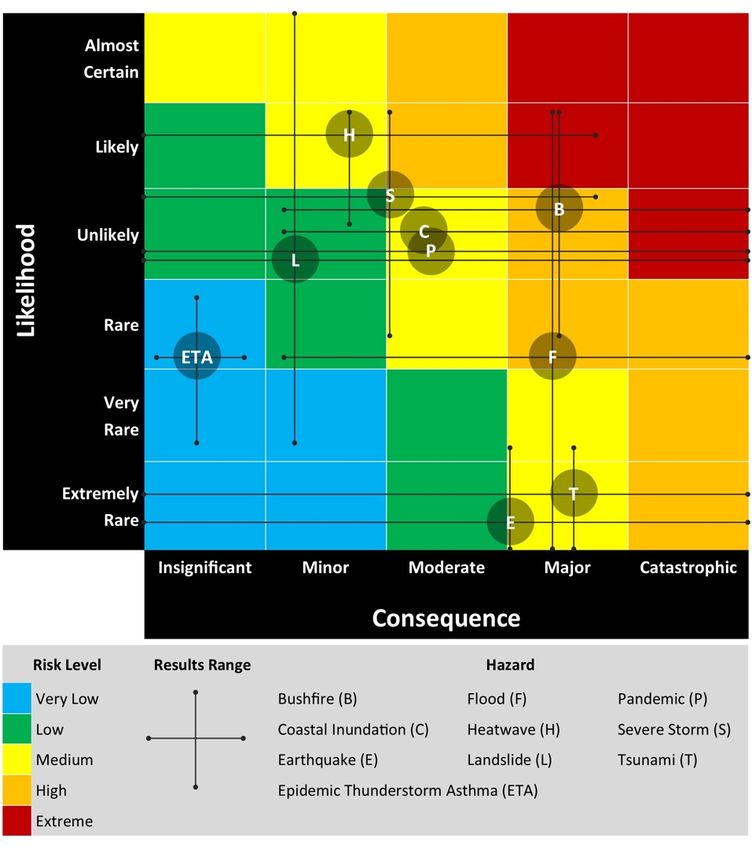
Int. J. Environ. Res. Public Health 2019, 16, x FOR PEER REVIEW 4 of 12
Figure 2. Daily asthma presentations (Panel A), mean grass pollen concentrations (Panel B), and total
thunderstorm asthma gust events (Panel C) for each of the relevant Tasmania forecast districts (South
Int. J. Environ. Res. Public Health 2019, 16, 837 4 of 12
East, Central North, and North West Coast).
Figure 3. Pollen counts for each relevant Tasmanian forecast district showing the five major taxa.
Figure 3. Pollen counts for each relevant Tasmanian forecast district showing the five major taxa.
1.4. Natural Disaster Risk Assessment in the Tasmanian Context
1.4. Natural Disaster Risk Assessment in the Tasmanian Context
Tasmania’s natural disaster risk is assessed using the Tasmanian State Natural Disaster Risk
Tasmania’s
Assessment natural disaster
(TSNDRA) framework risk that
is assessed
aims tousing the Tasmanian
“produce a state-wide State Naturalnatural
priority Disaster Risk
hazard
Assessment
risk assessment, (TSNDRA) framework
in accordance thatthe
with aims to “produce
relevant a state-wide
International and priority
Australian natural hazard risk
standards” [26].
assessment,
This framework is consistent with the 2015 National Emergency Risk Assessment Guidelines [26].
in accordance with the relevant International and Australian standards” This
(NERAG),
framework
the Australian is consistent
standard with the 2015
for natural National
disaster Emergency
risk assessment Risk
[27],Assessment
and complies Guidelines (NERAG),
with a number of
the Australian standard for natural disaster risk assessment
relevant risk management standards [26]. Similar frameworks exist globally [28,29]. [27], and complies with a number of
relevant
Therisk
TSNDRA management
framework standards
was most [26]. Similarupdated
recently frameworks exist
in 2016, globally
assessing [28,29]. natural disaster
state-wide
risksThe TSNDRA
for the following framework was most
hazards: bushfire, flood,recently
severe updated in 2016,tsunami,
storm, landslide, assessing state-wide
earthquake, natural
heatwave,
disaster risks for the following hazards:
coastal inundation, and pandemic influenza [26]. bushfire, flood, severe storm, landslide, tsunami, earthquake,
heatwave,
TSNDRA coastaluses inundation,
five ‘impact and pandemic
sectors’ influenzathe
to determine [26].
overall risk for each hazard. These sectors
TSNDRA uses five ‘impact sectors’ to determine
cover a range of consequences across a broad spectrum of outcomes, the overall risk including
for each hazard.
‘People’,These sectors
‘Economic’,
cover a range of consequences across a broad spectrum of outcomes, including
‘Environmental’, ‘Public administration’, and ‘Social setting’. For more information on these sectors ‘People’, ‘Economic’,
‘Environmental’,
and how they translate ‘Publictoadministration’,
the Tasmanian context,and ‘Socialsee setting’. For more
Supplementary information
Materials on these
(Natural sectors
disaster risk
and how they translate
assessment in Tasmania). to the Tasmanian context, see Supplementary Materials (Natural disaster risk
assessment
To assessin Tasmania).
a hazard’s overall risk level, the likelihood and consequences of the risk are ascertained
To assess
for each sector anda hazard’s overall
plotted on arisk
risklevel,
matrix.the likelihood
The confidenceand consequences
of each of these of the riskisare
plots thenascertained
assessed
for each sector and plotted on a risk matrix. The confidence of each of these
based on available evidence. Finally, a priority level is set, based on the risk level and confidence plots is then assessed
based on available
associated with thatevidence.
risk. Finally, a priority level is set, based on the risk level and confidence
associated with that risk.
1.5. Research Aim
1.5. Research Aim
The aims of this study were to (a) understand the history of ETA events in Tasmania (and
The aims
determine if any ofundetected
this study ETA wereevents
to (a)hadunderstand
occurred in thethehistory of ETA and
study period), events(b) in Tasmania
apply (and
these results
determine if any undetected ETA events had occurred in the study period),
to the TSNDRA framework and determine the risk of these events, specifically the public health risk, and (b) apply these results
to
in the
the TSNDRA
Tasmanianframework
context. This andwill
determine
determine thethe
riskeffectiveness
of these events, specifically
of applying this the public health
methodology risk,
to other
in the Tasmanian
regions at risk of ETA context. This will determine the effectiveness of applying this methodology to other
events.
regions at risk of ETA events.Int. J. Environ. Res. Public Health 2019, 16, 837 5 of 12
2. Materials and Methods
2.1. Study Design
In order to understand the history of thunderstorm asthma events in Tasmania, we adapted the
case–control design used by Marks et al. [3], in which the unit of analysis is a day rather than an
individual person. Using this approach, Marks et al. discovered a number of previously undetected
ETA events in central New South Wales, in cities with similar-sized populations to Tasmania’s
major centers. This demonstrates the capacity of this approach to detect ETA events in analogous
demographic contexts. Here, we employed a similar study design, modified to accommodate the
different climatic and geographical setting of Tasmania. We used the results of this study to assess risk
in the Tasmanian context using the TSNDRA framework.
2.2. Health Outcomes
We obtained emergency department (ED) presentation data for public hospitals in Tasmania from
the Tasmanian Health Service (THS) for the Royal Hobart Hospital, Launceston General Hospital,
Mersey Community Hospital, and the North West Regional Hospital. Due to the small size and close
proximity of the two hospitals in the northwest region, we combined data from the Mersey Community
Hospital and North West Regional Hospital to represent the entire northwest. Data were extracted for
the period from 20 December 2002 to 30 June 2017.
Presentations were identified where International Classification of Disease (ICD) codes for asthma
were given as the primary diagnosis (J45, J45.0, J45.1, J45.8, J45.9, and J46). We estimated expected
daily attendances for each region using a log linear model. Modeling included accounting for linear,
quadratic, and cubic time trends (including overall time trends), seasonal factors, and day of the
week effects. Case days were identified when the daily presentations for asthma exceeded four
standard deviations (SD) from the expected value. Control days were randomly selected from all
dates where the number of ICD-coded asthma presentations were less than one standard deviation
from the expected value. A sensitivity analysis also examined case days where daily presentations
for asthma exceeded five standard deviations. For each case day, four times the number of control
days were generated. To account for potential differences in coding and to provide a more sensitive
analysis, we also separately analyzed ICD-coded presentations for wheezing (R06.2) and dyspnea
(R06.0). Specifics of each case (for example gender, age, type of asthma) were not considered in this
analysis, as the total number of cases was the variable of interest.
2.3. Meteorological Data
Weather observation data were obtained from the Global Position and Tracking System (GPATS)
and Bureau of Meteorology (BoM) automatic weather stations (AWS). We combined lightning data
from GPATS and wind data from AWS to identify likely thunderstorm gust events close to populated
regions of Tasmania. Sixteen AWS were identified in the three BoM forecasts districts (South East,
Central North, and North West Coast) that most closely matched the major population centers feeding
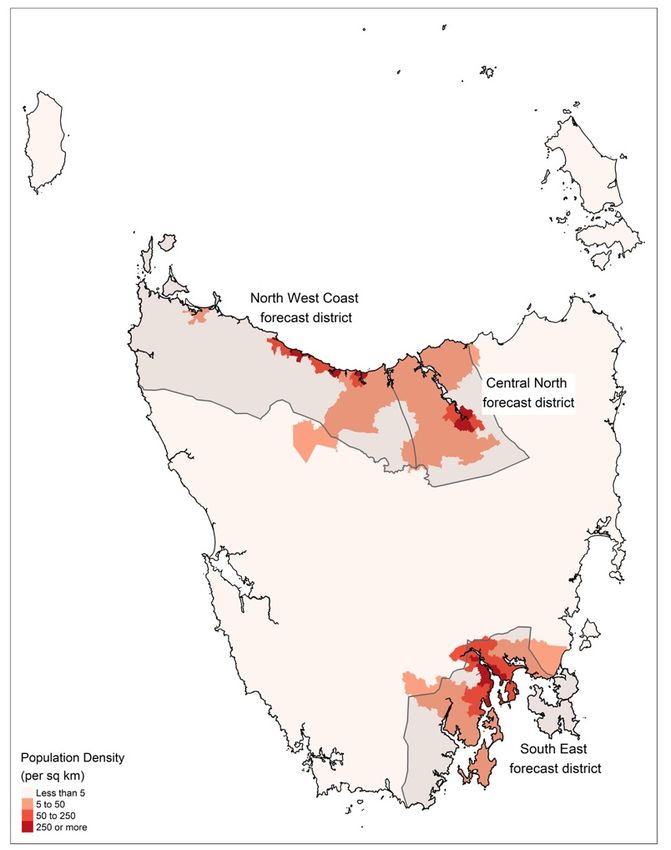
the four public hospitals (see Figure 4).Int. J. Environ. Res. Public Health 2019, 16, 837 6 of 12
Int. J. Environ. Res. Public Health 2019, 16, x FOR PEER REVIEW 6 of 12
Figure4.4.Population
Figure Populationdensity
densityininTasmania
Tasmaniaand
andBureau
BureauofofMeteorology
Meteorology(BoM)
(BoM)forecast districts
forecast used
districts in
used
this study. in this study.
The
The topography
topographyofof Tasmania
Tasmania is vastly different
is vastly to thattoofthat
different inland
of New
inland South
NewWales,
Southwith Tasmania
Wales, with
mostly displaying a rugged landscape of hills and valleys compared
Tasmania mostly displaying a rugged landscape of hills and valleys compared to the relatively to the relatively flat plainsflat
of
central
plains ofNew South
central NewWales.
SouthTo reflect
Wales. Tothis difference,
reflect the radius
this difference, of influence
the radius of a thunderstorm
of influence of a thunderstormgust
event
gust event on a population center used in Marks et al. [3] (80 km) was reduced. Here, we identified aa
on a population center used in Marks et al. [3] (80 km) was reduced. Here, we identified
thunderstorm ◦ rectangle (approximately 10 km)
thunderstormgust gustevent
eventifif(1)
(1)a lightning
a lightning strike
strikeoccurred
occurred within
withina 0.1
a 0.1° rectangle (approximately 10
of
km)anof
AWS location,
an AWS and (2)
location, and a wind
(2) a gust
windingustexcess of 60 km/h
in excess of 60 was
km/hrecorded by the AWS
was recorded by thewithin
AWS 10 min
within
of this lightning strike. We also employed a sensitivity test to increase the strike range to within a ◦
0.2to
10 min of this lightning strike. We also employed a sensitivity test to increase the strike range
rectangle (approximately
within a 0.2° 20 km) and increase
rectangle (approximately 20 km) theand
time differential
increase to 20differential
the time min, while to keeping
20 min,thewhile
gust
strength at 60 km/h.
keeping the gust strength at 60 km/h.
The
The list
list of
of combined
combined asthma
asthma case case and
and control
control daysdays was
was given
given to to the
the meteorologist,
meteorologist, who who was
was
blinded
blinded to to which
which days
days were
were case case oror control.
control. TheThe meteorologist
meteorologist then then compared
compared thesethese days
days to
to the
the
identified thunderstorm gust days to determine
identified thunderstorm gust days to determine any overlap. any overlap.
2.4.
2.4. Risk
Risk Assessment
Assessment
Using
Using the
the TSNDRA
TSNDRA framework
framework [26],
[26], we
we analyzed
analyzed the
the likelihood
likelihood and
and consequence
consequence for
for each
each sector
sector
to determine the combined overall risk. For consequence levels, results of the Tasmania case–control
to determine the combined overall risk. For consequence levels, results of the Tasmania case–control
ETA
ETA event
event study
study informed
informed the
the ‘People’
‘People’ sector.
sector. Learnings
Learnings from
from the
the Melbourne
Melbourne 2016
2016 ETA
ETA event
event [1,7]
[1,7]
and other post-disaster research [30–32] informed the remaining sectors. For more information,
and other post-disaster research [30–32] informed the remaining sectors. For more information, see
see Supplementary
Supplementary Materials
Materials (Natural
(Natural disaster
disaster riskrisk assessment
assessment in Tasmania).
in Tasmania).Int. J. Environ. Res. Public Health 2019, 16, 837 7 of 12
3. Results
3.1. Health Outcomes and Meteorological Data
Daily emergency department presentations for asthma for the three major population centers,
as well as for the state as a whole, were analyzed (see Figure 2, Panel A). For this analysis only, dates
in 2002 and 2017 were eliminated to allow for complete years of analysis (i.e., 1 January 2003 to
31 December 2016).
In Tasmania, asthma presentations remained relatively steady throughout the year and across
regions, with the coldest months of July and August demonstrating the highest rate of presentations.
The lowest rates for all regions occurred in January, which is the warmest month. This is generally
consistent with the global pattern of seasonality in asthma [33–36].
A total of 5307 days and 2,107,594 presentations were analyzed for the whole study period.
We found 19,979 asthma presentations across all regions and identified asthma case days in all regions.
The total number of presentations, mean number of daily presentations, maximum number of daily
presentations, and the number of case and control days for each hospital are presented in Table 1.
Table 1. International Classification of Disease (ICD)-coded asthma total presentations, daily
presentation mean, maximum and number of case and control days for each hospital.
Hospital Total Presentations Daily Mean 1 Daily Maximum No. of Case Days No. of Control Days
Royal Hobart 7268 1.37 7 10 40
Launceston General 5807 1.09 8 16 64
MCH/NWRH 2 combined 6904 1.30 11 11 44
1 unadjusted daily mean; 2 Mersey Community Hospital/North West Regional Hospital.
We also found ICD-coded presentations for wheezing and dyspnea in all regions. However, only
462 cases of wheezing and 2562 cases of dyspnea were observed across the whole study period.
Given the low number of these cases, wheezing and dyspnea presentations were not analyzed further.
Figure 2, Panel C shows the total number of days per month during the study period where
thunderstorm gust events were identified for each BoM forecast district. Thunderstorm gust events
were rare in the South East forecast district all year round. Events were more common in the Central
North and North West Coast forecast districts, with the majority occurring in the winter period.
There was no overlap between days where daily asthma presentations exceeded four SDs (case
days) and thunderstorm gust events. Only one control day was identified in the South East district that
overlapped with an identified thunderstorm gust event, and none in the other two districts. On this
basis, no ETA events were identified in Tasmania during the study period.
3.2. Risk Assessment
Table S1 (see Supplementary Materials) shows the consequence categories for each sector using
the TSNDRA framework, mapped against the likely outcomes of an ETA event in Tasmania and the
evidence for these outcomes. We assigned a consequence rating of ‘insignificant’ across all sectors.
Based on the Tasmanian case–control ETA event study, we determined the likelihood of an event
occurring in Tasmania was rare (occurring once every 100–1000 years) to very rare (occurring once
every 1000–10,000 years) [26].
Using the TSNDRA framework and combining the consequence and likelihood outcomes,
we determined ETA events have an overall risk rating of ‘very low’. Confidence in this result is high.
This hazard is the lowest-ranked risk across all nine hazards examined in the TSNDRA framework [26]
(see Figure 5). For each of the hazards in this Figure, the results range describes the consequence and
likelihood across all sectors, derived from a stakeholder consultation process.Int. J. Environ. Res. Public Health 2019, 16, 837 8 of 12
Int. J. Environ. Res. Public Health 2019, 16, x FOR PEER REVIEW 8 of 12
Figure 5.
Figure Summary of
5. Summary of the
the risk
risk level
level posed
posed by
by each
each hazard
hazard asas assessed
assessed in
in Tasmanian
Tasmanian State
State Natural
Natural
Disaster Risk Assessment (TSNDRA) 2016 [26], adapted to include ETA risk as determined
Disaster Risk Assessment (TSNDRA) 2016 [26], adapted to include ETA risk as determined by thisby
study.
this
study.
In specifically examining the public health risk of ETA events, we determined a risk level of ‘very
low’ for both the ‘People’ and ‘Social setting’ sectors, and ‘insignificant’ for the other three sectors
In specifically examining the public health risk of ETA events, we determined a risk level of
(Economic, Environment and Public Administration). Across all sectors, ETA events ranked in the
‘very low’ for both the ‘People’ and ‘Social setting’ sectors, and ‘insignificant’ for the other three
lowest level of risk when compared to all natural hazards examined within TSNDRA 2016 [26].
sectors (Economic, Environment and Public Administration). Across all sectors, ETA events ranked
in
4. the lowest level of risk when compared to all natural hazards examined within TSNDRA 2016 [26].
Discussion
The results show that there were no ETA events in Tasmania during the 14.5-year study period.
4. Discussion
Using the TSNDRA framework, ETA events were categorized as a very low public health risk and a
The results show that there were no ETA events in Tasmania during the 14.5-year study period.
very low risk overall. Furthermore, we found that thunderstorm gust events are uncommon in the
Using the TSNDRA framework, ETA events were categorized as a very low public health risk and a
more densely populated southeastern region of Tasmania compared to the less densely populated
very low risk overall. Furthermore, we found that thunderstorm gust events are uncommon in the
north and northwest regions of the state, therefore reducing the likelihood of these events happening
more densely populated southeastern region of Tasmania compared to the less densely populated
over a population center. In addition, the north of Tasmania experiences thunderstorm gust events
north and northwest regions of the state, therefore reducing the likelihood of these events happening
most commonly in winter, outside the high grass pollen season.
over a population center. In addition, the north of Tasmania experiences thunderstorm gust events
This study uses a previously published methodology [3], adapted for Tasmania’s geography and
most commonly in winter, outside the high grass pollen season.
topography. Blinding of the meteorologist to epidemic case days ensured unbiased interpretation
This study uses a previously published methodology [3], adapted for Tasmania’s geography and
of results. Application of a standardized risk assessment framework for natural disasters, as exists
topography. Blinding of the meteorologist to epidemic case days ensured unbiased interpretation of
in other locations [28,29,37], makes this a robust and globally transferable model against which to
results. Application of a standardized risk assessment framework for natural disasters, as exists in
measure this risk. Furthermore, this method can be easily scaled to allow investigation across variety
other locations [28,29,37], makes this a robust and globally transferable model against which to
of spatial locations, making it applicable for both smaller and larger regions.
measure this risk. Furthermore, this method can be easily scaled to allow investigation across variety
The results of this study rely on the somewhat limited understanding of the underlying science of
of spatial locations, making it applicable for both smaller and larger regions.
ETA events. While coincident high grass pollen and thunderstorm gust events are incorporated in the
The results of this study rely on the somewhat limited understanding of the underlying science
of ETA events. While coincident high grass pollen and thunderstorm gust events are incorporated in
the working theory for these event triggers, the actual mechanism for ETA events has not beenInt. J. Environ. Res. Public Health 2019, 16, 837 9 of 12
working theory for these event triggers, the actual mechanism for ETA events has not been conclusively
proven [5]. It is possible that another as yet undiscovered mechanism has a contribution to ETA events,
and this factor (or combination of factors) is not currently incorporated into the methodology.
In this study, pollen data were not examined in detail. As the aim of this study was to determine if
any undetected ETA events had occurred in the study period, analysis of pollen data was not required.
While pollen data exists for some areas of Tasmania [23,24], the available data does not cover the
complete 14.5-year period of this study, nor for all regions of the state examined in this research. If ETA
events had been detected in this study, it may have been of value to examine any available pollen data
related to these events. Given a focus on the identification of epidemic thunderstorm asthma, this
study does not examine the interaction between the prevalence of asthma cases and other air quality
variables, such as particulate matter, wind speed, temperature, or humidity. Similarly, the impact of
thunderstorms on other forms of illness or injury was not examined.
The study covers a period notably longer than other similar case–control studies examining
thunderstorm events and health outcomes [3,38,39]. This allows for a more thorough examination of
the temporal influences and trends impacting the result. Examining thunderstorm gust event data
over this extended period has allowed for observations on frequency and timing of these events across
the regions, which has further contributed to understanding risk levels.
By understanding the public health and overall state-wide risk of ETA events, policymakers are
now able to determine the most appropriate local policy response to this threat, especially in a setting
of finite resources and multiple and competing risk priorities. With a risk rating of ‘very low’, placing
a low priority on addressing the risk of ETA events in Tasmania may be seen as a valid course of
action. However, analysis of such events allows policymakers to examine the robustness of existing
public health and emergency response systems when exposed to similar threats, from both known and
unknown sources.
In Tasmania, asthma is a serious and common health condition, with over 12% of the population
currently affected [40], and over 25% reporting they have been diagnosed with asthma at some point in
their lives [41]. Nineteen people died from asthma in Tasmania in 2016 [42], compared to nine people
in the Melbourne ETA event [1]. Upskilling the community in asthma management more generally is
likely to have a sustainable and long-term impact and reduce the burden of this disease both within
the context of an ETA event and more broadly across the community.
The contribution of environmental factors to higher-than-average daily asthma presentations is not
fully understood, and further research is needed in the Tasmanian context. Potential contributors may
include air pollution, weather extremes (including wind, rainfall, or temperature), high aeroallergen
levels, or circulation of respiratory viruses such as colds or influenza in the community, influencing
winter peaks.
The impact of climate change on the risk of ETA events is yet to be fully assessed and understood.
While it is likely that pollen seasons will increase in length due to a warming climate [43,44], potential
changes to the frequency and/or severity of thunderstorms are more difficult to ascertain [45].
While thunderstorms and other similar weather patterns are likely to increase in severity and frequency
as a result of a warming climate [46,47], increased atmospheric stability may result in a slight decline
in conditions favorable for lightning strike in Tasmania [48]. Further research in this area is required.
5. Conclusions
In conclusion, no ETA events were identified during the 14.5-year study period, and an
examination of weather and pollen data against a standardized risk assessment framework suggests
that the coincidence of thunderstorm gust events with a high rye grass pollen season occurring close
to a susceptible population is very low in Tasmania. Using a similar methodology and appropriate
risk assessment framework, this study could be repeated in other locations, both nationally and
internationally, to assess ETA risk in a consistent way. This study demonstrates how research can
inform appropriate priority and resource allocation, especially in the public health sector.Int. J. Environ. Res. Public Health 2019, 16, 837 10 of 12
Supplementary Materials: The following are available online at http://www.mdpi.com/1660-4601/16/5/837/s1,
Natural disaster risk assessment in Tasmania.
Author Contributions: Conceptualization, S.L.C. and F.H.J.; Data curation, S.L.C. and P.D.F.-H.; Formal analysis,
S.L.C., P.D.F.-H., P.J.J. and K.C.; Methodology, S.L.C. and P.D.F.-H.; Software, S.L.C., T.A.R. and K.C.; Supervision,
T.A.R., C.J.W. and F.H.J.; Writing—original draft, S.L.C.; Writing—review & editing, S.L.C., P.D.F.-H., P.J.J., T.A.R.,
K.C., C.J.W. and F.H.J.
Funding: This work was funded by the Menzies Institute for Medical Research (University of Tasmania) and the
Antarctic Climate and Ecosystems Cooperative Research Centre.
Acknowledgments: The Tasmanian Health Service generously provided emergency department presentation data.
Grant J. Williamson (University of Tasmania) provided additional assistance with mapping. Input and suggestions
from Tasmanian public health registrars and trainees were gratefully received by the authors. The University
of Tasmania Health and Medical Human Research Ethics Committee approved this research (reference number
H0016638).
Conflicts of Interest: The authors declare no conflict of interest. The funders had no role in the design of the
study; in the collection, analyses, or interpretation of data; in the writing of the manuscript, or in the decision to
publish the results.
References
1. Victorian Government. The November 2016 Victorian Epidemic Thunderstorm Asthma Event: An Assessment of
the Health Impacts; Department of Health and Human Services: Melbourne, Australia, 2017.
2. Marks, G.B.; Bush, R.K. It’s blowing in the wind: New insights into thunderstorm-related asthma. J. Allergy
Clin. Immunol. 2007, 120, 530–532. [CrossRef] [PubMed]
3. Marks, G.B.; Colquhoun, J.R.; Girgis, S.T.; Koski, M.H.; Treloar, A.B.A.; Hansen, P.; Downs, S.H.; Car, N.G.
Thunderstorm outflows preceding epidemics of asthma during spring and summer. Thorax 2001, 56, 468–471.
[CrossRef] [PubMed]
4. Taylor, P.E.; Jonsson, H. Thunderstorm asthma. Curr. Allergy Asthma Rep. 2004, 4, 409–413. [CrossRef]
[PubMed]
5. Davies, J.M.; Erbas, B.; Simunovic, M.; Al Kouba, J.; Milic, A.; Fagan, D. Literature Review on Thunderstorm Asthma
and Its Implications for Public Health Advice; Queensland University of Technology: Brisbane, Australia, 2017.
6. Dabrera, G.; Murray, V.; Emberlin, J.; Ayres, J.G.; Collier, C.; Clewlow, Y.; Sachon, P. Thunderstorm asthma:
An overview of the evidence base and implications for public health advice. QJM Int. J. Med. 2013, 106,
207–217. [CrossRef] [PubMed]
7. Thien, F.; Beggs, P.J.; Csutoros, D.; Darvall, J.; Hew, M.; Davies, J.M.; Bardin, P.G.; Bannister, T.; Barnes, S.;
Bellomo, R.; et al. The Melbourne epidemic thunderstorm asthma event 2016: An investigation of
environmental triggers, effect on health services, and patient risk factors. Lancet Planet. Health 2018, 2,
e255–e263. [CrossRef]
8. Wood, S. Thunderstorm Asthma: The Night a Deadly Storm Took Melbourne’s Breath Away.
2017. Available online: www.smh.com.au/lifestyle/thunderstorm-asthma-the-night-a-deadly-storm-took-
melbournes-breath-away-20170308-gut8ur.html (accessed on 10 March 2017).
9. Davey, M. Thunderstorm Asthma: ‘You’re Talking an Event Equivalent to a Terrorist Attack’. 2016.
Available online: https://www.theguardian.com/australia-news/2016/nov/27/thunderstorm-asthma-
oure-talking-an-event-equivalent-to-a-terrorist-attack (accessed on 29 November 2016).
10. Marks, G.B. It’s Not Just about Melbourne: Why We Need a National Approach to ‘Thunderstorm
Asthma’. 2016. Available online: https://theconversation.com/its-not-just-about-melbourne-why-we-need-
a-national-approach-to-thunderstorm-asthma-69426 (accessed on 27 November 2016).
11. Victorian Government. Department of Health and Human Services Policy and Funding Guidelines; Department of
Health and Human Services: Melbourne, Australia, 2017.
12. Grundstein, A.; Shepherd, M.; Miller, P. The Role of Mesoscale-Convective Processes in Explaining the
21 November 2016 Epidemic Thunderstorm Asthma Event in Melbourne, Australia. J. Appl. Meteorol.
Climatol. 2017, 56, 1337. [CrossRef]
13. Department of Premier and Cabinet. TasALERT—Thunderstorm Asthma. Available online: https://www.
facebook.com/tasalert/posts/1733972686615172 (accessed on 25 March 2018).Int. J. Environ. Res. Public Health 2019, 16, 837 11 of 12
14. Billings, P. High Pollen Count and Forecast Thunderstorm Combine to Create Severe Asthma Risk in
Southern Tasmania. 2017. Available online: www.themercury.com.au/news/tasmania/high-pollen-count-
and-forecast-thunderstorm-combine-to-create-severe-asthma-risk-in-southern-tasmania/news-story/
21be2d1cd7a5212d7b90e0b5090b03c5 (accessed on 15 November 2017).
15. Monery, H. Tasmania Issued Thunderstorm Asthma Warning. 2017. Available online: http://www.examiner.
com.au/story/5057451/thunderstorm-asthma-warning-issued-for-people-across-tasmania (accessed on
15 November 2017).
16. Australian Bureau of Statistics. Australian Statistical Geography Standard (ASGS): Volume 5—Remoteness
Structure Commonwealth Government; Australian Bureau of Statistics: Canberra, Australia, 2011;
Volume 1270.0.55.005.
17. Australian Bureau of Statistics. 2016 Census; Commonwealth Government: Canberra, Australia, 2017.
18. Kuleshov, Y.; de Hoedt, G.; Wright, W.; Brewster, A. Thunderstorm distribution and frequency in Australia.
Aust. Meteorol. Mag. 2002, 51, 145.
19. Allen, J.T.; Karoly, D.J. A climatology of Australian severe thunderstorm environments 1979–2011:
Inter-annual variability and ENSO influence. Int. J. Climatol. 2014, 34, 81–97. [CrossRef]
20. Jones, M. Tornadoes and waterspouts in northern Tasmania. Meteorol. Note 1990, 192, 1–28.
21. Bellomo, R.; Gigliotti, P.; Treloar, A.; Holmes, P.; Suphioglu, C.; Singh, M.B.; Knox, B. Two consecutive
thunderstorm associated epidemics of asthma in the City of Melbourne. The possible role of ryegrass pollen.
Med. J. Aust. 1992, 156, 834–837. [PubMed]
22. Haberle, S.; Bowman, D.; Newnham, R.; Johnston, F.; Beggs, P.; Buters, J.; Campbell, B.; Erbas, B.; Godwin, I.;
Green, B.J.; et al. The macroecology of airborne pollen in Australian and New Zealand urban areas. PLoS ONE
2014, 9, e97925. [CrossRef] [PubMed]
23. Tng, D.Y.P.; Hopf, F.; Haberle, S.G.; Bowman, D.M.J.S. Seasonal pollen distribution in the atmosphere of
Hobart, Tasmania: Preliminary observations and congruence with flowering phenology. Aust. J. Bot. 2010,
58, 440–452. [CrossRef]
24. Johnston, F.H.; Wheeler, A.J.; Williamson, G.J.; Campbell, S.L.; Jones, P.J.; Koolhof, I.S.; Lucani, C.;
Cooling, N.B.; Bowman, D.M.J.S. Using smartphone technology to reduce health impacts from atmospheric
environmental hazards. Environ. Res. Lett. 2018, 13, 044019. [CrossRef]
25. Lane, P.; Morris, D.; Bridle, K.; Eyles, A. Common Grasses: An Agriculturalists’ Guide; Cradle Coast NRM,
NRM North, NRM South and the University of Tasmania: Hobart, Australia, 2015.
26. White, C.; Remenyi, T.; McEvoy, D.; Trundle, A.; Corney, S. 2016 Tasmanian State Natural Disaster Risk
Assessment; University of Tasmania: Tasmania, Australia, 2016.
27. Commonwealth of Australia. National Emergency Risk Assessment Guidelines—Handbook 10; Australian
Institute for Disaster Resilience, Attorney General’s Department: Canberra, Australia, 2015.
28. Organisation for Economic Cooperation and Development. National Risk Assessments: A Cross Country
Perspective; OECD Publishing: Paris, France, 2018. [CrossRef]
29. Federal Office for Civil Protection. Disasters and Emergencies in Switzerland 2015; Federal Office for Civil
Protection: Bern, Switzerland, 2015.
30. Noji, E.K. The Public Health Consequences of Disasters. Prehospit. Disaster Med. 2000, 15, 21–31. [CrossRef]
31. Commonwealth of Australia. Australian Disaster Resilience Handbook 1: Disaster Health; Australian Institute
for Disaster Resilience, Attorney General’s Department: Canberra, Australia, 2011.
32. Thornley, L.; Ball, J.; Signal, L.; Lawson-Te Aho, K.; Rawson, E. Building community resilience: Learning
from the Canterbury earthquakes. Kōtuitui N. Z. J. Soc. Sci. Online 2015, 10, 23–35. [CrossRef]
33. Silverman, R.A.; Stevenson, L.; Hastings, H.M. Age-related seasonal patterns of emergency department
visits for acute asthma in an urban environment. Ann. Emerg. Med. 2003, 42, 577–586. [CrossRef]
34. Lincoln, D.; Morgan, G.; Sheppeard, V.; Jalaludin, B.; Corbett, S.; Beard, J. Childhood asthma and return to
school in Sydney, Australia. Public Health 2006, 120, 854–862. [CrossRef] [PubMed]
35. Chen, C.-H.; Xirasagar, S.; Lin, H.-C. Seasonality in Adult Asthma Admissions, Air Pollutant Levels,
and Climate: A Population-based Study. J. Asthma 2006, 43, 287–292. [CrossRef] [PubMed]
36. Silver, J.; Sutherland, M.; Johnston, F.; Lampugnani, E.; McCarthy, M.; Jacobs, S.; Pezza, A.; Newbigin, E.
Seasonal asthma in Melbourne, Australia, and some observations on the occurrence of thunderstorm asthma
and its predictability. PLoS ONE 2018, 13, e0194929. [CrossRef] [PubMed]Int. J. Environ. Res. Public Health 2019, 16, 837 12 of 12
37. Norwegian Directorate for Civil Protection. National Risk Analysis; Norwegian Government: Tønsberg,
Norway, 2014.
38. Ilias, I. Eight year retrospective study of thunderstorm-associated asthma attacks in Athens Greece. Int. J.
Environ. Health Res. 1998, 8, 335–337. [CrossRef]
39. Higham, J.; Venables, K.; Kupek, E.; Bajekal, M.; Kopek, E. Asthma and thunderstorms: Description of an
epidemic in general practice in Britain using data from a doctors’ deputising service in the UK. J. Epidemiol.
Community Health 1997, 51, 233–238. [CrossRef] [PubMed]
40. Australian Bureau of Statistics. National Health Survey 2014–15; Commonwealth Government: Canberra,
Australia, 2015.
41. Department of Health and Human Services. Report on the Tasmanian Population Health Survey 2016; Tasmanian
Government: Hobart, Australia, 2017.
42. Australian Bureau of Statistics. ABS 3303.0 Causes of Death, Tasmania; Australian Government, 2016.
43. Lake, I.R.; Jones, N.R.; Agnew, M.; Goodess, C.M.; Giorgi, F.; Hamaoui-Laguel, L.; Semenov, M.A.;
Solomon, F.; Storkey, J.; Vautard, R.; et al. Climate Change and Future Pollen Allergy in Europe.
Environ. Health Perspect. 2017, 125, 385–391. [CrossRef] [PubMed]
44. Anenberg, S.; Weinberger, K.R.; Roman, H.; Neumann, J.E.; Crimmins, A.; Fann, N.; Martinich, J.; Kinney, P.L.
Impacts of oak pollen on allergic asthma in the USA and potential effect of future climate change: A modelling
analysis. Lancet 2017, 389, S2. [CrossRef]
45. Walsh, K.J.E.; White, C.J.; McInnes, K.L.; Holmes, J.; Schuster, S.; Richter, H.; Evans, J.P.; Di Luca, A.;
Warren, R.A. Natural hazards in Australia: Storms, wind and hail. Clim. Chang. 2016, 139, 55–67. [CrossRef]
46. Hoogewind, K.A.; Baldwin, M.E.; Trapp, R.J. The Impact of Climate Change on Hazardous Convective
Weather in the United States: Insight from High-Resolution Dynamical Downscaling. J. Clim. 2017, 30,
10081–10100. [CrossRef]
47. Romps, D.M.; Seeley, J.T.; Vollaro, D.; Molinari, J. Projected increase in lightning strikes in the United States
due to global warming. Science 2014, 346, 851–854. [CrossRef]
48. Press, A. Tasmanian Wilderness World Heritage Area Bushfire and Climate Change Research Project; Tasmanian
Government: Hobart, Australia, 2016.
© 2019 by the authors. Licensee MDPI, Basel, Switzerland. This article is an open access
article distributed under the terms and conditions of the Creative Commons Attribution
(CC BY) license (http://creativecommons.org/licenses/by/4.0/).You can also read