SARS-COV-2 SURVEILLANCE SYSTEM IN CANADA: LONGITUDINAL TREND ANALYSIS
←
→
Page content transcription
If your browser does not render page correctly, please read the page content below
JMIR PUBLIC HEALTH AND SURVEILLANCE                                                                                                                      Post et al

     Original Paper

     SARS-CoV-2 Surveillance System in Canada: Longitudinal Trend
     Analysis

     Lori Post1, PhD; Michael J Boctor2, BSc; Tariq Z Issa2, BA; Charles B Moss3, PhD; Robert Leo Murphy4, MD; Chad
     J Achenbach5, MD, MPH; Michael G Ison5, MD, MSc; Danielle Resnick6, PhD; Lauren Singh1, MPH; Janine White1,
     MA; Sarah B Welch1, MPH; James F Oehmke1, PhD
     1
      Buehler Center for Health Policy and Economics, Feinberg School of Medicine, Northwestern University, Chicago, IL, United States
     2
      Feinberg School of Medicine, Northwestern University, Chicago, IL, United States
     3
      Institute of Food and Agricultural Sciences, University of Florida, Gainsville, FL, United States
     4
      Institute of Global Health, Feinberg School of Medicine, Northwestern University, Chicago, IL, United States
     5
      Divison of Infectious Disease, Feinberg School of Medicine, Northwestern University, Chicago, IL, United States
     6
      International Food Policy Research Institute, Washington, DC, United States

     Corresponding Author:
     Lori Post, PhD
     Buehler Center for Health Policy and Economics
     Feinberg School of Medicine
     Northwestern University
     420 E Superior
     Chicago, IL, 60611
     United States
     Phone: 1 203 980 7107
     Email: lori.post@northwestern.edu

     Abstract
     Background: The COVID-19 global pandemic has disrupted structures and communities across the globe. Numerous regions
     of the world have had varying responses in their attempts to contain the spread of the virus. Factors such as public health policies,
     governance, and sociopolitical climate have led to differential levels of success at controlling the spread of SARS-CoV-2.
     Ultimately, a more advanced surveillance metric for COVID-19 transmission is necessary to help government systems and national
     leaders understand which responses have been effective and gauge where outbreaks occur.
     Objective: The goal of this study is to provide advanced COVID-19 surveillance metrics for Canada at the country, province,
     and territory level that account for shifts in the pandemic including speed, acceleration, jerk, and persistence. Enhanced surveillance
     identifies risks for explosive growth and regions that have controlled outbreaks successfully.
     Methods: Using a longitudinal trend analysis study design, we extracted 62 days of COVID-19 data from Canadian public
     health registries for 13 provinces and territories. We used an empirical difference equation to measure the daily number of cases
     in Canada as a function of the prior number of cases, the level of testing, and weekly shift variables based on a dynamic panel
     model that was estimated using the generalized method of moments approach by implementing the Arellano-Bond estimator in
     R.
     Results: We compare the week of February 7-13, 2021, with the week of February 14-20, 2021. Canada, as a whole, had a
     decrease in speed from 8.4 daily new cases per 100,000 population to 7.5 daily new cases per 100,000 population. The persistence
     of new cases during the week of February 14-20 reported 7.5 cases that are a result of COVID-19 transmissions 7 days earlier.
     The two most populous provinces of Ontario and Quebec both experienced decreases in speed from 7.9 and 11.5 daily new cases
     per 100,000 population for the week of February 7-13 to speeds of 6.9 and 9.3 for the week of February 14-20, respectively.
     Nunavut experienced a significant increase in speed during this time, from 3.3 daily new cases per 100,000 population to 10.9
     daily new cases per 100,000 population.
     Conclusions: Canada excelled at COVID-19 control early on in the pandemic, especially during the first COVID-19 shutdown.
     The second wave at the end of 2020 resulted in a resurgence of the outbreak, which has since been controlled. Enhanced surveillance
     identifies outbreaks and where there is the potential for explosive growth, which informs proactive health policy.

     https://publichealth.jmir.org/2021/5/e25753                                                          JMIR Public Health Surveill 2021 | vol. 7 | iss. 5 | e25753 | p. 1
                                                                                                                               (page number not for citation purposes)
XSL• FO
RenderX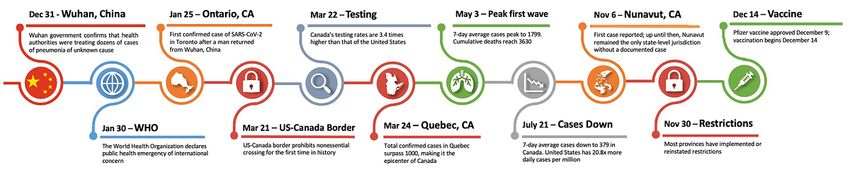
JMIR PUBLIC HEALTH AND SURVEILLANCE                                                                                                           Post et al

     (JMIR Public Health Surveill 2021;7(5):e25753) doi: 10.2196/25753

     KEYWORDS
     global COVID surveillance; COVID-19; COVID-21; new COVID strains; Canada Public Health Surveillance; Great COVID
     Shutdown; Canadian COVID-19; surveillance metrics; wave 2 Canada COVID-19; dynamic panel data; generalized method of
     the moments; Canadian econometrics; Canada SARS-CoV-2; Canadian COVID-19 surveillance system; Canadian COVID
     transmission speed; Canadian COVID transmission acceleration; COVID transmission deceleration; COVID transmission jerk;
     COVID 7-day lag; Alberta; British Columbia; Manitoba; New Brunswick; Newfoundland and Labrador; Northwest Territories;
     Nova Scotia; Nunavut; Ontario; Prince Edward Island; Quebec; Saskatchewan; Yukon

                                                                           mid-March [5]. Figure 1 shows the timeline of COVID-19 in
     Introduction                                                          Canada.
     Background                                                            Fast forward one year later, Canada has had a resurgence of
     On January 30, 2020, the World Health Organization officially         COVID-19 infections and has reimplemented public health
     declared the outbreak of SARS-CoV-2, the virus that causes            guidelines to control the COVID-19 epidemic. As of February
     COVID-19, a public health emergency of international concern          22, 2021, Ontario and Quebec account for 68% of confirmed
     [1]. The virus has disrupted communities across the globe [2].        cases and 79% of deaths in Canada [10]. Nunavut, with a
     Numerous factors, including public health policies, climate,          population of 38,780, remained the only geographical
     population characteristics, governance, and sociopolitical            jurisdiction in North America without a single confirmed case
     factors, led to varying levels of success at controlling the spread   of SARS-CoV-2 until early November 2020, when it began to
     of SARS-CoV-2 [3-7]. Despite sharing many similarities,               see cases accelerate quickly [13]. Nunavut has one hospital and
     COVID-19 could not have played out more differently between           struggles with food security [14] and tuberculosis outbreaks
     Canada and the United States [8]. Canada reported a total of          [15]. Nunavut faced potentially catastrophic consequences from
     849,517 COVID-19 infections or 2235 cases per 100,000                 the introduction of SARS-CoV-2 to its region. Strict prevention
     population and 21,723 COVID-19 deaths or 57 deaths per                measures barred anyone but residents and critical workers from
     100,000 population as of February 22, 2021 [9,10]. In                 entering—with required self-isolation for 14 days prior to
     comparison, as of February 22, 2021, the United States had a          entering [16]. The measures put in place by the Nunavut
     total of 28,221,129 COVID-19 infections or 8598 per 100,000           government were not entirely unique among its neighboring
     population and 501,663 COVID-19 deaths or 153 deaths per              provinces and territories. The Northwest Territories had even
     100,000 population [9,10]. The COVID-19 infection and death           stricter isolation measures, barring all travel to the territory
     rates of the United States are 3.8 times and 2.7 times those of       except for residents, who were required to quarantine for 14
     Canada’s, respectively. Understanding the context in which the        days in a government-run location [16]. Despite the substantial
     COVID-19 pandemic occurs and the dynamics of the pandemic             administrative authority each province possesses, Canadian
     will inform not only Canada but also those nations struggling         leaders worked well together, constructing a unified response
     to control the multiple outbreaks, such as the United States.         [17-19]. Across the country, mass gatherings were prohibited,
     Unfortunately, existing surveillance suffers from reporting           schools and nonessential businesses were required to close, and
     biases, undercounts, missing data, and data contamination.            fines were implemented for failing to follow social distancing
                                                                           policies [18,19]. Furthermore, there has been consistent
     How the Pandemic Unfolded in Canada                                   messaging in regard to public health guidelines such as mask
     On January 25, 2020, Canada saw its first case of SARS-CoV-2          wearing [18]. This is in stark contrast to the United States, which
     after a man returned to Toronto from Wuhan, China [11]. Cases         has no national policies and failed to issue clear guidance on
     in Ontario rose a month later [12]. Quebec soon became                mask wearing, quarantines, hand hygiene, and social distancing,
     Canada’s first epicenter, likely due to southern travel into the      as many states have not implemented public health guidelines
     United States during its winter school break, which occurred          or supported the benefits of mask wearing [20-23].
     two weeks prior to lockdown measures implemented in
     Figure 1. Timeline of major COVID-19 events for Canada. WHO: World Health Organization.

     https://publichealth.jmir.org/2021/5/e25753                                               JMIR Public Health Surveill 2021 | vol. 7 | iss. 5 | e25753 | p. 2
                                                                                                                    (page number not for citation purposes)
XSL• FO
RenderX
JMIR PUBLIC HEALTH AND SURVEILLANCE Post et al
Politics The basic question we are trying to inform is the following:
Furthermore, Canada’s response to the COVID-19 pandemic how are we doing this week relative to previous weeks? From
and social unity in public health adherence has likely benefited a public health perspective, in the midst of a pandemic, we
from the country's experience with the 2003 severe acute would like (at least) three affirmative responses: (1) there are
respiratory syndrome (SARS) epidemic that killed 44 Canadians fewer new cases per day this week than last week, (2) the
[17]. A number of improvements were made in response to the number of new cases is declining from day to day, and (3) the
SARS dress rehearsal in 2003, creating better federal-provincial day-to-day decline in the number of cases is even bigger this
collaboration and more effective public health communication week than last week. Additionally, we would like some
strategies [17]. indicative information about significant shifts in how the
pandemic is progressing—positive shifts could be the first
Canadian Prime Minister Justin Trudeau did not downplay the indicators of the emergence of a new or recurrent hotspot, and
SARS-CoV-2 threat [18,24]. Trudeau began wearing a mask in negative shifts could be the first indicators of successful public
May 2020 and practiced self-isolation for several weeks health policy.
following his wife's diagnosis with SARS-CoV-2 in March
[24,25]. Adherence to evidence-based guidelines that prevent We use a longitudinal trend analysis study design in concert
the transmission of SARS-CoV-2 by political leaders is a critical with dynamic panel modeling and the method of moments to
component to promoting safe behavior and cooperation in the correct for existing surveillance data limitations [39,40].
general population with public health guidelines [26]. Specifically, we will measure significant weekly shifts in the
Furthermore, in Canada, provincial leaders on polar ends of the transmission of COVID-19 (ie, increase, decrease, or plateau).
political spectrum shared a cross-partisan consensus on how to Our study will measure the underlying causal effect from a
manage the COVID-19 pandemic [18,19], whereas in the United given prior week that persists through the following week, with
States, political leaders of each political party have found little a 7-day persistence rate to explain a clustering/declustering
agreement on standard pandemic control measures including effect. The 7-day persistence represents an underlying disease
stay-at-home orders and mask mandates. transmission wave, where a large number of transmissions in a
given prior week that results in a large number of infections the
Significance following week then “echoes” forward into a large number of
Ideally, the development of a more advanced methodology for new transmissions and hence a large number of new cases 7
tracking and estimating COVID-19 transmission in regions days forward.
within Canada will allow for more reliable analysis of which In summary, we will measure negative and positive shifts in
policies are effective and what other factors may be associated the transmission of SARS-CoV-2 and the dynamics of the
with transmission rates. Public health departments, as well as pandemic with acceleration/deceleration and jerk. Our novel
several universities and media outlets, are tracking the novel indicator of persistence does not suffer from sampling bias. Our
coronavirus using raw data including the number of new surveillance system measures the dynamics of the pandemic so
infections, testing, positivity, Rho, and deaths, in addition to that provincial governments can be proactive rather than reactive
other measures such as local hospital capacity [27-36]. To to outbreaks at the subnational level. This informs decision
remove temporal effects, many surveillance systems have shifted making regarding disease control, mitigation strategies, and
to 7-day moving averages to counter the dearth of reporting reopening policies as Canada continues to manage this
during holidays and weekends. Although moving averages pandemic.
temper volatility of data and testing/reporting affects,
surveillance still suffers from missing cases. General public Methods
health surveillance is helpful and provides a proxy of the
pandemic, but surveillance data still suffer from significant bias The Government of Canada compiles data from each of the
due to undercounts, reporting delays, testing errors, dearth of provinces and territories. Data have been accessed daily through
testing, asymptomatic carriers, and other types of data their official government website [44] since January 2020 and
contamination. In fact, surveillance systems are limited by the static measures are updated. Persistence and shifts in the
fact that they tend to include only the more severe cases while pandemic are calculated biweekly. The current panel included
missing the mild cases and undiagnosed infections and deaths 13 provinces and territories to include the entire country of
[37,38]. Canada, with 62 days in each panel (n=806). An empirical
difference equation was specified in which the number of new
Objective
positive cases in each province each day is a function of the
To that end, the objective of our research is to provide standard prior number of cases, the level of testing, and weekly shift
surveillance metrics, which are necessary but not sufficient to variables that measure whether the outbreak was growing faster
detect the dynamics of the pandemic at the province level, even than, slower than, or at the same rate as the previous weeks.
though they are limited to more severe cases and suffer from This resulted in a dynamic panel model that was estimated using
incomplete case ascertainment and data contamination. To the generalized method of moments (GMM) approach by
address these data limitations, we validated additional novel implementing the Arellano-Bond estimator in R [45].
surveillance metrics: (1) speed, (2) acceleration, (3) jerk (change
in acceleration), (4) 7-day lag, and (5) 7-day persistence effect Dynamic panel models allow us to derive novel metrics of
[39-43]. COVID-19 transmissions by using data collected from the
government. Hence, we can provide additional useful metrics
https://publichealth.jmir.org/2021/5/e25753 JMIR Public Health Surveill 2021 | vol. 7 | iss. 5 | e25753 | p. 3
(page number not for citation purposes)
XSL• FO
RenderXJMIR PUBLIC HEALTH AND SURVEILLANCE Post et al
that are less labor intensive. Although this is less of a benefit speed (the number of new observed COVID-19 cases per day
for Canada because of the notable health system and immense per 100,000, averaged over a week), (2) acceleration (the change
resources, dynamic panel models are useful in low-income in speed from the prior week to the current week), (3) jerk (the
countries that do not have the resources to have teams of week-over-week change in acceleration as a function of time
epidemiologists model COVID-19. Dynamic panel data using over the course of 2 weeks), and (4) 7-day persistence effect on
GMM are the same methods used to measure the expansion and speed (the average of the number of new cases per day in a
contraction of the economy. These methods lend themselves given week that are statistically attributable to new cases seven
well to measuring the pandemic. Given the extensive detail days earlier). We compare the week of February 7-13, 2021,
necessary to derive novel metrics that are necessary for this with the week of February 14-20, 2021.
study, we refer to original works by Oehmke and colleagues
[40], followed by a proof of concept of a surveillance system Results
with enhanced surveillance techniques to measure the dynamics
of the pandemic [39]. Country Regression Results
Existing surveillance metrics are helpful at gauging the spread Regression results for 13 Canadian provinces and territories are
of COVID-19 and to that end, we provide traditional measures presented in Table 1. Weekly surveillance data in Tables 2-6
that include the number of new COVID-19 cases, cumulative are based on these regressions. The regression Wald statistic is
cases since the outbreak began, a 7-day moving average to significant (χ28= 615.617, PJMIR PUBLIC HEALTH AND SURVEILLANCE Post et al
Table 2. Static surveillance metrics for the week of February 7-13, 2021.
Province New Cumulative cases 7-day moving Infection rate Deaths Cumulative deaths 7-day moving Death
cases average average of rate
death
Alberta 305 128,532 303.43 6.90 15 1775 10 0.34
British Columbia 0 72,750 433.43 0 0 1288 6.00 0
Manitoba 99 30,687 75.57 7.18 0 866 3.43 0
New Brunswick 16 1398 8.71 2.05 0 22 0.29 0
Newfoundland and 26 686 38.71 4.98 0 4 0 0
Labrador
Northwest Territories 0 43 1 0 0 0 0 0
Nova Scotia 2 1592 1.14 0.20 0 65 0 0
Nunavut 5 308 1.29 12.71 0 1 0 0
Ontario 1300 284,887 1167.00 8.82 19 6651 24 0.13
Prince Edward Island 0 114 0.29 0 0 0 0 0
Quebec 1049 275,880 986.14 12.23 28 10,201 28.86 0.33
Saskatchewan 244 26,389 168.57 20.70 4 354 2.57 0.34
Yukon 0 71 0.14 0 0 1 0 0
Canada 3046 823,337 2727.86 8.01 66 21,228 75.14 0.17
Table 3. Static surveillance metrics for the week of February 14-20, 2021.
Province New Cumulative cases 7-day moving Infection rate Deaths Cumulative deaths 7-day moving Death
cases average average of rate
death
Alberta 380 130,727 313.57 8.59 6 1818 6.14 0.14
British Columbia 0 75,835 440.71 0 0 1327 5.57 0
Manitoba 94 31,329 91.71 6.82 3 882 2.29 0.22
New Brunswick 3 1420 3.14 0.38 0 24 0.29 0
Newfoundland and 38 901 30.71 7.28 0 4 0 0
Labrador
Northwest Territories 0 47 0.57 0 0 0 0 0
Nova Scotia 4 1608 2.29 0.41 0 65 0 0
Nunavut 6 338 4.29 15.25 0 1 0 0
Ontario 1228 291,999 1016 8.33 28 6848 28.14 0.19
Prince Edward Island 0 114 0 0 0 0 0 0
Quebec 769 281,456 796.57 8.97 14 10,292 13 0.16
Saskatchewan 193 27,438 149.86 16.37 3 368 2 0.25
Yukon 0 72 0.14 0 0 1 0 0
Canada 2715 843,284 2502.14 7.14 54 21,630 57.43 0.14
Canada’s speed of infection decreased from 8.38 new cases per persistent rate decreased from 8.6 to 6.4 between February 7
100,000 per week the week of February 7-13, 2021, to 7.5 new and February 20, 2021 (Table 6). Canada had deceleration in
cases per 100,000 per week the week of February 14-20, 2021. new cases and a negative jerk from February 7 to February 20
Nunavut’s speed increased dramatically from 3.3 to 10.9 per (Tables 4 and 5). Looking at provinces individually, the overall
100,000; Quebec’s speed decreased from 11.5 to 9.3 per countrywide pattern holds, as all provinces had acceleration of
100,000; Saskatchewan decreased from 14.3 to 12.7 per 100,000JMIR PUBLIC HEALTH AND SURVEILLANCE Post et al
Table 4. Novel surveillance metrics for the week of February 7-13, 2021.
Province Speed: daily positives per Acceleration: day-to-day change Jerk: week-over-week 7-day persistence effect on
100,000 (weekly average of in the number of positives per day, change in acceleration, per speed (number of new cases
new daily cases per weekly average, per 100,000 100,000 per day per 100,000 attribut-
100,000) ed to new cases 7 days ago)
Alberta 6.86 –0.14 0.13 3.86
British Columbia 8.42 0 0.07 3.65
Manitoba 5.48 0.20 0.50 3.30
New Brunswick 1.12 0.07 0.11 0.88
Newfoundland and 7.42 0.63 –0.71 0.09
Labrador
Northwest Territories 2.21 0 0 0.14
Nova Scotia 0.12 0.03 0.03 0.03
Nunavut 3.27 0.73 0.73 2.44
Ontario 7.92 –0.09 0.49 4.49
Prince Edward Island 0.18 0 0 0.04
Quebec 11.50 –0.26 –0.06 5.68
Saskatchewan 14.30 –0.23 0.72 8.58
Yukon 0.34 0 –0.34 0
Canada 8.38 –0.10 0.23 4.37
Table 5. Novel surveillance metrics for the week of February 14-20, 2021.
Province Speed: daily positives Acceleration: day-to-day Jerk: week-over-week change in 7-day persistence effect on
per 100,000 (weekly change in the number of posi- acceleration, per 100,000 speed (number of new cases
average of new daily tives per day, weekly average, per day per 100,000 attributed
cases per 100,000) per 100,000 to new cases 7 days ago)
Alberta 7.09 0.24 0.21 3.07
British Columbia 8.56 0 –0.17 3.77
Manitoba 6.65 –0.05 –0.15 2.45
New Brunswick 0.40 –0.24 –0.26 0.50
Newfoundland and 5.88 0.33 0.05 3.32
Labrador
Northwest Territories 1.27 0 0 0.99
Nova Scotia 0.23 0.03 0 0.05
Nunavut 10.89 0.36 –0.36 1.46
Ontario 6.90 –0.07 –0.14 3.54
Prince Edward Island 0 0 0 0.08
Quebec 9.29 –0.47 –0.16 5.15
Saskatchewan 12.71 –0.62 –0.11 6.40
Yukon 0.34 0 0.34 0.15
Canada 7.50 –0.12 –0.10 3.75
In general, between February 7, 2021, and February 20, 2021, maintained that minor deceleration the following week at –0.1
the speed of the COVID-19 pandemic slowed slightly in Canada per day per 100,000 population. Moreover, comparing the
as it went from 8.4 to 7.5 cases per day per 100,000 population. acceleration week over week, the rate of acceleration jerked
The pandemic was decelerating during the week of February downward by –0.1 per day per 100,000 population.
13, 2021, by –0.1 cases per day per 100,000 population and
https://publichealth.jmir.org/2021/5/e25753 JMIR Public Health Surveill 2021 | vol. 7 | iss. 5 | e25753 | p. 6
(page number not for citation purposes)
XSL• FO
RenderXJMIR PUBLIC HEALTH AND SURVEILLANCE Post et al
Table 6. Provinces with the highest 7-day persistence.
Date and provinces 7-day persistence values
February 13, 2021
Saskatchewan 8.58
Quebec 5.68
Ontario 4.49
Alberta 3.86
British Columbia 3.65
February 20, 2021
Saskatchewan 6.40
Quebec 5.15
British Columbia 3.77
Ontario 3.54
Newfoundland and Labrador 3.32
The persistence rate, which is the number of cases this week slightly for Manitoba the week of February 20, 2021. Although
that are statistically linked to novel infections a week ago, shows the speed is increasing, the day-to-day increase in COVID-19
the pandemic shifting downward with the exception of British transmissions jerked downward for British Columbia and
Columbia, which had a modest increase (Table 6). Less densely Manitoba, with Alberta’s jerk slightly increasing (Tables 4 and
populated areas of Newfoundland and Labrador, the Northwest 5). Jerk can be interpreted as a given week’s acceleration minus
Territories, Nova Scotia, and Prince Edward Island experienced the prior week’s acceleration. Jerk helps us to understand how
modest increases in the persistence of infections during the the pandemic is increasing or decreasing relative to last week.
week of February 20, 2021. Nunavut’s rates indicated an outbreak between the weeks of
February 7-13 and February 14-20, 2021, when the rate of speed
The most populous provinces and their populations are shown
increased from 3.3 to 10.9 new infections per day per 100,000
in Table 7. Of the most populous provinces, Ontario and Quebec
population. Fortunately, there is evidence that this outbreak is
both had a decrease in speed, deceleration, and negative jerk
slowing. The acceleration of speed slowed during this time,
during February 7-20, 2021. All dynamic indicators of the two
down from 0.7 per 100,000 per day during the week of February
largest provinces show that the pandemic is slowing. Of concern
7-13 to 0.4 per 100,000 per day during the week of February
are British Columbia, Alberta, and Manitoba because they are
14-20. The persistence rate also decreased from 2.4 to 1.5 cases
headed in the opposite direction. Specifically, the speed of the
that are directly attributable to the number of new infections 7
pandemic is increasing in these three provinces. Acceleration
days earlier. Although Nunavut experienced an outbreak, we
of the daily speed, which is the week-to-week change in the
also see the pandemic slowing, indicating a favorable response
number of new daily cases per 100,000 population increased
to mitigation efforts.
for Alberta, remained at 0 for British Columbia, and decreased
Table 7. Most populous Canadian provinces.
Province Population as of 2020
Ontario 14,734,014
Quebec 8,574,571
British Columbia 5,147,712
Alberta 4,421,876
Manitoba 1,379,263
active surveillance system that informed this study, which
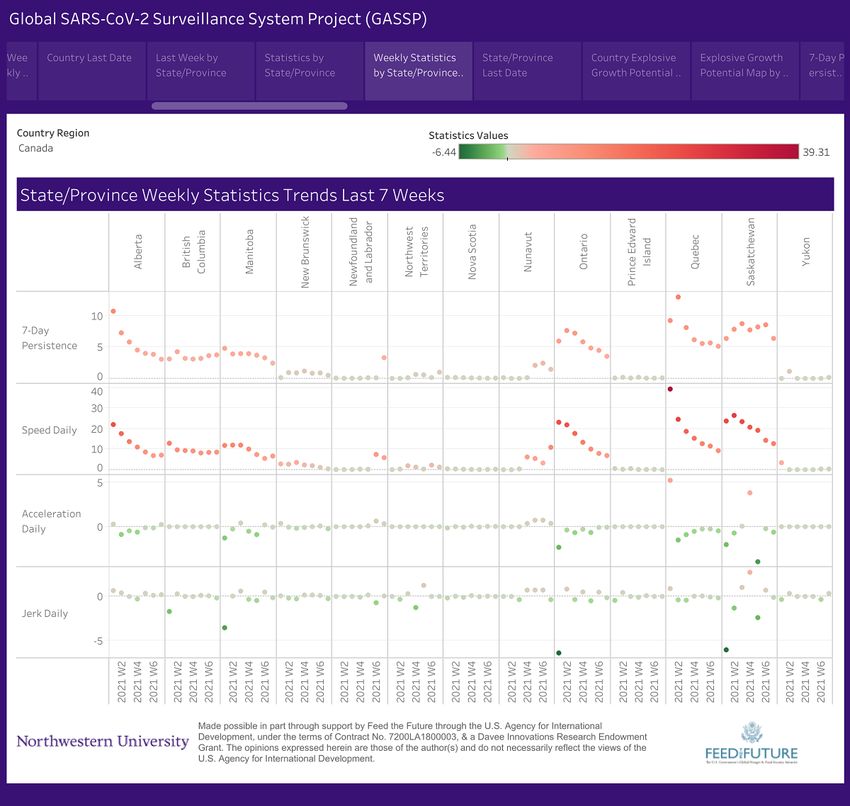
Province Regression Results contains more recent data, can be accessed online [46]. Figure
Due to the nature of publications, the moment we publish our 2 provides a visualization of our novel metrics over a 3-week
research findings, the data become outdated. To that end, the period.
https://publichealth.jmir.org/2021/5/e25753 JMIR Public Health Surveill 2021 | vol. 7 | iss. 5 | e25753 | p. 7
(page number not for citation purposes)
XSL• FO
RenderXJMIR PUBLIC HEALTH AND SURVEILLANCE Post et al
Figure 2. Screenshot of weekly Canada SARS-CoV-2 trends by province/territory.
located in North America and both are developed, high-income
Discussion countries, with vast geographical areas and heterogeneous
Principal Findings populations. Beyond this, the similarities end between the Unites
States and Canada as it relates to COVID-19 transmissions.
The novel metrics applied in this paper advance Canada’s
surveillance capacity for monitoring the COVID-19 pandemic. Canada developed a coordinated national plan between political
In particular, acceleration and jerk provide a more complete parties and among its provinces and territories. First and
picture of day-to-day and week-to-week changes in the foremost, Canada successfully implemented a widespread
pandemic than do traditional surveillance measures. The 7-day shutdown, which led to the initial reduction in COVID-19
persistence rate helps identify areas where a high incidence of transmissions. In addition, social isolation, distancing, masking,
cases one week is passed forward to create a high incidence of testing, and contact tracing have resulted in a coordinated effort
cases the next week, and high persistence rates indicate an that has mitigated the pandemic. Fortunately, this has worked
underlying problem with pandemic control. These measures, well for a number of provinces and territories. Though Canada
available through an online data dashboard, provide valuable overall still has new daily cases, the pandemic is slowing based
information to Canada (as well as other countries) to monitor on measures of acceleration, jerk, and 7-day persistence rate,
the pandemic. meaning cases and transmission were trending downward during
the week of February 14-20. These rates were trending upward
Canada initially had an outbreak of COVID-19 around the same the week before. The most alarming metric is that speed in
time as the initial outbreak in the United States. At many levels, Nunavut increased from 3.3 new cases per day per 100,000
the Unites States and Canada are similar in that they are both population to 10.9 cases per day per 100,000 population, which
https://publichealth.jmir.org/2021/5/e25753 JMIR Public Health Surveill 2021 | vol. 7 | iss. 5 | e25753 | p. 8
(page number not for citation purposes)
XSL• FO
RenderXJMIR PUBLIC HEALTH AND SURVEILLANCE Post et al
is a three-fold increase. This is indicative of an outbreak; Conclusion
however, the Canadian response to novel infections in Nunavut Canada has maintained good COVID-19 control policies that
resulted in the speed decelerating, which is evident in the resulted in fewer transmissions for the week of February 14-20,
decrease in the acceleration rate as well as a negative jerk during 2021, compared to the previous week; however, it is not time
the week of February 14-20, 2021. for Canada to declare victory over COVID-19 transmissions or
Canada is successfully tamping down the pandemic, evident by to be complacent. The opposite is necessary. Canada must
the decrease in daily cases of daily transmissions from 3046 to remain vigilant and continue implementing those policies that
2715, concurrent with a decrease in the 7-day moving average, caused the Canadian outbreak to reverse course and decrease.
decrease in deaths, and decrease in death rates. Regardless, the In summary, we understand what causes COVID-19 and how
weekly number of new cases remains at 2715 for the week of it is transmitted. We also understand how to control outbreaks.
February 20, 2021. Such a large caseload could quickly escalate Enhanced surveillance is the first indicator that an outbreak is
to a large outbreak if prevention efforts wane. occurring and that immediate action is needed. Conversely,
enhanced surveillance also informs policy makers when policies
put into place to control the COVID-19 pandemic are
successfully decreasing the spread of disease.
Acknowledgments
This study and the resulting surveillance system were funded in part by the Davee Innovations Research Endowment for North
America. Any opinions, findings, conclusions, or recommendations expressed here are those of the authors alone and do not
necessarily reflect the opinions of funders or authors' employers. The opinions expressed in this paper are those of the authors
and do not necessarily represent the opinions of the US Agency for International Development.
Conflicts of Interest
None declared.
Multimedia Appendix 1
Static and novel surveillance metrics for weeks between 1/3/2021-2/6/2021.
[DOCX File , 42 KB-Multimedia Appendix 1]
References
1. Sohrabi C, Alsafi Z, O'Neill N, Khan M, Kerwan A, Al-Jabir A, et al. World Health Organization declares global emergency:
A review of the 2019 novel coronavirus (COVID-19). Int J Surg 2020 Apr;76:71-76 [FREE Full text] [doi:
10.1016/j.ijsu.2020.02.034] [Medline: 32112977]
2. Nicola M, Alsafi Z, Sohrabi C, Kerwan A, Al-Jabir A, Iosifidis C, et al. The socio-economic implications of the coronavirus
pandemic (COVID-19): A review. Int J Surg 2020 Jun;78:185-193 [FREE Full text] [doi: 10.1016/j.ijsu.2020.04.018]
[Medline: 32305533]
3. Pennycook G, McPhetres J, Bago B, Rand DG. Predictors of attitudes and misperceptions about COVID-19 in Canada, the
UK, and the USA. PsyArXiv. Preprint posted online on April 14, 2020.
4. Husain I, Briggs B, Lefebvre C, Cline DM, Stopyra JP, O'Brien MC, et al. Fluctuation of Public Interest in COVID-19 in
the United States: Retrospective Analysis of Google Trends Search Data. JMIR Public Health Surveill 2020 Jul 17;6(3):e19969
[FREE Full text] [doi: 10.2196/19969] [Medline: 32501806]
5. Baniamin HM, Rahman M, Hasan MT. The COVID-19 pandemic: why are some countries coping more successfully than
others? Asia Pacific Journal of Public Administration 2020 Jul 15;42(3):153-169. [doi: 10.1080/23276665.2020.1784769]
6. Wang D, Marmo-Roman S, Krase K, Phanord L. Compliance with preventative measures during the COVID-19 pandemic
in the USA and Canada: Results from an online survey. Soc Work Health Care 2021 Jan 06:1-16. [doi:
10.1080/00981389.2020.1871157] [Medline: 33407057]
7. Agley J, Xiao Y. Misinformation about COVID-19: evidence for differential latent profiles and a strong association with
trust in science. BMC Public Health 2021 Jan 07;21(1):89 [FREE Full text] [doi: 10.1186/s12889-020-10103-x] [Medline:
33413219]
8. Béland D, Marchildon GP, Medrano A, Rocco P. COVID-19, Federalism, and Health Care Financing in Canada, the United
States, and Mexico. Journal of Comparative Policy Analysis: Research and Practice 2021 Jan 07;23(2):143-156. [doi:
10.1080/13876988.2020.1848353]
9. Johns Hopkins University. COVID-19 Dashboard. 2021. URL: https://coronavirus.jhu.edu/map.html [accessed 2021-02-22]
10. Government of Canada. Coronavirus disease (COVID-19): Outbreak update. URL: https://www.canada.ca/en/public-health/
services/diseases/2019-novel-coronavirus-infection.html [accessed 2021-02-22]
11. Neustaeter B. Emerging from coronavirus: Reopening plans province-by-province. CTV News. URL: https://www.ctvnews.ca/
health/coronavirus/emerging-from-coronavirus-reopening-plans-province-by-province-1.4913652 [accessed 2020-08-09]
https://publichealth.jmir.org/2021/5/e25753 JMIR Public Health Surveill 2021 | vol. 7 | iss. 5 | e25753 | p. 9
(page number not for citation purposes)
XSL• FO
RenderXJMIR PUBLIC HEALTH AND SURVEILLANCE Post et al
12. Wise J. Covid-19: Risk of second wave is very real, say researchers. BMJ 2020 Jun 09;369:m2294. [doi: 10.1136/bmj.m2294]
[Medline: 32518177]
13. Nunavut Department of Health. Confirmed case of COVID-19 in Nunavut. 2020 Nov 06. URL: https://gov.nu.ca/
executive-and-intergovernmental-affairs/news/confirmed-case-covid-19-nunavut-0 [accessed 2021-05-05]
14. Ford JD, Berrang-Ford L. Food security in Igloolik, Nunavut: an exploratory study. Polar Record 2009 Jul 01;45(3):225-236.
[doi: 10.1017/s0032247408008048]
15. Orr P. Tuberculosis in Nunavut: looking back, moving forward. CMAJ 2013 Mar 05;185(4):287-288 [FREE Full text] [doi:
10.1503/cmaj.121536] [Medline: 23382256]
16. Boyd A, Ferguson R, McKeen A, McKinley S. How each province and territory has shaped Canada's fight against the
coronavirus. 2020 Apr 13. URL: https://www.thestar.com/news/canada/2020/04/11/
how-each-province-and-territory-has-shaped-canadas-fight-against-the-coronavirus.html [accessed 2020-08-09]
17. Webster P. Canada and COVID-19: learning from SARS. The Lancet 2020 Mar;395(10228):936-937. [doi:
10.1016/s0140-6736(20)30670-x]
18. Merkley E, Bridgman A, Loewen PJ, Owen T, Ruths D, Zhilin O. A Rare Moment of Cross-Partisan Consensus: Elite and
Public Response to the COVID-19 Pandemic in Canada. Can J Pol Sci 2020 Apr 16;53(2):311-318. [doi:
10.1017/S0008423920000311]
19. Turnbull S. COVID-19 in Canada: This is how each province is handling the pandemic. CTV News. 2020. URL: https:/
/www.ctvnews.ca/politics/covid-19-in-canada-this-is-how-each-province-is-handling-the-pandemic-1.4867626 [accessed
2021-05-05]
20. Lyu W, Wehby GL. Community Use Of Face Masks And COVID-19: Evidence From A Natural Experiment Of State
Mandates In The US. Health Aff (Millwood) 2020 Aug 01;39(8):1419-1425. [doi: 10.1377/hlthaff.2020.00818] [Medline:
32543923]
21. Maxouris C. Half of US states are reporting increased Covid-19 cases and some leaders push new measures. CNN. 2020
Oct 07. URL: https://www.cnn.com/2020/10/07/health/us-coronavirus-wednesday/index.html [accessed 2021-05-05]
22. Guzman J. Fauci says new coronavirus actions by Florida governor are 'very concerning'. The Hill. 2020 Sep 28. URL:
https://thehill.com/changing-america/well-being/prevention-cures/518577-fauci-says-new-coronavirus-actions-by-florida
[accessed 2021-05-05]
23. Eggert D, White E. Michigan Governor's Virus Powers Upended With Court Ruling. US News. 2020 Oct 02. URL: https:/
/www.usnews.com/news/best-states/michigan/articles/2020-10-02/
539k-signatures-submitted-to-repeal-whitmer-emergency-powers [accessed 2021-05-05]
24. Beauchamp Z. Canada succeeded on coronavirus where America failed. Why? Vox. 2020 May 04. URL: https://www.
vox.com/2020/5/4/21242750/coronavirus-covid-19-united-states-canada-trump-trudeau [accessed 2020-08-05]
25. Fong BYF, Law VTS. COVID-19 – A Tale of Two Cities: Seattle and Vancouver. APJHM 2020 Jul 26;15(3):39-44. [doi:
10.24083/apjhm.v15i3.455]
26. Van Bavel JJ, Baicker K, Boggio PS, Capraro V, Cichocka A, Cikara M, et al. Using social and behavioural science to
support COVID-19 pandemic response. Nat Hum Behav 2020 May;4(5):460-471. [doi: 10.1038/s41562-020-0884-z]
[Medline: 32355299]
27. CoronaTracker. URL: https://www.coronatracker.com/about [accessed 2020-08-16]
28. Ministry of Health of Ukraine. Ukraine COVID Dashboard. URL: https://covid19.gov.ua/ [accessed 2020-08-16]
29. Busquets Guàrdia A, Pawelec H, Hirsch C. Coronavirus in Europe: Live Data Tracker. Politico. 2020 Mar 13. URL: https:/
/www.politico.eu/article/coronavirus-in-europe-by-the-numbers/ [accessed 2020-08-16]
30. Coronavirus Pandemic: Tracking the Global Outbreak. BBC News. URL: https://www.bbc.com/news/world-51235105
[accessed 2020-08-16]
31. Coronavirus tracker: the latest figures as countries fight the Covid-19 resurgence. Financial Times. URL: https://www.
ft.com/content/a2901ce8-5eb7-4633-b89c-cbdf5b386938 [accessed 2020-08-16]
32. Coronavirus Disease 2019 (COVID-19) - Situation Report of the Robert Koch Institute. Robert Koch Institute. URL: https:/
/www.rki.de/EN/Content/infections/epidemiology/outbreaks/COVID-19/Situationsberichte_Tab.html [accessed 2021-05-05]
33. Italian Ministry of Health. New coronavirus. URL: http://www.salute.gov.it/portale/nuovocoronavirus/
homeNuovoCoronavirus.jsp [accessed 2021-05-05]
34. Government of Spain Ministry of Health. Current situation. URL: https://www.mscbs.gob.es/en/profesionales/saludPublica/
ccayes/alertasActual/nCov-China/situacionActual.htm [accessed 2020-08-16]
35. European Centre for Disease Prevention and Control. COVID-19 Country Overviews. URL: https:/
/covid19-country-overviews.ecdc.europa.eu/ [accessed 2020-08-03]
36. Government of the United Kingdom. Coronavirus (COVID-19) in the UK. 2020. URL: https://coronavirus.data.gov.uk/
[accessed 2020-08-16]
37. Teutsch SM. Considerations in Planning a Surveillance System. In: Lee LM, Teutsch SM, Thacker SB, St. Louis ME,
editors. Principles & Practice of Public Health Surveillance. Oxford, UK: Oxford University Press; 2010:18.
38. Thacker SB, Berkelman RL. Public health surveillance in the United States. Epidemiol Rev 1988;10:164-190. [doi:
10.1093/oxfordjournals.epirev.a036021] [Medline: 3066626]
https://publichealth.jmir.org/2021/5/e25753 JMIR Public Health Surveill 2021 | vol. 7 | iss. 5 | e25753 | p. 10
(page number not for citation purposes)
XSL• FO
RenderXJMIR PUBLIC HEALTH AND SURVEILLANCE Post et al
39. Oehmke JF, Moss CB, Singh LN, Oehmke TB, Post LA. Dynamic Panel Surveillance of COVID-19 Transmission in the
United States to Inform Health Policy: Observational Statistical Study. J Med Internet Res 2020 Oct 5;22(10):e21955. [doi:
10.2196/21955]
40. Oehmke JF, Oehmke TB, Singh LN, Post LA. Dynamic Panel Estimate-Based Health Surveillance of SARS-CoV-2 Infection
Rates to Inform Public Health Policy: Model Development and Validation. J Med Internet Res 2020 Sep 22;22(9):e20924
[FREE Full text] [doi: 10.2196/20924] [Medline: 32915762]
41. Oehmke JF, Moss CB, Singh LN, Oehmke TB, Post LA. Dynamic Panel Surveillance of COVID-19 Transmission in the
United States to Inform Health Policy: Observational Statistical Study. J Med Internet Res 2020 Oct 5;22(10):e21955. [doi:
10.2196/21955]
42. Post LA, Issa TZ, Boctor MJ, Moss CB, Murphy RL, Ison MG, et al. Dynamic Public Health Surveillance to Track and
Mitigate the US COVID-19 Epidemic: Longitudinal Trend Analysis Study. J Med Internet Res 2020 Dec 03;22(12):e24286
[FREE Full text] [doi: 10.2196/24286] [Medline: 33216726]
43. Post L, Marogi E, Moss CB, Murphy RL, Ison MG, Achenbach CJ, et al. SARS-CoV-2 Surveillance in the Middle East
and North Africa: Longitudinal Trend Analysis. J Med Internet Res 2021 Jan 15;23(1):e25830 [FREE Full text] [doi:
10.2196/25830] [Medline: 33302252]
44. Government of Canada. Interactive data visualizations of COVID-19. Public Health Infobase. URL: https://health-infobase.
canada.ca/covid-19/ [accessed 2021-02-22]
45. Hansen LP. Large Sample Properties of Generalized Method of Moments Estimators. Econometrica 1982 Jul;50(4):1029.
[doi: 10.2307/1912775]
46. The Global SARS-CoV-2 Surveillance Project. Northwestern University. URL: https://sites.northwestern.edu/
covidglobalsurveillance/ [accessed 2021-05-06]
Abbreviations
GMM: generalized method of moments
SARS: severe acute respiratory syndrome
Edited by G Eysenbach; submitted 13.11.20; peer-reviewed by B Dixon; comments to author 04.12.20; revised version received
25.02.21; accepted 09.04.21; published 10.05.21
Please cite as:
Post L, Boctor MJ, Issa TZ, Moss CB, Murphy RL, Achenbach CJ, Ison MG, Resnick D, Singh L, White J, Welch SB, Oehmke JF
SARS-CoV-2 Surveillance System in Canada: Longitudinal Trend Analysis
JMIR Public Health Surveill 2021;7(5):e25753
URL: https://publichealth.jmir.org/2021/5/e25753
doi: 10.2196/25753
PMID: 33852410
©Lori Post, Michael J Boctor, Tariq Z Issa, Charles B Moss, Robert Leo Murphy, Chad J Achenbach, Michael G Ison, Danielle
Resnick, Lauren Singh, Janine White, Sarah B Welch, James F Oehmke. Originally published in JMIR Public Health and
Surveillance (https://publichealth.jmir.org), 10.05.2021. This is an open-access article distributed under the terms of the Creative
Commons Attribution License (https://creativecommons.org/licenses/by/4.0/), which permits unrestricted use, distribution, and
reproduction in any medium, provided the original work, first published in JMIR Public Health and Surveillance, is properly
cited. The complete bibliographic information, a link to the original publication on https://publichealth.jmir.org, as well as this
copyright and license information must be included.
https://publichealth.jmir.org/2021/5/e25753 JMIR Public Health Surveill 2021 | vol. 7 | iss. 5 | e25753 | p. 11
(page number not for citation purposes)
XSL• FO
RenderXYou can also read