CECONOMY AG "Equity Story" - Investor Presentation, January 2018
←
→
Page content transcription
If your browser does not render page correctly, please read the page content below
CECONOMY AG
“Equity Story“

Investor Presentation,
January 2018
DISCLAIMER                                                                (segmental or other) information in the consolidated financial
                                                                          statements of the former METRO Group and, thus, may not be
                                                                          fully comparable to such financial statements. Historical
                                                                                                                                                our business, results of operations, financial position or cash
                                                                                                                                                flows. There are, however, material limitations associated with
                                                                                                                                                the use of non-IFRS measures including (without limitation) the

AND NOTES
                                                                          information contained in this presentation which is not taken or      limitations inherent in the determination of relevant adjustments.
                                                                          derived from the unaudited combined financial statements is           The non-IFRS measures used by us may differ from, and not be
                                                                          mostly based on or derived from the consolidated (interim)            comparable to, similarly-titled measures used by other
                                                                          financial statements for the respective period. Financial             companies.
                                                                          information with respect to the business of MediaMarktSaturn
                                                                          Retail Group is particularly based on or derived from the segment     To the extent that statements in this presentation do not relate to
                                                                          reporting contained in these financial statements. In addition, the   historical or current facts they constitute forward-looking
BY ACCESSING THIS PRESENTATION YOU AGREE TO THE                           historical financial and operative information included in this       statements. All forward-looking statements herein are based on
FOLLOWING RESTRICTIONS                                                    presentation is not necessarily indicative for the operational        certain estimates, expectations and assumptions at the time of
                                                                          results, the financial position and/or the cash flow of the           publication of this presentation and there can be no assurance
This document and the presentation to which it relates is
                                                                          CECONOMY business on a stand-alone basis neither in the past          that these estimates, expectations and assumptions are or will
intended for information only, does not constitute a prospectus
                                                                          nor in the future and may, in particular, deviate from any            prove to be accurate. Furthermore, the forward-looking
or similar document and should not be treated as investment
                                                                          historical financial information based on corresponding combined      statements are subject to risks and uncertainties including
advice. It is not intended and should not be construed as an offer
                                                                          financial statements with respect to the CECONOMY business.           (without limitation) future market and economic conditions, the
for sale, or as a solicitation of an offer to purchase or subscribe to,
                                                                          Given the aforementioned uncertainties, readers are cautioned         behaviour of other market participants, investments in innovative
any securities in any jurisdiction. Neither this presentation nor
                                                                          not to place undue reliance on any of this information. No            sales formats, expansion in online and multichannel sales
anything contained therein shall form the basis of, or be relied
                                                                          representation or warranty is given and no liability is assumed by    activities, integration of acquired businesses and achievement of
upon in connection with, any commitment or contract
                                                                          CECONOMY, express or implied, as to the accuracy, correctness or      anticipated cost savings and productivity gains, and the actions of
whatsoever. This presentation may not, at any time, be
                                                                          completeness of the information contained in this presentation.       public authorities and other third parties, many of which are
reproduced, distributed or published (in whole or in part) without
                                                                          All numbers shown are before special items, unless otherwise          beyond our control, that could cause actual results, performance
prior written consent of CECONOMY AG (“CECONOMY”).
                                                                          stated. All amounts are stated in million euros (€ million) unless    or financial position to differ materially from any future results,
                                                                          otherwise indicated. Amounts below €0.5 million are rounded           performance or financial position expressed or implied in this
Historical financial or operative information contained in this
                                                                          and reported as 0. Rounding differences may occur.                    presentation. Accordingly, no representation or warranty (express
presentation, if not taken or derived from our accounting records
                                                                                                                                                or implied) is given that such forward-looking statements,
or our management reporting or unless otherwise stated, is taken
                                                                          This presentation contains certain supplemental financial or          including the underlying estimates, expectations and
or derived from the unaudited combined financial statements of
                                                                          operative measures that are not calculated in accordance with         assumptions, are correct or complete. Readers are cautioned not
CECONOMY for the respective period and not from the
                                                                          IFRS and are therefore considered as non-IFRS measures.               to place reliance on these forward-looking statements.
consolidated (interim) financial statements of the former METRO
                                                                          We believe that such non-IFRS measures used, when considered
Group. The combined financial statements of CECONOMY have
                                                                          in conjunction with (but not in lieu of) other measures that are
not been audited and may also deviate substantially from
                                                                          computed in accordance with IFRS, enhance the understanding of

                                     Investor Presentation                                                                                      Public                             January 2018                // 2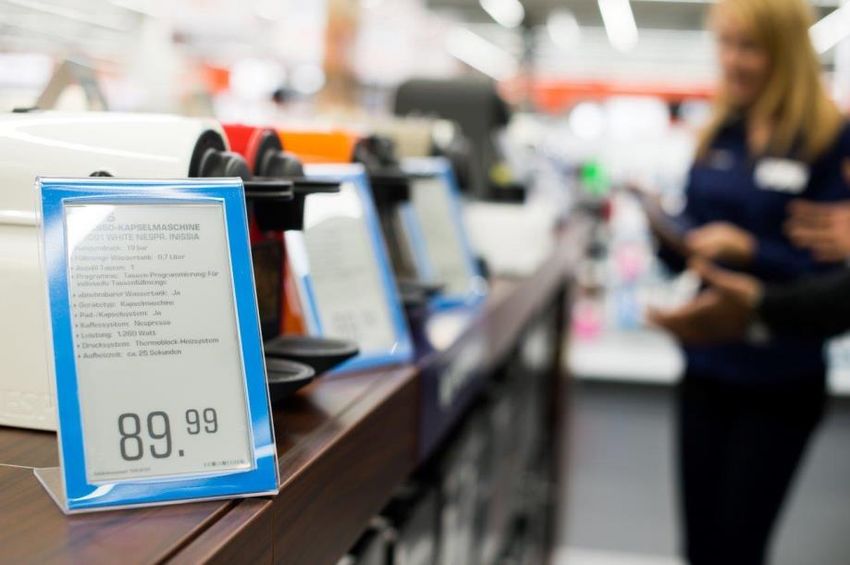
Disclaimer and Notes (cont’d)
We do not undertake any obligation to publicly update any               CECONOMY operates, in part, in industries and channels for             information. Neither we nor any third party shall be responsible
forward-looking statements or to conform them to events or              which it is difficult to obtain precise market data. Such market       for any loss or damage arising out of your or our use or reliance
circumstances after the date of this presentation.                      data should therefore be considered with caution and not be            upon the information contained herein, or for actions of and
This presentation contains forecasts, statistics, data and other        solely relied on as market studies are often based on information      decisions taken by us, you or any third parties that receive this
information relating to markets, market sizes, market shares,           and assumptions that may be inaccurate or inappropriate, and           information. Neither we nor any third party give any
market positions and other industry data on the Company’s               their methodology is inherently predictive and speculative. We         representations as to the accuracy of the market data included in
business and markets (together the “market data”) provided by           have no reason to believe that such information is false or            this presentation. The third parties whose data is cited in this
third party sources as interpreted by us. This market data is, in       misleading or that any material fact has been omitted that would       presentation are neither registered broker-dealers nor financial
part, derived from published research and additional market             render such information false or misleading. Our own estimates         advisors and the permitted use of any market research data does
studies prepared primarily as a research tool and reflects              have not been checked or verified externally. They may differ          not constitute financial advice or recommendations.
estimates of market conditions based on research methodologies          from estimates made by competitors of our group or from future
including primary research, secondary sources and econometric           studies conducted by market research institutes or other
modelling. We want to point out that part of the market data            independent sources. Information prepared by third parties has
used has been collected in the framework of a market survey             not been independently verified by us or any other party.
carried out as a panel observation. The panel is a regular survey
monitoring sales of specific products and product categories,           Therefore you acknowledge that the market data presented is
using a range of distribution channels including internet, retail       based on statistical methods and extrapolation and so due to the
outlets (e.g. high street, mail order) and companies (e.g.              nature of such data no guarantee for completeness and accuracy
resellers). The market data does not represent actual sales figures     can be given by us or any third party. Neither we nor any third
globally or in any given country; rather, the market data               party, including those third parties whose data is cited in this
represents a statistical projection of sales in a given territory and   presentation, warrant that the data collected, processed and
is subject to the limitations of statistical error and adjustments at   analysed by it in accordance with the rules and methods of
any time (e.g. reworks, changes in panel structure). The                market and social research, will be able to be used by in a specific
representativeness of the market data may be impacted by                way, in particular not in the legal sense of an expert report. It
factors such as product categorisation, channel distribution and        should be noted that all liability for completeness and correctness
supplier universe identification and statistical sampling and           of the information provided by us or any third party is explicitly
extrapolation methodologies. The market data presented is based         excluded. Under no circumstance shall a third party whose data is
on statistical methods and extrapolation.                               cited in this presentation be liable for damages incurred through
                                                                        or in connection with your or our interpretation of the provided

                                    Investor Presentation                                                                                      Public                            January 2018               // 3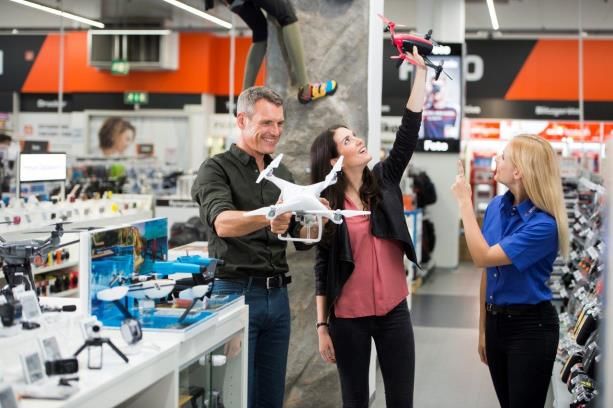
CECONOMY at a glance: Europe’s largest CE platform

CECONOMY acts as a platform that brings together various businesses, concepts, formats and brands active in the
area of Consumer Electronics. All these activities are based on a customer community monetisation business model.

     We are the
                                                                  22.2          bn € sales       2.4      bn € online sales
     No. 1
                    in Europe                                     704          m € EBITDA        1.4           services &
                                                                                                          bn € solutions sales

     65,000
                                                                  Present in
                                                                                                 6.2      m

     employees across
     Europe
                                                                  15      countries
                                                                                                      daily
                                                                                                      customer contacts

Note: All figures before special items and based on FY 2016/17.

                                       Investor Presentation                                 Public               January 2018   // 4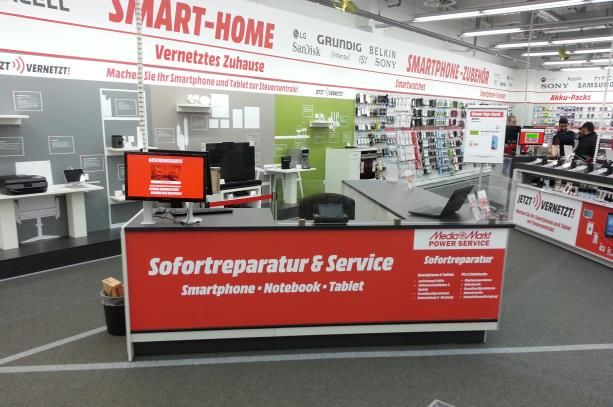
Why invest in CECONOMY?

#1                            #2                #3                  #4

CECONOMY LEADS                CECONOMY IS THE   CECONOMY HAS A      CECONOMY HAS
THE                           LEADER IN         STRONG              THE POTENTIAL TO
CONSOLIDATION                 MULTI-CHANNEL     FINANCIAL           INCREASE
AND                           AND SCALE         PROFILE             MARGINS AND
TRANSFORMATION                                                      FREE CASH FLOW
IN A DYNAMIC                                                        GENERATION
RETAIL CATEGORY

            Investor Presentation                          Public         January 2018   // 5
//
CECONOMY Strategy

                    January 2018   // 6
The largest Consumer Electronics Player in Europe                                                                                                                          FACT BOX
with #1 positions in 9 countries                                                                                                                                           Market shares

                                                                                                                                                                                                  13.4%              13.5%
                                                                                                                                                                                13.2%

                                                                                                            Sweden                          Russia
                                                                                                                                                                                14/15             15/16              16/17
                                                                           The Netherlands
                                                                                                             27                              57
DIVERSIFIED EXPOSURE                                                          Belgium
WITH 1,053 STORES &
WEBSHOPS ACROSS 15                                                                          49   Germany          Poland

COUNTRIES IN EUROPE                                                                    28         429              86
                                                                                             2
                                                                                            27              50 24                                                                    CECONOMY is
                                                                                                                                                                                     leading in Europe at
                                                                     Spain                          Italy
                                                     Portugal
                                                                                                                                                                                     an all-time high
                                                        10            83                            116                                                                              market share
                                                                                                                                                Turkey
                                                                             Luxembourg                                    Greece
                                                                                                                                                53
       #1 market position of CECONOMY
                                                                                                                            12
       Other market position of CECONOMY                                           Switzerland
                                                                                                               Hungary
       # of stores                                                                                  Austria
Source: Overview of store network (FY 16/17); Own CECONOMY analysis based on market research data by GfK. Panel data for consumer electronics based on retail panel as of September 2016 (for total market share September 2017).

                                      Investor Presentation                                                                                               Public                                 January 2018                  // 7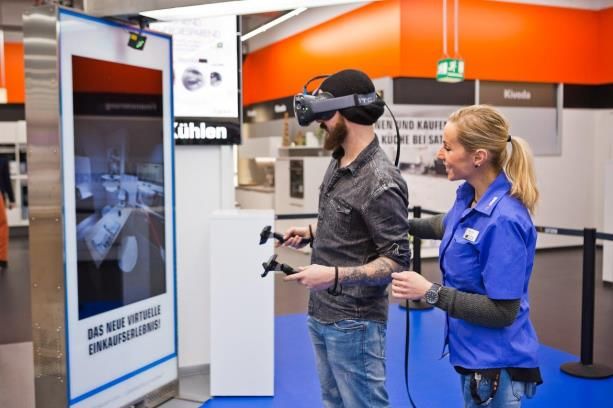
One of the leading multi-channel players in Europe

                                    Online Sales (in € million)               Pick-up rate (in % of online orders)
                                                                   2,407                           42%               42%
                                                                                        40%
                                                        1,952
                                        1,766

                                       FY 14/15       FY 15/16    FY 16/17            FY 14/15   FY 15/16        FY 16/17

                                    Online Sales Share (in %)                 Online Visitors (in million)
                                                                                                                     1,318
                                                                   10.9%                          1,193
                                                        8.9%                           1,013
                                         8.1%

                                       FY 14/15       FY 15/16    FY 16/17            FY 14/15   FY 15/16        FY 16/17

            Investor Presentation                                            Public                   January 2018           // 8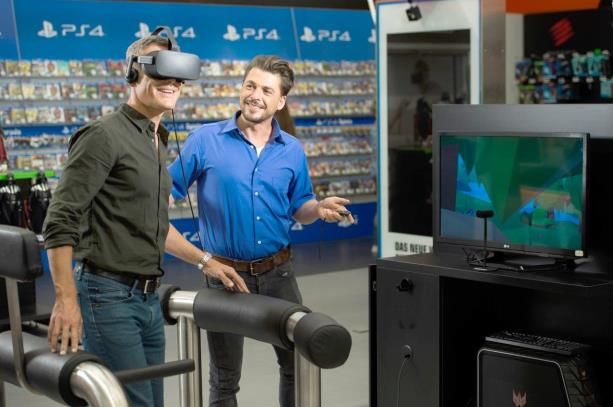
We are multi-channel

                                            30% of all store visitors
                                                       have initially
                                                         visited our
                                                           webshop      Full multi-channel customer
                                                                        journey leads to a
  More than 50% of                                                      conversion rate >20%
  online purchases
  started in one of our stores

                                                                                                There is a 60% higher
                                                                                                likelihood of selling a
  63% of our web shop                                                                                   product if the
  visitors use our mobile site,                                                                  customer visited our
  tablet or app versions to browse                                                                    webshop before
  for products

                    Investor Presentation                                      Public                  January 2018       // 9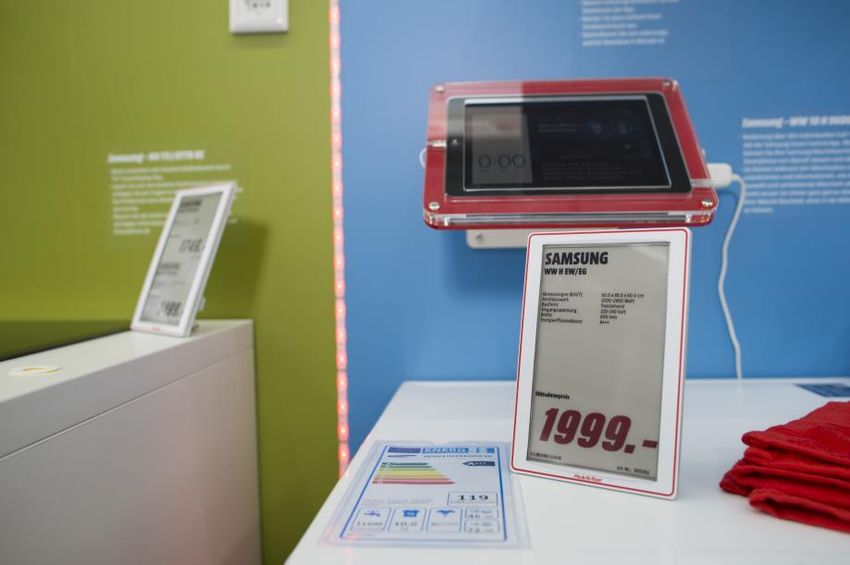
Multi-channel is the winning model

 Where do German consumers buy CE products?
 Sales share in Germany (in %)

             5%                     6%                   7%            8%      10%    11%

            16%                    17%                  17%
                                                                      17%      17%    17%
                                                                                                      Multi-channel offering
                                                                                                      with increasing relevance
                                                                                                      for consumers
            78%                    77%                  76%           74%      73%

                                                                                      72%

           2011                   2012                 2013           2014     2015   2016
        Online business of brick&mortar retailers
        Online Pure Player
        Brick&mortar shops - convenience & specialised (w/o online business)

Source: GFK Handelspanel in BVT Fakten 2017.

                                     Investor Presentation                                   Public               January 2018   // 10
The store network is an asset again and integral part of CECONOMY’s
multi-channel and services strategy
Advantages of
CECONOMY’s strong
physical presence
// Offering customers tangible
product experiences
// Showroom for exclusive and
high-end products offering
suppliers visibility of brands
// Instant in-store repairs of
mobile devices
// Personal contact and
personalised customer service
// Delivery hubs & pick-up
places/return points for online
orders
Investor Presentation Public January 2018 // 11CECONOMY offers the full CE assortment, reflecting a truly
“connected world”
Other2
Product Category Entertainment Computer Hardware1
Breakdown FY 16/17
6% & Accessories
10% 21%
Telecommunications
19%
22% Brown Goods
White Goods
22%
1 Telecommunication devices such as iPads without SIM card included; 2 Includes in essence Photo & Office equipment.
Investor Presentation Public January 2018 // 12CECONOMY is highly relevant to its suppliers and a strategic partner
of choice
Sales Share in % (CECONOMY FY 16/17) CECONOMY Supplier CECONOMY’s Weight at Vendor / Supplier1 (FY16/17)
20% Supplier 1 18%
11% Supplier 2 13%
Read: CECONOMY 6% Supplier 3 29%
generates 20 % of its sales
with “Supplier 1” products
4% Supplier 4 16%
3% Supplier 5 22%
3% Supplier 6 16%
Read: 26 % of “Supplier 10”
sales in the CECONOMY
3% Supplier 7 14%
geographic footprint comes
through via CECONOMY
2% Supplier 8 15%
2% Supplier 9 21%
2% Supplier 10 26%
Source: Key figures TOP 10 Manufacturers (own CECONOMY analysis based on GFK), total in retail (excl. entertainment) FY16/17. 1 Within CECONOMY’s geographic footprint.
Investor Presentation Public January 2018 // 13We are solutions: a full range of Services & Solutions FACT BOX
Services & Solutions Sales
along the customer journey (in € million)
1,301 1,379
994
(Pre-)Buy Set-up & Use Repair
14/15 15/16 16/17
Consumer credit and Personalised products Refurbishment
leasing Customer advisory & In-warranty repairs
Insurance training Repairs not covered by FACT BOX
Extended warranties Delivery insurance or warranty % of sales (FY 16/17)
Care plans Set-up & installation Asset recovery and
@home advice Digital content recycling Services & 6%
Solutions
Products
Energy contracts
3rd party services as Connectivity contracts 94%
add-ons to core products Digital content
Investor Presentation Public January 2018 // 14We are customer-centric: >14.5 million loyal members in our customer
programmes
>14.5m 25%
members in our customer programmes of all sales in Germany are generated by
across all countries German MediaMarkt Club members
3.8m
customer program members in
>600k
Saturn Card holders in just 4 months
Germany after nation-wide roll-out
*Base: September 2017.
Investor Presentation Public January 2018 // 15//
CECONOMY FY 2016/17
January 2018 // 16CECONOMY achieved all targets in FY 2016/17
FY 2015/16 Outlook FY 2016/17 Achieved
(fx-adjusted) (fx-adjusted)
€m
1
Salessales
Total 21,870 Slight increase +1.4% ✓
LfL sales growth +0.1% Slight increase +1.9% ✓
EBIT before special items 466 Slight increase +10 ✓
Investments 1 406 300 – 350 319 ✓
Pay-out ratio (in % of EPS) n.a. 45 – 55% 45% ✓
1 Investments according to the segment report.
Investor Presentation Public January 2018 // 17CECONOMY delivered solid sales growth, a slight increase in EBIT and an
improvement in NWC
(€m) (€m) (€m)
+1.3% -15 +6 +277
22,155 719 466 471 52
21,870 704
-225
FY 15/16 FY 16/17 FY 15/16 FY 16/17 FY 15/16 FY 16/17 FY 15/16 FY 16/17
Sales EBITDA EBIT Change in Net Working Capital (NWC)
// Total sales increased by +1.3% to €22.2bn // EBIT increased by €+6m (€+10m fx-adjusted) // NWC improved by €52m
(+1.4% fx-adjusted) // Gross margin improved by +0.2%p. to 20.6% // Improvement in trade payables more than
// Germany, Spain & Turkey led sales growth // Rising operational EBITDA offset by planned offset rise in inventories and receivables
// Lower sales in Russia & Switzerland lower pension income and additional costs to // Free Cash Flow (FCF), adjusted for Fnac
// Online was the key growth driver and build the CECONOMY holding Darty acquisition, loans repayment & tax
increased +40%1 yoy // Lower D&A due to c. €20m higher refund, improved by around €420m
// Services & Solutions sales up +6% yoy unscheduled write-downs in previous year
Note: NWC = Net Working Capital acc. to Cash Flow Statement. 1 +23% yoy growth including pure player.
Investor Presentation Public January 2018 // 18Improved sales growth rates, primarily driven by DACH region
Total and LfL Sales Development (yoy change) Total LfL Highlights
5.8% 1.9%
4.6%
1.3% // Strong sales growth in Q4 2016/17, supported by a
favourable comparison base and investments to
0.6% strengthen our position in selected markets
-1.0% 0.1%
-2.0% // Sales also supported by new product launches in the
FY 15/16 FY 16/17 mobile phone and entertainment segment
Q4 15/16 Q4 16/17
// Strong sales growth particularly in Germany and first
Total sales growth in Q4 16/17 by segment (yoy change) signs of recovery in Switzerland in Q4 2016/17
7.2% 6.3% // Spain, Italy and the Netherlands led in terms of sales
growth in Western & Southern Europe in Q4 2016/17
// Further sales decline in Russia, offset by continued
-2.9% sales growth in Turkey on an fx-adjusted basis
-26.4% // Lower ‘Others’ mainly driven by the closure of
DACH W. & S. Europe E. Europe Others redcoon country operations
Investor Presentation Public January 2018 // 19Online was the key growth driver and represented 11% of total sales
Online Sales (in €m) Highlights
+21% +23%
565 2,407
466 1,952 // Online generated sales of MediaMarkt and Saturn
grew by +39% in Q4 2016/17 or +21% including pure
player (e.g. redcoon), respectively
// Online now represents 10.9% of total sales vs. 8.9%
one year ago
Q4 15/16 Q4 16/17 FY 15/16 FY 16/17
// Pick-up rate slightly higher at 44% in Q4; for the full-
Online Sales (% of total sales) year, pick-up rate remained high at 42%
10.7% 10.9%
9.3% // Online assortment further expanded to c. 350k SKUs
8.9%
from c. 280k SKUs one year ago
// Daily website visits1 increased by +0.4m to 3.6m daily
website visits in FY 2016/17
Q4 15/16 Q4 16/17 FY 15/16 FY 16/17
1 Online incl. pure player visits per day based on 365 days per year.
Investor Presentation Public January 2018 // 20Rising demand for Services & Solutions, accounting for 6.2% of total sales
Services & Solutions Sales (in €m) Highlights
+16% +6%
395 1,301 1,379
340 // Services & Solutions sales increased +16% year-on-
year in Q4 2016/17, largely driven by mobile and
financing services
// Over the last 12 months, Services & Solutions were up
+6%, accounting for 6.2% of total sales vs. 6.0% one
Q4 15/16 Q4 16/17 FY 15/16 FY 16/17
year ago
Services & Solutions Sales (% of total sales) // Continued roll-out of service “smart bars” to now 642
7.5% 6.2% stores (+77 stores in Q4 2016/17)
6.8% 6.0%
// At home consultation and installation service of
Deutsche Technikberatung (DTB) now already offered
at more than 200 stores in Germany
Q4 15/16 Q4 16/17 FY 15/16 FY 16/17
Investor Presentation Public January 2018 // 21MediaMarkt Club and Saturn Card continue to grow strongly
Customer Programme Members MM Club Saturn Card*
Highlights
Germany (in k) +777
+662
+553 3,805
+578 3,028 // Linear growth of MediaMarkt Club Germany continues
2,366 with around 1m new members every 6 months, now
1,813 3,196
1,235 2,763 counting 3.2m members 18 months after launch
1,781 2,301
32 65 265 609 // Successful launch of Saturn Card in Germany with
more than 600k members after 4 months; Austria
Sept ’16 Dec ’16 Mar ’17 Jun ’17 Sept ’17
launched the Saturn Card in September
Sales Penetration MediaMarkt Club Germany // All customer programmes counted more than 14.5m
25% 25% members in total internationally
23%
18% // Our customer programmes also allowed us to focus
16% our advertising budget, which helped to lower
marketing spend in FY 2016/17
Q4 15/16 Q1 16/17 Q2 16/17 Q3 16/17 Q4 16/17
*Nov 16-Apr 17: Saturn Card pilot running with 14 pilot stores; nation-wide roll-out of Saturn Card on 29 May 2017.
Investor Presentation Public January 2018 // 22Continued reduction in average store size
Number of stores 9M 16/17 Q4 16/17
Highlights
+40 -9
1,053
27 // Selective store expansion continued with 13 openings
1,023 -1
13
-10 and 1 closure in Q4 2016/17
// Average store size further reduced by -3.4% over the
last 12 months to now 2,811sqm due to openings of
smaller formats and store rightsizings
Sept ’16 Openings Closures Sept ’17
// Low to mid double-digit number of net openings in
Average size of stores (in sqm) FY 2017/18 planned, excluding Shop-in-Shop solutions
-3.4%
// 84 additional Shop-in-Shop solutions in Russian
2,909 2,811 METRO Cash & Carry stores opened in October and
c. 2,140 November 2017; in total, 89 Shop-in-Shop solutions
c. 1,600 now live in Russia
Sept ’16 Openings Closures Sept ’17
Investor Presentation Public January 2018 // 23Solid increase in profitability in Q4 2016/17
EBITDA & EBIT (in €m) EBITDA EBIT Highlights
+14 +37
288 302 244
207 // Substantial improvement in gross margin of +0.8%p. to
22.6% in Q4 2016/17
// Considerable earnings uplift in Germany supported by
additional later income
Q4 15/16 Q4 16/17 Q4 15/16 Q4 16/17 // Positive development in the Netherlands helped by
sales and margin improvements, but not sufficient to
Segment EBITDA (in €m) Q4 15/16 Q4 16/17 compensate lower earnings in Italy
201 // Improvements in Eastern Europe mainly driven by
173
stabilisation in Russia
90 76 // Decline in ‘Others’ due to planned lower pension
15 27 income and additional expenses for the formation of a
9
listed holding company
-2
DACH W. & S. Europe E. Europe Others
Note: All figures before special items with the exception of sales and gross profit.
Investor Presentation Public January 2018 // 24Rising operational EBITDA offset by planned lower pension income and
additional expenses for the formation of a listed holding company
EBITDA & EBIT (in €m)
Includes c. €20m
higher unscheduled
719 704 write-downs 719 704
Pension income 35 18
D&A 253 233
Operational 718
705 +12
EBITDA
Rising operational EBIT 466 +6 471
EBITDA offset by
planned lower
pension income &
additional HQ costs
-21 -32
HQ costs
2015/16 2016/17 2015/16 2016/17
EBITDA D&A and EBIT
Investor Presentation Public January 2018 // 25Significant improvement in EPS
€m FY 15/16 FY 16/17 Change
EBITDA 719 704 -15
Highlights
margin (%) 3.3% 3.2% -0.1%p.
EBIT 466 471 +6 Minor decline in net financial result due to unscheduled
margin (%) 2.1% 2.1% 0.0%p. impairment on financial assets, while interest expenses
Net financial result -22 -26 -4 were slightly reduced
Earnings before taxes 444 446 +2
Income taxes reduced by €20m, mainly driven by lower
Income taxes -217 -197 -20
actual taxes outside of Germany
Tax rate (in %) 48.8% 44.1% -4.7%p.
Profit or loss for the period 227 249 +22
Higher minorities in previous year due to one-off
Non-controlling interest 75 60 -15
restructuring effects; this year’s minorities impacted by
Net income 152 189 +37 shifts in entities’ profit contributions
Number of shares (m) 326.8 326.8 0.0%
EPS from cont. operations (€) 0.47 0.58 +0.11
As a result, EPS improved strongly by €+0.11 to €0.58
Dividend proposal (€ per ord. sh.) n.a. 0.26 n.a. Dividend proposal of €0.26 per ordinary share, equivalent
Pay-out ratio (in % of EPS) n.a. 45% n.a. to a pay-out ratio of 45%
Investor Presentation Public January 2018 // 26Underlying Free Cash Flow improved by around €420m
FY 2016/17: Free Cash Flow (in €m) Fnac Darty Highlights
597 52 acquisition
31 521
-160 // Free Cash Flow adjusted for loans repayment granted
-458 182
Incl. c. €20m
higher tax to METRO support fund, acquisition of Fnac Darty
refund stake and tax refund improved by c. €420m
-319
-777 -256 // NWC improvement driven by strong rise in payables,
Rep. which more than compensated higher inventories and
EBITDA Δ NWC Tax Other OCF CAPEX* FCF Adj. FCF
receivables
FY 2015/16: Free Cash Flow (in €m) // Lower cash tax payments due to lower actual taxes
619 and a c. €20m higher tax refund
183 378 // Other OCF in previous year positively impacted by
-225 €220m one-off loans repayment
-199
Includes €220m
// Excluding the acquisition of the Fnac Darty stake,
-398 -20
one-off loans CAPEX decreased by €79m, mainly due to absence of
repayment -240
Rep. previous year’s investments in Digital Shelf Labels
EBITDA Δ NWC Tax Other OCF CAPEX* FCF Adj. FCF
Note: Reported EBITDA. * CAPEX = Acquisitions, investments in property, plant and equipment and other investments as per cash flow statement.
Investor Presentation Public January 2018 // 27//
CECONOMY Targets,
Value Drivers & Enablers
January 2018 // 28CECONOMY is well progressing in the different change phases in the
Consumer Electronics space
Rationalisation
Active management of country, brand and store portfolio, competitive cost base
Digitalisation
Digitalisation has changed customer behaviour, impacted retail processes and has created
new business models
Consolidation
Fragmented market that still offers room for consolidation locally, nationally and
internationally
Transformation
Business models that focus on the ultimate question: we have a customer, what can we do for
her/him?
CECONOMY today
Investor Presentation Public January 2018 // 29CECONOMY’s plans show a clear and strong value creation potential
#1 #2 #4 #5 Category
Value
#3
Online, Services & Customer Selective
driver
Management,
Mobile, Solutions Data / CRM Expansion Pricing, Supply
Store Chain
Enabler
#6 #7 #8
Portfolio Competitive Cost Base Net Working Capital
#9 Digital & Technology Leadership
#10 People Transformation
Investor Presentation Public January 2018 // 30What we plan to do in FY 2017/18
Further develop
Leader of consolidation
store/online/mobile
in the European CE sector
experience
Roll-out service
Improve performance in
“smartbars” and
Russia and Sweden
“@ home services”
Milestones
in FY 2017/18
Introduce multi-level Reach more than
logistics concepts (cross- 2 million new members
docking, regional hubs) in customer programmes
Implement category Further roll-out Shop-in-
management framework Shop concepts
Investor Presentation Public January 2018 // 31Outlook FY2017/18
The outlook is adjusted for currency effects and portfolio changes.
FY 2016/17 1 FY 2017/18
€m
Total 1
Salessales 22,155 Slight increase 2
EBITDA (excl. Fnac Darty) 704 At least mid single-digit % growth
EBIT (excl. Fnac Darty) 471 At least mid single-digit % growth
Fnac Darty profit share (consensus) n.a. Low to mid double-digit €m amount
1 EBITDA & EBIT in FY 2016/17 before special items. EBITDA & EBIT in FY 2017/18 as reported. 2 Correspondingly, a slight improvement in NWC compared with the previous year is expected.
Investor Presentation Public January 2018 // 32Key initiatives to further grow online/mobile/store
// Expansion of online CE assortment from currently c. 350k SKUs to 1m SKUs
Assortment // Dropshipment initiatives to increase assortment without capital locked
Online Sales1
(% of total sales)
// Taking advantage of our high traffic we include more data into decision making
12-15%
Usability processes to improve usability
// Optimising every single customer contact and drive (micro-) conversions onsite
11%
// Making assortment available at all touchpoints with full multi-channel
Availability capabilities (digital shelf extensions)
// Optimising access to stock across stores, warehouses, suppliers
// Optimise pricing strategy by e.g. introducing automated lifecycle pricing to
Price ensure timely and effective price management
16/17 Mid-term
// Using price optimisation algorithms ambition
Initiatives have been identified and are currently implemented
to reach mid-term ambition of 12-15% online sales target
1 Including pick-up.
Investor Presentation Public January 2018 // 33Increased services penetration will also drive CECONOMY’s sales
and margin targets
// Full roll-out of in-store service and repair “smart bars” until the end of 2018
In-store services (642 already in place)
// Additional services to be added: e.g. trade in, personalisation of products Services & Solutions
Sales (% of total sales)
// Full roll-out of Deutsche Technikberatung (DTB) at-home consultation and
At-home and installation services across Germany by end of next year (>200 already in place) c.10%
remote services // Build up of remote service capabilities (call centre including social web care,
chat, messenger) to offer 24/7 seamless support
6%
// Introduction of subscription model “always on” providing unlimited support and
Subscription
protection against failure of mobile devices in additional countries
models (75,000 contracts sold in the Netherlands in 1st year)
// Roll-out of “repair hubs” to guarantee our customers a much faster repair
Services delivery to other countries next to existing pilot repair hub in Benelux
processes 16/17 Mid-term
// Reducing turn-around times through implementation of new service software ambition
Relentless focus on strengthening service value proposition –
in-store, remote & at home of customers
Investor Presentation Public January 2018 // 34CECONOMY also continues selective store expansion contributing to the
overall sales growth target
Number of stores (at period end) Formats and measures
1,053
1,023 // Roll-out especially of smaller store formats such as proximity
1,007
986 and shop-in-shop concepts
// Focus on smaller formats leads to reduced store size but still
access to full assortment via multi-channel offering
13/14 14/15 15/16 16/17
// Consolidation: Opportunities in core countries to acquire
existing profitable competitor outlets and integrate them
Average size of stores (in square meters) into the MediaMarkt and Saturn store network
3,131
3,056 // Modest growth in number of stores expected,
excluding roll-out of shop-in-shop
2,909
2,811
X Ongoing selective expansion, yet at a
lower pace and with smaller formats
13/14 14/15 15/16 16/17
Investor Presentation Public January 2018 // 35Ongoing portfolio improvement is well on track; we are committed to
find strategic answers for Russia and Sweden until end of 2018
redcoon Turkey Russia Sweden
// Restructuring of redcoon // Succeeded in turning // Initiated cost savings and // Initiated cost savings
completed around Turkey margin management program
programs
// Closures of redcoon // Significant growth through // Ongoing rightsizing of
operations in six countries operational excellence // Ongoing rightsizing of existing stores
existing stores
// Operations in Germany & // Sales & Service push // Improving logistics, supply
Poland fully integrated into // Sales push with roll-out of chain and stock management
// 100% centralized
country organisation shop-in-shops at Metro Cash
procurement // Service & Solutions push
& Carry
Strategic answer Strategic answer
Solved
✓ Solved
✓ until end of 2018 until end of 2018
Portfolio improvements provide margin uplift to reach mid-term
ambition of EBITDA margin in the direction of 5%
Investor Presentation Public January 2018 // 36New category management initiatives aim offering the right range and
assortment at the right price
Preparation Implementation Results
// Change of organizational structure by // Category management pilots have been // Aligning brand and price structure to
centralizing purchasing activities on a started in selected categories in Italy, Spain market situation and customer demands
country level and Netherlands // Providing the right level of entry price
// Definition of key elements for assortment // First pilots with space planning tools in products
management and space planning as part Spain, Russia and Poland // Ensuring full distribution of top selling
of a holistic category management
// Full roll-out to all countries over the next products across all stores & channels
approach:
years
_Definition of strategic categories &
category roles
// Increased availability of goods in stores
_Modularization of assortment & store
clusters // Improved stock positions
_Assortment analysis // Increased sales
_Roles & responsibilities // Reduced lost sales
Initiatives also provide the foundation for additional efficiencies
in purchasing, supply chain and operations
Investor Presentation Public January 2018 // 37Introducing multi-level logistics concepts with central warehouses, cross-
docking platforms and regional delivery hubs
Central warehouses Regional delivery hubs Online warehouses
(Parcel factory)
// Pilot central warehouses introduced // Regional warehouses especially for // Expansion of eCommerce logistics
in Sweden and Switzerland larger items such as white goods capacity in all countries as necessary
// Cross-docking platforms introduced // 1st stage: Consolidation of regional // Integration of existing online
in Spain, Italy and Turkey delivery structures into delivery hubs warehouses into multi-level logistics
across almost all countries concept
// Pilot activities to build-up expertise in
logistics, demand planning and fore- // 2nd stage: Upgrade delivery hubs to // Germany: Four online warehouses up
casting in Germany and Poland regional warehouses and running and at least one addition
in FY17/18
// Roll-out of central warehouses to // Germany: Two delivery hubs piloted
Netherlands and Austria in 2018 and
Germany in 2019
Benefits: Improved delivery times, better availability with reduced lost sales, cost
savings through economies of scale and optimized inventories levels
Investor Presentation Public January 2018 // 38Case study: Germany
Centralisation of supply chain processes from predominantly
direct store delivery to a more central and regional structure
Product flows and logistics locations: Today Product flows and logistics locations: Target picture
INDUSTRY INDUSTRY
Central Regional
warehouse warehouses
Parcel factory Online Parcel factory
Dropshipment
Pallets 1 MH* / 2MH*
(online) warehouse (online)
Parcels 2 MH* Parcels
MediaMarkt & Saturn
stores
MediaMarkt & Saturn stores
CUSTOMER CUSTOMER
// Direct delivery to more than 400 individual stores in // New central warehouse and regional structure for
Germany MediaMarktSaturn Germany
// High coordinating efforts for suppliers and higher // One central inventory for both brands
operational costs
// Efficient automated store replenishment
*1 MH = 1 man handling, 2MH = 2man handling.
Investor Presentation Public January 2018 // 39Case study: Germany
End-to-end supply chain set-up including centralisation of
procurement and systems infrastructure offers great value potential
Optimisation levers Roadmap to achieve target picture
// Solution based on 3 interlinked pillars (procurement,
1 Product availability 1 logistics infrastructure and systems infrastructure)
2 Product inventory & stock structure 2 // 2 regional warehouses recently piloted in Northern
Germany
3 Process costs 3 // Current focus on development of systems infrastructure
(including central SAP-ERP)
4 External storage area 4
// First central warehouse in Germany planned for early
2019
5 Service quality (deliveries) 5
// Gradual set-up of additional regional warehouses
6 Transport costs 6 thereafter
7 Purchasing conditions 7
Investor Presentation Public January 2018 // 40CECONOMY’s overall mid-term ambitions
CORE METRICS 2015/16 2016/17 MID-TERM COMMENTARY
AMBITIONS
// Moderate market growth expected
Sales1 €21.9bn €22.2bn > 3% CAGR //
//
Further increase in market shares in core markets
Online, mobile, multi-channel, CRM and Services &
(1.5% yoy) (1.4% yoy) Solutions as main drivers
// Growing sales to support EBITDA margin
direction development
EBITDA Margin2 3.3% 3.2% 5% // Additional improvements from Portfolio Optimisation,
Category Management and Supply Chain Initiatives
direction // Reduction in non-tax deductible special items
Tax Rate2 49% 44% 40% // Profitability improvement of underperforming
countries
// Well-invested state-of-the-art asset base
Investments3 1.5% 1.4% 1.5% // Low amount of maintenance investments
(% of sales)
// Tight control of Net Working Capital
FCF Conversion4 44% 62% 60 – 70% // Sustainable positive Free Cash Flow generation
// Normalised pay-out ratio of 45‒55% targeted
Dividend pay-out ratio5 NM 45% 45 – 55% // Higher or lower depending on profitability investment
opportunities
1 Atconstant currency before portfolio effects. CAGR = Compound Annual Growth Rate. 2 Before special items. 3 Cash investments; adjusted for investment in digital shelf labels (2015/16); adjusted for investment in Fnac Darty stake
(2016/17). 4 Free Cash Flow conversion defined as EBITDA less cash investments plus/minus changes in net working capital divided by EBITDA; EBITDA before special items, based on reported segment investments and adjusted for
changes in net working capital (2015/16); EBITDA before special items and adjusted for investment in Fnac Darty stake (2016/17). 5 % of EPS; EPS before special items (2016/17).
Investor Presentation Public January 2018 // 41//
Impressions
January 2018 // 42Smart Bars
Investor Presentation Public January 2018 // 43In-store experience areas
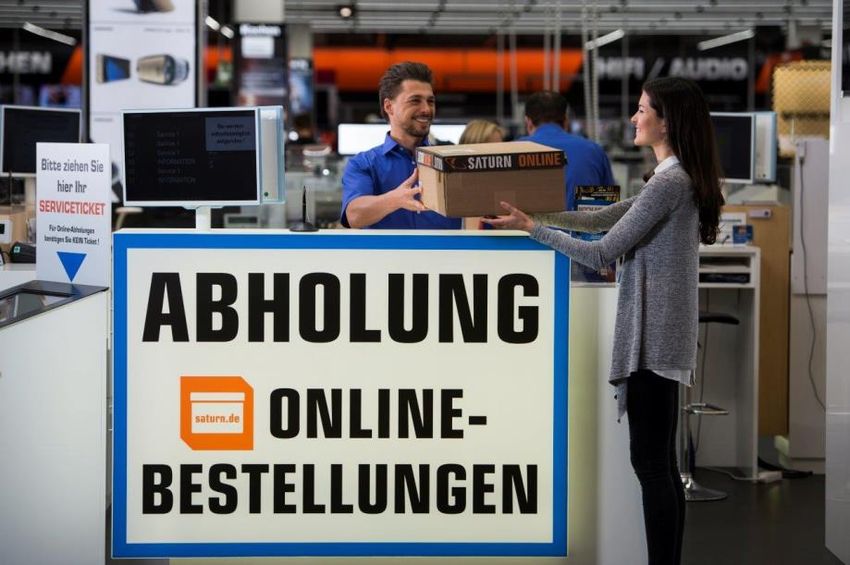
Investor Presentation Public January 2018 // 44Pick-up points for online orders
Investor Presentation Public January 2018 // 45Digital shelf labels
Investor Presentation Public January 2018 // 46//
Back Up
January 2018 // 47Sales & number of stores by country
Sales (€m) Number of Stores
FY 2015/16 FY 2016/17 FY 2015/16 Openings Closures FY 2016/17
Germany 10,273 10,556 424 5 - 429
Austria 1,139 1,169 49 1 - 50
Switzerland 674 635 28 - -1 27
Hungary 272 302 22 2 - 24
DACH 12,358 12,662 523 8 -1 530
Belgium 681 686 23 7 -2 28
Greece 189 187 11 1 - 12
Italy 2,096 2,087 111 5 - 116
Luxembourg 58 63 2 - - 2
Netherlands 1,567 1,590 49 - - 49
Portugal 124 133 9 1 - 10
Spain 1,894 1,967 79 4 - 83
Western & Southern Europe 6,609 6,714 284 18 -2 300
Poland 1,004 1,033 83 3 - 86
Russia 566 526 61 1 -5 57
Turkey 612 666 45 10 -2 53
Eastern Europe 2,181 2,226 189 14 -7 196
Sweden 503 474 27 - - 27
Others (incl. Sweden) 722 553 27 - - 27
CECONOMY 21,870 22,155 1,023 40 -10 1,053
Investor Presentation Public January 2018 // 48EBITDA to EPS
€m Q4 2015/16 Q4 2016/17 FY 2015/16 FY 2016/17
EBITDA 288 302 719 704
EBITDA margin (%) 5.7% 5.7% 3.3% 3.2%
DACH 173 201 493 539
Western & Southern Europe 90 76 230 169
Eastern Europe -2 15 9 34
Others 27 9 -12 -38
EBIT 207 244 466 471
EBIT margin (%) 4.1% 4.6% 2.1% 2.1%
DACH 127 169 359 421
Western & Southern Europe 72 57 158 91
Eastern Europe -21 9 -35 3
Others 28 8 -16 -44
Net financial result -10 -14 -22 -26
Earnings before taxes 197 229 444 446
Income taxes -109 -84 -217 -197
Tax rate (%) 55.3% 36.5% 48.8% 44.1%
Profit or loss for the period 88 146 227 249
attributable to non-controlling interest 36 27 75 60
attributable to shareholders of CECONOMY AG 52 119 152 189
EPS (in Euro) 0.16 0.36 0.47 0.58
Investor Presentation Public January 2018 // 49Balance sheet movements
€m 30/09/2016* 30/06/2017 30/09/2017
Non-current assets 1,774 1,614 2,144
Intangible assets 592 624 631
Property, plant and equipment 881 840 858 Fnac Darty stake
Investment accounted for using the equity method 5 4 458
Other financial and non-financial assets 296 145 197
Includes 1% stake of new METRO AG and 6.61%
Current assets 23,178 23,441 6,136
stake of METRO Properties
Inventories 2,393 2,893 2,553
Trade receivables 324 419 498
Cash and cash equivalents 661 746 861
Other financial and non-financial assets 1,550 1,445 2,224 Includes 9% stake of new METRO AG
Assets held for sale 18,250 17,938 0
Assets 24,952 25,054 8,280
€m 30/09/2016* 30/06/2017 30/09/2017
Equity 5,332 -445 666
Includes IFRIC 17 liability
Non-current liabilities 902 1,098 1,062
Provisions 818 753 691
Borrowings 16 266 278 Includes promissory note (“Schuldschein“)
Other financial and non-financial liabilities 68 79 93
Current liabilities 18,718 24,401 6,551
Trade payables 4,494 4,835 4,929
Provisions 165 157 199
Borrowings 2 8 266 Includes commercial paper
Other financial and non-financial liabilities 1,154 7,035 1,157
Liabilities related to assets held for sale 12,903 12,366 0
Includes IFRIC 17 liability
Equity and liabilities 24,952 25,054 8,280
* Adjusted view which represents only CECONOMY balance sheet as of 30/09/2016.
Investor Presentation Public January 2018 // 50Fnac Darty consolidation
FNAC H2 2017 FNAC H1 2018 FNAC H2 2018
4/6
CEC Q4 16/17 CEC Q1 17/18 CEC Q2 17/18 CEC Q3 17/18 CEC Q4 17/18 CEC Q1 18/19
30.06. 01.09. 30.09. 31.12. 31.03. 30.06. 30.09. 31.12.
2017 2017 2017 2017 2018 2018 2018 2018
// Our 24.33% stake in Fnac Darty is accounted for as “Investment accounted for using the equity method” on the balance sheet
// The share of Fnac Darty’s net income will be reported in our EBITDA and EBIT
// Due to Fnac Darty’s semi-annual reporting of net income, we will report our earnings share semi-annually in Q2 and Q4
_First-time consolidation: in our Q2 17/18, we will recognize our earnings share of 4/6 x Fnac Darty’s full H2 net income
(Sep-Dec), because 01 September 2017 is the date of first consolidation
// Our share of dividends, should there be any dividends, will be recognised earnings-neutral in our cash flow statement
Investor Presentation Public January 2018 // 51Upcoming events
Q1
Sales 1
2017/18 results Friday, 9 February 2018
AGM 2018 Wednesday, 14 February 2018
Q2/H1 2017/18 results Thursday, 17 May 2018
Q3/9M 2017/18 results Tuesday, 14 August 2018
FY 2017/18 results Wednesday, 19 December 2018
Investor Presentation Public January 2018 // 52Date: 02/01/2018 // 53
You can also read