INVESTOR PRESENTATION - Ceconomy

Page created by Douglas Clark
 
CONTINUE READING
INVESTOR PRESENTATION - Ceconomy
INVESTOR
PRESENTATION
May 2020
INVESTOR PRESENTATION - Ceconomy
DISCLAIMER                                                                (segmental or other) information in the consolidated financial
                                                                          statements of the former METRO Group and, thus, may not be
                                                                          fully comparable to such financial statements. Historical
                                                                                                                                                our business, results of operations, financial position or cash
                                                                                                                                                flows. There are, however, material limitations associated with
                                                                                                                                                the use of non-IFRS measures including (without limitation) the

AND NOTES
                                                                          information contained in this presentation which is not taken or      limitations inherent in the determination of relevant adjustments.
                                                                          derived from the unaudited combined financial statements is           The non-IFRS measures used by us may differ from, and not be
                                                                          mostly based on or derived from the consolidated (interim)            comparable to, similarly-titled measures used by other
                                                                          financial statements for the respective period. Financial             companies.
                                                                          information with respect to the business of MediaMarktSaturn
                                                                          Retail Group is particularly based on or derived from the segment     To the extent that statements in this presentation do not relate to
                                                                          reporting contained in these financial statements. In addition, the   historical or current facts they constitute forward-looking
BY ACCESSING THIS PRESENTATION YOU AGREE TO THE                           historical financial and operative information included in this       statements. All forward-looking statements herein are based on
FOLLOWING RESTRICTIONS                                                    presentation is not necessarily indicative for the operational        certain estimates, expectations and assumptions at the time of
                                                                          results, the financial position and/or the cash flow of the           publication of this presentation and there can be no assurance
This document and the presentation to which it relates is
                                                                          CECONOMY business on a stand-alone basis neither in the past          that these estimates, expectations and assumptions are or will
intended for information only, does not constitute a prospectus
                                                                          nor in the future and may, in particular, deviate from any            prove to be accurate. Furthermore, the forward-looking
or similar document and should not be treated as investment
                                                                          historical financial information based on corresponding combined      statements are subject to risks and uncertainties including
advice. It is not intended and should not be construed as an offer
                                                                          financial statements with respect to the CECONOMY business.           (without limitation) future market and economic conditions, the
for sale, or as a solicitation of an offer to purchase or subscribe to,
                                                                          Given the aforementioned uncertainties, readers are cautioned         behaviour of other market participants, investments in innovative
any securities in any jurisdiction. Neither this presentation nor
                                                                          not to place undue reliance on any of this information. No            sales formats, expansion in online and multichannel sales
anything contained therein shall form the basis of, or be relied
                                                                          representation or warranty is given and no liability is assumed by    activities, integration of acquired businesses and achievement of
upon in connection with, any commitment or contract
                                                                          CECONOMY, express or implied, as to the accuracy, correctness or      anticipated cost savings and productivity gains, and the actions of
whatsoever. This presentation may not, at any time, be
                                                                          completeness of the information contained in this presentation.       public authorities and other third parties, many of which are
reproduced, distributed or published (in whole or in part) without
                                                                          All numbers shown are before special items, unless otherwise          beyond our control, that could cause actual results, performance
prior written consent of CECONOMY AG (“CECONOMY”).
                                                                          stated. All amounts are stated in million euros (€ million) unless    or financial position to differ materially from any future results,
                                                                          otherwise indicated. Amounts below €0.5 million are rounded           performance or financial position expressed or implied in this
Historical financial or operative information contained in this
                                                                          and reported as 0. Rounding differences may occur.                    presentation. Accordingly, no representation or warranty (express
presentation, if not taken or derived from our accounting records
                                                                                                                                                or implied) is given that such forward-looking statements,
or our management reporting or unless otherwise stated, is taken
                                                                          This presentation contains certain supplemental financial or          including the underlying estimates, expectations and
or derived from the unaudited combined financial statements of
                                                                          operative measures that are not calculated in accordance with         assumptions, are correct or complete. Readers are cautioned not
CECONOMY for the respective period and not from the
                                                                          IFRS and are therefore considered as non-IFRS measures. We            to place reliance on these forward-looking statements.
consolidated (interim) financial statements of the former METRO
                                                                          believe that such non-IFRS measures used, when considered in
Group. The combined financial statements of CECONOMY have
                                                                          conjunction with (but not in lieu of) other measures that are
not been audited and may also deviate substantially from
                                                                          computed in accordance with IFRS, enhance the understanding of

                                     Investor Presentation                                                                                      Public                             May 2020                    // 2
INVESTOR PRESENTATION - Ceconomy
Disclaimer and Notes (cont’d)
We do not undertake any obligation to publicly update any               CECONOMY is based on certain estimates and assumptions and           presentation, warrant that the data collected, processed and
forward-looking statements or to conform them to events or              there can be no assurance that these estimates and assumptions       analysed by it in accordance with the rules and methods of
circumstances after the date of this presentation. This                 as well as any interpretation of the relevant information by         market and social research, will be able to be used by in a specific
presentation contains forecasts, statistics, data and other             CECONOMY are accurate. The market research institutes which          way, in particular not in the legal sense of an expert report. It
information relating to markets, market sizes, market shares,           data CECONOMY used as basis for this presentation are neither        should be noted that all liability for completeness and correctness
market positions and other industry data on the Company’s               registered broker dealers nor financial advisors and the permitted   of the information provided by us or any third party is explicitly
business and markets (together the “market data”) provided by           use of any market research data does not constitute financial        excluded. Under no circumstance shall a third party whose data is
third party sources as interpreted by us. This market data is, in       advise or recommendations.                                           cited in this presentation be liable for damages incurred through
part, derived from published research and additional market                                                                                  or in connection with your or our interpretation of the provided
studies prepared primarily as a research tool and reflects              CECONOMY operates, in part, in industries and channels for           information. Neither we nor any third party shall be responsible
estimates of market conditions based on research methodologies          which it is difficult to obtain precise market data. Such market     for any loss or damage arising out of your or our use or reliance
including primary research, secondary sources and econometric           data should therefore be considered with caution and not be          upon the information contained herein, or for actions of and
modelling. We want to point out that part of the market data            solely relied on as market studies are often based on information    decisions taken by us, you or any third parties that receive this
used has been collected in the framework of a market survey             and assumptions that may be inaccurate or inappropriate, and         information. Neither we nor any third party give any
carried out as a panel observation. The panel is a regular survey       their methodology is inherently predictive and speculative. We       representations as to the accuracy of the market data included in
monitoring sales of specific products and product categories,           have no reason to believe that such information is false or          this presentation. The third parties whose data is cited in this
using a range of distribution channels including internet, retail       misleading or that any material fact has been omitted that would     presentation are neither registered broker-dealers nor financial
outlets (e.g. high street, mail order) and companies (e.g.              render such information false or misleading. Our own estimates       advisors and the permitted use of any market research data does
resellers). The market data does not represent actual sales figures     have not been checked or verified externally. They may differ        not constitute financial advice or recommendations.
globally or in any given country; rather, the market data               from estimates made by competitors of our group or from future
represents a statistical projection of sales in a given territory and   studies conducted by market research institutes or other
is subject to the limitations of statistical error and adjustments at   independent sources. Information prepared by third parties has
any time (e.g. reworks, changes in panel structure). The                not been independently verified by us or any other party.
representativeness of the market data may be impacted by
factors such as product categorisation, channel distribution and        Therefore you acknowledge that the market data presented is
supplier universe identification and statistical sampling and           based on statistical methods and extrapolation and so due to the
extrapolation methodologies. The market data presented is based         nature of such data no guarantee for completeness and accuracy
on statistical methods and extrapolation. In addition, market           can be given by us or any third party. Neither we nor any third
research data and trend information as interpreted or used by           party, including those third parties whose data is cited in this

                                    Investor Presentation                                                                                    Public                             May 2020                     // 3
INVESTOR PRESENTATION - Ceconomy
Agenda

         01          02          03
     Ceconomy at   Q2 19/20 &   Operations
       a glance     Outlook      Update
INVESTOR PRESENTATION - Ceconomy
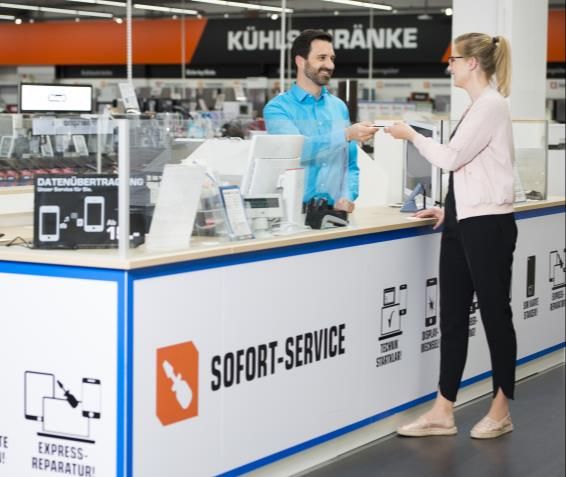
CECONOMY at a glance

                       Date: May 2020   // 5
INVESTOR PRESENTATION - Ceconomy
CECONOMY is Europe’s largest Consumer Electronics platform

 Shareholder structure                                              Product category breakdown                                                                                 Highlights
 (based on ordinary shares1)
                                                                                            Other3
                                          Haniel                   Entertainment               4%                 White                         ◼ Europe’s largest Consumer Electronics platform
 Free float                                                                               9%                      Goods
                                  22.7%                                                                 23%
                                                                                                                                                ◼ 21.5 €bn of sales, c. 402 €m EBIT in FY 18/19
                47.2%                                                  Brown 21%
                                 14.3% Meridian
                            6.6%                                       Goods
                                                                                                          22%                                   ◼ >2.9 €bn online sales and 1.5 €bn Services &
                               9.1%    Stiftung                                                                                                   Solutions sales in FY 18/19
                                                                                           21%                   Telecom
                                       freenet                          Computer Hardware2 & Accessories
                        Beisheim                                                                                                                ◼ Leading position in 7 out of 13 countries
 Sales per segment                                                  EBIT per segment (excl. Others)
                                                                                                                                                ◼ 2 strong brands: MediaMarkt and Saturn
 Eastern Europe Others                                                                Eastern Europe
                                                                                              2%                                                ◼ Multi-channel 1,000+ store network
                        7%
                          2%                                       W. & S.
                                                                   Europe 31%                                                                   ◼ Solid financial framework
W. & S.
        32%
Europe                                  59% DACH
                                                                                                        67% DACH                                ◼ Minority investments in Fnac Darty (c. 24%) and
                                                                                                                                                  M.video (c. 15%)

1Calculated   on the basis of the number of voting rights disclosed pursuant to section 40 para. 1 sentence 1 WpHG. 2Telecommunication devices such as iPads without SIM card included. 3Includes in essence Photo&Office equipment.

                                         Investor Presentation                                                                                                 Public                                  May 2020                        // 6
INVESTOR PRESENTATION - Ceconomy
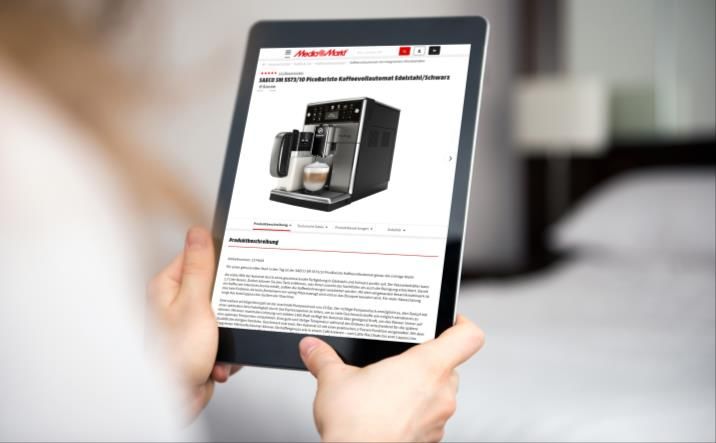
We have a strong set of assets and operate in an attractive market

 ◼ Leading multi-channel player for                    ◼ Digital opens up new product
   Consumer Electronics                                  categories

 ◼ Differentiated value proposition with               ◼ Ageing population is increasingly
   Services & Solutions offering                         seeking technical support

 ◼ Large customer base                                 ◼ Connectivity and product
                                                         complexity drive rising demand
 ◼ Trusted brands                                        for Services & Solutions

 ◼ Strong and reliable partner of suppliers

                     Investor Presentation        Public                  May 2020           // 7
INVESTOR PRESENTATION - Ceconomy
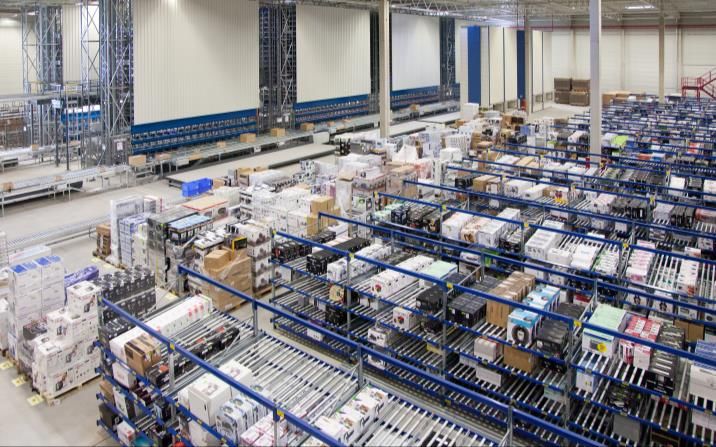
Our store network is an asset and integral part of our omni-channel and
services strategy
Advantages of
CECONOMY’s strong
physical presence

◼ Offering customers tangible product
  experiences
◼ Showroom for exclusive and high-
  end products offering suppliers
  visibility of brands
◼ Instant in-store repairs of mobile
  devices
◼ Personal contact and personalized
  customer service
◼ Delivery hubs & pick-up
  places/return points for online
  orders

                     Investor Presentation       Public       May 2020    // 8
INVESTOR PRESENTATION - Ceconomy
Ongoing progress in the Online and Services & Solutions business

 Strong Online business                                                                                               Increasing Services & Solutions business

 % of total               10.6%                       12.1%                        13.7%                              % of total     6.2%             6.9%                7.0%
 sales                                                                                                                sales
                                                                                   2,935                                                              1,478              1,498
                                                       2,592                                                                         1,344
                          2,300
 Sales (€m)                                                                                                           Sales (€m)

                          16/17                       17/18                        18/19                                             16/17            17/18              18/19

 Growing pick-up rate                                                                                                 Ongoing rightsizing of stores
                                                                                                                      Number          996                                1,042
                                                                                    47%                                                               1,022
                                                                                                                      of stores
                           40%                          42%
                                                                                                                                              -3%                -3%

 In % of                                                                                                                             2,808            2,724              2,636
 orders                                                                                                               Avg. store
                                                                                                                      size m²

                          16/17                       17/18                        18/19                                             16/17            17/18              18/19
Note: Business figures represent the continuing operations of CECONOMY, i.e. excl. the Russian MediaMarkt business.

                                       Investor Presentation                                                                                 Public                    May 2020   // 9
INVESTOR PRESENTATION - Ceconomy
Our full focus is on the execution of our four strategic initiatives

       DIGITAL                       SERVICES &      CATEGORY &        ORGANIZATION &
      GROWTH                         SOLUTIONS      SUPPLY CHAIN       COST STRUCTURE
                                                    MANAGEMENT

      ONGOING                        ONGOING      GRADUAL PROGRESS      SHORT TERM

             Investor Presentation                            Public        May 2020    // 10
We have accelerated our digital growth efforts

    Consolidation of six different webshop
    platforms to one common IT platform

    Significantly improved webshop
    front-end in Germany and new app with
    improved user interface

    3rd largest webshop in Germany, incl.
    MediaMarkt and Saturn

             Investor Presentation               Public   May 2020   // 11
Ongoing improvements of our platforms enabling a
better omni-channel customer journey

                State of the art platform for faster responsiveness and
New webshop
                improved customer experience; go-live in Germany in
  platform
                November ’19 and roll-out in other countries to follow

                Digitizing our sales colleagues with a new app to
  Assisted
                improve processes, efficiency & customer satisfaction
   selling
                by combination of store & online assortment

                Enabling us to broaden our assortment, increase the
   Market       number of online SKUs and improve product
   place        availability; launch in Q4 19/20 (expand into more
                categories/services in 2021)

              Investor Presentation                                       Public   May 2020   // 12
We have improved our Services & Solutions offering

    Harmonized service offering at
    SmartBars across all stores

    Increasing customer demand for screen
    protection, ready-to-use and repairs

    Tendered, refined & rolled out new
    insurances & warranties proposition in
    Germany
             Investor Presentation              Public   May 2020   // 13
Ongoing focus on achieving best-in-class attachment rates
in all countries

 Insurances &     Further ramp-up and roll-out of standardized customer
  Warranties      proposition to strengthen customer relationships

                  Group-wide full utilization of SmartBars potential with
  SmartBars
                  harmonized offerings of three core services

 Subscription     Drive recurring revenue models through own billing
   models         platform for e.g. security software

                Investor Presentation                                       Public   May 2020   // 14
Progress on the centralization of our Category and Supply Chain
Management is also steadily building

    Roll-out of central pricing system in
    Germany

    Go-live of category management pilot
    store including new systems in Spain

    Ramp-up of central logistics platform in
    Germany and in the Netherlands

             Investor Presentation               Public       May 2020   // 15
Centralization of procurement volumes on track; pricing and category
management with gradual progress

Ramp-up of central negotiated purchasing in 2019 in Germany                                Current focus
                  (in % of purchasing volume)

100%                                                          ◼ Ramp-up of centrally negotiated procurement volume in
                                                                Germany, Spain, Italy and the Netherlands on track

                                                  ~70%
                                                         ✓    ◼ Better control of margins & reliable price promises across
                                                                all channels through pricing cockpit & simulator in all key
                                                                countries

                                                              ◼ Implementation of state-of-the-art IT-system for
                                                                Forecasting & Replenishment to improve product
                                                                availability

                                                              ◼ Implementation of automated Digital Floor & Shelf-
                                                                Planning for creating store layouts based on local customer
                                                                preferences to rationalize selling space
 0%
       Mar Apr May Jun          Jul    Aug Sep Oct Nov

                    Investor Presentation                                         Public                   May 2020           // 16
Logistics will build on centralization and national distribution centres

             Transforming our supply chain into                Central platform established        Percentage of supply
                                                                                                   replenished via centralized
            an omni-channel logistics network …                                                    distribution (non-2MH)
                                                               Central platform pilot

                                                                                                   ES
                                                               Central platform planned
… based on central platforms                                                                       TR
                                                               Cross dock established

                                                                                                   SE

◼   Central platforms in the Netherlands, Italy and Spain as                                        IT
    well as pilot in Germany (Erfurt) already established
                                                                                                   NL

                                                                                                   HU
◼   Central platform for Germany (Göttingen) starts in
    autumn 2020                                                                                    DE

◼   Omni-channel logistics operations go-live for Benelux
    and Iberia in 2020

                     Investor Presentation                                                Public   May 2020                 // 17
Organization & Cost Structure: We have launched a program to reduce
complexity and costs, primarily in Germany
                                                                                                                                 Reorganization & Efficiency Program
                  Completed staffing of central
                  management team
                                                                                                                              Central Functions                      Portfolio

                  Streamlining of organizations at                                                                                                     Target               Status
                  CECONOMY and MediaMarktSaturn
                  Holding and Germany                                                                                    Timeframe                   6 – 18 months

                                                                                                                         Run-rate savings            110 – 130 €m

                  Portfolio solutions for Juke, RMG,
                                                                                                                         Total P&L
                  iBood, Greece                                                                                          expenses1
                                                                                                                                                     204 – 224 €m          c. 190 €m

1Incl.   34 €m of expenses booked in Q1 18/19 related to top management changes and incl. non-cash accounting effects.

                                         Investor Presentation                                                                              Public                   May 2020          // 18
Why invest in CECONOMY?

#1                           #2                  #3                    #4

CECONOMY IS THE              CECONOMY HAS A      CECONOMY HAS          CECONOMY HAS
LEADER IN                    STRONG              THE POTENTIAL TO      THE POTENTIAL TO
MULTI-CHANNEL                FINANCIAL PROFILE   INCREASE              LEAD THE RETAIL
AND SCALE                                        MARGINS AND           CONSOLIDATION
                                                 FREE CASH FLOW        AND
                                                 GENERATION            TRANSFORMATION
                                                                       IN THE FUTURE

            Investor Presentation                             Public         May 2020     // 19
Q2 19/20 & Outlook

                     Date: May 2020   // 20
After a solid start into FY 2019/20, the second quarter started off well,
  but was then impacted by the outbreak of COVID-19
                            Q1 19/20                                             Q2 19/20                                         Q3 19/20
                                                                                                    COVID-19
30.09.                                                         31.12.                                                31.03.
2019                                                           2019                                                  2020

    Foundation for a sound FY 2019/20                                   Solid Q2 interrupted by COVID-19

                                                                                                Strong growth
                                                                         In the first two
     Profitable Black         Progress on                                                       rates in online
                                                                          months group
      Friday period,            strategic                                                       and services &
                                                                        sales and overall
       in-store and         initiatives with                                                     solutions in
                                                                             business
          online           promising results                                                     January and
                                                                         performed well
                                                                                                   February

                                                                                         C. 87% of all           FY 2019/20
                                                                                       stores affected,           guidance
                   Significant cost             Encouraging
                                                                                       impacting B&M             withdrawn,
                    optimization,             group earnings
                                                                                      sales, somewhat          effects on sales
                   esp. in Germany             improvement
                                                                                      offset by shift to        and earnings
                                                                                        online channel            expected

                            Investor Presentation                                                Public                       May 2020       // 21
CECONOMY’s Q2 19/20 in a nutshell

                                                             Sales performance and gross margin in March
     Strong performance in January and February
                                                             strongly impacted by COVID-19 related store closures

     Marked increase in pure online sales in March,
                                                             Lack of sales in combination with high operating
     supported by successful adaption of business model
                                                             leverage led to substantial bottom-line impact
     (shipment-from-store)

     Successful, proactive crisis management incl.
     immediate initiation of short-term cost and liquidity   Impairment of Fnac Darty stake
     mitigation measures

                  Investor Presentation                                Public                 May 2020          // 22
The negative impact of the COVID-19 pandemic is already evident in the
Q2 financial figures

                                                –6.6%                                                                                      –131 €m

                                               Sales change yoy                                                                                           Adj. EBIT1,2
                                         adjusted for fx-effects and                                                                                   excl. associates3
                                             portfolio changes                                                                                         –157 €m vs. PY

Note: 1Adjusted EBIT before non-recurring earnings effects in connection with the reorganization and efficiency program and portfolio changes. 2Incl. IFRS 16. 3Companies accounted for using the equity method.

                                       Investor Presentation                                                                                                   Public                                  May 2020    // 23
Sales decline driven exclusively by COVID-19 related store closures

Q2              Total sales
                                                                 fx- and portfolio adj.1
                                                                                                                                        Q2 Highlights
                (in €m)
                                                                       –6.6%
                                                                                                                       ◼ Fx- and portfolio adjusted1 sales excl. iBood
                                                                       –7.7%
                                                                                                                         at –6.3%
                                         5,015                                                      4,631
                                                                                                                       ◼ DACH: Germany, Austria and Switzerland
                                                                                                                         impacted by store closures in March; Hungary
                                                                                                                         continued to grow solidly
                                      Q2 18/19                                                     Q2 19/20
                                                                                                                       ◼ Western & Southern Europe: Italy and Spain
                Sales by segment                                                                                         faced strong decline, largely driven by store
                (fx- and portfolio adj.1, yoy change)                                                                    closures; sales in the Netherlands on PY’s level

                                                                                           -0.2%                       ◼ Eastern Europe: Turkey with solid double-digit
                                                                                                                         growth despite store closures; Poland impacted
                           -6.0%                                                                                         by early store closures
                                                        -8.7%
                                                                                                              -12.6%   ◼ Others: Positive sales momentum in Sweden;
                          DACH                   W. & S. Europe                      E. Europe                Others     segment decline due to disposal of iBood
1Excluding   Greek MediaMarkt business (portfolio adjustment).

                                        Investor Presentation                                                                  Public                  May 2020             // 24
Closure of c. 87% of our physical stores led to a drop in Group sales of
around 28% in March
Q2              Sales development (fx- and portfolio adj.1, yoy change)

                                                                                           –6.6%

                                                                                      + Remarkable
                                                                                        Online growth
                                                                 + Strong
                                                                   development in
                                                                   Germany, Austria
                                                                   and Turkey
                                                                 + Solid Online and                            − C. 87% of physical
                                                                   S&S growth                                    stores closed

                                                                 Jan/Feb: +3.7% yoy                Mar: -27.5% yoy

                              Q2 18/19                            January/February     March Online                  March B&M         Q2 19/20
1Excluding   Greek MediaMarkt business (portfolio adjustment).

                                        Investor Presentation                                                         Public          May 2020    // 25
COVID-19-related channel shift in March led to strong growth in Online,
while it was a headwind for Services & Solutions
Q2              Online sales1                                                                                Q2 Highlights
                (in €m)
                                                                  +23.7%                    ◼ Online1 growth +26.9% excl. iBood

                                                                                   859
                                          694                                               ◼ Doubling of pure online1 sales in March (+98%)
                                                                                              with further ramp-up in April (approx. +300%)
                                                                 in % of sales    18.6%
                                         14.0%
                                                                                            ◼ Shipment from store facilitated to support
                                      Q2 18/19                                   Q2 19/20     online sales

                Services & Solutions sales1                                                 ◼ Pick-up option (only partly available to
                (in €m)                                                                       customers in March) at 34% vs. 47% in PY
                                                                   –0.4%
                                                                                            ◼ Services & Solutions sales on PY’s level after
                                          280                                      279
                                                                                              double-digit increase in the first 2 months of Q2

                                         5.6%                    in % of sales    6.0%      ◼ Strong demand for extended warranties and
                                                                                              insurances, other categories below PY due to
                                      Q2 18/19                                   Q2 19/20     COVID-19 impact
1Excluding   Greek MediaMarkt business (portfolio adjustment).

                                        Investor Presentation                                       Public                  May 2020          // 26
EBIT decline essentially attributable to negative sales and margin
development in connection with COVID-19 store closures
 Q2              Gross margin1,2 (in % of sales)                                      OPEX1,2,3 (in % of sales)                                                                Q2 Highlights
                                                                                                    Absolute cost savings 33 €m

                                     –2.3%p.                                                                0.7%p.                                  ◼ Positive trend development of the gross
                                                                                                                                                      margin in January/February; in March, gross
                         19.6%                                                                 20.1%                     20.8%                        margin impacted by channel and product mix,
                                                   17.3%
                                                                                                                                                      higher delivery costs and stock-related effects

                                                                                                                                                    ◼ Initial COVID-19 cost measures had a smaller
                       Q2 18/19                  Q2 19/20                                   Q2 18/19                  Q2 19/20
                                                                                                                                                      positive impact; full impact materializing in
                                                                                                                                                      April
                 Adj. EBIT1,2 excl. associates (in €m)                                                           Q2 18/19
                                                                                                                 Q2 19/20 incl. IFRS 16
                                                                                                                                                    ◼ DACH / W. &. S. Europe: Sales- and margin-
                                              47
                                                                                                                                                      related decline in Germany, Spain and Italy due
                      26                                                                                                                              to store closures; also Netherlands below PY
                                                                        1
                                                                                               -4
                                                                                -33                      -24           -18        -21               ◼ Eastern Europe: Poland with ongoing earnings
                                                       -53                                                                                            weakness

                              -131
                                                                                                                                                    ◼ Others: Declining earnings in Sweden
                        Group                    DACH             W. & S. Europe               E. Europe                Others4
1Excl.   non-recurring earnings effects in connection with the reorganization and efficiency program. 2Adjusted for portfolio changes. 3 Sum of SG&A expenses and Other operating expenses. 4 Incl. consolidation.

                                           Investor Presentation                                                                                                   Public                                  May 2020   // 27
Reported EBIT additionally impacted by impairment of Fnac Darty stake

Q2            Adj. EBIT1,2 excl. associates to reported EBIT (in €m)

                                                                                                                                        + Fnac Darty profit
                                                                                                                                          share
                                                                                                                                        − Fnac Darty
                                                                                                                                          impairment

                                                                                               -3
                                      -131

                                                                                  − Expected trailing
                                                                                    restructuring
                                                                                    expenses
                                                                                                                                                    -234

                                                                                                                                                                                                           -368
                           Adj. EBIT Q2 19/20                                   Restructuring-related                                    Other adj. items                                   Reported EBIT Q2 19/20
                                                                                  earnings effects                                     (portfolio, associates)
Note: EBIT incl. IFRS 16 effect. 1Adjusted EBIT excl. associates and non-recurring earnings effects in connection with the reorganization and efficiency program announced on 29 April 2019. 2Adjusted for portfolio changes.

                                        Investor Presentation                                                                                                    Public                                   May 2020              // 28
EPS impacted by lower operational earnings and Fnac Darty impairment

€m                                                             Q2 2018/19 Q2 2019/20                         Change                      Q2 Highlights
EBITDA                                                                       83                       102        19    ◼ Reported EBITDA includes c. 143 €m IFRS 16
                                                                                                                         effect
EBIT                                                                         19                  –368          –387

Net financial result                                                         14                       –23       –37    ◼ Reported EBIT includes c. 3 €m IFRS 16 effect
                                                                                                                         and Fnac Darty impairment of 268 €m, partly
Earnings before taxes                                                        33                  –391          –424      offset by Fnac Darty profit share of 34 €m

Income taxes                                                               –13                         82        95
                                                                                                                       ◼ Net financial result in prior year included
Tax rate                                                               40.3%                   20.9%        –19.5%p.     positive effects related to METRO stake still
                                                                                                                         held at that time
Profit or loss for the period                                                20                  –309          –329

  Non-controlling interest                                                   –5                       –15       –10    ◼ Tax rate in H1 at –36.6%; negative tax rate
                                                                                                                         essentially due to Fnac Darty impairment
  Net result                                                                 25                  –295          –320
                                                                                                                       ◼ EPS declined by –0.89 yoy
EPS (in €)                                                                0.07                  –0.82          –0.89
Note: From continuing operations and based on reported figures; EBIT/DA in CY incl. IFRS 16 effect.

                                        Investor Presentation                                                                   Public                  May 2020         // 29
Adjusted Free Cash Flow above prior year due to lower NWC outflow

H1             2019/20: Free Cash Flow (in €m)                                                                                                                                  H1 Highlights
                    611
                                                                                                                                                     ◼ Adj. Free Cash Flow improved by 86 €m
                                     -60            -46                                           286
                                                                  -105                                                                               ◼ Change in NWC improved due to higher
                                                                                  -115
                                                                                                                                   7                   increase in trade liabilities, driven by higher
                                                                                                                 -279                                  starting point as of 30 September 2018 and the
                 EBITDA          Δ NWC             Tax           Other          Cash    FCF                    Lease   Lease                           temporary extension of payments in the
                                                                            investments                       repaym. adj. FCF1                        context of COVID-19

               2018/19: Free Cash Flow (in €m)                                                                                                       ◼ Other OCF at – 105 €m mainly impacted by
                                                                                                                                                       reversal of non-cash effects related to Greek
                    374                                                                                                                                transaction and restructuring-related cash
                                                                                                                                                       outflows

                                     -280                                                                                                            ◼ Increase in cash investments mainly due to
                                                    -61            -12                                                                                 cash-effective investment into the joint venture
                                                                                   -96            -76              -3            -79                   in Greece; modernization and expansion
                 EBITDA          Δ   NWC2          Tax           Other          Cash    FCF                    Lease   Lease                           investments below PY
                                                                            investments                       repaym. adj. FCF1
1Lease   adjusted free cash flow subtracts the repayment of lease liabilities for better FCF comparability under IFRS 16. 2Prior-year adjustments due to changes in presentation and definition.

                                           Investor Presentation                                                                                                    Public                         May 2020   // 30
In view of the developments in connection with COVID-19, the original
outlook for FY 19/20 was withdrawn

               ◼ Solid performance in 5M 19/20, fully on track to reach original FY guidance

               ◼ March performance essentially impacted by Corona-induced store closings
 “Knowns”      ◼ Sales and margin in April impacted by Corona-induced store closings, yet mitigating
                 cost measures helped to slow down earnings shortfall

               ◼ Cost reduction linked to Reorganization & Efficiency program not at risk

               ◼ Further development of the coronavirus outbreak

               ◼ Pace of normalization subsequent to stores reopening
“Unknowns”
               ◼ Extent of economic recession

               ◼ Possible long-term effects on consumer behavior and trends

             Investor Presentation                                                 Public              May 2020   // 31
New outlook for FY 19/20

◼ Coronavirus impact on the Company's business for the full year cannot be predicted with sufficient reliability at this time
◼ Adjusted for portfolio changes
◼ Excluding non-recurring earnings effects in connection with the reorganization and efficiency program announced on 29 April 2019

                                                    FY 19/20                             thereof IFRS 16
                                                  incl. IFRS 16                              effect

 Fx-adjusted sales                              Below prior year

                                                  Significantly
 EBIT (excl. associates)                                                                     5 – 15 €m
                                                below prior year

                       Investor Presentation                                                   Public                  May 2020      // 32
Operations Update

                    Date: May 2020   // 33
CECONOMY has adopted a successful pro-active crisis management
approach to mitigate COVID-19 impacts

Ensuring a safe                                        Implementing                  Preparing for the
environment                                            comprehensive                 reopening and a
for employees                                          cost and liquidity            strong commercial
and customers                                          measures                      comeback

                  Results Presentation Q2/H1 2019/20                        Public          May 2020     // 34
We have managed to react to the crisis early and have taken bold
immediate measures to protect our people and business

          Starting point                         Bold immediate measures

▪ We have managed to react to             Comprehensive measures to ensure health and safety
  the crisis early                        of our employees and customers (in stores and HQs)

  ‒ Early indications from our                                            Suspension of
                                          >30k employees in
                                                                          rental payments
    suppliers/partners in Asia            short-time work
                                                                          for closed stores

  ‒ Leverage of early insights                                            Extension of
                                          Reduction of
                                                                          payment terms
    from Italy (HQ in Milan)              investments (stores)
                                                                          with suppliers

  ‒ Establishment of internal             Suspension of brick             Deferral of tax
    task force already in January         & mortar marketing              payments

                  Investor Presentation                    Public             May 2020         // 35
We have implemented structural improvements to our business model
during COVID-19 that will continue to bring benefits long-term

                                                                Structural improvements
                                           to cope with immediate challenges from COVID-19 and to accelerate change

             Costs                                    Supply chain                        Marketing                                IT

 Flexibilization of our fixed costs              Adaption of our supply chain        Strong shift towards digital     Accelerated implementation of
    (e.g. rent, logistics costs)                 to tremendous omnichannel             marketing and targeted           “one inventory” and new
                                                 growth (backbone, last mile)      below-the-line communication        capability “ship from store”

                         Investor Presentation                                                            Public                May 2020              // 36
We have successfully leveraged our omni-channel business model to
keep sales momentum during the crisis
                Online                                                                       Stores

▪ Strong increase in pure online sales in March (+98%      ▪ 87% of stores were closed at the end of March
  yoy) further accelerating in April (approx. +300% yoy)
                                                           ▪ Increasing re-openings since mid-April,
▪ High number of new first-time buyers                       now 943 stores open (92%)

▪ New “ship-from-store” capability                         ▪ Full assortment and smartbars available to our
                                                             customers
▪ High product availability and fast delivery times
  through “pick-up” and “ship-from-store”                  ▪ Sales at re-opened stores normalize fast, also driven
                                                             by release of pent-up demand

                      Investor Presentation                               Public                  May 2020           // 37
We are now working to sustainably transform our business model for the
post-COVID-19 era
                     ▪ Further strengthen online (roll-out new webshop/app, increase online attachments)
  Strengthen
 omni-channel        ▪ Play-out omni-channel advantages (e.g. delivery from store, smartbar services)
  proposition        ▪ Improve operations based on advanced data analytics (become smart retailer)

                     ▪ Further improve our sales and service productivity
   Continue
 rigorous cost       ▪ Accelerate right-sizing of our store footprint
 management          ▪ Further flexibilization of overall cost base

                     ▪ Launch marketplace in Q4 19/20 (expand into more categories/services in 2021)
 Tap into new        ▪ Introduce advertising services for suppliers (“transfer WKZ into the online world”)
 income pools
                     ▪ Monetize our supply chain capabilities (both towards customers and suppliers)

                 Investor Presentation                                         Public               May 2020   // 38
Looking ahead, we see challenges but also strong opportunities
for us as the market leader for CE products in Europe
                                          COVID-19
                                            Crisis
                Challenges                                             Opportunities

▪ Store sales are expected to catch                  ▪ Opportunity to grab market share in
  up only gradually                                    times of accelerating market consolidation

▪ Risk of 2nd COVID-19 wave                          ▪ We will become even more relevant
                                                       for our suppliers and landlords
▪ The macro-economic situation will
  reduce consumer spend for CE in                    ▪ Online sales will remain elevated in
  2020+, effects will vary by country                  addition to recuperating store sales

                                                     ▪ Strong demand uptake in many
                                                       categories (e.g. home office, home
                                                       entertainment, home schooling)

                  Investor Presentation                       Public               May 2020     // 39
CECONOMY has increased its financial flexibility by safeguarding and
expanding access to substantial back-up lines

                                             Ensures access to additional liquidity in an

  1.7
                                             unprecedented time

                      €bn RCF                Sufficient back-up even for potentially longer lock-
                                             down and a possible second wave

                                             Mitigation of current COVID-19 impact

   & banking consortium                Underpins our continued prudent financial policy

            Investor Presentation                        Public                  May 2020           // 40
New syndicated loan of 1,700 €m complements our existing credit lines

                                                                                                               New syndicated loan complements existing committed
                                Financing structure                                                            credit facilities of 980 €m
                                                                        2,680 €m

                                                                          Tranche B
                                                                          1,700 €m
                                                                                                               Existing bilateral loans and syndicated loan will be rolled
                                                                                                               into Tranche A and C
                                                                             o/w

                                                                      1,360 €m KfW
                                                                   340 €m Partner Banks
                                                                                                               One condition is that CECONOMY suspends dividend
                       980 €m                                                                                  payments for the duration of Tranche B
              Bilateral loans (committed)                                 Tranche C
                         430 €m                                            355 €m

                    Syndicated loan                                       Tranche A                            Maturities:
                        550 €m                                             625 €m
                                                                                                               Tranche B               December 20211
                                                                                                               Tranche C               June 20222
          Old Financing Structure                          New Financing Structure                             Tranche A               January 2024
11-year   extension option at KfW’s discretion. 2Automatically extends by one year if tranche B is extended.

                                          Investor Presentation                                                              Public                   May 2020           // 41
We have sufficient liquidity to cover all outstanding net liabilities even in
a theoretical worst case scenario

(in €m)

                                                                    Net cash
                                                                   +1,399
               Gross cash 1                             New syndicated loan                                                                            Trade receivables 1,2          Trade liabilities 1,3
                  +2,424                                           +1,700                                                                                   +1,737                          -5,835

                                  Available liquidity                                                                                                                   Net liabilities 1
                                          +4,124                                                                                                                           -4,098

              New syndicated loan provides significant leeway even for a theoretical full net working
              capital unwind
1As   of 31 March 2020. 2Trade receivables and similar claims as well as receivables due from suppliers. 3Trade liabilities and similar liabilities.

                                           Investor Presentation                                                                                             Public                     May 2020              // 42
Key take-aways

      1                                 2                            3                               4

          Coronavirus caused                  The year remains                                           At the same time, we
                                                                          At the moment, we
          temporary standstill                 exceptional and                                              see the current
                                                                            are focused on a
            of majority of our                challenging as the                                         COVID-19 crisis as an
                                                                         careful reopening and
           stationary business              extent and duration of                                           opportunity to
                                                                         are happy to be there
          after good start into                  the crisis are                                              accelerate the
                                                                              again for our
                  2020                          unpredictable                                            transformation of our
                                                                           customers on site
                                                                                                            business model

           Despite the current situation, we are confident about the attractive long-term prospects
                                               of this company

                Investor Presentation                                                       Public                    May 2020   // 43
Back-up

          Date: May 2020   // 44
Sales & number of stores by country
                                                Sales (€m)                                Number of Stores
                                            FY 17/18         FY 18/19   31/12/2019      Openings             Closures       31/03/2020
Germany                                       10,340           10,472          429              –                  –1              428
Austria                                        1,161            1,150           52              –                   –               52
Switzerland                                      569              578           26              –                   –               26
Hungary                                          340              364           32              –                   –               32
DACH                                          12,410           12,565          539              –                  –1              538
Belgium                                          701              697           27              –                   –               27
Greece                                           186              193            –              –                   –                –
Italy                                          2,096            2,157          117              –                  –1              116
Luxembourg                                        65               65            2              –                   –                2
Netherlands                                    1,581            1,495           50              –                   –               50
Portugal                                         146              151           10              –                   –               10
Spain                                          2,002            2,050           88              –                   –               88
Western/S. Europe                              6,777            6,807          294              –                  –1              293
Poland                                         1,037              970           90              –                  –2               88
Turkey                                           651              596           78              –                   –               78
Eastern Europe                                 1,689            1,567          168              –                  –2              166
Sweden                                           462              439           28              –                   –               28
Others                                           542              516           28              –                   –               28
CECONOMY                                      21,418           21,455        1,029              –                  –4            1,025

                    Investor Presentation                                            Public                      May 2020          // 45
Net Working Capital1

€m                                                                         30/09/2018   31/03/2019   Change     30/09/2019   31/03/2020   Change
Inventories                                                                     2,480        2,909      429          2,548        3,161      613
Trade receivables and similar claims                                             610          528       –82           455          460          4
Receivables due from suppliers                                                  1,241        1,240       –1          1,295        1,277      –18
Trade liabilities and similar liabilities                                      –5,745       –5,835      –90         –5,321       –5,835     –514
Net Working Capital                                                            –1,415       –1,158      254         –1,023        –938        86

1Prior-year   adjustments due to changes in presentation and definition.

                                          Investor Presentation                                        Public                  May 2020      // 46
New simplified NWC definition as of Q1 2019/20 with all items easily
readable from balance sheet positions

                    Old NWC definition                                                                                   New NWC definition

                    Inventories                                                                                          Inventories

                    Receivables due from suppliers                                                                       Receivables due from suppliers
   Assets

                    Trade receivables and similar claims                                                                 Trade liabilities and other liabilities

                    Receivables from credit cards                                REMOVED1
                                                                                                                         Contract assets               NEW

                    Advance payments on inventories                              REMOVED2

                     Trade liabilities                                                                                   Trade liabilities and other liabilities

                     Liabilities to customers                                                                            Deferred revenues from
   Liabilities

                                                                                                                                                       NEW
                                                                                                                         warranty extension
                     Deferred revenues from vouchers and customer
                     loyalty programmes                                                                                  Contract liabilities          NEW
                     Provisions for customer loyalty programmes                                   Without liabilities
                     and rights of return                                                         for rights of return

                     Prepayments received on orders
1Reclassified    as Cash and cash equivalent due to similar character 2Removed due to non-material amount

                                          Investor Presentation                                                                  Public                            May 2020   // 47
Comparison of new vs old NWC definitions

       €m                                                                30/09/2018 30/09/2019
       Inventories                                                             2,480      2,548            ◼ NWC becomes easily readable
       Trade receivables and similar claims                                      613        417              from balance sheet positions
       Receivables due from suppliers                                          1,239      1,295
       Receivables from credit cards                                              71         51
       Advance payments on inventories                                             0          1
 Old

                                                                                                           ◼ New definition ensures
       Trade liabilities and similar liabilities                              -5,277     -4,914
                                                                                                             completeness of NWC
       Liabilities to customers                                                  -45        -13
                                                                                                             positions
       Deferred revenues from vouchers and customer loyalty programmes          -137       -133
       Provisions for customer loyalty programmes and rights of return           -23        -22
       Prepayments received on orders                                            -46        -45
       Net Working Capital                                                    -1,125       -815            ◼ Due to revised disclosure
                                                                                                             under new definition, NWC is
                                                                                                             more negative than under old
       €m                                                                30/09/2018 30/09/2019
                                                                                                             definition
       Inventories                                                            2,480       2,548
 New

       Trade receivables and similar claims                                     610         455
       Receivables due from suppliers                                         1,241       1,295
       Trade liabilities and other liabilities                               -5,745      -5,321            ◼ Redefinition has no economic
       Net Working Capital                                                   -1,415      -1,023              impact

                         Investor Presentation                                                    Public                 May 2020           // 48
IFRS 16 applied as of 1 October 2019 - estimated P&L impact in FY 19/20

                                               ESTIMATED
                                                EFFECT 1

Leasing expenses                                                              Decrease by 525-565 €m as leasing expenses are recognized as D&A and interest cost

EBITDA                                                                        Increase by 525-565 €m equalling the amount of leasing expenses

D&A                                                                           Increase by 515-555 €m due to depreciation of capitalized operating lease asset

EBIT                                                                          Increase by approx. 5-15 €m as lease expense is replaced by D&A and interest

Interest expense                                                              Increase by a low double-digit €m amount due to interest cost component

Earnings before taxes                                                         Reduce by a low single-digit €m amount due to higher interest during first years

1Estimated   effect on financials of FY 19/20 as first year of IFRS 16 application; financial effects based on preliminary and unaudited impact analysis as of 11 November 2019.

                                         Investor Presentation                                                                                                      Public         May 2020   // 49
IFRS 16 applied as of 1 October 2019 - estimated balance sheet and cash
flow impact in FY 19/20

                                               ESTIMATED
                                                EFFECT 1

Assets                                                                        Increase by around 2.3 €bn due to recognition of lease contracts as rights of use assets

Liabilities                                                                   Increase by around 2.4 €bn due to recognition of lease contracts as lease liabilities

                                               ESTIMATED
                                                EFFECT 1

Operating CF                                                                  Increase by 525-565 €m as leasing expenses shift to financing CF

Financing CF                                                                  Decrease by 525-565 €m as leasing expenses are recognized as interest and amortization

1Estimated   effect on financials of FY 19/20 as first year of IFRS 16 application; financial effects based on preliminary and unaudited impact analysis as of 11 November 2019.

                                         Investor Presentation                                                                                                      Public         May 2020   // 50
Fnac Darty consolidation

                      FNAC H1 2020                                      FNAC H2 2020                                     FNAC H1 2021

  FNAC
 H2 2019

            CEC Q2 19/20              CEC Q3 19/20            CEC Q4 19/20            CEC Q1 20/21             CEC Q2 20/21            CEC Q3 20/21

   31.12.                    31.03.                  30.06.                  30.09.                  31.12.                   31.03.                  30.06.
   2019                      2020                    2020                    2020                    2020                     2021                     2021

◼ Our c.24% stake in Fnac Darty is accounted for as “Investment accounted for using the equity method” on the balance sheet

◼ The share of Fnac Darty’s net income will be reported in our EBITDA and EBIT

◼ Due to Fnac Darty’s semi-annual reporting of net income, we will report our earnings share semi-annually in Q2 and Q4

◼ Our share of dividends, should there be any dividends, will be recognised earnings-neutral in our cash flow statement

                           Investor Presentation                                                              Public                    May 2020               // 51
Store director model as an effective form of incentivisation through 10%
share ownership
                                                                        Store
             10 % share                                                                                                90 % share

Store director                                                                        Country organisation
  10 % profit share paid as dividends                                  Profit Share    100 % profit booked in EBITDA

  “Chief Customer Officer”                                             Employment      Can force resignation of non-performing directors
  No “veto rights”                                                       Rights

  Decisions on special assortment                                                      Strategy
  Additional price discounts if needed in light of local competition                   Store layout
  Creation and conduct of special local marketing campaigns            Operational     Web shop management
  Limited individual purchasing                                          Rights        Purchasing
                                                                                       Core assortment
                                                                                       Country-wide marketing campaigns

                         Investor Presentation                                                      Public                    May 2020     // 52
Financial calendar and events
Financial calendar

 Q3/9M 2019/20 results                                    13 August 2020

 Q4/FY 2019/20 trading statement                          23 October 2020

 FY 2019/20 results                                       15 December 2020

Upcoming events

 Virtual Roadshow Paris                       Frankfurt   18 May 2020

 Virtual Roadshow DACH/UK/US                  Frankfurt   19 May 2020

 Virtual Roadshow Frankfurt                   Frankfurt   28 May 2020

                      Investor Presentation                                  Public   May 2020   // 53
May 2020   // 54
You can also read