Investor Presentation - July 2020 - and - Velodyne Lidar
←
→
Page content transcription
If your browser does not render page correctly, please read the page content below
and

Investor Presentation
July 2020
Disclaimer
This presentation (this “Presentation”) is provided for informational purposes only and has been prepared to assist interested parties in making their own evaluation with respect to a potential business combination between Velodyne Lidar, Inc. (“Velodyne” or
the “Company”) and Graf Industrial Corp. (“Graf”) and related transactions (the “Proposed Business Combination”) and for no other purpose.

No representations or warranties, express or implied are given in, or in respect of, this Presentation. To the fullest extent permitted by law in no circumstances will Graf, Velodyne or any of their respective subsidiaries, stockholders, affiliates, representatives,
partners, directors, officers, employees, advisers or agents be responsible or liable for any direct, indirect or consequential loss or loss of profit arising from the use of this Presentation, its contents, its omissions, reliance on the information contained within
it, or on opinions communicated in relation thereto or otherwise arising in connection therewith. Industry and market data used in this Presentation have been obtained from third-party industry publications and sources as well as from research reports
prepared for other purposes. Neither Graf nor Velodyne has independently verified the data obtained from these sources and cannot assure you of the data’s accuracy or completeness. This data is subject to change. In addition, this Presentation does not
purport to be all-inclusive or to contain all of the information that may be required to make a full analysis of Velodyne or the Proposed Business Combination. Viewers of this Presentation should each make their own evaluation of Velodyne and of the
relevance and adequacy of the information and should make such other investigations as they deem necessary.

Forward-Looking Statements
Certain statements included in this Presentation that are not historical facts are forward-looking statements for purposes of the safe harbor provisions under the United States Private Securities Litigation Reform Act of 1995. Forward-looking statements
generally are accompanied by words such as “believe,” “may,” “will,” “estimate,” “continue,” “anticipate,” “intend,” “expect,” “should,” “would,” “plan,” “predict,” “potential,” “seem,” “seek,” “future,” “outlook,” and similar expressions that predict or indicate future
events or trends or that are not statements of historical matters. These forward-looking statements include, but are not limited to, statements regarding estimates and forecasts of financial and performance metrics, projections of market and revenue
opportunities, planned business strategies, the impact of the COVID-19 pandemic, competitive position and technological and market trends. These statements are based on various assumptions, whether or not identified in this Presentation, and on the
current expectations of Velodyne’s and Graf’s management and are not predictions of actual performance. These forward-looking statements are provided for illustrative purposes only and are not intended to serve as, and must not be relied on by any
investor as, a guarantee, an assurance, a prediction or a definitive statement of fact or probability. Actual events and circumstances are difficult or impossible to predict and may differ materially from assumptions. Many actual events and circumstances are
beyond the control of Velodyne and Graf. These forward-looking statements are subject to a number of risks and uncertainties, including the inability of the parties to successfully or timely consummate the Proposed Business Combination or that the
approval of the stockholders of Graf or Velodyne is not obtained; the inability to meet the NYSE's listing standards; costs related to the Business Combination; Velodyne’s ability to manage growth; Velodyne’s ability to execute its business plan; the timing of
revenue from existing customers, including uncertainties related to the ability of Velodyne’s customers to commercialize their products and the ultimate market acceptance of these products; the uncertain impact of the COVID-19 pandemic on Velodyne’s
and its customers’ businesses; uncertainties related to Velodyne’s estimates of the size of the markets for its products and future revenue opportunities; the rate and degree of market acceptance of Velodyne’s products; the success of other competing lidar
and sensor-related products and services that exist or may become available; Velodyne’s ability to identify and integrate acquisitions; rising costs adversely affecting Velodyne’s profitability; uncertainties related to Velodyne’s current litigation and potential
litigation involving GRAF or Velodyne or the validity or enforceability of Velodyne’s intellectual property; Velodyne’s ability to partner with and rely on third party manufacturers; general economic and market conditions impacting demand for Velodyne’s
products and services; and those factors discussed in Graf’s Annual Report on Form 10-K for the year ended December 31, 2019 and Quarterly Report on Form 10-Q for the quarter ended March 31, 2020, in each case, under the headings “Risk Factors”
and other documents of Graf filed, or to be filed, with the Securities and Exchange Commission (“SEC”). If any of these risks materialize or our assumptions prove incorrect, actual results could differ materially from the results implied by these forward-
looking statements. There may be additional risks that neither Graf nor Velodyne presently know or that Graf and Velodyne currently believe are immaterial that could also cause actual results to differ from those contained in the forward-looking statements.
In addition, forward-looking statements reflect Graf’s and Velodyne’s expectations, plans or forecasts of future events and views as of the date of this Presentation. Graf and Velodyne anticipate that subsequent events and developments may cause Graf’s
and Velodyne’s assessments to change. However, while Graf and Velodyne may elect to update these forward-looking statements at some point in the future, Graf and Velodyne specifically disclaim any obligation to do so. These forward-looking statements
should not be relied upon as representing Graf’s and Velodyne’s assessments as of any date subsequent to the date of this Presentation. Accordingly, undue reliance should not be placed upon the forward-looking statements.

Use of Projections
This Presentation contains projected financial information with respect to Velodyne. Such projected financial information constitutes forward-looking information, and is for illustrative purposes only and should not be relied upon as necessarily being
indicative of future results. The assumptions and estimates underlying such financial forecast information are inherently uncertain and are subject to a wide variety of significant business, economic, competitive and other risks and uncertainties. See
“Forward-Looking Statements” above. Actual results may differ materially from the results contemplated by the financial forecast information contained in this Presentation, and the inclusion of such information in this Presentation should not be regarded as
a representation by any person that the results reflected in such forecasts will be achieved.

                            |                                                                                                                                                                                                                                         Page 2
Disclaimer (Cont’d)
Financial Information; Non-GAAP Financial Measures
Some of the financial information and data contained in this Presentation is unaudited and does not conform to Regulation S-X. Accordingly, such information and data may not be included in, may be adjusted in or may be presented differently in, the proxy
statement to be filed by Graf with the SEC. Some of the financial information and data contained in this Presentation, such as EBITDA and free cash flow, has not been prepared in accordance with United States generally accepted accounting principles
(“GAAP”). Graf and Velodyne believe these non-GAAP measures of financial results provide useful information to management and investors regarding certain financial and business trends relating to Velodyne’s financial condition and results of operations.
Velodyne’s management uses these non-GAAP measures for purposes of budgeting, planning and other purposes. Graf and Velodyne believe that the use of these non-GAAP financial measures provides an additional tool for investors to use in evaluating
projected operating results and trends in and in comparing Velodyne’s financial measures with other similar companies, many of which present similar non-GAAP financial measures to investors. Management does not consider these non-GAAP measures
in isolation or as an alternative to financial measures determined in accordance with GAAP. The principal limitation of these non-GAAP financial measures is that they exclude significant items that are required by GAAP to be recorded in Velodyne’s
financial statements. In addition, they are subject to inherent limitations as they reflect the exercise of judgments by management about what is excluded or included in determining these non-GAAP financial measures. In order to compensate for these
limitations, management presents non-GAAP financial measures in connection with GAAP results. You should review Velodyne’s audited financial statements, which will be included in the proxy statement to be filed by Graf with the SEC. Additionally, to the
extent that forward-looking non-GAAP financial measures are provided, they are presented on a non-GAAP basis without reconciliations of such forward-looking non-GAAP measures due to the inherent difficulty in forecasting and quantifying certain
amounts that are necessary for such reconciliation.

Important Information About the Proposed Business Combination and Where to Find It
In connection with the Proposed Business Combination, Graf intends to file a preliminary proxy statement with the SEC and a definitive proxy statement will be distributed to holders of Graf’s common stock in connection with Graf’s solicitation of proxies for
the vote by Graf’s stockholders with respect to the Proposed Business Combination and other matters as described in the proxy statement. INVESTORS AND SECURITY HOLDERS ARE URGED TO READ THE PROXY STATEMENT, ANY
AMENDMENTS THERETO AND ANY OTHER DOCUMENTS FILED WITH THE SEC CAREFULLY AND IN THEIR ENTIRETY WHEN THEY BECOME AVAILABLE BECAUSE THEY WILL CONTAIN IMPORTANT INFORMATION ABOUT GRAF,
VELODYNE AND THE PROPOSED BUSINESS COMBINATION. Investors and security holders may obtain free copies of the preliminary proxy statement and definitive proxy statement (when available) and other documents filed with the SEC by Graf
through the website maintained by the SEC at http://www.sec.gov, or by directing a request to Graf Industrial Corp., 118 Vintage Park Blvd., Suite W-222, Houston, TX 77070, Attention: James A. Graf, Chief Executive Officer, james@grafacq.com.
INVESTMENT IN ANY SECURITIES DESCRIBED HEREIN HAS NOT BEEN APPROVED OR DISAPPROVED BY THE SEC OR ANY OTHER REGULATORY AUTHORITY NOR HAS ANY AUTHORITY PASSED UPON OR ENDORSED THE MERITS
OF THE OFFERING OR THE ACCURACY OR ADEQUACY OF THE INFORMATION CONTAINED HEREIN. ANY REPRESENTATION TO THE CONTRARY IS A CRIMINAL OFFENSE.

Participants in the Solicitation
Graf and Velodyne and their respective directors and certain of their respective executive officers and other members of management and employees may be considered participants in the solicitation of proxies with respect to the Proposed Business
Combination. Information about the directors and executive officers of Graf is set forth in its Annual Report on Form 10-K for the fiscal year ended December 31, 2019. Additional information regarding the participants in the proxy solicitation and a description
of their direct and indirect interests, by security holdings or otherwise, will be included in the proxy statement and other relevant materials to be filed with the SEC regarding the Proposed Business Combination when they become available. Stockholders,
potential investors and other interested persons should read the proxy statement carefully when it becomes available before making any voting or investment decisions. You may obtain free copies of these documents as indicated above.

No Offer or Solicitation
This Presentation shall not constitute an offer to sell or the solicitation of an offer to buy any securities, nor shall there be any sale of securities in any jurisdiction in which such offer, solicitation or sale would be unlawful prior to registration or qualification
under the securities laws of any such jurisdiction. No offering of securities shall be made except by means of a prospectus meeting the requirements of Section 10 of the U.S. Securities Act of 1933, as amended.

Trademarks
This Presentation contains trademarks, service marks, trade names and copyrights of Graf, Velodyne and other companies, which are the property of their respective owners.

                             |                                                                                                                                                                                                                                             Page 3
Highly Experienced Leadership Team
David Hall Dr. Anand Gopalan Andrew Hamer James Graf Michael Dee
Founder & Executive Chairman Chief Executive Officer Chief Financial Officer Chief Executive Officer of Graf Industrial Chief Financial Officer of Graf Industrial
David Hall is a serial inventor and Anand Gopalan is a seasoned Drew Hamer is a seasoned finance Jim Graf is a renowned businessman Michael Dee is an experienced deal
the Founder and Executive executive with experience building executive with over 25 years of with over 32 years of deal making maker with nearly three decades of
Chairman of Velodyne Lidar and leading world-wide engineering financial leadership experience at and international capital markets public markets, corporate finance,
organizations and managing public and private technology experience private equity and M&A experience
He is one of the original entrants in organizations through business companies
the DARPA Grand Challenge in Mr. Graf has completed four Mr. Dee was a Senior Advisor at the
model transitions successful SPAC transactions as Asian Infrastructure Investment Bank
2005 and invented 3D Lidar to give Prior to joining Velodyne, Mr. Hamer
autonomous vehicles real-time 360º Prior to succeeding Mr. Hall as CEO, managed investor relations, both sponsor/CFO (Global in Beijing and a member of its
vision Dr. Gopalan served as Velodyne’s implemented financial efficiencies, Eagle/Row44/Advanced Inflight Investment Committees
CTO and as a VP of Engineering at raised capital, and oversaw the Alliance, Silver Eagle/Videocon d2h, He was previously a Senior
Mr. Hall continues to serve as a Rambus, where he oversaw chip and expansion of financial and business Double Eagle/Williams Scotsman) Managing Director at Temasek,
visionary inventor whose IP development activities for the operations at various companies and as a board director (Platinum Singapore’s sovereign investment
technologies are enabling safe Memory and Interfaced Division around the world Eagle/Target Logistics) company, and spent over 26 years at
autonomous mobility Dr. Gopalan received his PhD in Mr. Graf was previously Founder and Morgan Stanley in a variety of senior
Electrical engineering and Mr. Hamer is a member of Financial CEO of Praedea Solutions and spent positions across the globe
Microsystems Engineering from the Executives International, the nearly 15 years in investment
Rochester Institute of Technology American Institute of CPAs and the banking at Merrill Lynch, Morgan
Florida Institute of CPAs Stanley, and elsewhere
| Page 4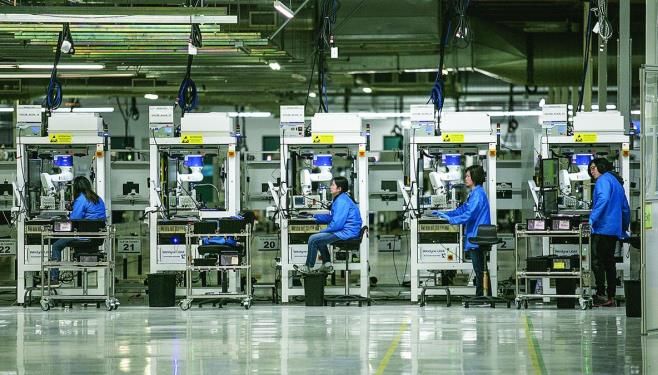
Transaction Overview
Timeline
Velodyne Lidar and Graf Industrial announced a business combination and expect to file a proxy statement in July 2020
Expected timing for transaction closing is Q3 2020
It is anticipated that the post-closing company will be a Delaware corporation, retain the Velodyne Lidar name, and be listed on the NYSE
Valuation
Valuation implies a pro forma enterprise value of $1.6bn (2.3x 2024E Revenue of Approximately $680mm) and equity value of $1.8bn
At this valuation level, existing Velodyne stockholders will receive c. 83% of the pro forma equity and $50mm in cash
Transaction Funding
The transaction will be funded by a combination of Graf cash held in a trust account, Graf common stock, and proceeds from the PIPE
Fully committed PIPE of $150mm
Transaction will result in approximately $192mm cash to the balance sheet to fund growth (1)
____________________
Note: Dollars in millions.
(1) Based on $117mm cash in trust (assuming no redemptions) and 15mm shares at $10/share PIPE ($150mm) less $25mm transaction expenses, including a 21% / 79% primary / secondary split.
| Page 5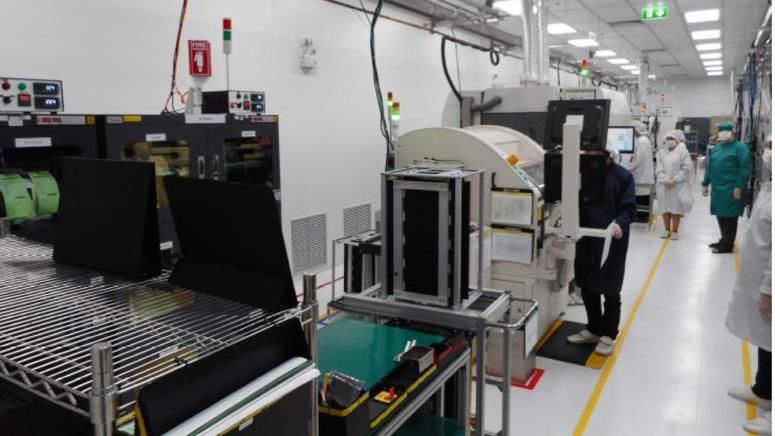
Investment Highlights
1 Established Market Leader 2 Strong Secular Trends
First mover eclipsing the market share of our Lidar is critical to “safety first” culture
nearest competitor Our drive to lower ASPs is accelerating
300+ customers with $570mm of cumulative adoption across industries
revenue since 2010(1)
Scarce Investment at
5 Highly-Visible Growth 3
Attractive Valuation
Estimated $800mm+ in contracted revenue Would be only pure-play public lidar company
through 2024 (~50% of 2024 is contracted) Pro forma valuation at a substantial discount
Opportunity for 60%+ revenue CAGR from vs comparable companies(2)
2020-2024
4 Deep Defendable Competitive Moats
____________________ Entrenched Customer Relationships with high switching costs
(1) As of December 2019.
(2) Per FactSet data as of June 26, 2020. Peer group includes Extensive and defendable patent portfolio
Ambarella, Ballard, Cree, Melexis, Mobileye, Nikola, Nvidia,
Plug Power, Tesla, and Xilinx. Metrics reflect CY2021E
Broad product portfolio (sensor + software) with proven volume
values. Mobileye reflects pre-announcement unaffected manufacturing
metrics as of March 10, 2017.
| Page 6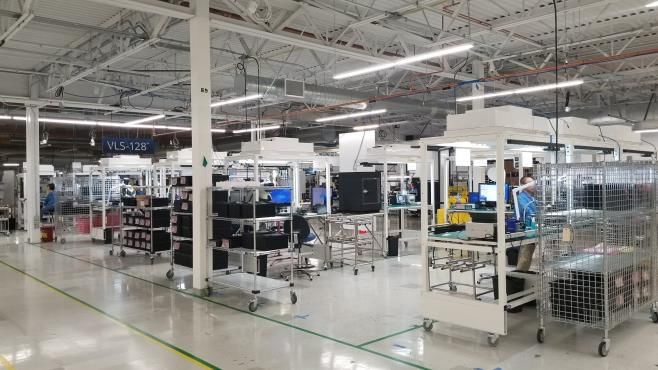
Company Overview
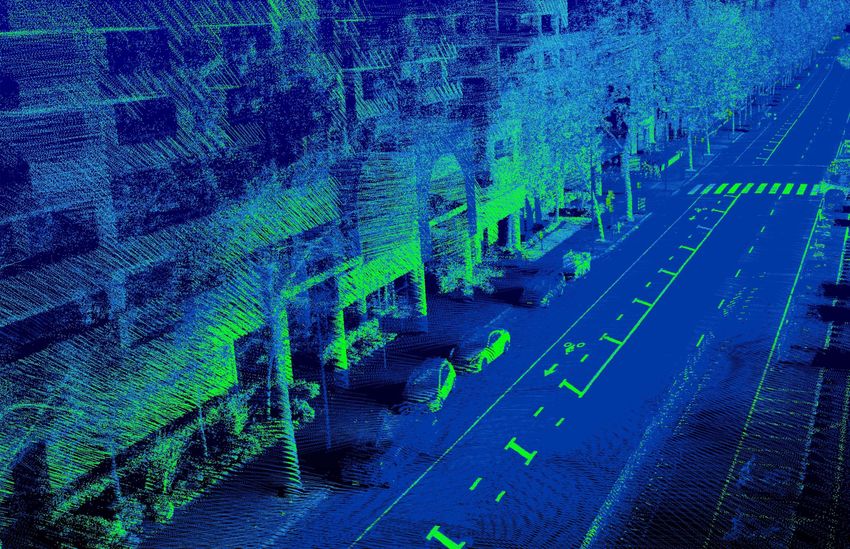
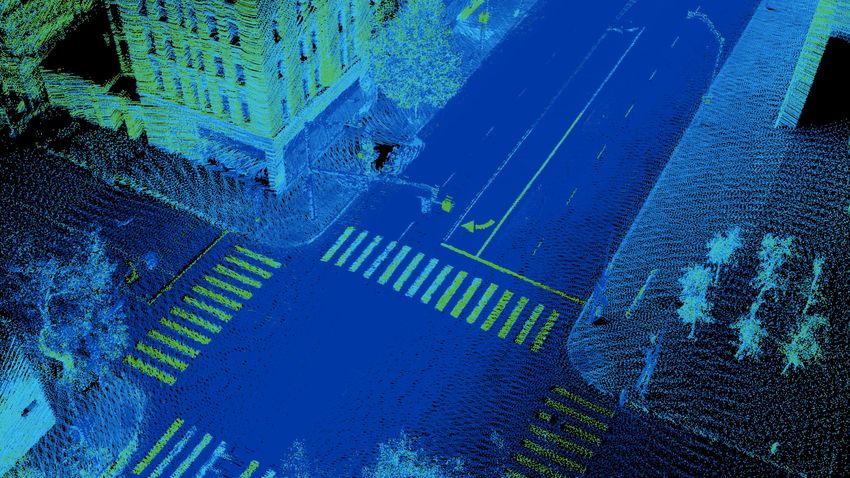
We Are The First Mover and Market Leader
2005 2007 TODAY HIGHLIGHTS
Invented Real- Began World’s Leading Lidar
Time 3D Lidar First Commercial Technology
Production of Real-
Time 3D Lidar
Dominated the market for 13 years
Broad product portfolio
Cumulative sales of over $570 million(1)
300+ customers, including major OEMs and
leading Tech companies
Global sales and mass scale manufacturing
25+ new market segments outside automotive
Backed by industry-leading strategic investors,
including Ford, Baidu, Nikon and Hyundai Mobis
____________________
(1) As of December 2019.
| Page 8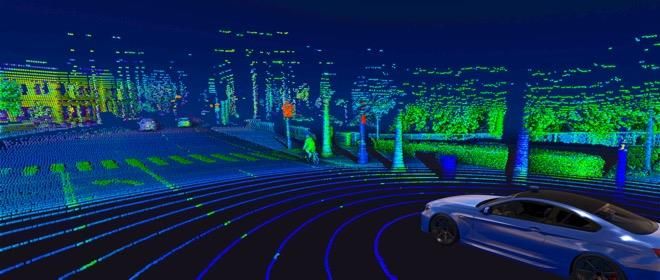
Velodyne is THE Leading Lidar Provider
                      $680M+                                                                 16
                                                                                  Signed / Awarded
                                                                                                         (2)
                                                                                                                                                 300+
                                                                                                                                                                       (3)
                                                                                                                                                                                                             55+
                                                                                                                                                                                                      Granted / Pending
                                                                                                                                                                                                                               (4)
                                                                                                                                                                                                                                     40,000+
                                                                                                                                                                                                                                      Units Shipped
                                                                                                                                                                                                                                                            (5)

                        2024 Projected                                                                                                             Customers
                      Revenue Opportunity                                        Multi-Year Contracts                                                                                                      Patents
                      ~50% Contracted (1)

David Hall invented smart                Strategic investment                    Opened advanced                                                        Strategic investment Production partnership Manufacturing  Acquired                    Strategic investment
   vision technology                     from Ford and Baidu               manufacturing facility in San Jose                                                from Nikon          with Veoneer agreement with Nikon Mapper.ai                   from Hyundai Mobis

                HDL-64E                   Puck                                                          Velarray               Alpha Prime                                                                          Veladome                   Velabit

                 First             Launched                                                        Launched Launched                                                                                            Launched                  Launched
               real-time,             Less than                                                     Lidar for  300 meter, high                                                                                   Near-object          Lidar for price-sensitive
                3D-lidar               1kg lidar                                                 consumer ADAS resolution lidar                                                                                 detection lidar             applications

                           2005 - 2016                                                2017                                                          2018                                                         2019                         2020
____________________
(1) Based on volume and price arrangements as of June 1, 2020. Contracts represent agreed upon terms and conditions but do not include firm commitment purchase orders. Actual sales may differ materially from projected volume.
(2) As of June 1, 2020.
(3) Represents the number of unique customers including distributors that purchased smart vision solutions from us in 2017, 2018 and 2019.
(4) As of June 30, 2020.
(5) As of December 31, 2019.

                              |                                                                                                                                                                                                                                   Page 9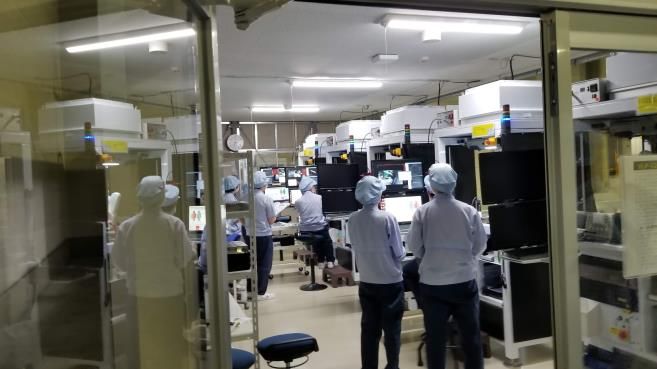
Velodyne Product Roadmap
                                                  Tireless Innovation to Bring New Technologies and Products

                                                                                                                                 Announced Future Products

Broad Product                                                                                                                                                       TM
  Portfolio                                                                                                                                              Vella
                     HDL-64E     HDL-32E       VLP-16            VLP-32             VLS-128               Velarray     Velabit        VelaDome           Software
                                             (Puck Series)   (Ultra Puck Series)   (Alpha Prime)

Architectures                  Surround View Rotational Hybrid Solid State                            Directional Solid State       Hemispherical         Software

    Key               Embedded Signal           Proprietary Calibration               Micro-Lidar Array
                                                                                                                     Custom ASICs                   IP Portfolio
Technologies         Processing Software          and Manufacturing                     Technology

                Full Range of Form                                                                  Low Power
                                                      Superior Perception                                                                   Durability
                      Factors                                                                      Consumption

                         Sensors are Ruggedized and Leverage Tightly Integrated Hardware and Software Solutions
                 |                                                                                                                                                   Page 10
Margin Expansion Through Increasing Software Content
Vella™ Software + Low Cost Velabit for cost efficient, highly profitable ADAS
Software solutions power the Vela Family of lidar products,
designed for automotive ADAS applications VellaTM Collision Warning System
Velodyne acquired Mapper.ai with 25 engineers in 2019.
Auto Pilot, Collision Avoidance, Pedestrian Automotive Emergency
Braking, and more available in 2020.
ADAS applications enabled by the Vela Family of products and
solutions contribute to roughly half of our current contracts.
Multiple OEMs are in development on Velodyne ADAS projects, with
initial deliverables in 2020.
High margin software subscriptions on broad installed base and IP
licensing are expected to drive incremental revenues and profitability.
| Page 11Our Investments Drive Gross Margin Expansion at Scale
Technology Miniaturization Proprietary Manufacturing IP
Micro-Lidar Arrays and custom ASICs enable mass Fully automated wafer-scale lidar
production at lower unit cost manufacturing processes
Manufacturing Partnerships Overseas Production
Partnerships add capacity and opportunity Established low cost production in Thailand
for higher margins
VLP-16 Velarray
(TSE: 7731) (NYSE: VNE) (NYSE: FN) Completed Transitioning
Transition Q3’20
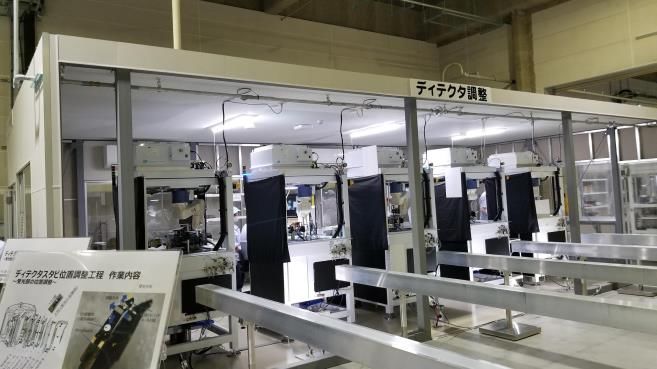
| Page 12Global Manufacturing Capacity to Address Growing Demand
San Jose, USA Sendai, Japan Chonburi, Thailand
| Page 13We Are Much More than an Autonomous Vehicle Company
ADAS & other applications comprise majority of revenue
2017 Today
Advanced Driver Assistance Systems (ADAS)
Robotics and Industrial
Mapping
Autonomous Vehicles (AV) Shuttles Autonomous Vehicles (AV)
Robotics and Industrial Smart City
Mapping Delivery
Very Limited Developing Limited Highly Many form Proven Many
expensive form factors durability applications affordable factors durability applications
Lidar Lidar
2017
$$$ Today $
| Page 14Highly Diversified Projects Across Industries
(Chart represents sensor units )
165 Projects Could Potentially Yield a Total of ~8M Units Shipped by 2025 Smart City
Shuttles
Mapping
Number of Projects
Advanced Driver Assistance Systems (ADAS) 58
Autonomous Vehicles (AV) 35
Delivery 11
Mapping 10
Robotics & Industrial 34 Delivery
Shuttles 11
Smart City 6
Total 165
(Stages of projects shown in the above table vary from signed / AV
awarded phase to pre-RFI phase)
ADAS
2020 2021 2022 2023 2024 2025
____________________
Note: The chart above reflects a visual representation of how we believe the market is developing based on multi-year commercial demands that we currently see from customers and is not indicative of projected revenue or unit shipment. Signed and awarded contracts
represent agreed terms and conditions of supply, but do not reflect firm orders unless and until purchase orders are received. To date, shipments under and revenue from these signed contracts have not been material. Based on data as of June 1, 2020.
| Page 15Barriers to Entry: Robust Durability of Installed Customer Base
Why We Have a Sticky Customer Base Our Commitment in Platform Development Drives Customer Loyalty
A Technology differentiation
B Lengthy and rigorous validation
process
C Long-term contracted volume
arrangements Production
Contract
Request for Quotation
D High switching costs (RFQ)
Request for Information
(RFI)
| Page 16Demand Curve Reflects a Growing Market Opportunity
(Chart represents sensor units )
(3)
Velodyne is currently in the process of negotiating RFIs, RFQs, and long-term contracts with many
customers. The below pipeline only reflects identified projects as of June 1, 2020.
$7Bn+
Cumulative Revenue Opportunity
Signed & Awarded Progression (2020 – 2025)
January 2019 January 2020 June 2020 Signed/Awarded
1 3 16
RFQ
165 Projects In Funnel
Number of Current Contracts / Pipeline RFI
Signed / Awarded 16
Additional Pipeline (2) 149
Total 165
Pre-RFI
2020 2021 2022 2023 2024 2025
____________________
Note: The chart above reflects a visual representation of how we believe the market is developing based on multi-year commercial demands that we currently see from customers and is not indicative of projected revenue or unit shipment.
(1) Signed and awarded contracts represent agreed terms and conditions of supply, but do not reflect firm orders unless and until purchase orders are received. To date, shipments under and revenue from these signed contracts have not been material. Based on data as of June 1, 2020.
(2) Additional Pipeline includes RFQ, RFI, and Pre-RFI projects. Pre-RFI projects are defined as i) a particular sensor and/or sensor set for a project has been identified, ii) the goal for a particular project has been identified, iii) pricing and the future ASP have been discussed, iv) an approximate volume growth over the next 2-5 years has been
discussed and identified and v) multiple meetings have taken place regarding the project with several technical discussion. There can be no assurance that any pre-RFI projects will result in significant future unit sales within any specific time frame, if at all.
(3) $7 billion+ represents estimated cumulative revenue opportunities inclusive of our signed and awarded contracts and current additional pipeline.
| Page 17Velodyne Believes It Is Well-Positioned to Capture Growth
Capitalize on Regulatory and
Win Additional Penetrate High Volume Expand Manufacturing
End Customer Demands for
Commercialization Contracts Markets Partnerships
Transportation Safety
Expand Global Customer
Develop Licensing Expand Software
Base and Channel Pursue Acquisitions
Opportunities Offerings
Relationships
TM
Vella
| Page 18Velodyne’s Competitive Moats
High switching cost as customers spend years and
1 millions of dollars developing and validating solutions
Entrenched 1 around Velodyne’s technology, including system design
Customer and software development
Relationships
Automated manufacturing techniques, deployed at high-
5 2 2 quality manufacturing partners, drive down costs and
expand our TAM at high margins and scale
Access to Driving ASP
Capital Reductions Technology, products and manufacturing methods
3 protected by comprehensive global patent portfolio
One-stop source for all machine vision needs across
4 broad end-market applications
4 3
Public currency and well-capitalized balance sheet will
Diverse Defendable IP 5 enable us to drive selective industry consolidation and
Product Portfolio Portfolio further differentiate us from competitors
| Page 19Strong And Experienced Public Company Leadership
David Hall Dr. Anand Gopalan
Founder & Executive Chairman Chief Executive Officer
Drew Hamer Marta Thoma Hall
Chief Financial Officer Chief Marketing Officer
Mike Jellen Rick Tewell
Chief Customer Officer Chief Operating Officer
James Graf Michael Dee
Chief Executive Officer of Graf Industrial President and Chief Financial Officer of Graf Industrial
| Page 20Financial Summary
How Our Contracts Work
Pre-RFI RFI RFQ Contract
Software Development
System and Validation
Discovery Initial Testing Production (Recurring)
Specification Hardware System
Validation
1-6 months 3-6 months Up to 12 months Up to 12 months
Contract Purchase Order
Year 1 Year 2 Year 3 Year 4 Year 5
Awarded / Signed for Year 1
Customers typically buy products on a spot basis for several years during pre-contract process
Customers forecast purchase volume for each contract year, with contracted ASPs for indicated volume
Contracted ASPs drop as volumes increase
Binding purchase order for Year 1 confirmed upon signing contract
Non-recurring engineering (NRE) revenues may be generated in Year 1 of contracts
Purchase orders for subsequent years typically to be confirmed by September, providing solid visibility on production volume and
revenues more than a year forward
Velodyne can renegotiate pricing upward, at its discretion, if projected volume for any year drops more than 20% below forecast
| Page 22Summary of Multi-Year Contracts
Number of Signed and January 2019 January 2020 June 2020
Awarded Contracts
1 3 16
Projected Revenue ($mm)
Application 2020 2021 2022 2023 2024
Last Mile Delivery (1) $9.3 $26.4 $75.5 $150.0 $149.3
RoboTaxi 15.5 14.3 33.4 96.0 123.5
ADAS 5.4 7.6 17.7 47.0 53.2
Shuttles 1.9 2.9 3.5
Mapping 0.6 0.9 0.8
Robotics 0.2 0.4 0.9
Smart City 0.2 0.6 0.6
Total Signed & Awarded (16 Contracts) $33.1 $53.0 $132.4 $293.0 $326.0
% of Projected Revenue 32.6% 34.9% 53.1% 71.1% 47.7%
Projected Total Revenue $101.7 $152.0 $249.4 $412.1 $684.1
____________________
Note: Awarded multi-year contracts represent agreed terms and conditions of supply, but do not reflect firm orders unless and until purchase orders are received.
(1) One customer accounts for $316.3mm in cumulative projected revenue between 2020 and 2024.
| Page 23Product Mix Trend By Revenue
Revenue Detail
($ in mm) $684.1
ASP reduction proactively driven by
Velodyne to drive lidar adoption $412.1 Commercial Revenue(2)
$249.4
$182.1 $142.9
(1)
$152.0
$105.5 $101.7
Pre-Production Spot Buys(3)
FY2017 FY2018 FY2019 FY2020E FY2021E FY2022E FY2023E FY2024E
Weighted
~$17,900 ~$10,800 ~$7,100 ~$5,200 ~$3,800 ~$1,000 ~$700 ~$600
ASP ($)
% Product Mix Trend By Revenue
Vela Family
License, Subscription
Surround-View Lidar(4)
Services
FY17
____________________
FY18 FY19 FY20E FY21E FY22E FY23E FY24E
Note: 2020 and beyond are estimates of potential revenue opportunities.
(1) Net Sales Revenue adjusted for one-time customer refund $4.1mm. Full Year US GAAP Net Revenue is $101.4mm. (3) Includes sales that are not part of a multi year agreement, generally spot buys used for development of new programs.
(2) Includes sales from multi year agreements plus software and subscription revenue for 2021-2024. (4) Includes VLS-128, HDL-64, VLP-32, HDL-32 and VLP-16.
| Page 24Velodyne Forecasts Positive EBITDA and FCF in FY22
EBITDA(1) Free Cash Flow(2)
($ in mm) ($ in mm)
$148.8
$103.7
$56.7 21.8% $29.9 15.2%
$15.5 (2.7%) $6.6 7.3%
(4.9%)
13.8%
6.2% 2.6%
(45.9%) ($4.1)
($7.5)
(52.8%) (51.2%) ($48.5) (84.2%)
($85.6)
($55.7) ($52.0)
FY19 FY20E FY21E FY22E FY23E FY24E FY19 FY20E FY21E FY22E FY23E FY24E
Free Cash Flow % of Revenue
EBITDA % of Revenue
____________________
(1) EBITDA defined as Operating Income plus Depreciation & Amortization. Please reference page titled, “Reconciliation of Non-GAAP Financials” in the back of this presentation
(2) Free Cash Flow defined as Cash Flow from Operations minus Capital Expenditures. Please reference page titled, “Reconciliation of Non-GAAP Financials” in the back of this presentation.
| Page 25Our Investments Drive Gross Margin Expansion at Scale
Gross Margin Projections How We Expect to Realize This Expansion
($ in mm)
A
MLA and custom ASICs enable mass
production at lower unit costs
E 57.8%
50.4% 53.3%
D 46.4% Fully automated wafer scale lidar
45.6% B
manufacturing processes
44.5% $395.3
43.0%
40.1%
32.1%
C
Partnerships add capacity and
31.5% opportunity for higher margins
$219.5
20.7%
17.6% $125.6 D
Established low cost production in
Thailand Completed Transitioning
$70.6 Transition Q3’20
$33.8 $32.0
TM
Purpose-built software to drive
FY19 FY20E FY21E FY22E FY23E FY24E E
further margin expansion Vella
Gross Profit Total Gross Margin Sensor Gross Margin
| Page 26Continuing Operating Leverage to Drive Profitability
R&D Expenses S&M Expenses G&A Expenses
($ in mm) ($ in mm) ($ in mm)
53.9%
50.5%
34.0%
28.0%
24.0% 23.3%
20.0% 20.7% 19.0%
18.2%
13.0% 11.0% 10.5% 8.5%
10.0% 10.0%
7.1% 7.1%
$136.8
$98.9
$69.8 $68.4
$56.9 $51.4 $51.7 $48.6
$41.2
$27.4 $23.7 $21.2 $29.3
$21.9 $18.5 $19.8 $20.1 $16.0
FY19 FY20E FY21E FY22E FY23E FY24E FY19 FY20E FY21E FY22E FY23E FY24E FY19 FY20E FY21E FY22E FY23E FY24E
R&D % of Revenue S&M % of Revenue G&A % of Revenue
____________________
Note: These projections are based on the assumption that we will continue to execute on our vision outlined elsewhere in this presentation.
| Page 27Transaction Overview and Validation
Detailed Transaction Overview
Key Transaction Terms Illustrative Pro Forma Valuation
$200mm minimum cash proceeds inclusive of PIPE proceeds and transaction Velodyne Illustrative Share Price $10.25
expenses Pro Forma Shares Outstanding 172.331
At least $150mm in PIPE commitments before transaction announcement Pro Forma Equity Value $1,766
(1)
Additional shares to be granted under an earnout to current Velodyne owners and (-) Assumed Pro Forma Net Cash (200)
SPAC founders (2 million and 275K, respectively), if the stock trades at or above Pro Forma Enterprise Value $1,566
$15 per share for 20 out of 30 trading days at any time before 6 months following Transaction Multiple Metric
completion of the business combination EV / 2024E Revenue $684 2.3x
Pro Forma Ownership @ $10.25 / Share (2)
Founder Illustrative Sources and Uses
Shares
1.3%
SPAC Sources $ % Shares
Shares
6.6% PIPE
Seller Rollover $1,472 83.5% 143.576
Equity Additional PIPE Equity 150 8.5% 15.000
8.7%
SPAC Cash in Trust (3) 117 6.7% 11.455
Founder Shares 24 1.3% 2.300
Total Sources $1,763 100.0% 172.331
Seller Rollover Uses $ %
83.3%
Seller Rollover $1,472 83.5%
Cash to Balance Sheet 192 10.9%
Cash to Velodyne Shareholders 50 2.8%
____________________ Estimated Fees & Expenses 25 1.4%
Note: Dollars in millions.
(1) Assumes pro forma net cash of $200mm consisting of current net cash of $8mm and cash to the balance sheet of $192mm. Founder Shares 24 1.3%
(2) Sources and uses percentages do not match ownership percentages as a result of assumption of shares trading at $10.25. Total Uses $1,763 100.0%
(3) Assumes no redemption of public shares, balance as of 5/28/2020.
| Page 29Who We Compare To (And Who We Don't)
Vision-Based
Computing Platforms Disruptive AutoTech Players Legacy Tier 1s
Software-Rich Solutions
Our products enable a breadth of Lidar serves as a primary modality of Redundancy is increasingly End markets limited to automotive
solutions across end markets machine perception recognized as essential to road safety
We are creating an ecosystem around We are a pure-play vision provider Lidar is becoming a standard feature Limited technological innovation
our software-embedded hardware for ADAS and AV
| Page 30Operational Benchmarking
All metrics reflect CY2021E
Computing Platforms Vision-Based Software-Rich Solutions Disruptive AutoTech Players
unless otherwise noted
Median: 12.3% Median: 29.5% Median: 32.0%
YoY Revenue Growth
128.1% Overall Median:
65.2% 66.0% 26.4%
46.5% 41.1% 32.2% 31.9% 21.0%
17.2% 7.3% 12.5% 14.2%
VELODYNE VELODYNE NVDA XLNX MBLY AMBA NKLA TSLA PLUG BLDP MELE-BE CREE
(CY2023E) (CY2024E) (CY2018E) (CY2024E)
Median: 67.5% Median: 67.8% Median: 23.8%
Gross Profit Margin
68.5% 75.3% Overall Median:
66.6% 60.3%
53.3% 57.8% 37.7%
40.9% 34.4%
25.3% 22.3% 20.8% 17.9%
VELODYNE VELODYNE XLNX NVDA MBLY AMBA MELE-BE CREE BLDP NKLA TSLA PLUG
(CY2023E) (CY2024E) (CY2018E) (CY2024E)
Median: 36.6% Median: 31.2% Median: 13.8%
Overall Median:
EBITDA Margin
56.6% 15.8%
42.5%
21.8% 30.7% 26.2%
13.8% 5.8% 15.9% 15.6% 11.9% 6.6%
(12.5%)
(CY2023E)
VELODYNE (CY2024E)
VELODYNE NVDA XLNX (CY2018E)
MBLY AMBA MELE-BE CREE TSLA PLUG (CY2024E)
NKLA BLDP
____________________
Source: FactSet and CapIQ. Market data as of July 1, 2020.
Note: Mobileye pre-announcement unaffected trading price as of March 10, 2017.
| Page 31Valuation Benchmarking
All metrics reflect CY2021E
Computing Platforms Vision-Based Software-Rich Solutions Disruptive AutoTech Players
unless otherwise noted
Median: 10.07x Median: 9.79x 23.92x Median: 6.86x
Overall Median:
EV / Revenue
13.43x 14.76x 7.04x
10.72x
6.70x 7.37x 6.35x 5.67x 5.18x
3.80x 4.83x
2.29x
VELODYNE VELODYNE NVDA XLNX MBLY AMBA BLDP PLUG NKLA TSLA CREE MELE-BE
(CY2023E) (CY2024E) (CY2018E) (CY2024E)
Median: 0.85x Median: 0.35x Median: 0.29x
EV / Revenue / Growth
Overall Median:
0.92x 0.36x
0.78x 0.75x
0.39x 0.32x 0.40x 0.33x 0.25x 0.15x
0.06x 0.03x 0.08x
VELODYNE VELODYNE XLNX NVDA AMBA MBLY BLDP CREE PLUG MELE-BE TSLA NKLA
(CY2023E) (CY2024E) (CY2018E) (CY2024E)
Median: 26.72x Median: 54.96x Median: 38.18x
83.87x 89.77x
Overall Median:
EV / EBITDA
33.65x
40.70x 35.65x
27.62x 31.64x 26.06x
21.80x 19.77x
10.52x (1)
NM NM
VELODYNE VELODYNE NVDA XLNX AMBA MBLY PLUG TSLA CREE MELE-BE BLDP NKLA
(CY2023E) (CY2024E) (CY2018E) (CY2024E)
____________________
Source: FactSet and CapIQ. Market data as of July 1, 2020.
Note: Assumes Velodyne Pro Forma Enterprise Value of $1.566bn. Mobileye pre-announcement unaffected trading price as of March 10, 2017.
(1) Represents an EV / EBITDA of 111.66x.
| Page 32Transaction Priced At A Discount To Peer Multiples
($ in mm)
$6,156
$3,563 ~65% Discount
$3,420
$1,566 ~45% Discount
$1,979
Discount Rate: 20%
5.00x – 9.00x 2024E Revenue 5.00x – 9.00x 2024E Revenue 2.29x 2024E Revenue
Implied Future Enterprise Value Implied Discounted Enterprise Value Post-Money Enterprise Value
Implied EV Based on Comparable Companies’ Current Trading Valuations Transaction Value
Summary of Approach
Applies a range of 5.00x – 9.00x multiples to Velodyne’s 2024E Revenue to arrive at an Implied Future Enterprise Value. That Future Enterprise Value is discounted 3
years back to today to arrive at an Implied Current Enterprise Value.
The applied range of multiples is centered around the median of Velodyne’s peer group (7.04x), with sensitivity built in on both the high and low ends.
2024E projected financial based valuation is the appropriate approach given the contracted nature of Velodyne’s revenue in the future.
____________________
Note: Figures in bar charts represent current enterprise value. Dollars in millions.
| Page 33Thank You! | Page 34
Reconciliation of Non-GAAP Financials
EBITDA
($ Million)
                                 FY17A     FY18A     FY19A     FY20E     FY21E     FY22E    FY23E    FY24E
GAAP Operating Income             $24.8    ($56.2)   ($69.0)   ($63.9)   ($16.8)     $7.2    $50.1   $141.5
  Customer Refund                  $0.0      $0.0      $4.1      $0.0      $0.0      $0.0     $0.0     $0.0
  Restructuring Costs              $0.0      $0.0      $0.0      $2.4      $0.0      $0.0     $0.0     $0.0
  Depreciation & Ammortization     $3.4      $7.9      $9.3      $9.5      $9.3      $8.3     $6.6     $7.3
EBITDA                            $28.2    ($48.3)   ($55.7)   ($52.0)    ($7.5)    $15.5    $56.7   $148.8

Free Cash Flow
($ Million)
                                 FY17A     FY18A     FY19A     FY20E     FY21E     FY22E    FY23E    FY24E
Cash Flow from Operations        ($12.6)   ($30.5)   ($43.2)   ($82.5)    ($0.1)    $12.6    $37.9   $111.7
  Capital Expenditures            $18.1      $6.9      $5.2      $3.1      $4.0      $6.0     $8.0     $8.0
Free Cash Flow                   ($30.7)   ($37.4)   ($48.5)   ($85.6)    ($4.1)     $6.6    $29.9   $103.7

              |                                                                                               Page 35
You can also read