20 August 2020 Alison Watkins Group Managing Director Peter West Managing Director, Australia - Bell Direct
←
→
Page content transcription
If your browser does not render page correctly, please read the page content below
20 August 2020

               Alison Watkins                  Peter West
               Group Managing Director         Managing Director, Australia

               Greg Barnes                     Ana Metelo
               Group Chief Financial Officer   Group Head, Investor Relations

ccamatil.com
DISCLAIMER

                                                                                                                                                 ccamatil.com
The material in this presentation is general background information about Coca-Cola Amatil and its activities current as at
the date of the presentation. It is information given in summary form and does not purport to be complete.

Information in this presentation is not intended to be relied upon as advice to investors or potential investors and does not
take into account the financial situation, investment objectives or needs of any particular investor.

This presentation also includes July and August trading data, which has yet to be audited externally.

Before making any investment or other decision, investors should consider these factors, and consult with their own legal,
tax, business and/or financial advisors.

Coca-Cola Amatil advises that these presentation slides and any related materials and cross-referenced information,
contain forward looking statements which may be subject to significant uncertainties outside of Coca-Cola Amatil’s control,
especially during the global COVID-19 pandemic.

No representation is made as to the accuracy or reliability of forward-looking statements or the assumptions on which
they are based.

Actual future events may vary from these forward-looking statements and you are cautioned not to place reliance on any
forward-looking statement.

                                                                                                        Coca-Cola Amatil 2020 Half Year Result     2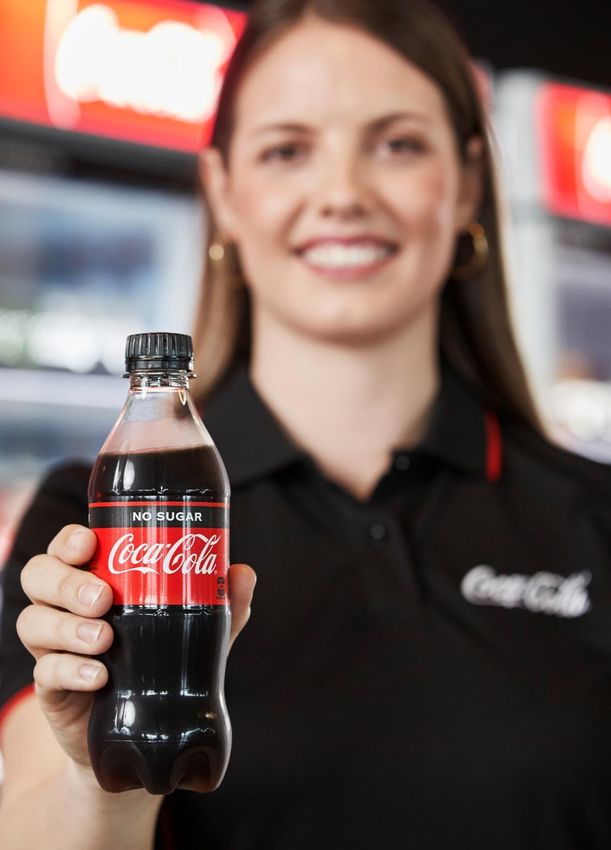
AGENDA

                                                                                                            ccamatil.com
GROUP PERFORMANCE   PERFORMANCE      FINANCIALS    AUSTRALIA     PACIFIC
                    OVERVIEW                       PERFORMANCE   PERFORMANCE

Alison Watkins      Greg Barnes      Greg Barnes   Peter West    Alison Watkins

INDONESIA & PAPUA   GROUP STRATEGY
NEW GUINEA          AND PROGRESS
PERFORMANCE         UPDATE

                                     QUESTIONS
Alison Watkins      Alison Watkins
                                     & ANSWERS

                                                                   Coca-Cola Amatil 2020 Half Year Result     3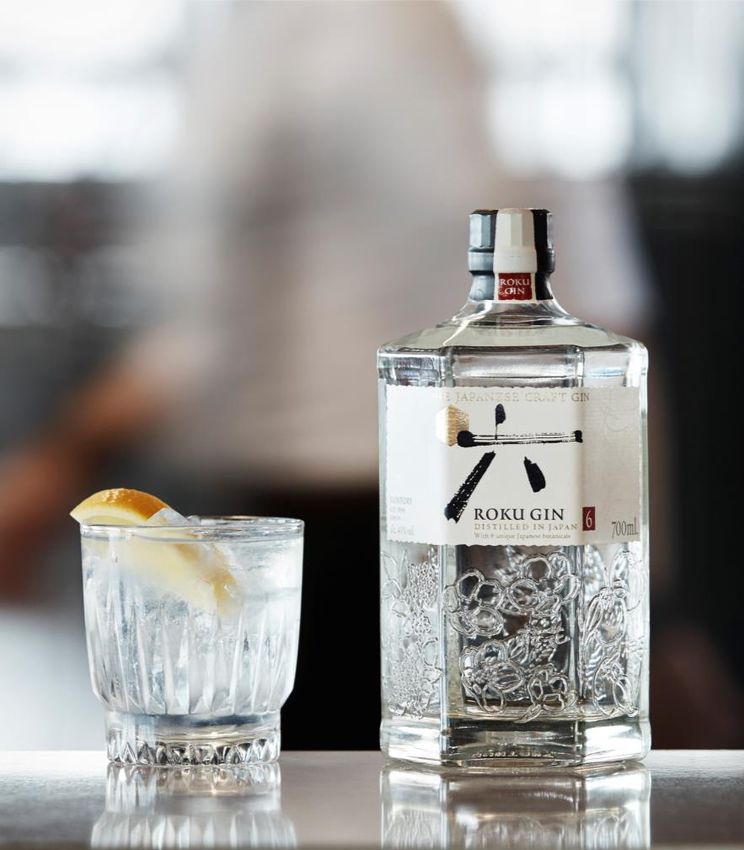
ccamatil.com
GROUP
PERFORMANCE
Alison Watkins Group Managing Director

                                         Coca-Cola Amatil 2020 Half Year Result      4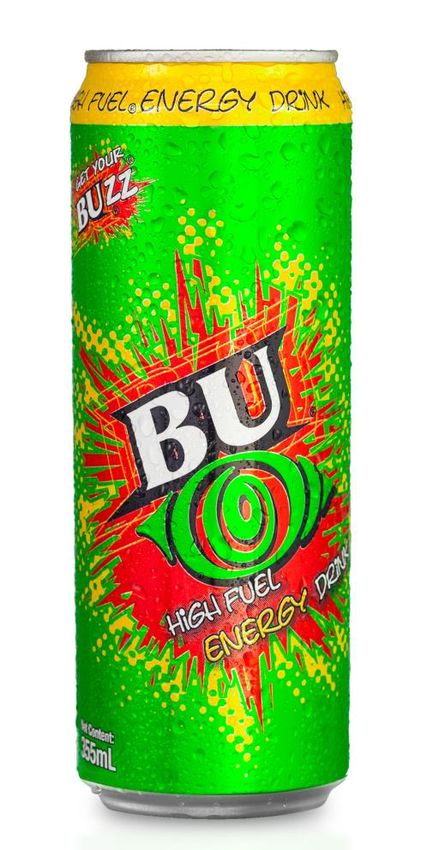
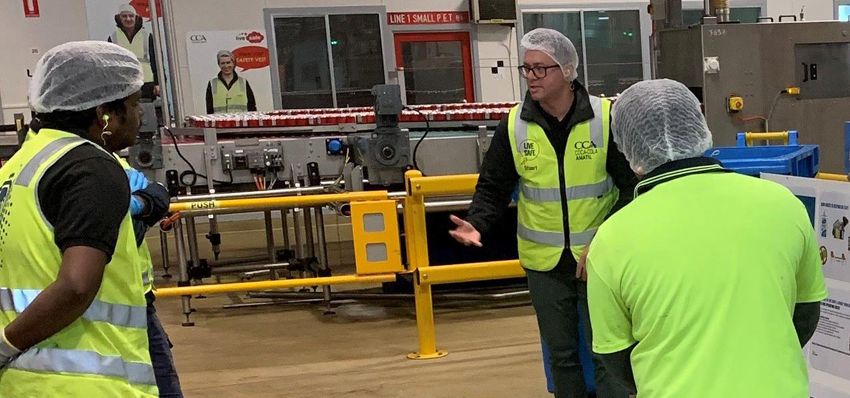
ALL IN THIS TOGETHER - WE ARE GRATEFUL FOR THE

                                                                                                           ccamatil.com
CONTRIBUTION AND RESPONSE OF ALL OUR STAKEHOLDERS

OUR PEOPLE, OUR PARTNERS, OUR CUSTOMERS, OUR CONSUMERS, AND OUR COMMUNITIES

                                                                  Coca-Cola Amatil 2020 Half Year Result     5
COVID-19: CLEAR PRIORITIES FROM THE VERY START.
ccamatil.com
RESILIENCE ESTABLISHED.
PEOPLE PARTNERS CUSTOMERS COMMUNITIES/
Focused on protecting Worked closely with our Maintained operational CONSUMERS
our people partners agility and supported our
Initiatives to support our
Safety and hygiene Incorporated learnings from customers
communities and
protocols in place across the Coca-Cola Responded to channel shifts consumers
System and changed environment
Redeployment of activity- Product donations
based workers Reviewed joint plans Enhanced customer support
Product availability
Remote working Supply chain planning
Produced and donated hand
sanitiser in Fiji and
Indonesia
BUSINESS CONTINUITY
Dynamic and conservative scenario planning; cross-functional commercial response covering the areas of Governance & Leadership,
Scenario Planning, Supply Chain, Sales & Distribution and Cost Structure
Coca-Cola Amatil 2020 Half Year Result 6
1H 2020 GROUP - FINANCIALS
ccamatil.com
TRADING REVENUE1 Strong start to the year with our Group Trading Revenue up by 2.4% in 1Q 2020.
Trading revenue declined by 9.2% for the half driven by COVID-19 impacts across all our markets.
$2,185.9m
-9.2%
EARNINGS EBITDA1 of $370.5 million reflecting volume impact on margins, partially offset by cost savings of ~$60
million of the $140 million targeted for delivery in 2020
EBITDA1 EBIT1 of $190.2 million down 34.4%, reflecting fixed nature of depreciation.
$370.5m
-19.4%
NPAT1 of $112.1 million supported by lower finance costs and a lower effective tax rate
FREE CASH FLOW Strong cash generation:
& NET DEBT Free cash flow1 of $216.7 million, a modest decline of 11.6%
Cash realisation1 was 111.8%
NET DEBT
reduced by Net debt reduction of $49.9 million since 28 June 2019
$49.9m
Unfranked interim dividend of 9.0 cents per share, signifying the Board’s confidence in the strength of the
business
1 Ongoing refers to continuing operations results adjusted to exclude non-trading items Coca-Cola Amatil 2020 Half Year Result 7
1H 2020 GROUP – ADDITIONAL DEVELOPMENTS
ccamatil.com
STRENGTH OF COCA-COLA CONTINUED
IMPROVED EMPLOYEE
GAINED MARKET SHARE TRADEMARK & ENERGY SUSTAINABILITY
ENGAGEMENT
BRANDS INITIATIVES
Volume and value share gains in • 8.8% sugar reduction in our Improvement in employee
AUSTRALIA1 NEW ZEALAND1
Australia and New Zealand1. Australia NARTD portfolio4. engagement5 in 2020 vs 2019:
Increased share of Sparkling in Volume Coca-Cola
Indonesia2. COCA-COLA Share No Sugar • Signed heads of agreement Group +4pts
+0.3pts Revenue3
+19% with Dynapack to build bottle-
to-bottle grade PET recycling Australia +5pts
Value Value
facility in Indonesia.
ENERGY share Share
+1.5pts +0.6 pts • Supported our communities
during COVID-19, bushfires,
and floods through product
and cash donations and
production and donation of
hand sanitiser for health and
front-line workers in Fiji and
Indonesia.
1 Australia: NARTD share of Grocery and Convenience and Petroleum. Source: IRI Australia YTD to 28 June 2020 scanned data;
NZ: NARTD share of Grocery and Convenience and Petroleum. Source: Nielsen YTD to 21 June 2020 scanned data;
2 Indonesia: Nielsen data; NARTD YTD June 2020 scanned data;
3 New Zealand 1H 2020 Ex factory data Coca-Cola Amatil 2020 Half Year Result 8
4 2019 data. Sugar measurement is portfolio-wide weighted volume average total sugar content grams per 100ml. Baseline is MAT 31 December 2015
5 June 2020 Pulse Engagement survey – Amatil Group Office and Australian business
ccamatil.com
HY20 PERFORMANCE
OVERVIEW
Greg Barnes Group Chief Financial Officer

                                            Coca-Cola Amatil 2020 Half Year Result     9
ccamatil.com
FINANCIALS

             Coca-Cola Amatil 2020 Half Year Result   10
INCOME STATEMENT
ccamatil.com
Revenue declined by $220.5 million with the
businesses delivering performances in the
range of -23.0% to -2.3%3 vs prior comparable
$ MILLION HY20 HY19 CHANGE % period (pcp)
Ongoing1 Direct Marketing Expenditure (DME) was
down $9.3 million vs pcp
Revenue 1 2,185.9 2,406.4 (9.2)
EBITDA decreased by 19.4%, reflecting
EBITDA 370.5 459.7 (19.4) volume impact on margins, partially offset by
EBIT 190.2 289.9 (34.4) ~$60 million in cost savings (of the $140
million targeted for delivery in 2020)
Net finance costs (32.5) (34.7) (6.3)
Net finance costs relatively stable year on
Taxation expense (43.8) (73.6) (40.5) year at $32.5 million, benefitted from lower
Non-controlling interests (1.8) (8.3) (78.3) cash rate
NPAT – ongoing1 112.1 173.3 (35.3) Effective tax rate of 27.8% or 1.1 pt
favourable vs pcp
Profit from discontinued operation after
- 6.2 nm NPAT of $112.1m, reflected EBIT decline
income tax
supported by flat finance costs and lower
Non-trading items after income tax2 (162.2) (11.5) nm effective tax rate
Non-controlling interests – non trading
41.4 - nm
items
(Loss)/profit attributable to Coca-
(8.7) 168.0 (105.2)
Cola Amatil Limited shareholders
1 Presented on an ongoing basis. The ongoing refers to continuing operations results adjusted to exclude non-trading items
2 Non-trading items relate mainly to impairment charges of the Indonesian and Paradise Beverages businesses for 1H 2020
and Australian business transformation or restructuring activities for 1H 2019. Refer to Notes 3, 5 and 15 of the Financial
Coca-Cola Amatil 2020 Half Year Result 11
Report for further details
3 Local currencyNON-TRADING ITEM EXPENSES
ccamatil.com
Non-trading item expenses are mainly non-
Non-cash impairment of $176.6m (post tax, pre-minorities),
comprising $143.4m from the Indonesian business
cash impairments and COVID-19 related tax
benefits
NON
1H 2020 FURTHER DETAILS Impairments reflect impact of COVID-19 on
BEFORE TAX AFTER CONTROLLING CCA LTD
AND TAX TREATMENTS business valuations due to latest views of
TAX BENEFIT TAX INTERESTS (NCI) SHARE
($M) future cash flows and valuation constraints
ADJUSTMENT
under the accounting standards
Impairments
Rising COVID-19 infection rate in Indonesia
- Indonesia 175.9 (32.5) 143.4 (42.2) 101.2 The absence of tourism is expected to
- Paradise Beverages continue impacting the Fiji and Samoa
16.4 0.4 16.8 (2.1) 14.7 economies
Fiji & Samoa
- Equity accounted We remain confident in the long-term outlook
12.1 - 12.1 - 12.1 of these businesses
investments
Other 6.1 (1.8) 4.3 - 4.3 Tax-related stimulus that favourably impact
deferred tax balances disclosed as non-trading
Total before tax 210.5 (33.9) 176.6 (44.3) 132.3 items (NTIs)
Indonesia tax rate
(10.0) (10.0) 2.9 (7.1)
change
NZ Building tax
(4.4) (4.4) - (4.4)
allowance
Total 210.5 48.3 162.2 (41.4) 120.8
Coca-Cola Amatil 2020 Half Year Result 12REVENUE MOMENTUM DISRUPTED BY COVID-19.
ccamatil.com
BUSINESSES ARE SLOWLY RECOVERING Restrictions eased in
New Zealand. Easing of
Revenue Growth YoY % Change restrictions in Australia,
20% COVID-19 stockpiling in Indonesia and PNG
Australia and New
Zealand COVID-19 Festive in
10% lockdowns Indonesia
0%
-10%
Bushfires in Australia
-20%
-30%
Reinstatement
-40% of restrictions
in Victoria
-50%
Jul-19 Aug-19 Sep-19 Oct-19 Nov-19 Dec-19 Jan-20 Feb-20 Mar-20 Apr-20 May-20 Jun-20 Jul-20
Australia New Zealand Indonesia H2
Coca-Cola Amatil 2020 Half Year Result 131H20 TRADING PERFORMANCE IN ALL OUR SEGMENTS WAS
ccamatil.com
IMPACTED BY COVID-19
Ongoing EBITDA Breakdown ($m) AUSTRALIA
NARTD volume down 8.0%, further reflected impact of bushfires.
HY20 HY19 CHANGE (%) Encouraging momentum as restrictions eased. EBITDA of $186.3 million,
down by 23.6% vs pcp. Australia EBIT margin decline of 3.7 pts reflected
AUSTRALIA 186.3 243.8 (23.6) adverse channel and portfolio mix from changes in consumer behaviour due
PACIFIC 80.7 84.2 (4.2) to government restriction measures. Strong performance in Spirits.
INDONESIA & PAPUA NEW GUINEA 71.9 98.8 (27.2) PACIFIC
CORPORATE & SERVICES 31.6 32.9 (4.0) NZ – Momentum with revenue growth of 2.5% and EBIT growth of 13.2%
in the first quarter. Volume declined 5.6% for the half driven by lockdowns,
TOTAL EBITDA 370.5 459.7 (19.4)
partially mitigated by strong revenue growth management resulting in 2.3%
constant currency revenue decline. Experiencing a steady recovery following
DEPRECIATION & AMORTISATION (180.3) (169.8) 6.2
the relaxation of the domestic restrictions.
GROUP EBIT 190.2 289.9 (34.4)
Fiji result reflected the challenging economic backdrop compounded by the
impact of COVID-19 related travel restrictions on the tourism industry.
EBITDA share by segment
INDONESIA & PAPUA NEW GUINEA
(% of total)
Solid 1Q 2020 volume in Indonesia, followed by abnormal festive trading
50.3% conditions resulted in a volume decline of 30.8% in average daily sales
volumes versus festive period last year.
EBITDA of $41.8 million benefitted from successful cash management and
tight cost control across functions, which delivered $16.1m in operational
8.5% efficiencies.
21.8% PNG returned to volume growth in the last two months of the half.
19.4%
Coca-Cola Amatil 2020 Half Year Result 14CASH FLOW – ONGOING1
ccamatil.com
Improved Cash realisation at 111.8% or 15.2 pts higher year on year,
underpinned by disciplined working capital management
Working capital was favourable by $83.0 million driven
$ MILLION HY20 HY19 VARIANCE by improved debtors and tight inventory management
Net interest and other finance costs paid increased
ONGOING EBITDA 370.5 459.7 (89.2)
by $6.5 million due to changes in timing of cash receipts
and payments
Changes in adjusted working capital2 85.1 2.1 83.0
Capex up by $14.5 million to $112.5 million driven by
Net interest and other finance costs paid (35.6) (29.1) (6.5) payments in PNG and New Zealand on projects
committed in 2019
Income taxes paid (53.6) (55.6) 2.0 Cash realisation4 improved 15.2 pts year on year to
111.8%, reflecting disciplined working capital
Movement in other items3 (37.6) (37.7) 0.1 management during the period
OPERATING CASH FLOWS 328.8 339.4 (10.6)
Capital expenditure (112.5) (98.0) (14.5)
Historical Cash Realisation
Other 0.4 3.7 (3.3) 120%
110%
FREE CASH FLOWS 216.7 245.1 (28.4)
100%
90%
80%
CASH REALISATION4 - ONGOING 111.8 % 96.6 % 15.2 points 2018 1H 2019 2019 H1 2020
1 Ongoing refers to continuing operations results adjusted to exclude non-trading items
2 Working capital is adjusted to exclude the impact of non-cash flow and non-operating items such as foreign exchange translation,
impacts of acquisitions and disposals of businesses and payables relating to additions of property, plant and equipment
3 Mainly comprising of movements in prepayments and provisions
4 Operating cash flows divided by NPAT (before minority interests), adding back depreciation and amortisation expenses before tax Coca-Cola Amatil 2020 Half Year Result 15BALANCE SHEET STRENGTHS
ccamatil.com
Net debt decreased by $49.9 million since 28 June 2019
Net debt decreased by $49.9 million from June 2019, improved debt to $1,730.7 million mainly reflecting strong working
mix and strong investment grade capital management. The decrease was after the $188.2
million payment of the 2019 final dividend paid in 1H
NET DEBT ($ MILLION) AND ONGOING1 EBIT INTEREST COVER (X TIMES) 2020
3400 Strengthened debt facilities:
9
10 10* 11
2900
9 − Increased debt facilities to $2.7 billion, comprised of
8 8
committed undrawn bank facilities of ~$630 million and
9
7
6*
capital markets issuance
2400
7
5
1752 * * Lease Liabilities
1900
1731 5
1759
1871
3
Net debt − Increased average debt maturity profile of 5.8 years
1400
1633 EBIT interest cover
900
1146
1337 1328
1222 1208
1
− $771.0m held in cash excluding PNG
993 -1
400
− Sufficient available liquidity in place to service Debt
-3
maturities of ~$100 million in 2H 2020
-100
-5
FY12 FY13 FY14 FY15 FY16 FY17 FY18 FY19 1H20
PNG cash and funds held in government bills was $170.4
*FY19 and 1H20 have been determined in accordance with the new lease accounting standard AASB16
million at 1H20, representing a $119.3 decrease vs pcp.
Net debt to EBITDA1 from 1.8x in FY 2019 to 1.9x in 1H
2020
1 Ongoing refers to continuing operations results adjusted to exclude non-trading items
Coca-Cola Amatil 2020 Half Year Result 16ccamatil.com
AUSTRALIA
PERFORMANCE
Peter West Managing Director, Australia
Coca-Cola Amatil 2020 Half Year Result 17AUSTRALIA
ccamatil.com
Australia NARTD volumes declined by 8.0% while revenue
declined by 9.3%
Lower volume and revenue driven by the bushfires and COVID-19
restrictions. EBIT impacted by shifts in channel and portfolio mix NARTD trading revenue per unit case was 1.4% lower than
prior year comprising:
$ MILLION HY20 HY19 CHANGE % o 1.1% increase from container deposit scheme charges
o 2.5% decrease from product/channel mix
Trading Revenue – NARTD1 1,101.9 1,215.3 (9.3)
The NARTD category grew in measured market4 value +2.0%
Trading Revenue - Alcohol & Coffee 194.2 205.1 (5.3) and declined in volume by 0.8% with Amatil outperforming the
market, particularly in volume with growth of 3.3% – a
testimony to the strength of our brands and strong market
TOTAL TRADING REVENUE 1,296.1 1,420.4 (8.8) execution
Alcohol & Coffee revenue declined by 5.3% year-on-year
NARTD - VOLUME (MILLION UNIT CASES) 2 134.7 146.4 (8.0)
driven by the impact of On-Premise closures on Alcohol and
cafe and pub & club outlet closures on Coffee
NARTD - REVENUE PER UNIT CASE ($) 8.18 8.30 (1.4)
EBITDA of $186.3 million, down by 23.6% vs pcp; EBIT of
$118.7 million, down 35.5% vs pcp
ONGOING EBITDA3 186.3 243.8 (23.6)
EBIT was impacted by:
ONGOING EBIT 118.7 183.9 (35.5) - Mix shift to lower margin channels (Grocery and National
QSRs) and increased At Home consumption through multi-
serve PET and multi-pack cans
EBIT MARGIN (%) 9.2 12.9 (3.7) pts
- Lower absorption of fixed cost base on lower volumes,
partially offset by $37 million of savings achieved in the
ROCE – ONGOING (%) 21.2 24.4 (3.2) pts
first half
1 Non-alcohol ready to drink beverages
2 A unit case is the equivalent of twenty-four 8 US oz (237ml) serves or 5.678 litres
3 Ongoing refers to continuing operations results adjusted to exclude non-trading items Coca-Cola Amatil 2020 Half Year Result 18
4 NARTD share of Grocery and Convenience & Petroleum. Source: IRI YTD to 28/06/20 scanned dataNARTD CHANNEL PERFORMANCE
ccamatil.com
COVID-19 restrictions and lockdowns led to changes in
consumer behaviour impacting the operating environment in all
Strong performance in the Grocery channel. Convenience & channels
Petroleum and OTG volumes improved as restrictions eased.
GROCERY
Normalisation of volumes following volatility from COVID-19
related trends in March and April resulted in an increase of
VOLUME COMPOSITION BY CHANNEL 2.4% in the first half
HY20 HY19 CHANGE %
(MILLION UNIT CASES1) Grocery mix skewed to large take home packs with lower
volumes from front of store cold drink products
The measured market3 was flat in volume and grew 3.0% in
Grocery 76.7 74.9 2.4 value. Amatil outperformed the measured market3 resulting in
volume and value share gains led by Coca-Cola No Sugar
Convenience & Petroleum 10.8 11.6 (6.9) CONVENIENCE & PETROLEUM
Amatil grew volume in May and June, however overall volume
for the half declined by 6.9%
OTG2 [exc. National On Premise] 22.3 29.7 (24.9) Amatil achieved volume and value share growth in a declining
measured market4
National On Premise 24.9 30.2 (17.5) Strong demand for Energy brands – Amatil outperformed the
measured market4 in Energy volumes.
ON-THE-GO
Total NARTD 134.7 146.4 (8.0)
HORECA channel was severely impacted, however trading has
1 A unit case is the equivalent of twenty-four 8 US oz. (237ml) serves of 5.678 litres shown some improvement since easing of restrictions in May
2 Includes State Immediate Consumption, HORECA, Vending, Licensed, Neverfail and Other
3 NARTD share of Grocery. Source: IRI Australia YTD to 28 June 2020 scanned data State Immediate Consumption and National On Premise led
4 NARTD share of Convenience & Petroleum. Source: IRI YTD to 28 June 2020 scanned data
volume and outlet count improvement since channels reopened
Accelerated volumes sold through online platforms
Coca-Cola Amatil 2020 Half Year Result 19MARGIN IMPACTED BY CHANGES IN CONSUMER BEHAVIOUR
ccamatil.com
AND LOWER OVERALL VOLUME
NARTD VOLUME – CHANNEL MIX NARTD VOLUME - PORTFOLIO MIX
1H 2019 1H 2020 Coca-Cola Trademark – 1H 2020 Volume vs LY %
Volume growth vs LY (%)
Grocery
18%
21%
C&P
17%
51% 57%
OTG (Excl NOP) 20%
8%
8% 3
National On 1 2
Premise Single Serve Packs Multi-pack Cans Multi Serve PET
Shift to ‘at-home’ consumption
Channel mix shift away from OTG into Grocery. In 2Q 2020 Grocery represented 59% of total volume.
Portfolio mix shift away from the higher margin single-serve packs to lower margin multi-pack cans and multi-serve PET
1 Includes single serve 600ml & 390ml (PET), 375ml (cans), 250ml (PET & cans), 330ml & 385ml (glass)
2 Includes 24 pack and 30 pack cans
3 Includes 1.25L and 2L PET Coca-Cola Amatil 2020 Half Year Result 20NARTD CATEGORY PERFORMANCE
ccamatil.com
Resilient performance of Coca-Cola Trademark in 1H led by strong growth of Coca-Cola No Sugar. Achieved an excellent result
against a challenging market backdrop with Energy volumes up +2.4% and volume share gains of +1.3pts in NARTD.
VOLUME
VOLUME COMPOSITION BY
$ MILLION
CATEGORY (MILLION UNIT CASES1)
HY20 HY19FY18CHANGE % Coca-Cola No Sugar volumes grew 6.7%. Decline of 0.7%
in Cola, driven by Classic Coca-Cola and Diet Coke
Reduced Water volume driven by declines in Still Water as
SPARKLING consumer mobility declined due to the bushfires and the
pandemic. Achieved volume growth of +14.7% in Sparkling
Cola 73.2 73.7 (0.7) Water in the Grocery channel
Coca-Cola No Sugar 20.6. 19.3. 6.7. Energy delivered a strong performance with volume growth
Flavours/Adult 19.5 22.4 (12.9) despite cycling the Coke Energy launch in June 2019
Volume declines in Value-added dairy driven by Barista Bros
TOTAL SPARKLING 92.7 96.1 (3.5)
Flavours/Adult decline partially offset by +14.4% growth in
FROZEN 9.6 11.7 (17.9) the Diets/Light Flavours segment
SHARE4
STILLS Amatil grew value and volume share in the NARTD market
Water2 20.7 25.9 (20.1) Value and volume share gains in Classic Cola and Coca-
Energy 4.3 4.2 2.4 Cola No Sugar
Value added dairy 1.0 1.2 (16.7) Outperformed the Energy market and delivered value
Other stills 3 6.4 7.3 (12.3) (+1.5pts) and volume (+1.5pts) share gains
Value and volume share gains in Water
TOTAL STILLS 32.4 38.6 (16.1)
TOTAL 134.7 146.4 (8.0)
1 A unit case is the equivalent of twenty-four 8 US oz. (237ml) serves of 5.678 litres
2 Water volumes include Neverfail
3 ‘Other stills’ includes juice, tea, kombucha and sports
4 NARTD share of Grocery and Convenience and Petroleum. Source: IRI Australia YTD to 28 June 2020 scanned data Coca-Cola Amatil 2020 Half Year Result 21STRONG PERFORMANCE OF SPIRITS
ccamatil.com
Challenging context of outlet closures and trading restrictions in the On-Premise channel.
1H 2020 Volume vs LY (%)
15% 10.8%
10%
Volume vs LY (%)
5%
0%
-5%
-3.7% -5.0%
-10%
-15%
-20% -17.4%
Premix Spirits Beer & Cider Coffee
ALCOHOL
Amatil maintained value share1 in Spirits underpinned by share gains in Vodka, Gin and Scotch
Jim Beam trademark delivered a significant improvement in volume trajectory
Canadian Club volume in 1H 2020 was impacted by On Premise outlet closures. Achieved
double digit volume growth in June
COFFEE
Volume was severely impacted by café and pub & club closures in 1H, however there has
been an improvement in the OTG outlet count from May
1 Spirits/Premix: Australia Liquor, Source: IRI Australia YTD to 28 June 2020 scanned data
Coca-Cola Amatil 2020 Half Year Result 22ccamatil.com
AUSTRALIA
TRADING UPDATE &
PRIORITIES
Peter West Managing Director, Australia
Coca-Cola Amatil 2020 Half Year Result 23AUSTRALIA NARTD
ccamatil.com
Strong momentum from FY19 was interrupted by bushfires and the COVID-19 pandemic. Improved volume performance
from May, with volatility to be managed at state, region and channel levels.
YTD VARIATION & VOLATILITY BY WEEK1 AMATIL
Amatil NARTD performance reflects the volatility in the
Panic Buying Easter 2020 beverages measured market and impacts to OTG customers
Restrictions
Easing Since the easing of restrictions performance has been
variable between regional and CBD areas
NARTD Volume (UC) Growth vs LY (%)
Stage 4 restrictions implemented in Melbourne for six weeks
(2 August to 13 September)
Bushfires
Lockdown
VIC
restrictions
Easter 2019
Dec Jan Feb Mar Apr May Jun Jul Aug
(2 weeks)
1 Amatil Australia NARTD 10-Day rolling average volume trend vs LY - December to two week of August
Coca-Cola Amatil 2020 Half Year Result 24TRADING UPDATE - JULY AND 2 WEEKS OF AUGUST
ccamatil.com
Trading momentum continued in July with strong volume across NARTD Retail and Alcohol. Slow down in volume growth
in August in VIC and NSW while WA and SA continued to perform strongly.
JULY
NARTD
Volume up 2.4%: volume growth across all Cola variants; Energy continued to deliver solid growth; Sports returned to growth achieving a very strong
month
Grocery and C&P delivered volume growth +17.0% vs LY. Overall OTG trend remained stable at -16.6%
The NARTD measured market grew in value and volume1 up 4.9% and 3.1% respectively. Amatil outperformed the market and delivered value and
volume share gains
ALCOHOL
Volume grew by 18.6% as On-Premise outlets have reopened and social occasions increased
Continued strong growth in Spirits skewed to At Home consumption and increase in demand in Premix.
COFFEE
Volume declined by 9.1% with growth in Grocery being offset by COVID-19 restrictions in On-Premise
AUGUST - 2 WEEKS
Total volume grew by 0.3%, including 0.9% in NARTD and 2.0% in Alcohol. This result reflects the impacts of Victoria lockdown and COVID-19 hot-
spots in NSW on OTG trading
1 NARTD share of Grocery and Convenience and Petroleum. Source: IRI Australia past 4 weeks to 26 July 2020 scanned data
Coca-Cola Amatil 2020 Half Year Result 25THE BEVERAGES MARKET IN A COVID ENVIRONMENT
ccamatil.com
Impacts to consumption occasions and shopper trends have resulted in portfolio, location and channel shifts.
COVID-19 PHASES OPERATING ENVIRONMENT IMPLICATIONS
At Home consumption PORTFOLIO VARIATION
Consumer stockpiling
Take home PET and multi-serve packs
Limited mobility
Outlet closures with trading restricted to take- Demand for strong brands
LOCKDOWN away
No Sugar/Diet Colas and Diets/Lights Flavours
CHANNELS
− Lower shopper visitation and increased spend Water and Sports
per basket in Grocery
Single serve packs during lockdown
− Significant impact in OTG
− Reduced foot traffic in C&P and QSR
CHANGED CONSUMER DEMAND PATTERNS
At Home consumption Volume shifts to Grocery and Off-Premise channels
Pick up in foot traffic in C&P and OTG
Volume shifts to suburban and regional areas as
OTG outlets reopen with social distancing rules a
employees work remotely
limiting factor
RESTRICTED TRADING Consumer: price-sensitive in undifferentiated
categories, healthier choices and convenience
E-COMMERCE
CHANNELS
− Increasing velocity per outlet Online shopping in Grocery
− Shoppers seek discount retailers and local Volume through food aggregators
independent and specialty stores
Coca-Cola Amatil 2020 Half Year Result 262H 2020 PRIORITIES TO ADDRESS MARKET CHANGES
ccamatil.com
Prioritisation to maximise impact across our core categories and to drive efficiency in our operations.
COVID-19
ACCELERATED AUSTRALIAN GROWTH PLAN
ENVIRONMENT
CATEGORY CHANNEL
PORTFOLIO VARIATION Continue to drive strong performance in Coca- Drive Core range availability through Product
Cola Trademark with Coca-Cola No Sugar to Quadrant Analysis (PQA)
lead recovery Amplify online presence and enhance product
Continue momentum in Energy through ranging
innovation and precision execution Impactful key selling weeks activation:
CHANGED CONSUMER DEMAND Flavours stabilisation with focus on No Sugar Football Finals and Festive seasons
PATTERNS Flavours
ENABLERS
Adjust cost to serve to the new market Data-driven initiatives to respond to
E-COMMERCE environment geographic and channel shifts
Network agility to support customer base
Coca-Cola Amatil 2020 Half Year Result 27ccamatil.com
PACIFIC
PERFORMANCE
Alison Watkins Group Managing Director, Australia
Coca-Cola Amatil 2020 Half Year Result 28PACIFIC
ccamatil.com
Resilient 1H performance in NZ and strong recovery following the
NEW ZEALAND
lifting of restrictions. Fiji performance was impacted by the flow on Strong start to the year with revenue growth of 2.5% and EBIT
effects from the pandemic on the broader economy. growth of 13.2% in 1Q 2020
Volume declined by 5.6% in 1H 2020 as the majority of On-
CHANGE – The-Go and Licensed customer outlets were closed in April and
$ MILLION HY20 HY19 CHANGE % CONSTANT May. Strong revenue management partially mitigated the
CURRENCY1 %x impact of lower volumes resulting in a 2.3%1 revenue decline in
1H
TRADING REVENUE 360.0 378.3 (4.8) (5.3) 1H EBIT decline was minimised to -1.2%1, 2 vs pcp supported
by strong 1Q trading, an increased focus on costs and a
COVID-19 related Government subsidy (NZD $7m)
Volume (million unit cases) 37.4 40.6 (7.9) (7.9)
FIJI
Revenue per unit case ($) 9.63 9.32 3.3 2.7 Already challenging economic backdrop was further impacted
by the effects of COVID-19 on the tourism industry resulting in
Volume, Revenue and EBIT declines for both the NARTD and
ONGOING2 EBITDA 80.7 84.2 (4.2) (5.3) Paradise Beverages (alcohol) businesses
ONGOING EBIT 55.4 60.2 (8.0) (8.3)
EBIT Margin (%) 15.4 15.9 (0.5) pts (0.5) pts
ROCE – Ongoing (%) 23.2 22.8 0.4 pts
1 The constant currency basis is determined applying 1H 2019 foreign exchange rates to 1H 2020 local currency results
2 Ongoing refers to continuing operations results adjusted to exclude non-trading items
Coca-Cola Amatil 2020 Half Year Result 29NZ – STRONG PERFORMANCE LED BY COCA-COLA
ccamatil.com
TRADEMARK
CATEGORY CHANNEL
Shift to take home packs and multipack cans due to increase in ‘at home’ Volume vs LY (%)
consumption 10%
Strong performance of Coca-Cola Trademark: 5%
➢ Double digit volume and revenue growth in No Sugar Cola 0%
➢ Modest revenue growth in Classic Cola
-5%
Improved performance since easing of restrictions:
-10%
➢ All categories except Water have delivered volume growth in June
-15%
➢ Alcohol volumes have grown strongly since the end of May
-20%
Grocery Petroleum OTG Exc Petroleum
MARKET SHARE
The total NARTD measured market1 grew in volume +2.5% and value Grocery and OTG volume performance reflected shift to at home
+3.7%; Amatil outperformed the market significantly and achieved consumption during 2Q
share gains for the half in volume +0.6pts and value +1.6pts
Significant improvements since easing of restrictions:
Petroleum volume -3.7%, including a -50% decline in April
OTG delivered positive revenue performance in June
1 NARTD, Grocery and Petroleum. Source: Nielsen data YTD to 21 June 2020 scanned data
Coca-Cola Amatil 2020 Half Year Result 30ccamatil.com
PACIFIC
TRADING UPDATE &
PRIORITIES
Alison Watkins Group Managing Director
Coca-Cola Amatil 2020 Half Year Result 31TRADING UPDATE – JULY AND 2 WEEKS OF AUGUST
ccamatil.com
Normalisation of volumes in July and growth in first two weeks of August in New Zealand, while Fiji volume continued to
reflect the absence of international tourism.
NEW ZEALAND – 1H VARIATION & VOLATILITY BY WEEK1 NEW ZEALAND
JULY
Volume normalised to +0.4% as July was the first full month
trading under COVID-19 Level 1 restrictions
Mid-single digit Revenue growth underpinned by a recovering
NARTD Volume (UC) v LY %
OTG channel
AUGUST – 2 WEEKS
Volume grew by 13.2%, cycling the impact of Grocery price
increases in late July 2019
FIJI
JULY
Subdued trading expected until travel restrictions are lifted
Volume declined by 24.9% in NARTD reflecting the subdued
trading environment. Paradise Beverages declined by 9.2%
benefitting from customer stock build-up ahead of expected
excise tax increase
Feb Mar Apr May Jun Jul Aug
(2 weeks)
AUGUST – 2 WEEKS
Total volume declined by 5.7% reflecting trading environment
and reduction in excise taxes by 50%
1 Amatil NZ NARTD 1H 2020 10-Day rolling average volume trend vs LY
Coca-Cola Amatil 2020 Half Year Result 32ccamatil.com
INDONESIA/PNG
PERFORMANCE
Alison Watkins Group Managing Director, Australia
Coca-Cola Amatil 2020 Half Year Result 33INDONESIA & PAPUA NEW GUINEA INDONESIA
ccamatil.com
In Indonesia, the impacts of the pandemic on trading coincided with Solid start to the year – achieved 8th consecutive quarters of
the Festive period. PNG delivered a volume decline of 2.5% in 1H volume growth in 1Q 2020
2020. 1H volume declined 19.3%
CHANGE – Severe impacts on Traditional Trade -17.1% and Modern Trade
-23.4% volumes from outlet closures and government
CONSTANT restrictions, including on festive related activities
$ MILLION HY20 HY19 CHANGE %
CURRENCY1
%x − Affordability pressure from fast deterioration of
macroeconomic conditions and pressure on disposable
income
TRADING REVENUE 502.6 581.8 (13.6) (17.7)
− Festive volumes declined by 30.8% in average daily sales
volumes versus festive period last year. April and May 2019
Volume (million-unit cases) 105.4 127.2 (17.1) (17.1) were the two largest volume months ever in the business
EBITDA of $41.8 million benefitted from successful cash
Revenue per unit case ($) 4.77 4.57 4.4 (0.7) management and tight cost control across functions, which
delivered $16.1m in operational efficiencies, primarily related
to COVID cost saving initiatives
EBITDA – ONGOING2 71.9 98.8 (27.2) (30.2)
PAPUA NEW GUINEA
EBIT - ONGOING 20.9 51.8 (59.7) (60.6)
Volume decline of 2.5% despite significant trading disruptions
caused by the State of Emergency in March and flow on
EBIT Margin (%) 4.2 8.9 (4.7) pts (4.6) pts effects on the economy of COVID-19
Sparkling cans performed strongly
ROCE – Ongoing (%) 8.2 10.1 (1.9) pts Strong recovery following easing of restrictions with the
business achieving volume growth in the last two months of
1 The constant currency basis is determined applying 1H 2019 foreign exchange rates to 1H 2020 local currency results the half
2 Ongoing refers to continuing operations results adjusted to exclude non-trading items Coca-Cola Amatil 2020 Half Year Result 34ABSENCE OF THE TRADITIONAL FESTIVE VOLUME UPLIFT AS
ccamatil.com
THE COVID-19 CRISIS DEEPENED IN 2Q 2020
CCAI
CCAI Volume VOLUME
growth BYprior
versus QUARTER
year (by quarter)
FESTIVE TRADING1
VOLUME UPLIFT
Delivered a 29.5% volume uplift in 2020 festive, significantly below
the ~100% average increase achieved in 2018 and 2019
% Volume Uplift in
Year
Festive2
2018 96.6%
Q3 Q4 Q1 Q2
2019 99.0%
Prior Year 2019/2020
2020 29.5%
CHANNEL IMPACT
AVERAGE
Average DAILY
Daily SALES
Sales
Outlet trading restricted by widespread closures or reduced operating
1,400,000 hours
FESTIVE 2018
1,200,000
2019 - Traditional Trade festive volumes declined by 35.2% in 2020 vs pcp
Average Daily Sales
1,000,000 2020
- Modern Trade festive volumes trading declined by 29.4% in 2020 vs
800,000
pcp
600,000
1H 2020 Channel Split
400,000
33% 67%
200,000
Modern trade Traditional trade
0
Jan Feb Mar Apr May Jun Jul Aug Sep Oct Nov Dec
1 The festive period in 2020 took place from early March to late May. The festive period begins 11 weeks prior to Idul Fitri
2 Volume uplift relative to pre-festive period (from Jan to start of festive period) each year
Coca-Cola Amatil 2020 Half Year Result 35RESILIENT PERFORMANCE IN A CHALLENGING
ccamatil.com
ENVIRONMENT
CHALLENGING MACRO ENVIRONMENT RESILIENT PERFORMANCE OF SPARKLING STRONG MARKET EXECUTION
Annual GDP contracted by -5.3%1 in Q2. The Strong market execution and customer support
weakest pace since 1999. AMATIL SPARKLING during and post festive led to double-digit gains
CONTRIBUTION TO in SOVI (share of visible inventory) in Tea, Juice
Consumer Confidence is at the lowest levels in TOTAL NARTD and Value-Added Dairy, well above market
15 years2 MARKET4 share levels
7.2%
Increased affordability pressures due to Resilient performance in Provision channel:
declining consumer spending and higher 6.8% leveraged our effective RTM to capitalise on
unemployment rate3 rapid market changes
Rapidly developed a presence across key online
Q2 2019 Q2 2020 shopping and E-commerce platforms
Relevance of our Sparkling brands
demonstrated in the +4.1pts volume share4
gains achieved in the total market
Strong Route to Market Model drove NARTD
volume share gains4 in Traditional Trade
Strong performance of Minute Maid Pulpy
following price rebase in February: +1.7ppts in
share5 volume
1 Statistics Indonesia - Economic Growth of Indonesia Second Quarter 2020. 05/08/2020
2 CastleAsia - Consumer Sentiment Indonesia – June 2020
3 CastleAsia – Consumer Sentiment Indonesia – July 2020
4 Indonesia NARTD share data. Source: Nielsen – YTD to June 2020 scanned data Coca-Cola Amatil 2020 Half Year Result 36
5 Indonesia NARTD share data. Source: Nielsen – February 2020 to June 2020 scanned dataccamatil.com
INDONESIA/PNG
TRADING UPDATE &
PRIORITIES
Alison Watkins Group Managing Director
Coca-Cola Amatil 2020 Half Year Result 37SERIOUS HEALTH SITUATION IN INDONESIA & RECENT CASES
ccamatil.com
IN PAPUA NEW GUINEA A CONCERN
INDONESIA DAILY NEW COVID-19 CASES INDONESIA
Since Idul Fitri celebrations (24 May) daily infections continue to grow
2K
Economic outlook is weak
Consumer sentiment and behaviour continue to reflect the
uncertainty of the health crisis and macroenvironment:
1k
- Further focus on affordability
- Increase of At Home occasion
0
- Increased consumption through E-commerce and Digital
platforms
PAPUA NEW GUINEA
PNG DAILY NEW COVID-19 CASES Uptick in COVID-19 cases at end of July
Majority of new cases reported in Port Moresby where a 14-day
40 lockdown was announced, effective from 28 July.
Slowing economy is forecast to contract sharply (-1.5%1 GDP decline
forecast for 2020)
20
0
Source: https://www.worldometers.info/coronavirus/#countries
1 Asian Development Bank June 2020 Coca-Cola Amatil 2020 Half Year Result 38INDONESIA & PNG TRADING UPDATE – JULY AND
ccamatil.com
2 WEEKS OF AUGUST
Indonesia trading marked by volatility; PNG trading reflected promotional activity and impacts of COVID-19
OUR PERFORMANCE
INDONESIA
July
Indonesia volume declined by 19.4%
Subdued consumer confidence and reduced foot traffic due to rising COVID-19 cases and deterioration of macro factors
Sparkling and Juice categories performed well, particularly the affordable pack range
CCAI outlet penetration1 of Sparkling increased year on year from 67% to 78%
At Home packs (1.5L and 1L) delivered double digit volume growth as a result of increased focus on At Home occasions
August – Two weeks
Volume declined by 20.3% reflecting current market conditions
PNG
July
Volume declined by 1.4% driven by lower demand for sparkling cans due to customers holding high levels of inventory built in June to take advantage of
promotional activity
August - Two weeks
Volume was flat as promotional activity on cans was resumed, offsetting the impact of the two-week lockdown in Port Moresby.
1 Outlet Penetration is the percentage of CCAIs total direct serve outlets who purchased the product or category in July)
Coca-Cola Amatil 2020 Half Year Result 39INDONESIA - AREAS OF FOCUS IN 2H 2020
ccamatil.com
Intensified focus on the areas we can control
AFFORDABILITY
AFFORDABILITY AT HOME CONSUMPTION E-COMMERCE EXECUTION
• Reset price and drive availability • Expanded availability of our • Increase presence in the E- SEGMENTED EXECUTION
of the 250ml Sparkling pack multi-serve range (Sparkling, commerce channels
Tea, Juice and Water) • Range of programs tailored to
• Building on the relaunch of • Develop our existing B2B partners each market segment
Minute Maid Pulpy, leveraging • Adjust media strategy to capture relationships to expand
the price reset, rebranding and At Home consumption penetration OPERATIONAL IMPROVEMENT
new flavours implemented in opportunity
February • Capitalise on partnerships with key • Taking actions to further reduce
Food Aggregators to incorporate cost base including a ~350
• Continue to drive availability of CCODs and wholesalers into their headcount reduction in supply
Frestea Small Affordable packs distribution networks chain
through bundling and price
promotions
Coca-Cola Amatil 2020 Half Year Result 40ccamatil.com
GROUP
STRATEGY &
PROGRESS UPDATES
Alison Watkins Group Managing Director
Coca-Cola Amatil 2020 Half Year Result 41GROUP PRIORITIES / TRADING UPDATE
ccamatil.com
2020 VOLUME GROWTH BY MONTH % VS 2019 BUSINESS SEGMENTS
AUGUST Positive volume trends in July and early August in the markets where
APRIL MAY JUNE JULY
(Two weeks) restrictions were lifting (Australia and New Zealand)
% % % %
%
However, trading conditions remain volatile in Victoria due to
GROUP (33) (26) (9) (5) (3)
reinstatement of restrictions; PNG and Indonesia due to the rising
AUSTRALIA (28) (17) (3) 3 0 COVID-19 cases. Macroeconomic trends to continue uncertainty in Fiji
NEW Brand strength expected to continue with solid market share position
(34) (3) 4 0 13
ZEALAND
At-home consumption patterns persisting in the recovery phase
FIJI (51) (26) (29) (19) (6)
Q4 is a material trading period for all our segments
INDONESIA (39) (41) (23) (19) (20)
GROUP
PNG (26) 6 8 (1) 0
Continue focus on Cash
On track to deliver $140m in cost savings in 2020
Launched Fighting Fit to accelerate additional productivity initiatives with
focus on:
− Indonesia supply chain
− Australia cost to serve and supporting functions
− Group head office
Reduced capex program for 2020 – targeting spend of $200 million
Coca-Cola Amatil 2020 Half Year Result 42OUR FOCUS IN 2H 2020 IS TO BE FIGHTING FIT FOR THE TIMES
ccamatil.com
We are here
4 RE-IMAGINE
REBUILD & RESHAPE
3 “FIGHTING FIT”
2 RESILIENCE
• Maintain focus on growth plans
1 RESOLVE
including Regional Beverages
Powerhouse strategy and
• Strong customer focus
sustainability ambitions
• Locally-led, agile approach
• Strategic priorities for the Group
according to conditions
• Cost discipline and protected cash • Take advantage of opportunities
• Fast adjustments
• Preserved capital structure and for growth and adding capabilities
liquidity
• Supported our customers’
• Responded to the immediate
resilience
challenges of COVID-19 –
cross-functional commercial
response
Coca-Cola Amatil 2020 Half Year Result 43WE ARE UNIQUELY PLACED TO EMERGE STRONGER
ccamatil.com
FINANCIAL AND CHANNELS STRONG PARTNERSHIPS CONSUMER CENTRIC
OPERATIONAL PORTFOLIO & BRANDS
STRENGTHS Diversified RTMs/Channels Leading brands for the
times Beneficial trends –
Strengthened customer
Ample debt facilities, consumer preference for
relationships Delivery of market
longer tenor, no debt strong brands during
covenants outperformance uncertain times
Ability to flex resources as
markets evolve Close alignment on plans
Significant liquidity Broad range of at At-Home
and incentives
Stronger presence in offerings
Strong efforts to lower cost
e-commerce and food Fast access to global
base Low/no sugar variants
aggregators platforms insights
Reduced capital spend Leadership position in
following a consistent track SHARE resilient categories - Cola
record of investment in the Further strengthened and Energy
business market share positions in
the developed markets
Remains highly cash
generative Stronger market position in
At Home segments -
Grocery
Coca-Cola Amatil 2020 Half Year Result 44ccamatil.com
QUESTIONS &
ANSWERS
Coca-Cola Amatil 2020 Half Year Result 45ccamatil.com
APPENDIX
Coca-Cola Amatil 2020 Half Year Result 46CORPORATE & SERVICES
ccamatil.com
$ MILLION HY20 HY19 CHANGE %
TRADING REVENUE1 27.2 25.9 5.0
Other revenue 5.3 7.2 (26.4)
Internal revenue2 58.6 63.8 (8.2)
Total revenue 91.1 96.9 (6.0)
Services costs3 (37.8) (38.0) (0.5)
Group office costs (21.7) (26.0) (16.5)
ONGOING4 EBITDA 31.6 32.9 (4.0)
ONGOING EBIT (4.8) (6.0) (20.0)
1 Represents revenue mostly from our recycling business in South Australia
2 Revenue from the provision of support services to the other businesses. This revenue is eliminated on consolidation to produce the Group’s
financial statements.
3 Represents costs associated with our packaging services and South Australian recycling businesses
4 Ongoing refers to continuing operations results adjusted to exclude non-trading items
Trading revenue increased by $1.3 million driven by external preform sales. Other revenue
decreased by $1.9 million reflecting decline in coal mining royalties.
EBIT loss of $4.8 million improved compared to last year due to reduced Group Office costs
as a result of the response to COVID-19, partially offset by lower coal mining income.
Coca-Cola Amatil 2020 Half Year Result 47CONTAINER DEPOSIT SCHEME UPDATE
ccamatil.com
Western Australia container deposit scheme commencing 1 October 2020
CONTAINER DEPOSIT SCHEMES
NOW COVER ~62%
OF AUSTRALIA’s POPULATION
with Western Australia to implement
in 2020, Tasmania in 2022, Victoria
2023
LEGEND Northern
Territory
Country/State 0.2M NEW ZEALAND IS CONSIDERING
Population (‘M) Queensland SCHEME DESIGN
Western CDS: 2012 5.1M
CDS: Launch Date Consultation is underway with timing
Australia
2.6M
CDS: 1 Nov 2018 yet to be determined
CONTAINER DEPOSIT South Australia
SCHEME STATUS CDS: October 2020
1.7M
CDS: 1977 New South New Zealand
Wales ACT 5.0M
Currently operational 8.1M 0.4M CDS: to be determined
CDS:
1 Dec 2017 CDS: 30 Jun 2018
To be implemented Victoria
6.6M
CDS: Expected 2023
Tasmania
0.5M
CDS: Expected 2022
Source: ABS March 2019, Stats NZ Tatauranga
Aotearoa March 2019
Coca-Cola Amatil 2020 Half Year Result 48GLOSSARY OF TERMS
ccamatil.com
Term Definition
Amatil X Amatil X is Coca-Cola Amatil’s corporate venturing platform
C&P Abbreviation of Convenience and Petroleum
DME Abbreviation of Direct Marketing Expenditure
Abbreviation of Hotels, Restaurants and Cafes. This channel includes hotels, mainstream cafés, specialty
HORECA
cafés, premium cafés, mainstream restaurants, contemporary restaurants and premium restaurants
Indonesian channel including Hypermarkets, Supermarkets, Minimarkets and Modern Immediate
Modern Trade
Consumption
NARTD Abbreviation of Non-Alcoholic Ready to Drink. Non-alcohol beverages, including sparkling and still categories
National On National accounts including Foodservice, Entertainment, Services and Accommodation, National QSR (Quick
Premise Service Restaurants - Includes fast food chains and drink and snack chains)
Abbreviation of On the Go. This channel includes State Immediate Consumption, HORECA, National On
OTG
Premise, Vending and Licensed
PET Polyethylene terephthalate. Used to describe our plastic bottle packs
RTM Abbreviation of Route to Market
Abbreviation of State Immediate Consumption. State operational accounts, e.g. Takeaway Foodservice,
State IC
Bakery, Mixed Business, Newsagents
Traditional Trade Indonesian channel including Provision, Traditional Food Service and Wholesalers
Provision channel General goods stores within the Traditional Trade channel
Coca-Cola Amatil 2020 Half Year Result 49ccamatil.com
You can also read