2Q18 Earnings Call Presentation - July 25, 2018 - The Venetian Macao - AZARplus

 
CONTINUE READING
2Q18 Earnings Call Presentation - July 25, 2018 - The Venetian Macao - AZARplus
The Venetian Macao         Sands Cotai Central, Macao               Marina Bay Sands, Singapore               The Parisian Macao

                2Q18 Earnings Call Presentation
                                           July 25, 2018

 Sands Macao         Four Seasons Macao                 Sands Bethlehem         The Venetian Las Vegas   The Palazzo, Las Vegas
2Q18 Earnings Call Presentation - July 25, 2018 - The Venetian Macao - AZARplus
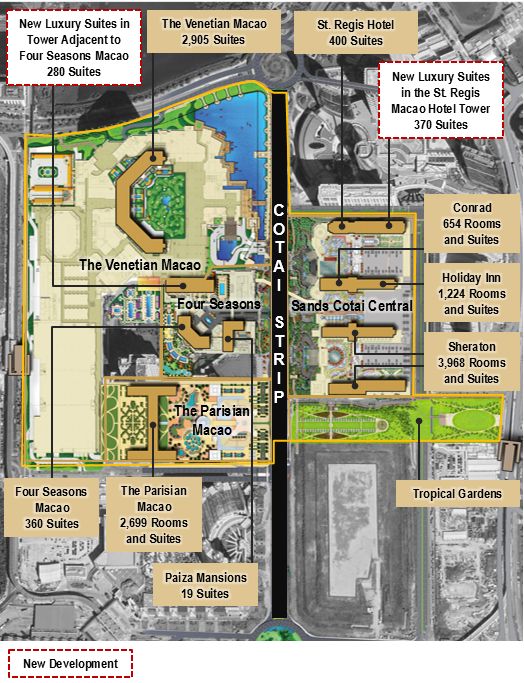
Forward Looking Statements

This presentation contains forward‐looking statements made pursuant to the Safe Harbor Provisions of the
Private Securities Litigation Reform Act of 1995. Forward‐looking statements involve a number of risks,
uncertainties or other factors beyond the company’s control, which may cause material differences in actual
results, performance or other expectations. These factors include, but are not limited to, general economic
conditions, competition, new development, construction and ventures, substantial leverage and debt service,
fluctuations in currency exchange rates and interest rates, government regulation, tax law changes and the
impact of U.S. tax reform, legalization of gaming, natural or man‐made disasters, terrorist acts or war, outbreaks
of infectious diseases, insurance, gaming promoters, risks relating to our gaming licenses, certificate and
subconcession, infrastructure in Macao, our subsidiaries’ ability to make distribution payments to us, and other
factors detailed in the reports filed by Las Vegas Sands with the Securities and Exchange Commission. Readers
are cautioned not to place undue reliance on these forward‐looking statements, which speak only as of the date
thereof. Las Vegas Sands assumes no obligation to update such information.

Within this presentation, the company may make reference to certain non‐GAAP financial measures including
“adjusted net income,” “adjusted earnings per diluted share,” and “consolidated adjusted property EBITDA,”
which have directly comparable financial measures presented in accordance with accounting principles generally
accepted in the United States of America ("GAAP"), along with “adjusted property EBITDA margin,” “hold‐
normalized adjusted property EBITDA,” “hold‐normalized adjusted property EBITDA margin,” “hold‐normalized
adjusted net income,” and “hold‐normalized adjusted earnings per diluted share,” as well as presenting these
items on a constant currency basis. The specific reasons why the company’s management believes the
presentation of each of these non‐GAAP financial measures provides useful information to investors regarding
Las Vegas Sands’ financial condition, results of operations and cash flows, as well as reconciliations of the non‐
GAAP measures to the most directly comparable GAAP measures, are included in the company’s Form 8‐K dated
July 25, 2018, which is available on the company’s website at www.sands.com. Reconciliations also are available
in the Non‐GAAP Measures Reconciliations section of this presentation.
                                                                                                                     2
2Q18 Earnings Call Presentation - July 25, 2018 - The Venetian Macao - AZARplus
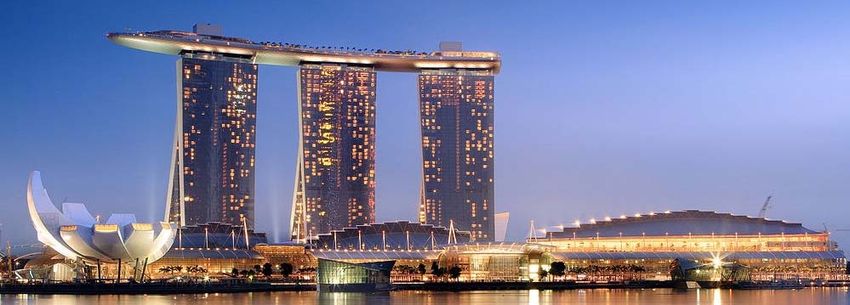
The Investment Case for Las Vegas Sands

  The global leader in Integrated Resort development and operation

  A unique MICE‐based business model delivering strong growth in cash flow and earnings

  Proven track record of delivering secular long‐term growth in Asia

  Unmatched development and operating track record creates competitive advantage as we
   pursue the world’s most promising new Integrated Resort development opportunities

  Industry‐leading balance sheet strength

  Committed to maximizing shareholder returns by delivering growth while increasing the
   return of capital to shareholders

  The industry’s most experienced leadership team: visionary, disciplined and dedicated to
   driving long‐term shareholder value

Maximizing Return to Shareholders by:
 1. Delivering growth in current markets through strong reinvestment in industry‐leading property portfolio
 2. Leveraging proven MICE‐based Integrated Resort business model and industry‐leading balance sheet
    strength to pursue global growth opportunities in new markets
 3. Continuing to increase the return of capital to shareholders
                                                                                                              3
2Q18 Earnings Call Presentation - July 25, 2018 - The Venetian Macao - AZARplus
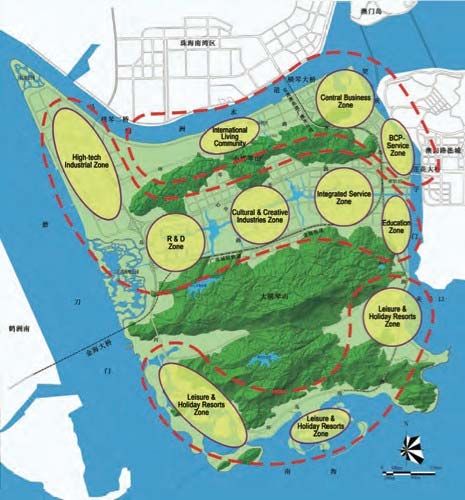
Second Quarter 2018 Financial Highlights
   Quarter Ended June 30, 2018 vs Quarter Ended June 30, 2017
          Net revenue increased 6.2% to $3.30 billion; Hold‐normalized net revenue increased 11.0% to $3.30 billion

          Net income increased 5.8% to $676 million; Hold‐normalized adjusted net income Increased 21.3% to $597
           million

          Adjusted property EBITDA increased 1.4% to $1.23 billion; Hold‐normalized adjusted property EBITDA
           increased 11.6% to $1.23 billion

          Macao – Adjusted property EBITDA from Macao Operations increased 25.0% to $750 million; Hold‐
           normalized adjusted property EBITDA increased 22.3% to $730 million

          Macao Operations grew mass gaming win, rolling chip volume, hotel occupancy and RevPAR, generating an
           adjusted property EBITDA margin of 35.4%, an increase of 200 bps

          Marina Bay Sands – Lower rolling volume and lower hold on rolling table games play compared to 2Q17
           impacted our results; Hold‐normalized adjusted property EBITDA decreased 4.7% to $368 million, with a
           margin of 52.2%

          Diluted EPS increased 1.4% to $0.70 per share, adjusted diluted EPS increased 1.4% to $0.74 per share,
           hold‐normalized adjusted diluted EPS increased 22.6% to $0.76 per share

          LVS returned a total of $691 million to shareholders during the quarter through its recurring dividend of
           $0.75 per share ($591 million) and $100 million of share repurchases (1.3 million shares at a weighted
           average price of $79.76 per share)

Note: Prior periods presented have been updated to reflect the implementation of ASC 606, Revenue from Contracts with Customers.
                                                                                                                                   4
2Q18 Earnings Call Presentation - July 25, 2018 - The Venetian Macao - AZARplus
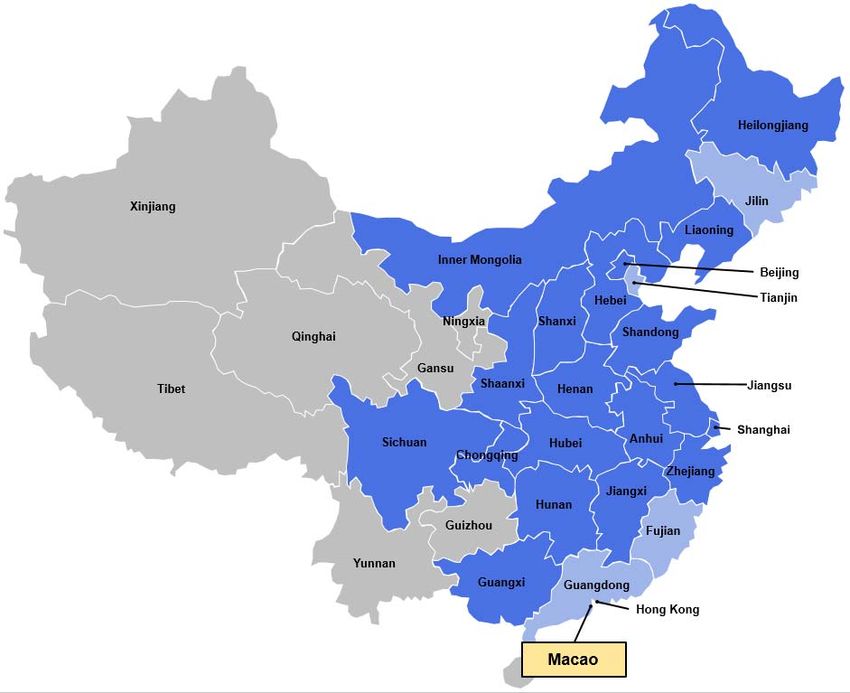
Second Quarter 2018 Financial Results (Y/Y)
    Quarter Ended June 30, 2018 vs Quarter Ended June 30, 2017
     ($ in millions, except per share information)                                                      2Q17                           2Q18     $ Change   % Change

     Net Revenue                                                                                   $        3,109                  $    3,303   $    194     6.2%

     Net Income                                                                                    $            639                $     676    $     37     5.8%

     Adjusted Property EBITDA                                                                      $        1,208                  $    1,225   $     17     1.4%

     Adjusted Property EBITDA Margin                                                                         38.9%                      37.1%              ‐180 bps

     Diluted EPS                                                                                   $           0.69                $     0.70   $   0.01     1.4%

     Adjusted Diluted EPS                                                                           $          0.73                $     0.74   $   0.01     1.4%

     Dividends per Common Share                                                                     $          0.73                $     0.75   $   0.02     2.7%

     Hold‐Normalized :

          Adjusted Property EBITDA                                                                 $        1,106                  $    1,234   $    128    11.6%

          Adjusted Property EBITDA Margin                                                                    37.2%                      37.4%               20 bps

          Adjusted Diluted EPS                                                                      $          0.62                $     0.76   $   0.14    22.6%

Note: Prior periods presented have been updated to reflect the implementation of ASC 606, Revenue from Contracts with Customers.
                                                                                                                                                                      5
2Q18 Earnings Call Presentation - July 25, 2018 - The Venetian Macao - AZARplus
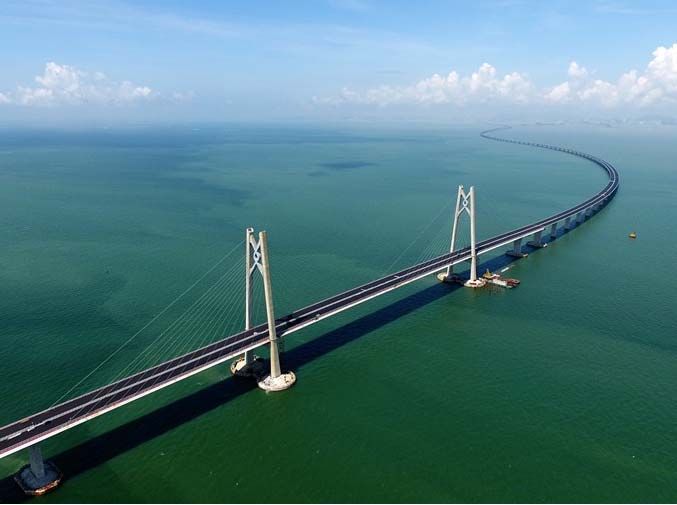
Strong Cash Flow, Balance Sheet and Liquidity
    Flexibility for Future Growth Opportunities and Return of Capital
  As of June 30, 2018:                                                                                                      Trailing twelve months ended June 30, 2018:
          Cash Balance – $4.36 billion                                                                                              Cash Flow from Operations – $4.94 billion
          Debt – $11.44 billion1                                                                                                    Adjusted Property EBITDA – $5.27 billion
          Net Debt – $7.07 billion                                                                                                  LVS Dividends Paid – $2.34 billion
          Net Debt to TTM EBITDA – 1.3x                                                                                             SCL Dividends Paid – $615 million2
Figures as of June 30, 2018                                                                       Sands China                                               U.S.                        Corporate
($ in millions)                                                                                      Ltd.                      Singapore                 Operations3                    and Other                      Total

Cash, Cash Equivalents and Restricted Cash                                                              $1,075                        $348                       $2,110                        $829               $       4,362

Debt1                                                                                                   $4,819                     $3,112                        $3,505                            $0                 $11,436

Net Debt                                                                                                $3,744                     $2,764                        $1,395                       ($829)                    $7,074
                                                                                                                    4                                                         5
Trailing Twelve Months Adjusted Property EBITDA                                                         $2,921                     $1,807                           $541                           $0                   $5,269
                                                                                                                    6                           6
Gross Debt to TTM Adjusted Property EBITDA                                                                  1.6 x                       1.7 x                         6.5 x                        NM                       2.2 x
                                                                                                                                                                              6
Net Debt to TTM Adjusted Property EBITDA                                                                    1.3 x                       1.5 x                         2.6 x                        NM                       1.3 x

         Industry’s Strongest Balance Sheet and Cash Flow Create Ability to Reinvest in Current
          Portfolio, Return Capital to Shareholders and Preserve Ability to Make Investments
        in New Jurisdictions – Allows Potential Investments of $20 Billion or More in the Future
1. Debt balances shown here exclude deferred financing costs of $114 million.
2. Reflects only the public (non‐LVS) portion of dividends paid by Sands China. Total dividends paid by Sands China in the TTM period ended June 30, 2018 were $2.05 billion.
3. U.S. Operations include the cash and debt at the U.S. Restricted Group and adjusted property EBITDA from Las Vegas Operations and Sands Bethlehem.
4. TTM Adjusted Property EBITDA for Sands China presented here reflects Adjusted Property EBITDA from our Macao Operations.
5. TTM Adjusted Property EBITDA for U.S. Operations for covenant compliance purposes, which is adjusted primarily for the dividends and royalty fees paid by Sands China and Marina Bay Sands to the U.S. Operations, was $3.18 billion.
6. This ratio is a simplified calculation using adjusted property EBITDA. The TTM adjusted property EBITDA amounts shown above are different from the calculation as defined per respective debt agreements for covenant compliance
purposes. For Sands China, Marina Bay Sands and U.S. Operations, the leverage ratio for covenant compliance purposes was 1.7x, 1.8x and 0.5x, respectively.
                                                                                                                                                                                                                                           6
2Q18 Earnings Call Presentation - July 25, 2018 - The Venetian Macao - AZARplus
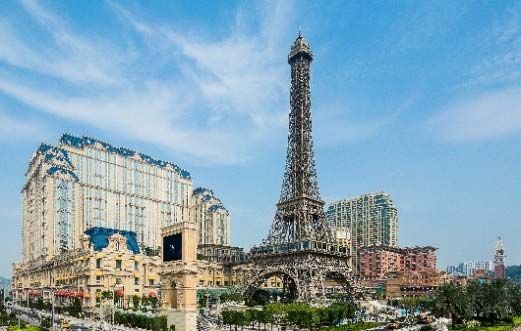
LVS Increasing Return of Capital to Shareholders
     Over $20.7 Billion of Capital Returned to Shareholders Since 2012
                                                                                                                                                   Las Vegas Sands remains committed to returning capital
                                    LVS Recurring Dividends per Share1                                                                             to shareholders via its recurring dividend program and
                                                                                                                                                   share repurchases:
                                                                                                                                                    Dividends:
                                                                                        $2.88              $2.92                $3.00                 In October 2017, the LVS Board of Directors
                                                                   $2.60                                                                               announced the increase of the LVS recurring
                                                $2.00                                                                                                  dividend for the 2018 calendar year by $0.08 to
                           $1.40                                                                                                                       $3.00 per share ($0.75 per share payable
        $1.00                                                                                                                                          quarterly)
                                                                                                                                                      Las Vegas Sands is committed to both maintaining
                                                                                                                                                       its recurring dividend program and to increasing
        2012               2013                 2014               2015                 2016               2017                 2018                   dividends in the future as cash flows grow
                                   Total Capital Returned to Shareholders                                                                           Repurchases:
                                                                                                                                                      On June 7, 2018, the LVS Board of Directors
                                                                                                                                                       authorized an increase in LVS’ share repurchase
                                                              Year Ended December 31,                                    YTD
                                                                                                                                                       program to $2.5 billion and extended the
$ in millions                           2012         2013          2014         2015          2016         2017         2018           Total
                                                                                                                                                       expiration date to November 2, 2020
                                                                                                                                                      During the second quarter of 2018, $100 million of
                       1
LVS Dividends Paid                       $823       $1,153        $1,610       $2,074        $2,290       $2,310        $1,183       $11,443
LVS Special Dividend Paid                2,262           ‐             ‐            ‐            ‐             ‐            ‐           2,262          common stock was repurchased (1.3 million shares
LVS Shares Repurchased                      ‐           570        1,665           205           ‐            375          175          2,990          at a weighted average price of $79.76 per share)
        Subtotal LVS                   $3,085       $1,723        $3,275       $2,279        $2,290       $2,685        $1,358       $16,695          The company currently has $2.40 billion available
                       2
SCL Dividends Paid                         357          411           538          619           619          619          615          3,778          under its current repurchase authorization
                                                                                                                                                      Since the inception of the company’s share
                               2
SCL Special Dividend Paid                   ‐            ‐            239           ‐            ‐             ‐            ‐              239
        Subtotal SCL                     $357          $411         $777          $619         $619         $619          $615         $4,017          repurchase program in 2013, the company has
Total                                  $3,442       $2,134        $4,052       $2,898        $2,909       $3,304        $1,973       $20,712           returned $2.99 billion to shareholders through the
                                                                                                                                                       repurchase of 43.9 million shares

 Las Vegas Sands Remains Committed to Returning Capital to Shareholders While Maintaining
   a Strong Balance Sheet and the Financial Flexibility to Pursue Development Opportunities
1. Excludes dividends paid by Sands China and excludes the $2.75 per share special dividend paid in December 2012.                                                                                          7
2. Reflects only the public (non‐LVS) portion of dividends paid by Sands China (total Sands China dividends paid since 2012 were $13.4 billion).
2Q18 Earnings Call Presentation - July 25, 2018 - The Venetian Macao - AZARplus
SCL Return of Capital to Shareholders
    US$13.4 Billion of Capital Returned to Shareholders Since 2012
                         SCL Recurring Dividends per Share (HK$)1
                                                                                                                              Sands China remains committed to returning capital
                                                                                                                               to shareholders via its recurring bi‐annual dividend
                                                                                                                               program

                                                             $1.99              $1.99         $1.99            $1.99          Sands China is committed to maintaining its
                                             $1.73
                           $1.33                                                                                               recurring dividend program and to increasing
            $1.16                                                                                                              dividends in the future as cash flows grow

                                                                                                                              On January 19, 2018, the SCL Board of Directors
                                                                                                                               declared an interim dividend of HK$0.99, which was
            2012           2013              2014            2015               2016           2017            2018            paid on February 23, 2018

                         SCL Total Capital Returned to Shareholders                                                           On March 16, 2018, the SCL Board of Directors
                                                                                                                               declared a final dividend of HK$1.00, which was
                                                        Year Ended December 31,                         YTD                    paid on June 22, 2018
$ in millions                       2012       2013         2014       2015        2016       2017      2018       Total
                     1
SCL Dividends Paid                 $1,201      $1,382      $1,800     $2,071      $2,071     $2,069    $2,053     $12,647
SCL Special Dividend Paid              ‐            ‐         801          ‐             ‐       ‐                     801
        2
Total                              $ 1,201    $ 1,382      $ 2,601    $ 2,071     $ 2,071    $ 2,069   $ 2,053   $ 13,448

    Sands China Remains Committed to Returning Capital to Shareholders While Maintaining a
      Strong Balance Sheet and the Financial Flexibility to Pursue Development Opportunities
1. Excludes the special dividend paid in 2014.
2. Sands China dividends presented here include the dividends paid to Las Vegas Sands.
                                                                                                                                                                                      8
2Q18 Earnings Call Presentation - July 25, 2018 - The Venetian Macao - AZARplus
Macao Operations EBITDA Performance
     Quarter Ended June 30, 2018 vs Quarter Ended June 30, 2017

                Macao Operations Adjusted Property EBITDA and Adjusted Property EBITDA Margin
($ in millions)
                                            Adjusted Property EBITDA                                                               Hold‐Normalized Adj. Prop. EBITDA

                               $900                                                                                                                                    60%

                               $800                                                 $750                                                                 $730
                                                                                                                                                                       50%
                               $700
                                                     $600                                                                                  $597
                               $600                                                                                                                                    40%

                               $500                                                35.4%                                                                 35.2%
                                                     33.4%                                                                                 33.5%                       30%
                               $400

                               $300                                                                                                                                    20%

                               $200
                                                                                                                                                                       10%
                               $100

                                   $0                                                                                                                                  0%
                                                     2Q17                           2Q18                                                   2Q17          2Q18

Note: Prior periods presented have been updated to reflect the implementation of ASC 606, Revenue from Contracts with Customers.
                                                                                                                                                                             9
2Q18 Earnings Call Presentation - July 25, 2018 - The Venetian Macao - AZARplus
Macao Financial Performance
    Financial Performance by Property
($ in millions)
                                                                  Net Revenue                                          Adj. Property EBITDA                Adj. Property EBITDA Margin
                                                                                        Growth                                          Growth                                 Growth
                                                   2Q17             2Q18               $     %                    2Q17      2Q18       $     %              2Q17      2Q18       bps

The Venetian Macao                                    $674             $830         $156         23.1%               $256          $331   $75      29.3%     38.0%    39.9%       190
Sands Cotai Central                                    439              509           70         15.9%                134           176    42      31.3%     30.5%    34.6%       410
The Parisian Macao                                     353              371           18          5.1%                106           114     8       7.5%     30.0%    30.7%        70
Four Seasons/Plaza Casino                              135              186           51         37.8%                 60            72    12      20.0%     44.4%    38.7%      (570)
    Total Cotai                                      1,601            1,896           295        18.4%                 556         693    137      24.6%     34.7%    36.6%       190

The Sands Macao                                         156              180            24       15.4%                   39         52        13   33.3%     25.0%    28.9%       390
Ferry Operations and Other                               41               42             1        2.4%                    5          5    ‐         0.0%     12.2%    11.9%       (30)

    Total Macao                                      1,798            2,118           320          `
                                                                                                 17.8%                 600         750    150        `
                                                                                                                                                   25.0%     33.4%    35.4%       `
                                                                                                                                                                                  200

                                                                          Revenue Growth                                              EBITDA Growth              Margin Expansion

                      Our Macao Portfolio Grew Revenue 17.8%, Adj. Property EBITDA 25.0% and
                      Adj. Property EBITDA Margin 200 Basis Points in the Second Quarter of 2018

Note: Prior periods presented have been updated to reflect the implementation of ASC 606, Revenue from Contracts with Customers.
                                                                                                                                                                                         10
Sands China Mass Market Table Update
    Mass Market Table Win Grew 19.6% in 2Q18 vs. 2Q17
        SCL Base Mass Table Win by Quarter                                                                SCL Premium Mass Table Win by Quarter
          Sands China Departmental Profit Margin: 35% - 45%                                                         Sands China Departmental Profit Margin: 25% - 40%

($ in millions)                       Avg. Win per Table per Day: $7,293                               ($ in millions)                         Avg. Win per Table per Day: $16,983

  $900                                                                                                   $900

  $800                                                                                                   $800

  $700                                          $659            $676            $659                     $700                                         $666            $668            $663
                                $617
                  $591
  $600                                                                                                   $600
                                                                                                                         $514         $499
  $500                                                                                                   $500

  $400                                                                                                   $400

  $300                                                                                                   $300

  $200                                                                                                   $200

  $100                                                                                                   $100

     $0                                                                                                      $0
                  2Q17          3Q17            4Q17            1Q18            2Q18                                     2Q17         3Q17            4Q17            1Q18           2Q18

Avg.                                                                                                   Avg.
                  1,062       1,038           1,028           1,016             993                                      373           378             409            429             429
Tables                                                                                                 Tables
             Sands China’s Market Leading Mass Table Offering is Delivering Growth Year‐Over‐Year of 19.6%,
             Including 29.0% in Premium and 11.5% in Base, in the Macao Market’s Most Profitable Segment
Note: Sands China’s base mass and premium mass table revenues as presented above are based on the geographic position of non‐rolling (mass) tables on the gaming floor. Some high‐end mass play   11
occurs in the base mass geographic area.
Growing Mainland Chinese Visitation to Macao
 Non‐Guangdong Province Chinese Visitation Grew 17% for the
 Trailing Twelve Months Ended June 30, 2018
             Year‐Over‐Year Visitation Growth                                                                      Mainland Chinese Visitation to Macao
                                                                                                                             Twelve Months Ended June 30,           Population     GDP Per    Penetration
                                                                                                 Province                  2017            2018        % Change       (MM)       Capita (US$)    Rate
                                                                                                 Guangdong                 9,171,912        9,644,397      +5%        108         $10,346        8.9%

                                                                                                 Hunan                       931,052        1,077,460     +16%         68          $6,600        1.6%

                                                                                                 Fujian                      786,303          861,713     +10%         38         $10,432        2.2%

                                                                                                 Hubei                       674,405          781,736     +16%         59          $7,784        1.3%

                                                                                                 Zhejiang                    584,486          711,024     +22%         55         $11,935        1.3%

                                                                                                 Guangxi                     596,785          689,532     +16%         48          $5,400        1.4%

                                                                                                 Shanghai                    569,121          653,798     +15%         24         $15,934        2.7%

                                                                                                 Jiangsu                     509,703          641,257     +26%         80         $13,550        0.8%

                                                                                                 Jiangxi                     467,349          534,672     +14%         46          $5,647        1.2%

                                                                                                 Henan                       442,745          523,670     +18%         95          $6,018        0.6%

                                                                                                 Sichuan                     366,274          460,490     +26%         82          $5,656        0.6%

                                                                                                 Beijing                     336,401          375,141     +12%         22         $16,306        1.7%

                                                                                                 Liaoning                    299,093          353,639     +18%         44         $10,111        0.8%

                                                                                                 Shandong                    249,217          332,127     +33%         98          $9,862        0.3%

                                                                                                 Hebei                       243,915          329,253     +35%         74          $6,187        0.4%

                                                                                                 Heilongjiang                261,690          313,831     +20%         38          $6,100        0.8%

                                                                                                 Anhui                       243,445          286,025     +17%         61          $5,521        0.5%

                                                                                                 Chongqing                   230,306          273,331     +19%         30          $8,031        0.9%

                                                                                                 Jilin                       216,443          233,027      +8%         28          $7,990        0.8%

                                                                                                 Shanxi                      196,963          220,551     +12%         37          $5,385        0.6%
                     > 10%          0% ‐
Macao Market: Expanding Overnight Visitation and Increasing
  Mass Gaming Win‐per‐Visit are Driving Growth
                                                  Chinese Overnight                                                                                          Mass (Tables & Slots)
                                                       Visits1                                                                                                 Win‐per‐Visit2
                    (in millions)                                                                                                ($)

                              3.5
                                                                                                                                                 700
                                                                               3.1
                              3.0                 2.8                                                                                                                                       $588
                                                                                                                                                 600
                                                                                                                                                                   $522
                              2.5
                                                                                                                                                 500

                              2.0
                                                                                                                                                 400

                              1.5                                                                                                                300

                              1.0                                                                                                                200

                              0.5                                                                                                                100

                              0.0                                                                                                                   0
                                                         2Q17            2Q18                                                                                            2Q17          2Q18

                              More Hotel Inventory Driving Strong                                                                                     Solid Growth in Market Wide
                             Growth in Chinese Overnight Visitation                                                                                    Mass Gaming Win‐per‐Visit

1. Source: Macao DSEC (Statistics and Census Service of the Macao Government) statistical database.
2. Market‐wide mass win is defined as mass table win plus slot win as reported by the casino operators in their public filings (does not include revenue from Galaxy’s City Clubs business). Mass win‐per‐visit is defined as mass win (tables
and slots) divided by total visitation to Macao as reported by the Macao DSEC. All figures reported in Hong Kong dollars have been converted to USD using a 7.75 exchange rate.
                                                                                                                                                                                                                                                 13
Macao Market: Continued Strong Growth in
   High Margin Mass Gaming Segment
             Macao Market Mass Gaming Revenue (Tables & Slots) & Mass Win‐per‐Visit1
($ in millions)

   $5,500                                                                                                                                                                                         $1,000
                                                                                                                                                                               $4,955
   $5,000                                                                   $4,449                                                                                                      $4,861
                                                                                                                                                                      $4,706
                                                                   $4,589
                                                             $4,340              $4,419
   $4,500                                                                                                                                                                                         $800
                                                                                                                                                     $4,146     $4,169
                                                                                         $3,919                  $3,589         $3,816         $3,989     $4,017
   $4,000                                             $3,873
                                            $3,441                                             $3,682     $3,497        $3,609
                                                                                                     $3,408                  $3,508
   $3,500                              $3,351                  $585 $597 $586                                                                                                      $580 $588
                                 $3,174                                                                                                                                                           $600
              $2,655                                                              $536                                                                                $536
                                                                                                                                                       $527 $522
   $3,000                 $2,839                    $499                                  $490 $497                                             $494             $504
                    $2,679                $474 $487                                                    $464          $457
                                                                                                                            $484 $480 $471
                                   $440                                                                       $432
   $2,500           $404 $390
             $382
                                                                                                                                                                                                  $400
   $2,000

   $1,500

   $1,000                                                                                                                                                                                         $200

     $500

        $0                                                                                                                                                                                        $0
             1Q12 2Q12 3Q12 4Q12 1Q13 2Q13 3Q13 4Q13 1Q14 2Q14 3Q14 4Q14 1Q15 2Q15 3Q15 4Q15 1Q16 2Q16 3Q16 4Q16 1Q17 2Q17 3Q17 4Q17 1Q18 2Q18

                                                                          Mass Win (Tables & Slots)                      Mass Win per Visit

                                            We Estimate Macao Market‐Wide Mass Win Increased
                                          ~21.0% and Mass Win‐per‐Visit Increased 12.6% Y/Y in 2Q18
1. Market‐wide mass GGR for all periods through 1Q18 is defined as mass win (tables and slots) as reported by the casino operators in their public filings (does not include revenue from Galaxy’s City Clubs
business). Market wide mass GGR for 2Q18 is estimated by LVS management based on DICJ reported data and LVS management’s estimated differences between DICJ reporting and win reported by
operators in prior public filings. All figures reported in Hong Kong dollars have been converted to USD using a 7.75 exchange rate.
Source: Public company filings, Macao DSEC, Macao DICJ.                                                                                                                                                       14
                      .
Macao Mass Market:
    Mass Gaming Growth Remained Robust in 2Q18
                                                             Macao Market Mass Gaming Revenue

                         ($ in millions)

                                                                                                        Mass Win (Tables and Slots)1
                                                                                    Q1                   Q2                   Q3                    Q4                 Total

                               2016                                             $3,609                 $3,508             $3,816                $3,989              $14,922

                               2017                                             $4,146                 $4,017             $4,169                $4,706              $17,038

                               Growth ('17 v '16)                                14.9%                 14.5%                 9.3%                18.0%                14.2%
                                                                                                                 2
                               2018                                             $4,955             ~   $4,861
                                                                                                   ~             2
                               Growth ('18 v '17)                                19.5%                 21.0%

                                   Growth in the Macao Market’s High‐Margin Mass Gaming
                                   Segment Remained Robust in the Second Quarter of 2018
1. Market‐wide mass GGR for all periods through 1Q18 is defined as mass win (tables and slots) as reported by the casino operators in their public filings (does not include revenue from Galaxy’s City Clubs
business). All figures reported in Hong Kong dollars have been converted to USD using a 7.75 exchange rate.
2. Market‐wide Mass GGR for 2Q18 is estimated by LVS management based on DICJ reported data and LVS management’s estimated differences between DICJ reporting and win reported by operators in
prior public filings.
Source: Public company filings, Macao DICJ.
                                                                                                                                                                                                                15
Sands China VIP Table Update
 Sands China Continues to Gain Market Share in the VIP Segment
 Win Up 29.8% in 2Q18 vs. 2Q17
($ in millions, except per table amounts)  VIP Investment
                  SCL Rolling Win by Quarter                                     Increasing in 2018 and 2019
                               Avg. Win per Table per Day          $28,127
$800
                $25,884                                                         Adding additional amenities
$700
                                                            $645
                                                                                 across our entire property
                                                                                 portfolio
$600

$500
                           $497                                                 Refurbishing and improving our
                                                                                 existing offerings by reinvesting
$400                                                                             in design and service upgrades

$300                                                                            Long Term Objective: Grow faster
$200
                                                                                 than the Macao market in this
                                                                                 segment
$100

  $0
                            2Q17                            2Q18
    Avg.
                              211                           252
    Tables

                                            VIP Rolling Win Up 29.8% in 2Q18 v 2Q17
                                                                                                                     16
Macao Market: VIP Gaming
    Growth Continued in 2Q18
                                                               Macao Market VIP Gaming Revenue

                         ($ in millions)

                                                                                                                        VIP Win1
                                                                                   Q1                   Q2                   Q3                   Q4                 Total

                               2016                                            $3,294                 $2,856             $3,017               $3,516              $12,683

                               2017                                            $3,661                 $3,734             $4,099               $4,292              $15,786

                               Growth ('17 v '16)                               11.1%                 30.7%               35.9%                 22.1%                24.5%
                                                                                                                2
                               2018                                            $4,429             ~   $4,231
                                                                                                                2
                               Growth ('18 v '17)                               21.0%             ~   13.3%

              Growth in the Macao Market’s VIP Gaming Segment Continued in 2Q18
1. Market‐wide VIP GGR for all periods through 1Q18 as reported by the casino operators in their public filings. All figures reported in Hong Kong dollars have been converted to USD using a 7.75 exchange
rate.
2. Market‐wide VIP GGR for 2Q18 is estimated by LVS management based on DICJ reported data and LVS management’s estimated differences between DICJ reporting and win reported by operators in
prior public filings.
Source: Public company filings, Macao DICJ.
                                                                                                                                                                                                              17
A Focus on Reinvestment in Our Market‐Leading Assets
Ongoing Strategic Reinvestment across our Market‐leading Macao Portfolio
                                                              Estimated Timeframe
The Londoner Rebranding:
  Renovation, expansion and rebranding to The Londoner       Commencement in late 2018 – phased to minimize
   Macao                                                      disruption during peak periods – completion of all
                                                              components in 2020
Hotel Suite Additions and Renovations:
  New Luxury Suites in St. Regis Macao Tower:                Work is progressing – completion in late 2019
   Approximately 370 new luxury suites ranging in size from
   1,400 to 3,100 SF
  New Luxury Suites in Tower Adjacent to The Four Seasons    Work is progressing – completion in late 2019
   Macao: Expand suite inventory with approximately 280 new
   luxury suites, ranging in size from 2,000 to 4,700 SF
  The Parisian Macao: Create additional suites               Phase I is completed – Phases II and III progressing – all Phases
                                                              completed by end of 2018

 The Venetian Macao and Four Seasons Hotel Macao:            Completed
  Total property hotel room renovations
 VIP Gaming:
  The Venetian Macao: VIP gaming areas expanded and          Work is progressing – completion throughout 2018 and 2019
   refurbished
  The Plaza Macao: VIP gaming areas expanded and             Work is progressing – completion throughout 2018 and 2019
   refurbished

       Investments Targeted to Drive Growth in Every Segment of the Macao Market…
               Retail, Entertainment, Hotel, and Both Mass and VIP Gaming
                                                                                                                                  18
Sands China
Market‐Leading Cotai Strip Property Portfolio
         LVS’ Cotai Strip Properties                   Leadership in Macao
                                           Investment:
                                       1
                                               ~$13 billion today, ~$14 billion by 2020
                                               Nearly 30 million square feet of interconnected
                                                facilities on Cotai
                                       2   Hotel Inventory:
                                                ~12,200 rooms and luxury suites as of 2Q18
                                                >50% of hotel inventory on Cotai
                                       3   Retail:
                                                ~1.9 million square feet of gross leasable retail –
                                                 revenue of $477 million as of TTM 2Q18
                                       4   Entertainment:
                                               The Macao leader in entertainment – more seats,
                                                shows and venues than any other operator
                                       5   MICE:
                                               The Macao leader in convention and group
                                                meetings. ~80% of all MICE square footage in
                                                Macao is Sands
                                       6   Reinvestment:
                                                ~280 new luxury suites in the tower adjacent to
                                                 Four Seasons Hotel Macao in late 2019
                                                ~370 new tower suites in the St. Regis Macao
                                                 Hotel tower in late 2019
                                                Upon completion, the re‐themed Londoner
                                                 Macao will provide a third European‐themed
                                                 iconic destination resort on Cotai in 2020      19
Sands China Departmental Profit Contribution
       Diversified and Stable

                                                    Sands China Departmental Profit Contribution1
                                TTM 2Q17                                                                                                          TTM 2Q18

                                                                                                                          Other
       Other                                                                                                               4%
                                                                                                                                                 VIP
        4%                     VIP
                                                                                                                                                 9%
                               12%
                                                                                                               Mall
                                                                                                               12%
Mall                                               Mass Tables
13%                                                   49%                                                                                                         Mass Tables
                                                                                                                                                                     53%

                                                                                                              Hotel
       Hotel                                                                                                  15%
       14%

                      Slots                                                                                                   Slots
                       8%                                                                                                      7%

                                              Mass Tables / Slots and Non‐Gaming
                                 Generated 91% of Sands China’s Departmental Profit in TTM 2Q18
  1. Represents departmental profit from The Venetian Macao, Sands Cotai Central, The Parisian Macao, The Plaza Macao and Four Seasons Hotel Macao, the Sands Macao and Ferry Operations and Other
  (before unallocated expenses) for the TTM periods ended June 30, 2018 and 2017.                                                                                                                    20
Capital Expenditures Expectations
   Future Planned Investments Composed of Income Producing Projects and Maintenance
  ($ in millions)

  $2,500
                                                                                                                                  LVS Capex Expectations

  $2,000

                                                                   $1,529
  $1,500                                                                                 $1,398
                                                                     $285                   $67                                                $1,250
                                             $1,179
                                                                                                                                $1,005         $150
                        $898                   $190
  $1,000                                                                                                                        $100
                                                                                                                                               $175
                                                                                                                  $837                                             $770
                                                                     $767                  $925                           $19   $100
                        $210                  $390                                                                              $105           $325
                                                                                                                  $194                   $50
                        $192                                                                                                                                       $270
                                               $75                                                                $147          $150           $100
     $500                           $49        $79                   $81                              $25
                        $447                  $445                   $396                                         $477          $500           $500                $500
                                                                                           $381
         $0
                      2013A                  2014A                 2015A                 2016A                    2017A         2018E          2019E              2020E
                                                                                                             1
                                            Maintenance Investments in Current Properties and Other     Sands Cotai Central St. Regis Hotel at SCC  The Parisian Macao
        Expansion, Renovation and Rebranding of SCC to The Londoner New Luxury Suites in St. Regis Macao Hotel Tower New Luxury Suites in Tower Adjacent to The Four Seasons Hotel Macao
Development Timeline
Sands Cotai Central                                                                                                                                       Pre‐Opening
St. Regis Hotel at Sands Cotai Central                                                                                                                    Post‐Opening
The Parisian Macao
Expansion, Renovation and Rebranding of SCC to The Londoner
New Luxury Suites in Tower Adjacent to The Four Seasons Hotel Macao
New Luxury Suites in St. Regis Macao Hotel Tower

     Future Capital Expenditures Focused on Driving Growth in Every Segment in the Macao Market
1. Reflects investments that are anticipated to generate incremental returns in our current property portfolio.
                                                                                                                                                                                           21
Market Leading Hotel Capacity at SCL
 Projected Macao Market 4/5 Star Hotel Rooms at December 31, 2020
            Projected Macao Market Gaming Operator Hotel Rooms at December 31, 20201
                                                                                                                                                     Cotai                               Total Market
                                                              New Development
                                                                                                                                                             % of Gaming                   % of Gaming      % of Total
   16,000                                                                                       Gaming Operator                          Rooms                Operators     Rooms           Operators         Market
                                                                                                Sands China                                12,879
                                                                                                                                                              ` 50%            13,168          45%             35%

                                                                                                Galaxy Entertainment                         3,920              15%              4,420         15%             12%
   14,000                13,168
                                                                                                Melco Crown                                  3,772              15%              3,987         14%             10%
                                                                                                              2
                                                                                                SJM Holdings                                 2,000               8%              2,839         10%              8%
                        The Parisian
   12,000                 Macao                                                                 Wynn Resorts                                 1,706               7%              2,714          9%              7%
                           2,699                    Sands Macao, 289                            MGM China                                    1,400               5%              1,982          7%              5%
                                                                                                   Subtotal Gaming Operators               25,677               100%           29,110          100%            77%
   10,000                                           New Luxury Suites in Tower
                                                                                                Other 4/5 Star                                   ‐                     ‐         8,631          0%             23%
                                                    Adjacent to Four Seasons, 280
                            The                     Four Seasons Macao, 379                     Total                                      25,677               100%           37,741          100%            100%

     8,000            Venetian Macao                New Luxury Suites in St. Regis
                          2,905                     Macao Tower, 370                                                 City of Dreams Morpheus
                                                                                     Starworld, 500                                                                                         MGM Cotai, 1,400
                                                    St. Regis Macao, 400                                                Tower, 772 (Phased                                               (Phased Opening Began
     6,000                                                                           Broadway Macau, 320              Opening Began June 15,                                               February 13, 2018)
                                                                                                                                2018)
                                                         4,420                                                                             Sofitel Macau, 408
                                                                                        3,987                     Altira Macau, 215
     4,000
                         Sands Cotai                                                                                    2,839                            2,714
                           Central
                                                                                     Macau Studio City
                                                                                                                                                                                     1,982
                            5,846                                                                                       SJM Cotai                     Wynn Palace
     2,000                                            Galaxy  Macau3                      1,600
                                                          3,600                                                           2,000                         1,706                     MGM Cotai
                                                                                      City of Dreams                                                                                1,400
                                                                                           1,400                                                 Wynn Macau, 1,008              MGM Grand, 582
           0                                                                                                       Grand Lisboa, 431
                                                                                                                                     2
                       Sands China             Galaxy Entertainment                  Melco Crown                    SJM Holdings                     Wynn Resorts                 MGM China

            With a Market‐Leading ~US$14 Billion of Investment – by 2020, SCL Hotel Inventory
                            Will Represent 50% of All Hotel Rooms on Cotai
1. In addition to the hotel rooms that are owned by gaming operators presented here, there are approximately 8,631 additional four‐ and five‐star hotel rooms owned by non‐gaming operators in Macao at June 30, 2018.
2. Reflects only SJM Holdings owned hotels.
3. Reflects the opening of Galaxy Phase I and Phase II.
Source: Public company filings, Macao DSEC.                                                                                                                                                                         22
Macao Market
    Adjusted Property EBITDA Market Share by Operator
                                                    Historical Adjusted Property EBITDA Market Share1

                                       Sands China2                                                                                     All Others

                                                                                        Macao
                                                                                      Leader in
                                                                                     Market Share
      40%                                                                             of EBITDA       80%
                                                                                                                             72%
                                                                                                                                                                    67%
                                                                                                                               10%
                                                                                                                                                                      7%
      30%                                                                                             60%
                                                                                                                               16%
                                                                                                                                                                      17%

      20%                                                                                             40%                                                             5%
                                                                                                                               14%
                                                                    33%                                                                                               15%
                              28%
                                                                                                                               14%
      10%                                                                                             20%

                                                                                                                                                                      23%
                                                                                                                               18%

       0%                                                                                               0%
                             2012                               TTM 1Q18                                                      2012                                TTM 1Q18
                                                                                 3                                                                     3
                                               Sands China              Galaxy            MPEL               SJM              Wynn             MGM

     In A Growing Macao Market ‐‐ Sands China Generated 33% of Macao Market EBITDA in 2017
Source: Company Reports.
1. Reflects reported adjusted property EBITDA for the six concessionaires and sub‐concessionaires.
2. Reflects adjusted property EBITDA from The Venetian Macao, Sands Cotai Central, The Parisian Macao, The Plaza Macao and Four Seasons Hotel Macao, the Sands Macao and Ferry Operations & Other. 23
3. Galaxy only includes EBITDA from Starworld, Galaxy Macau and Broadway Macau. MGM reflects Adjusted EBITDA (excluding royalty fees) from MGM Macau and MGM Cotai as reported by MGM Resorts.
Marina Bay Sands
     Delivered $368 Million of Adjusted Property EBITDA
   Adjusted property EBITDA decreased 25.2% to $368                                                                                           Adjusted Property EBITDA
    million due principally to lower rolling volume and hold                                                                              and Adjusted Property EBITDA Margin
    compared to 2Q17                                                                                                          ($ in millions)
                                                                                                                                                 Actual                     Hold‐Normalized
     Hold‐normalized adjusted property EBITDA
         decreased 4.7% to $368 million                                                                                            $600
                                                                                                                                                $492
                                                                                                                                                                                                    80%
                                                                                                                                   $500                                                             70%
   Mass (non‐Rolling tables and slots) win‐per‐day                                                                                $400                     $368              $386           $368   60%
    increased 9.7% to $4.85 million                                                                                                $300     59.0%
                                                                                                                                                                             55.1%                  50%
                                                                                                                                                            52.2%                        52.2%
                                                                                                                                   $200                                                             40%
          — Slot win increased 12.8% to $167 million
                                                                                                                                   $100                                                             30%
          — Non‐Rolling table win increased 7.9% to $274                                                                             $0                                                             20%
                                                                                                                                             2Q17           2Q18              2Q17           2Q18
            million
                                                                                                                                      Non‐Rolling Table and Slot Win Per Day
   Rolling volume decreased 32.6% to $5.87 billion;                                                                           ($ in millions)
    Rolling win % was 2.84% in 2Q18 compared to 4.42% in
    the prior‐year quarter                                                                                                     $6.0
                                                                                                                                                                                     $4.85
                                                                                                                                                        $4.42
   ADR increased 5.6% to $418 while occupancy increased                                                                       $4.0
                                                                                                                                                        $1.63
                                                                                                                                                                                     $1.84
    2.6 pts to 96.9%
                                                                                                                               $2.0
                                                                                                                                                        $2.79                        $3.01

                                                                                                                               $0.0
                                                                                                                                                        2Q17                        2Q18
                                                                                                                                                       Non‐Rolling Tables      Slot Machines

       Non‐Rolling Table and Slot Win Per Day Grew 9.7% to $4.85 Million at Marina Bay Sands in 2Q18
                                                                                                                                                                                                          24
Note: Prior periods presented have been updated to reflect the implementation of ASC 606, Revenue from Contracts with Customers.
Marina Bay Sands
  Diversified Sources of Departmental Profit

                     Marina Bay Sands Hold‐Normalized Departmental Profit Contribution
                                      TTM 2Q171                                                                                                    TTM 2Q181

       Other                  VIP
        4%                    13%
                                                                                                                                            VIP
                                                                                                                                            17%
                                                       Mass Tables                                               Other
                  Mall                                                                                            4%                                              Mass Tables
                                                          37%                                                                                                        33%
                  8%
                                                                                                                                 Mall
                                                                                                                                 8%

                          Hotel                                                                                                           Hotel
                          18%                                                                                                             16%                 Slots
                                                    Slots                                                                                                     22%
                                                    20%

 Diversified Sources of Profit at Marina Bay Sands Have Generated Strong Cash‐Flow at the Property

1. With no adjustment for hold‐normalization, VIP contribution would have been 17% (vs. 13%) in the TTM period ended June 30, 2017 and 25% (vs. 17%) in the TTM period ended June 30, 2018.   25
Marina Bay Sands: The Reference Model for
Future Integrated Resort Projects
 Ideal reference site for jurisdictions considering MICE‐based Integrated Resort development

 Provides exceptional economic power and direct contributions to tourism, employment and GDP
  growth

                          The Most Compelling and Proven Model to
                      Demonstrate the Many Benefits of an Integrated Resort

                                                                                                26
Retail Mall Portfolio in Asia Generating
    Strong Revenue and Operating Profit
                                                    Trailing Twelve Months Retail Mall Revenue
              ($ in millions)

                                                                                                                                                                                   TTM 2Q18 Sales
              $700                                                                                  $647                            $646                            $649
                                    $628                            $641                                                                                                            per Sq. Foot²

              $600                                                                                                                                                                          MBS:
                                                                    $164                             $167                            $171                            $173                  $1,773
                                    $165
              $500
                                                                                                                                                                                     Parisian Macao:
                                     $57                             $68                             $66                              $64                             $62                  $649
              $400                                                                                                                                                                          SCC:
                                     $64                             $64                             $63                              $58                             $59
                                                                                                                                                                                            $849
              $300                                                                                                                   $131                            $132             Four Seasons:
                                    $127                            $127                             $131
                                                                                                                                                                                      Luxury: $5,540
                                                                                                                                                                                      Other: $1,782
              $200

                                                                                                                                                                                          Venetian:
              $100                  $215                            $218                             $220                           $222                             $223                  $1,656

                 $0
                                    2Q17                            3Q17                            4Q17                            1Q18                            2Q18
                                                                                                                          1
                      The Venetian Macao                   Four Seasons Macao                  Sands Cotai Central                 The Parisian Macao                 Marina Bay Sands
      Operating                    $559M                           $568M                          $571M                           $569M                            $572M
      Profit
      Operating                       89%                            89%                             88%                            88%                              88%
      Profit Margin
1. At June 30, 2018, approximately 470,000 square feet of gross leasable area was occupied out of a total of up to approximately 600,000 square feet of retail mall space that will be featured at completion
of all phases of Sands Cotai Central’s renovation, rebranding and expansion to the Londoner.
2. Tenant sales per square foot is the sum of reported comparable sales for the trailing 12 months divided by the comparable square footage for the same period. Only tenants that have occupied mall         27
space for a minimum of 12 months are included in the tenant sales per square foot calculation.
Rising Retail Tenant Sales Across Asia Portfolio
     Trailing Twelve Months’ Sales per Square Foot1

        ($ per Sq. Foot)
                                                                                                                                                                TTM 2Q18 v
                                                                          TTM 2Q18                TTM 1Q18                  TTM 4Q17    TTM 3Q17    TTM 2Q17     TTM 2Q17

        The Shoppes at Marina Bay Sands                                   $       1,773          $       1,719              $   1,590   $   1,506   $   1,482       19.6%

        Shoppes at Venetian                                               $       1,656          $       1,591              $   1,389   $   1,357   $   1,340       23.6%

        Shoppes at Four Seasons
            Luxury Retail                                                         5,540                  5,236                  4,750       4,538       4,337       27.7%
            Other Stores                                                          1,782                  1,846                  1,731       1,533       1,483       20.2%

        Shoppes at Cotai Central                                                     849                    802                  744         711         676        25.6%

        Shoppes at Parisian2                                                         649                    623                  574         531         N/A          N/A

                                        Robust Retail Sales Growth at Each of Our Properties in Asia

1. Tenant sales per square foot reflect sales from tenants only after the tenant has been open for a period of 12 months.                                                    28
2. The Shoppes at Parisian opened in September 2016.
Las Vegas Operations Update
     Hold‐normalized Adjusted Property EBITDA of $106 million

          Adjusted property EBITDA decreased 2.5% to $77 million                                                                             Adjusted Property EBITDA
                                                                                                                                         and Adjusted Property EBITDA Margin
           —        Hold‐normalized adjusted property EBITDA                                                                  ($ in millions)
                    • Increased 23.3% to a 2Q property record $106                                                                               Actual               Hold‐Normalized
                        million
                                                                                                                               $160                                                         40%
                    •       Margin increased 280 basis points to 24.2%
                                                                                                                               $140
          Hotel room revenue increased 10.4% to $149 million, a 2Q                                                            $120                                                 $106    30%
           property record                                                                                                     $100                                       $86
                                                                                                                                            $79            $77
                                                                                                                                   $80                                              24.2%   20%
           —        ADR increased 3.9% to $241, while occupancy                                                                            20.2%                          21.4%
                                                                                                                                   $60                    19.2%
                    increased 4.6 pts to 97.3%, driving RevPAR of $235                                                             $40                                                      10%
          Table games drop decreased 2.8% to $342 million, while                                                                  $20
           win percentage decreased 860 basis points to 7.7%                                                                        $0                                                      0%
                                                                                                                                            2Q17          2Q18            2Q17      2Q18
           —        Non‐Baccarat drop increased 10.5% to $210 million
                                                                                                                                          Composition of Table Games Drop
           —        Baccarat drop declined 18.5% to $132 million                                                               ($ in millions)
                                                                                                                                                                  ‐2.8%
          Slot win increased 7.5% to $57 million                                                                              $500
    Most promising opportunities for future growth:                                                                            $400                       $352                    $342
                                                                                                                               $300
           —        Convention and group meeting business                                                                                                 $190                    $210
                                                                                                                               $200
           —        Increase in group & FIT room pricing                                                                       $100                       $162                    $132
           —        Non‐gaming offerings                                                                                           $0
                                                                                                                                                      2Q17                      2Q18
           —        International Baccarat business                                                                                                   Baccarat            Non‐Baccarat

Note: Prior periods presented have been updated to reflect the implementation of ASC 606, Revenue from Contracts with Customers.
                                                                                                                                                                                                  29
Sands Bethlehem Update
     Leading Tri‐State Region Property
                                                                                                                                              Adjusted Property EBITDA
   Adjusted property EBITDA decreased 18.9% to $30
                                                                                                                                         and Adjusted Property EBITDA Margin
    million, with low hold compared to 2Q17 negatively
                                                                                                                              ($ in millions)
    impacting the financial performance of the property.
    Table games hold was 17.7% in 2Q18 and 20.8% in                                                                                $50                                         50%
    2Q17                                                                                                                           $40           $37                           40%
                                                                                                                                                                   $30
   Table games drop increased 5.1% to $290 million                                                                                $30                                         30%

   Slot handle increased 3.8% to $1.22 billion                                                                                    $20          25.9%
                                                                                                                                                                  22.1%
                                                                                                                                                                               20%

                                                                                                                                   $10                                         10%
   ADR increased 0.6% to $163 with 94.4% occupancy,
    driving RevPAR of $154                                                                                                         $0                                          0%
                                                                                                                                                 2Q17              2Q18
   The Outlets at Sands Bethlehem (150,000 SF) feature
    29 stores including Coach, Tommy Hilfiger, DKNY,                                                                                      Composition of Table Games Drop
    GUESS and European Body Concepts Day Spa                                                                                 ($ in millions)

   The Sands Bethlehem Event Center (50,000 SF)                                                                               $300               $276                $290

          —        Recent headline events have included Tony                                                                                      $132
                                                                                                                                                                      $120
                                                                                                                               $200
                   Bennett, Train, Jackson Brown, Tom Jones, Gov’t
                   Mule, Brian Regan and Nick Swardson
                                                                                                                               $100
                                                                                                                                                  $144                $170

                                                                                                                                   $0
                                                                                                                                                  2Q17               2Q18
                                                                                                                                                 Baccarat       Non‐Baccarat
                                                                                                                                                                                     30
Note: Prior periods presented have been updated to reflect the implementation of ASC 606, Revenue from Contracts with Customers.
Geographically Diverse Sources of EBITDA
    EBITDA Contribution by Geography in 2Q 2018
($ in millions)

         LVS Consolidated Adjusted Property EBITDA1                                                                 LVS Consolidated Hold‐Normalized Adj. Prop. EBITDA1

                                            $1,225M                                                                                                         $1,234M

                                       United                                                                                                            United
                                       States                                                                                                            States
                                         9%                                                                                                               11%

                      Singapore                                                                                                            Singapore
                         30%                                                                                                                  30%
                                                                                                                                                                                Macao
                                                            Macao                                                                                                                59%
                                                             61%

1. The Macao region includes adjusted property EBITDA from The Venetian Macao, Sands Cotai Central, The Parisian Macao, The Plaza Macao and Four Seasons Hotel Macao, the Sands Macao and Ferry Operations and Other. The
Singapore region includes adjusted property EBITDA from Marina Bay Sands and the United States region includes adjusted property EBITDA from the Las Vegas Operating Properties and Sands Bethlehem.
                                                                                                                                                                                                                            31
Disciplined Execution of Our Global Growth Strategy
Focused on the Most Promising Global Development Opportunities
   Uniquely positioned to bring our unmatched track record and powerful convention‐based business model to the
    world’s most promising Integrated Resort development opportunities
   Balance sheet strength designed to support two potential large‐scale developments, each of which could represent
    greater than $10 billion of investment in the future
   Development opportunity objectives:
    —   Target minimum of 20% return on total invested capital
    —   25% ‐ 35% of total project costs to be funded with equity (project financing to fund 65% ‐ 75% of total project
        costs)
                          Principal Areas of Future Development Interest:

                                   Macao                                   Singapore

                                    Japan                                 South Korea                                     32
Appendix
Historical Hold‐Normalized Adj. Property EBITDA1

     ($ in millions)                                                   1Q17                         2Q17                        3Q17                        4Q17                        1Q18                         2Q18

     Macao Operations 2
         Reported                                                  $          626               $         600               $         651               $         730               $          789               $         750
         Hold‐Normalized                                           $          594               $         597               $         641               $         757               $          767               $         730

     Marina Bay Sands
         Reported                                                  $          364               $         492               $         442               $         457               $          541               $         368
         Hold‐Normalized                                           $          387               $         386               $         410               $         389               $          430               $         368

     Las Vegas Operations
         Reported                                                  $          122               $           79              $           76              $         114               $          141               $           77
         Hold‐Normalized                                           $          120               $           86              $           90              $         114               $          141               $         106

     Sands Bethlehem
         Reported                                                  $            36              $           37              $           40              $            34             $            29              $           30
         Hold‐Normalized                                           $            36              $           37              $           40              $            34             $            29              $           30

     LVS Consolidated
         Reported                                                  $      1,148                 $      1,208                $      1,209                $      1,335                $      1,500                 $      1,225
         Hold‐Normalized                                           $      1,137                 $      1,106                $      1,181                $      1,294                $      1,367                 $      1,234
1. This schedule presents hold‐normalized adjusted property EBITDA based on the following methodology:
    ‐ for Macao Operations: if the quarter’s rolling win percentage is outside of the 3.00%‐3.30% band, then a hold adjustment is calculated by applying a rolling win percentage of 3.15% to the rolling volume for the quarter.
    ‐ for Marina Bay Sands: if the quarter’s rolling win percentage is outside of the 2.70%‐3.00% band, then a hold adjustment is calculated by applying a rolling win percentage of 2.85% to the rolling volume for the quarter.
    ‐ for Las Vegas Operations: if the quarter’s baccarat win percentage is outside of the 18.0%‐26.0% band, then a hold adjustment is calculated by applying a baccarat win percentage of 22.0%, and if the quarter’s non‐baccarat win
      percentage is outside of the 16.0%‐24.0% band, then a hold adjustment is calculated by applying a non‐baccarat win percentage of 20.0%.
    ‐ for Sands Bethlehem: no hold adjustment is made.
    ‐ for all properties: gaming taxes, commissions paid to third parties on incremental win, bad debt expense, discounts and other incentives are applied to determine the hold‐normalized adjusted property EBITDA impact.
2. Adjusted property EBITDA presented here reflects adjusted property EBITDA from The Venetian Macao, Sands Cotai Central, The Parisian Macao, The Plaza Macao and Four Seasons Hotel Macao, Sands Macao and Ferry
Operations and Other.                                                                                                                                                                                                                     34
Note: Prior periods presented have been updated to reflect the implementation of ASC 606, Revenue from Contracts with Customers.
Debt Maturity Profile
    Debt Maturity by Year1
          ($ in millions)
     $4,000

     $3,500                                                                                                                                      $3,274

     $3,000                                                                                                      $2,769

     $2,500                                                                                                       485

     $2,000                                                                                                                 $1,881

                                                                                                 $1,529
     $1,500
                                                                         $1,096
                                                                                                                  2,249
     $1,000                                                                                                                 1,845
                                                                                                                                          $598
                                                                                                  1,432
        $500                                       $221                     998
                             $77                                                                                                          563
            $0                                       112
                                      2
                            2018                    2019                   2020                   2021            2022      2023          2024   2025
                                                                      SCL                                       MBS                  US

     % of Total                1%                     2%                    10%                     13%               24%    16%           5%     29%

                Completed Extensions of U.S. Term Loan and Singapore Credit Facilities in 1Q18
                                                                                                                                                          35
1. Maturity profile includes issuance of $1.35 billion of incremental U.S. term loans completed in June 2018.
2. Amounts maturing from July 1 through December 31, 2018.
Market‐Leading ~$14 Billion of Investment in
   Macao’s Future as a Leisure & Business Tourism Destination
           Portfolio of                                Family-friendly                          World-Class Entertainment and
 ~13,000 Suites and Hotel Rooms                        Entertainment                            Events for Chinese Consumers

       ~1.9 Million sq. feet
    of World Class Shopping                            The Broadest
                                                                                            Addition of ~650 New Luxury Suites in
                                                       and Deepest
                                                                                             St. Regis Macao Tower and Tower
                                                           Mass                               Adjacent to Four Seasons in 2019
                                                          Tourism
                                                         Offerings
                                                         in Macao
                                                                                           Conversion of SCC to Londoner - 2020

                                                                                                   Expansion of Mass Market
Highly Themed Tourism Attractions                                                              Offerings with The Parisian Macao

                                                                     ~Two Million sq.
                                                                          feet of
                                                                       Conference,
                                                                      Exhibition and
                                                                     Carpeted Meeting
                                                                          Space

    Our Diversified Convention‐Based Integrated Resort Offerings Coupled with Industry Leading Branding and Service Offerings
                Appeal to the Broadest Set of Customers and Provide a Competitive Advantage in the Macao Market                     36
Macao Visitation Opportunity
Business & Leisure Tourism Expenditure Drivers

      Future Growth Drivers             As a result, Macao’s Mass visitors will:

   More efficient and affordable
                                               Come From Farther
    transportation infrastructure
                                                Away

   Greater number of hotel rooms
                                               Stay Longer
    and non‐gaming offerings in
    Macao
                                               Spend More On:
                                                 •   Lodging
   Additional tourism attractions in
                                                 •   Retail
    Macao and Hengqin Island
                                                 •   Dining
                                                 •   Entertainment
   Rapidly expanding middle‐class               •   Gaming
    with growing disposable income
    and a desire for tourism
                                                                               37
Supplemental Information
 2Q18 and 2Q17
                 ($ in millions)                                                                                                           Three Months Ended June 30, 2018

                                                                                                               Amortization             Loss on           Pre-Opening
                                                                                             Depreciation      of Leasehold            Disposal or              and                                                                         Adjusted
                                                                           Operating             and               Interests           Impairment         Development             Royalty           Stock-Based          Corporate          Property
                                                                       Income (Loss)         Amortization          in Land             of Assets              Expense              Fees             Compensation         Expense            EBITDA
                 Macao:
                   The Venetian Macao                                  $          295        $         34      $               1   $              -       $           -       $           -         $            1   $           -      $         331
                   Sands Cotai Central                                            111                  62                      2                  -                       1               -                  -                   -                176
                   The Parisian Macao                                              73                  40                      1                  -                   -                   -                  -                   -                114
                   The Plaza Macao and Four Seasons Hotel Macao                    (29)                    8              -                        92                     1               -                  -                   -                   72
                   Sands Macao                                                     45                      6              -                       -                   -                   -                      1               -                   52
                   Ferry Operations and Other                                      (25)                    4              -                       -                   -                   26                 -                   -                     5
                 Macao Operations                                                 470                  154                     4                   92                     2               26                     2               -                750
                 Marina Bay Sands                                                 270                  71                      5                  -                   -                   21                     1               -                368
                 United States:
                   Las Vegas Operating Properties                                  85                  38                 -                           1               -                   (47)               -                   -                   77
                   Sands Bethlehem                                                 24                      6              -                       -                   -                   -                  -                   -                   30
                 United States Property Operations                                109                  44                 -                           1               -                   (47)               -                   -                107
                 Other Development                                                     (2)             -                  -                       -                       2               -                  -                   -                 -
                 Corporate                                                         (50)                    5              -                        12                 -                   -                  -                     33              -
                                                                       $          797        $         274     $               9   $              105     $               4   $           -         $            3   $             33   $       1,225

                                                                                                                                           Three Months Ended June 30, 2017

                                                                                                               Amortization             Loss on           Pre-Opening
                                                                                             Depreciation      of Leasehold            Disposal or              and                                                                         Adjusted
                                                                           Operating             and               Interests           Impairment         Development             Royalty           Stock-Based          Corporate          Property
                                                                       Income (Loss)         Amortization          in Land             of Assets              Expense              Fees             Compensation         Expense            EBITDA
                 Macao:
                   The Venetian Macao                                  $          207        $         43      $               1   $                  3   $           -       $           -         $            2   $           -      $         256
                   Sands Cotai Central                                             63                  67                      2                  -                       1               -                      1               -                134
                   The Parisian Macao                                              45                  58                 -                       -                       2               -                      1               -                106
                   The Plaza Macao and Four Seasons Hotel Macao                    49                      9                   1                  -                       1               -                  -                   -                   60
                   Sands Macao                                                     30                      8                   1                  -                   -                   -                  -                   -                   39
                   Ferry Operations and Other                                      (23)                    3              -                       -                   -                   25                 -                   -                     5
                 Macao Operations                                                 371                  188                     5                      3                   4               25                     4               -                600
                 Marina Bay Sands                                                 385                  78                      4                  -                       1               24                 -                   -                492
                 United States:
                   Las Vegas Operating Properties                                  80                  47                 -                       -                   -                   (48)               -                   -                   79
                   Sands Bethlehem                                                 29                      8              -                       -                   -                   -                  -                   -                   37
                 United States Property Operations                                109                  55                 -                       -                   -                   (48)               -                   -                116
                 Other Development                                                     (1)             -                  -                       -                       1               -                  -                   -                 -
                 Corporate                                                         (47)                    6              -                       -                   -                       (1)            -                     42              -
                                                                       $          817        $         327     $               9   $                  3   $               6   $           -         $            4   $             42   $       1,208

Note: Prior periods presented have been updated to reflect the implementation of ASC 606, Revenue from Contracts with Customers.                                                                                                                           38
Supplemental Information
 YTD 2Q18 and YTD 2Q17
                 ($ in millions)                                                                                                            Six Months Ended June 30, 2018

                                                                                                               Amortization             Loss on           Pre-Opening
                                                                                             Depreciation      of Leasehold            Disposal or              and                                                                         Adjusted
                                                                           Operating             and               Interests           Impairment         Development             Royalty           Stock-Based          Corporate          Property
                                                                       Income (Loss)         Amortization          in Land             of Assets              Expense              Fees             Compensation         Expense            EBITDA
                 Macao:
                   The Venetian Macao                                  $          604        $         69      $               3   $              -       $           -       $           -         $            3   $           -      $         679
                   Sands Cotai Central                                            256                  115                     4                  -                       1               -                      1               -                377
                   The Parisian Macao                                             145                  82                      1                      1               -                   -                      1               -                230
                   The Plaza Macao and Four Seasons Hotel Macao                    35                  15                      1                   92                     2               -                  -                   -                145
                   Sands Macao                                                     86                  12                 -                       -                   -                   -                      1               -                   99
                   Ferry Operations and Other                                      (52)                    8              -                       -                   -                   53                 -                   -                     9
                 Macao Operations                                               1,074                  301                     9                   93                     3               53                     6               -              1,539
                 Marina Bay Sands                                                 706                  145                     9                  -                   -                   48                     1               -                909
                 United States:
                   Las Vegas Operating Properties                                 248                  70                 -                           1               -                (101)                 -                   -                218
                   Sands Bethlehem                                                 47                   12                -                       -                   -                   -                  -                   -                   59
                 United States Property Operations                                295                  82                 -                           1               -                (101)                 -                   -                277
                 Other Development                                                     (5)             -                  -                       -                       5               -                  -                   -                 -
                 Corporate                                                        (115)                10                 -                        16                 -                   -                  -                     89              -
                                                                       $        1,955        $         538     $           18      $              110     $               8   $           -         $            7   $             89   $       2,725

                                                                                                                                            Six Months Ended June 30, 2017

                                                                                                               Amortization             Loss on           Pre-Opening
                                                                                             Depreciation      of Leasehold            Disposal or              and                                                                         Adjusted
                                                                           Operating             and               Interests           Impairment         Development             Royalty           Stock-Based          Corporate          Property
                                                                       Income (Loss)         Amortization          in Land             of Assets              Expense              Fees             Compensation         Expense            EBITDA
                 Macao:
                   The Venetian Macao                                  $          451        $         84      $               3   $                  4   $           -       $           -         $            3   $           -      $         545
                   Sands Cotai Central                                            134                  135                     4                  -                       2               -                      2               -                277
                   The Parisian Macao                                              71                  113                     1                  -                       2               -                      1               -                188
                   The Plaza Macao and Four Seasons Hotel Macao                    88                  19                      2                  -                       2               -                  -                   -                111
                   Sands Macao                                                     74                   17                     1                  -                   -                   -                      1               -                   93
                   Ferry Operations and Other                                      (44)                    7              -                       -                   -                   49                 -                   -                   12
                 Macao Operations                                                 774                  375                 11                         4                   6               49                     7               -              1,226
                 Marina Bay Sands                                                 648                  153                     8                      1                   1               45                 -                   -                856
                 United States:
                   Las Vegas Operating Properties                                 201                  92                 -                           1               -                   (93)               -                   -                201
                   Sands Bethlehem                                                 58                  15                 -                       -                   -                   -                  -                   -                   73
                 United States Property Operations                                259                  107                -                           1               -                   (93)               -                   -                274
                 Other Development                                                     (4)             -                  -                       -                       4               -                  -                   -                 -
                 Corporate                                                         (96)                 13                -                       -                   -                       (1)            -                     84              -
                                                                       $        1,581        $         648     $           19      $                  6   $           11      $           -         $            7   $             84   $       2,356

Note: Prior periods presented have been updated to reflect the implementation of ASC 606, Revenue from Contracts with Customers.                                                                                                                           39
Macao Market Background
 and Infrastructure Slides
Mass Gaming Generates Over 80%
  of Gaming Operating Profit in Macao
    Composition of Macao Market Gross Gaming Revenue1 and Est. Gaming Operating Profit2
                               Quarter Ended June 30, 2018                                                                        TTM Ended June 30, 2018
           ($ in millions)                                                                                ($ in millions)
                                  $9,092M                               $2,367M                                                $35,742M                                $9,182M
           100%                                                                                          100%

                                                                          18%                                                                                              19%
             80%                                                                                           80%
                                     47%                                                                                            48%

             60%                                                                                           60%

             40%                                                          82%                              40%                                                             81%
                                     53%                                                                                            52%
             20%                                                                                           20%

               0%                                                                                            0%
                         Gross Gaming Revenue                      Operating Profit                                     Gross Gaming Revenue                        Operating Profit
                             Mass Tables and Slots                  VIP Gaming                                             Mass Tables and Slots                     VIP Gaming

                             Mass Gaming Generates Over 80% of Gaming Operating Profit in Macao
1. Market‐wide GGR for all periods through 1Q18 as reported by the casino operators in their public filings (does not include revenue from Galaxy’s City Clubs business). All figures reported in Hong Kong
dollars have been converted to USD using a 7.75 exchange rate. Market‐wide GGR for 2Q18 is estimated by LVS management based on DICJ reported data and LVS management’s estimated differences
between DICJ reporting and win reported by operators in prior public filings.
2. Assumes operating profit margin of 10.0% on gross VIP revenue and a blended margin of 40% on mass table and slot gross revenue.                                                                            41
Source: Public company filings, Macao DICJ.
Five Trends Supporting Growth
  in the Macao Market in the Future
                      260 million tourists are expected to travel outside of China by 2025, up from
    1                 135 million in 2016. Chinese tourism expenditures are expected to increase
                      from $261 billion in 2016 to $672 billion by 2025
                      Transportation infrastructure and connectivity throughout China, especially in
    2                 the Pearl River Delta region, will be expanded, including through the opening
                      of the $20B Hong Kong – Zhuhai – Macao bridge in 2018

    3                 ~2,650 new hotel rooms are expected to open in Macao through 2020

    4                 Increasing length of stay in Macao

                      The Greater Bay Area Initiative and the development of Hengqin Island will
    5                 contribute to Macao’s diversification and to its further development as a
                      leisure and business tourism destination

                                                                                                       42
Sources: Bernstein research.
1
                    China Is The World’s Largest and Fastest
                    Growing Outbound Tourism Market
                                              Outbound Travel Tourism Spending
($ in billions)

$700                                                                                          $672

$600

$500                                                                                                  +$411 Billion
                                                                                                      in Incremental
                                                                                                           Spend
$400

$300             $261

$200

$100

    $0
                 2016         2017E   2018E   2019E   2020E   2021E   2022E   2023E   2024E   2025E

                        Outbound Chinese Tourism Spend is Projected to Reach $672 Billion by 2025
Source: Bernstein research.
                                                                                                                      43
1
                    China Is The World’s Largest and Fastest
                    Growing Outbound Tourism Market (cont.d)
                                      Number of Outbound Travel Trips from China
(Trips in millions)

    300
                                                                                               260
    250

    200

    150              135

    100

      50

        0
                    2016      2017E   2018E    2019E   2020E   2021E   2022E   2023E   2024E   2025E

          In the Next 10 Years Outbound Travel From China is Projected to Reach 260 Million Trips
Source: Bernstein research.
                                                                                                       44
1             Strong Growth in Chinese Outbound Tourism

                                             Chinese Outbound Tourism to Select Markets
2010‐2017
  CAGR           +18%         +17%         +12%           +12%         +15%         +22%        +8%        +12%         +27%       +37%          +8%           +10%
(in millions)

      50.0

                                                                                                                                                                     44.4

      40.0

      30.0

                                                                                                                                                       22.2   22.7

      20.0

                                                                                                                                                13.2
                                                                                                                                         10.0
      10.0
                                                                                                                             7.4
                                                                                                                 4.2
                                                                2.5          3.2         3.2         2.8
                      1.3          1.5           2.0     1.1           1.2                     1.6         1.9         1.4         1.1
                0.4          0.5           0.9                                     0.8
        0.0
                Australia   Germany        France        Malaysia     Singapore     USA        Taiwan      Korea       Japan       Thailand     Macao         Hong Kong
                                                                                     2010       2017

                                            Continued Growth of Chinese Outbound Tourism
                                   Is Expected to Contribute to the Macao Mass Tourism Opportunity
                                                                                                                                                                            45
Source: CLSA, Macao DSEC, Hong Kong Tourism Board, Bloomberg.
1            Chinese Middle Class Consumption Growth
                     Chinese Middle Class Consumption in 2030 is Projected to Reach $10.0 trillion

                                  Global Middle Class Consumption in 2030 (US$ in trillions)
  ($ in trillions)

   $15

                                                                                                                                                                            $10.0
   $10

      $5                                                                                                                                                        $4.0

                                                                                                                         $2.3                $2.5

                      $1.1               $1.2                $1.2                $1.3                $1.4

       $‐
                     France             Brazil            Mexico             Germany               Russia              Japan            Indonesia                USA        China

                                         Continued Chinese Middle Class Consumption Growth
                                   is Expected to Contribute to the Macao Mass Tourism Opportunity
Note: Brookings Institution defines the global middle class as those households with daily expenditures between $10 and $100 per person in purchasing power parity terms.
Source: Brookings Institution, UN, World Bank, The Financial Times.                                                                                                                 46
2
                   Infrastructure: China’s High‐Speed Rail
                   Connecting More of Mainland China to Macao

                                                                                             Beijing – Guangzhou High‐Speed Rail

                                                                                           World’s longest high‐speed rail route

                                                                                           Covers 2,298km in ~10 hours (compared
                                                                                            to 22 hours previously)

                                                                                           Provides seamless connection from
  Guangzhou – Zhuhai Intercity Rail                                                         Northern China to the Macao border via
                                                                                            the Guangzhou‐Zhuhai Intercity Rail
 Rail line connecting Guangzhou to
  Zhuhai, where the Gongbei border                                                         4‐10 trains in each direction each day
  gate to Macao is located
 Guangzhou is the largest city in
  Guangdong province and is a key
                                                                                           Wuhan – Guangzhou High‐Speed Rail
  economic and transportation hub
 Reduces travel time from                                                            Wuhan is the capital of Hubei Province and one
  Guangzhou to Zhuhai from 2+                                                          of the most populous cities in Central China
  hours by bus to as short as 60                                                       with ~10 million people
  minutes
                                                                                      Wuhan is an important economic and
 Zhuhai station opened in Jan 2013                                                    transportation hub in Central China
 Future link to Macao Light Rail                                                     HSR reduces travel time to Guangzhou from 11
  System                                                          Hong Kong            hours by bus to under 4 hours by train
                                                          Macao
 70 ‐ 75 trains in each direction each
  day                                                                                 50‐60 trains in each direction each day

                                Plan to Continue Heavy Investment in the High Speed Rail System –
                                  Approximately US$130 Billion Per Year for the 2016‐2020 Period
Source: SCMP, New York Times, Chinatrainguide.com, LVS.
                                                                                                                                        47
Infrastructure: Meaningful Improvements
      2
                    Throughout the Pearl River Delta Region
                                    Guangzhou
                                Population: 16M
                                                                                         Wuhan – Guangzhou High‐Speed Rail
                            GDP Per Capita: US$20,000                              • Four hour train ride
                                                                                   • 50‐60 trains in each direction per day

     Guangzhou – Zhuhai Intercity Rail                                                                                     Guangzhou – Shenzhen – Hong Kong Rail
• 60 ‐ 80 minute train ride (2+ hours by bus)                                                                        • Two hour train ride from Guangzhou to Hong Kong
• 70 – 75 trains in each direction per day                                                                           • 12 trains in each direction per day
• Final link to Gongbei border gate completed in
  January 2013
                                                                                                                                                               Shenzhen
                                                                                                                                                          Population: 12M
        China Border Gate Expansion
                                                                                                                                                      GDP Per Capita: US$25,000
• Daily capacity increased from 150,000 to
  350,000 people in 2H13
• Reduced average wait times on China side of
  border                                                                                                                                                      Hong Kong
                                                                                                                                                          Population: 7.3M
                                                                                                                                                      GDP Per Capita: US$43,700

          Gongbei – Hengqin Railway
 • Connects the Gongbei border crossing with
   Hengqin Island                                                                                                                     Hong Kong‐Macao‐Zhuhai Bridge
 • Stops at Lotus Bridge crossing and ends at                                                                                       ~US$20B (expected completion: 2018)
   Chimelong theme park
 • Expected completion 2019
                                                                                                                                      Macao
                                                                                                                               Population: 0.7M
                   Hengqin Island                                                                                          GDP Per Capita: US$77,476
•   Special economic area                                                                                                                                               Legend
•   Over $20B of overall investment expected                                      Taipa Ferry Terminal
•   Over 10,000 hotel rooms expected (~5,000 today)                      • Opened June 2017                                                                             Existing
•   Phase I of Chimelong theme park opened in Jan. ‘14                   • 40 ferry per hour capacity and helipad
    and attracted 8.5M visitors in ‘16. 20M annual                       • 114 immigration clearance counters                                                           Future
    visitors expected at completion of all phases                          and e‐channels
Source: DSEC, World Bank, Bloomberg, SCMP, Shenzen Government Online, Government of Guangzhou Municipality, Chinatrainguide.com, Analyst reports. Note: population and GDP data from 2016   48
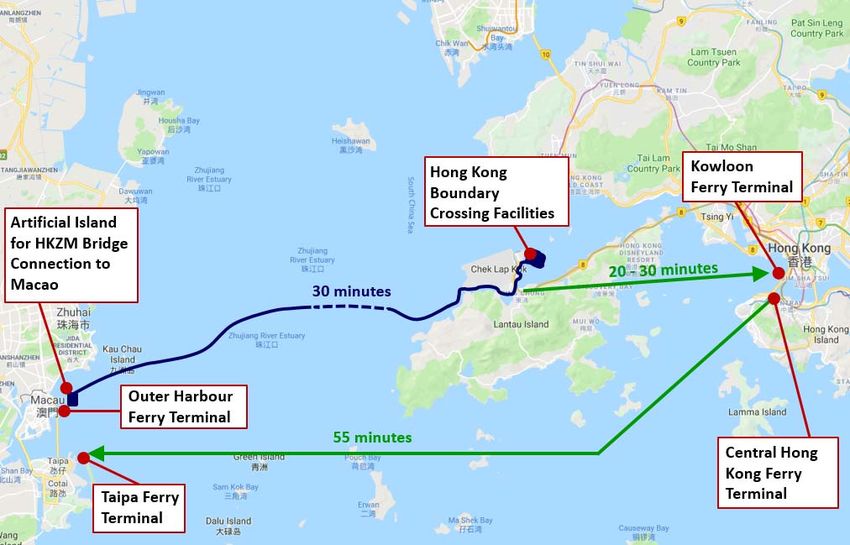
except 2017 data for Macao.
2              The Hong Kong‐Macao‐Zhuhai Bridge
                    $20 Billion Bridge Linking the Pearl River Delta
      Prior to project completion, no roads directly connect Zhuhai and Macao with Hong Kong. Automobile traffic must currently detour via the
       Humen Bridge ‐ a 200km journey of approximately four hours

      The bridge is expected to open in 2018

      The main structure was completed on July 7, 2017

      Access to Macao will be provided via an artificial island which will connect to the Macao peninsula and offer parking for ~3,000 inbound cars

      The main structure measures 29.6 kilometers, consisting of a 22.9‐km bridge section and 6.7‐km underground tunnel

      When completed, it will be one of the longest bridges in the world, equivalent to more than 15 Golden Gate Bridges lined end to end

Source: Xinhua, China Daily, SCMP, HZMB.hk., Macau News.

                                                                                                                                                       49
3            Market Leading Hotel Capacity at SCL
                     Projected Macao Market 4/5 Star Hotel Rooms at December 31, 2020
            Projected Macao Market Gaming Operator Hotel Rooms at December 31, 20201
                                                                                                                                                     Cotai                               Total Market
                                                              New Development
                                                                                                                                                             % of Gaming                   % of Gaming      % of Total
   16,000                                                                                       Gaming Operator                          Rooms                Operators     Rooms           Operators         Market
                                                                                                Sands China                                12,879
                                                                                                                                                              ` 50%            13,168          45%             35%

                                                                                                Galaxy Entertainment                         3,920              15%              4,420         15%             12%
   14,000                13,168
                                                                                                Melco Crown                                  3,772              15%              3,987         14%             10%
                                                                                                              2
                                                                                                SJM Holdings                                 2,000               8%              2,839         10%              8%
                        The Parisian
   12,000                 Macao                                                                 Wynn Resorts                                 1,706               7%              2,714          9%              7%
                           2,699                    Sands Macao, 289                            MGM China                                    1,400               5%              1,982          7%              5%
                                                                                                   Subtotal Gaming Operators               25,677               100%           29,110          100%            77%
   10,000                                           New Luxury Suites in Tower
                                                                                                Other 4/5 Star                                   ‐                     ‐         8,631          0%             23%
                                                    Adjacent to Four Seasons, 280
                            The                     Four Seasons Macao, 379                     Total                                      25,677               100%           37,741          100%            100%

     8,000            Venetian Macao                New Luxury Suites in St. Regis
                          2,905                     Macao Tower, 370                                                 City of Dreams Morpheus
                                                                                     Starworld, 500                                                                                         MGM Cotai, 1,400
                                                    St. Regis Macao, 400                                                Tower, 772 (Phased                                               (Phased Opening Began
     6,000                                                                           Broadway Macau, 320              Opening Began June 15,                                               February 13, 2018)
                                                                                                                                2018)
                                                         4,420                                                                             Sofitel Macau, 408
                                                                                        3,987                     Altira Macau, 215
     4,000
                         Sands Cotai                                                                                    2,839                            2,714
                           Central
                                                                                     Macau Studio City
                                                                                                                                                                                     1,982
                            5,846                                                                                       SJM Cotai                     Wynn Palace
     2,000                                            Galaxy  Macau3                      1,600
                                                          3,600                                                           2,000                         1,706                     MGM Cotai
                                                                                      City of Dreams                                                                                1,400
                                                                                           1,400                                                 Wynn Macau, 1,008              MGM Grand, 582
           0                                                                                                       Grand Lisboa, 431
                                                                                                                                     2
                       Sands China             Galaxy Entertainment                  Melco Crown                    SJM Holdings                     Wynn Resorts                 MGM China

            With a Market‐Leading ~US$14 Billion of Investment – by 2020, SCL Hotel Inventory
                            Will Represent 50% of All Hotel Rooms on Cotai
1. In addition to the hotel rooms that are owned by gaming operators presented here, there are approximately 8,631 additional four‐ and five‐star hotel rooms owned by non‐gaming operators in Macao at June 30, 2018.
2. Reflects only SJM Holdings owned hotels.
3. Reflects the opening of Galaxy Phase I and Phase II.
Source: Public company filings, Macao DSEC.                                                                                                                                                                         50
Overnight Visitation to Macao Is Growing
         4
                        Faster Than and Now Exceeds “Day‐trip” Visitation
              Day‐Trip Visitors to Macao from China                                                                       Overnight Visitors to Macao from China

(in millions)                                                                                                      (in millions)

     14.0                                                                                                          14.0

                                                                                                                                                                              11.9
     12.0                                                 11.5                                                     12.0
                                                                  11.2

                                                                           10.2     10.3                                                                               10.3
     10.0                                         9.7                                                              10.0                                    9.7
                                                                                                                                                                 9.2
                                8.8      8.8                                                                                                         8.9
                                                                                                                                               8.1
      8.0                                                                                                           8.0                  7.3
                        6.9
                                                                                                                                   6.3                                                       6.2
                5.8
      6.0                                                                                                  5.5      6.0                                                               5.4
                                                                                                    4.9                    5.2

      4.0                                                                                                           4.0

      2.0                                                                                                           2.0

      0.0                                                                                                           0.0
              2009 2010 2011 2012 2013 2014 2015 2016 2017                                          YTD YTD               2009 2010 2011 2012 2013 2014 2015 2016 2017                YTD YTD
                                                                                                   Jun‐17 Jun‐18                                                                     Jun‐17 Jun‐18

            Benefitting From Additional Hotel Capacity and Transportation Infrastructure
     Overnight Visitation Grew 14.8%, while “Day‐trip” Visitation Increased 12.2% in YTD June ‘18
Source: Macao DSEC (Statistics and Census Service of the Macao Government) statistical database.                                                                                                     51
5
                      The Greater Bay Area
                       Promoting the Economic and Social Integration of the Pearl River Delta
       The Greater Bay Area (“GBA”) initiative was officially presented during the 12th National Peoples Congress in March 2017
       The GBA initiative promotes the development of the Pearl River Delta region via economic and social integration of 11 cities, including Hong
        Kong, Macao and nine major cities of Guangdong Province (the most affluent and populous province in China)
       The Guangdong‐Hong Kong‐Macao Greater Bay Area is geared to replicate the success stories of the world's three leading bay areas ‐ in
        New York, San Francisco and Tokyo

 Greater Bay Area
  A 56,500 sq. km area encompassing 11 cities
  US$1.36 trillion GDP in 2016, with an estimated population of 66.7 million
  Two key railways: Beijing‐Guangzhou and Beijing‐Kowloon lines
  2 of China’s 4 busiest airports: Hong Kong International Airport (2nd in China, 8th
   globally) and Baiyun Airport of Guangzhou (4th in China, 15th globally)
  Connected by the Hong Kong‐Macao‐Zhuhai bridge (expected completion in 2018)

            Area (10,000 km)                              Population (mm)                                GDP (US$ Trillion)
                                                 80.0                                            2.0
    6
                                                 70.0                                            1.8
    5                                                                                            1.6
                                                 60.0
                                                                                                 1.4
    4                                            50.0                                            1.2
    3                                            40.0                                            1.0
                                                 30.0                                            0.8
    2
                                                                                                 0.6
                                                 20.0
    1                                                                                            0.4
                                                 10.0                                            0.2
    0                                             0.0                                            0.0
        Tokyo   New York    San     Pan‐Pearl           Tokyo   New York    San    Pan‐Pearl           Tokyo   New York    San     Pan‐Pearl
        Delta    Delta   Francisco River Delta          Delta    Delta   Francisco River Delta         Delta    Delta   Francisco River Delta
                           Delta                                           Delta                                          Delta

                                    The Greater Bay Area Accounted for 5% of China’s Population and ~12%
                                                           of China’s GDP in 2016
Source: China Daily, SCMP, Guangdong‐Hong Kong‐Macao Greater Bay Area Forum, Tencent, CEIC, National Bureau of Statistics of China, Airports Council International, equity research.   52
You can also read