Trust with Private and Common Property: Effects of Stronger Property Right Entitlements
←
→
Page content transcription
If your browser does not render page correctly, please read the page content below
Trust with Private and Common Property: Effects of Stronger
Property Right Entitlements
James C. Cox 1, Daniel T. Hall 2

1 Georgia State University, Experimental Economics Center, 14 Marietta Street, P.O. Box 3992,
Atlanta, GA, USA 30302-3992
E-mail: jccox@gsu.edu
2 High Point University, Phillips School of Business, Drawer 40, 833 Montlieu Avenue, High Point,
NC, USA 27262
E-mail: dhall@highpoint.edu

     Abstract: Is mutually beneficial cooperation in trust games more prevalent with private
     property or common property? Does the strength of property right entitlement affect the
     answer? Cox, Ostrom, Walker, et al. [1] report little difference between cooperation in
     private and common property trust games. We assign stronger property right entitlements by
     requiring subjects to meet a performance quota in a real effort task to earn their
     endowments. We find that cooperation is lower in common property trust games than in
     private property trust games, which is an idiosyncratic prediction of revealed altruism
     theory [2].

     Keywords: trust game; private property; common property; real effort; revealed altruism
     theory.

1. Introduction

   Cox, Ostrom, Walker, et al. [1], henceforth COW, addressed notions that common property is
typically over-extracted, neglected, and abused. Predictions of such “tragedies of the commons” are
often based on reasoning that confounds common property, per se, with open access common property
[3]. COW reports an experiment with two payoff-equivalent 2-person sequential games: the private
property trust game and the common property trust game. Both games are designed to measure the
generosity of the first mover and the cooperative response of the second mover. The games differ only
in the initial assignment of endowments as private or common property. COW reports no significant
differences between private property and common property games for either first mover generosity or
second mover cooperation. We investigate whether these results are robust to assigning stronger
property right entitlements. We assign stronger property right entitlements by requiring subjects to
meet a performance quota in a real effort task to earn their private or common property endowments.
This experiment design change reveals some new insights about behavior in private and common
property environments. We find that a prediction of revealed altruism theory [2], that cooperation will
be lower in the common property game, is confirmed under stronger property right entitlements. This
2
same pattern in the data is inconsistent with all of the purely distributional models of social preferences
including the Fehr and Schmidt [4], Bolton and Ockenfels [5], Charness and Rabin [6], and Cox and
Sadiraj [7] models; for these models, the private and common property trust games are isomorphic.
Section 2 describes the private and common property trust games and the related theoretical
predictions. Section 3 discusses the COW study design and results. Section 4 discusses the potential
impact of stronger property right entitlements. Section 5 presents our experiment design with a real
effort task. Section 6 reports results from our treatments which use the strategy method for eliciting
second mover decisions. We find that cooperation is lower in the common property game than in the
private property game even though first movers are significantly more generous in the former. Section
7 addresses the possibility that the results could be driven by the strategy method rather than the real
effort task. This motivates our use of the sequential move protocol, (used in COW) in additional
treatments. We find weaker results with the sequential move protocol but they point in the same
direction. One interesting observation is that first movers make choices at the extremes of “full trust”
and “no trust” in the common property trust game, suggesting that they anticipate the type of second
mover choices that we observe (and that are predicted by revealed altruism theory). In section 7 we
also pool data from all treatments (including the COW treatment) to look for effects of the real effort
task and the strategy method. Questionnaire responses are used to control for individual subject
differences in further data analysis. Section 8 concludes.
2. Theory
The private property trust (PPT) game and the common property trust (CPT) game are both derived
from the investment game [8]. In the investment game, there is a first mover and a second mover who
interact in a one-shot game. Both start with an endowment of $10 as their private property endowment.
The second mover is constrained to keep his/her $10 endowment whereas the first mover can choose to
send none, some, or all of his/her $10 (in multiples of $1) to the second mover. Each dollar sent by the
first mover is tripled by the experimenters and added to the private endowment of the second mover.
Sending money creates a surplus which the second mover must then decide whether or not to share. A
maximum surplus of $20 is generated when the first mover sends his entire endowment of $10. The
second mover can return to the first mover any amount (in whole dollars) less than or equal to the
amount received. The amount sent by the first mover is traditionally interpreted as a measure of the
level of trust in the second mover. The amount returned is traditionally interpreted as a measure of the
level of the second mover’s positive reciprocity. However, Cox [9] showed that first mover and second
mover actions can be partially motivated by unconditional altruism by using first mover and second
mover dictator controls for the investment game. Still, we use the traditional label when we refer to
decisions of “full trust” and “no trust” made in the CPT game.
The 2-person PPT game is different from the investment game in only one way: the second mover
can return none, some, or all of his $10 endowment in addition to the tripled amount received from the
first mover if she wishes to do so. This change is necessary to make comparisons with the CPT game
possible because the second mover is not required to extract any of the ($40) common property. The 2-
person CPT game is the “inverse” version of the PPT game. In the CPT game, $40 (the maximum
amount that can be generated for subject pairs in the investment game and 2-person PPT game) is3
assigned as the amount of common property endowment. The common property is described as a
“joint decision fund” both subjects can withdraw from. The first mover can withdraw up to $10, in
whole dollar amounts, from the joint fund and place it into his/her private fund. Each dollar withdrawn
by the first mover reduces the joint fund by $3. The second mover’s decision is how to divide the
remaining joint fund between her private fund and the paired first mover’s private fund after the first
mover’s decision.
The 2-person PPT game and the 2-person CPT game are isomorphic game pairs according to
“economic man” game theory. Decisions should not be different in the two games according to that
theory. The subgame perfect Nash equilibrium is the same for both games: the second mover will
return none (divide none) of his private fund (remaining joint fund) to the first mover, and the first
mover, expecting this, will send nothing to the second mover (withdraw the maximum of $10 from the
joint fund).
The investment game has the same subgame perfect Nash equilibrium for economic man game
theory as the PPT and CPT games. However, deviations from this prediction have been observed in
many experiments with the investment game including those reported in [8, 9]. New theory has been
developed to model social preferences in order to account for deviations from the standard theory of
selfish preferences [4, 5, 6, 7]. These theories also predict that the PPT game and CPT game are
isomorphic because they model unconditional preferences over the final distribution of payoffs
amongst the set of distributions available. The two games are isomorphic under these theories because
the games have the same feasible set of final payoffs.
According to revealed altruism theory [2] these games are not isomorphic. That theory was
developed to model reciprocity. The theory allows for individual preferences to include other players’
earnings as well as their own earnings. Other-regarding preference ordering A is more altruistic than
preference ordering B if preferences A exhibit higher willingness to pay to increase another's material
payoffs than do preferences B [2, p. 34]. (Preference orderings A and B can represent the
preferences of two different people or the preferences of the same person into different situations.)
Revealed altruism theory also provides a partial ordering of the generosity of opportunity sets that the
first mover can offer the second mover [2, p. 36].
Revealed altruism theory states that an individual's preferences can become more or less altruistic
depending on the actions of another agent. Reciprocity, denoted as Axiom R, states that if a first mover
provides a more generous opportunity set to the second mover then the second mover’s preferences
will become more altruistic towards the first mover. Data that support Axiom R come from many
experiments [2, 10] including the triadic design experiment with the investment game reported by
Cox [9]. In that experiment, Treatment A is the investment game and Treatment C takes the
opportunity sets offered by first movers in Treatment A and randomly allocates them to second
movers. Second movers in Treatment A know that they received a more generous opportunity set
because the first mover was generous, while second movers in Treatment C know their paired first
movers had no part in determining their opportunity sets. Support for Axiom R comes from
significantly greater amounts returned by second movers in Treatment A than in Treatment C after
taking into account the income effects of more generous opportunity sets [2]. Following evidence from
investment game data, the similar PPT and CPT games should also follow Axiom R.4
Axiom S is the element of revealed altruism theory that implies that the PPT and CPT games are not
isomorphic. Axiom S distinguishes between acts of commission, which overturn the status quo, and
acts of omission which uphold the status quo. The status quo is defined by the opportunity set
determined by the initial endowments. A first mover upholds the status quo by offering the second
mover the opportunity set defined by the initial endowment and overturns the status quo by offering
any other opportunity set. Axiom S states that if the decision made by a first mover overturns the status
quo then the reciprocal response, for individuals with preferences consistent with Axiom R, will be
stronger than when the status quo is upheld.
A second mover’s opportunity set is defined as a convex set of (m, y) ordered pairs, where m
represents the second mover’s (“my”) money payoff and y represents the first mover’s (“your”) money
payoff. For PPT and CPT games the collections of opportunity sets that the first mover can offer the
second mover are identical but the status quo set determined by the endowments is different. The
opportunity set determined by the endowments in the PPT game is the least generous opportunity set a
first mover can offer in the PPT game because it provides the second mover only the opportunity to
share his own $10 private property endowment with the first mover. Each additional dollar that the
first mover sends to the second mover provides the second mover with a yet more generous
opportunity set. In contrast, the opportunity set determined by the endowments in the CPT game is the
most generous opportunity set a first mover can offer in the CPT game because it provides the second
mover with the opportunity to allocate $40 between the two players. Each additional dollar that the
first mover withdraws from the joint decision fund provides the second mover with a less generous
opportunity set. To uphold the status quo set the first mover must send nothing to the second mover in
the PPT game and withdraw nothing from the joint fund in the CPT game. A first mover overturns the
status quo set in the PPT game by sending any tokens. A first mover overturns the status quo set in the
CPT game by withdrawing any tokens.
A second mover with preferences consistent with Axioms R and S will care about how the
opportunity set actually chosen by the first mover compares to the entire collection of opportunity sets
the first mover could have chosen and also how the chosen set compares to the status quo opportunity
set. Second movers will respond more altruistically towards first movers who overturn the status quo
in the PPT game by sending 0, 1, 2, 3, …, or 10 tokens, respectively, than they do to first movers who
withdraw 10, 9, 8, 7, …, or 0 tokens, respectively, in the CPT game. Also, second movers will respond
less altruistically towards first movers who overturn the status quo in the CPT game by withdrawing 0,
1, 2, 3… or 10 tokens, respectively, than first movers who send 10, 9, 8, 7… or 0 tokens, respectively,
in the PPT game. The prediction is that second mover generosity will be lower in the CPT game than
in the PPT game for any pair of choices in which the first mover sends in the PPT game and
withdraws 10 in the CPT game.
How can Axiom S be tested in these two games? After controlling for the first mover’s decision by
matching the tokens left (not withdrawn) to the tokens sent, second movers should leave less for the
first movers in the CPT game than second movers return to first movers in the PPT game.5
3. The Cox, Ostrom, Walker et al. Study
The COW study supports Axiom R but not Axiom S. First and second mover other-regarding
preferences are revealed in both games but choices are not significantly different between the PPT and
CPT games. First movers are denoted as Type X players and second movers as Type Y players. Table
1 shows the summary data for the COW study. Their PPT game is denoted here as Treatment COW1
and their CPT game is labeled Treatment COW2. Treatment COW1 sessions generated 34 Type X
decisions (an average of $5.65 was sent) and 34 Type Y decisions (an average of $6.65 was returned).
Treatment COW2 sessions generated 34 Type X decisions (an average of $6.71 was left) and 34 Type
Y decisions (an average of $8.76 was returned).
Table 1. Summary of subject decisions and earnings for COW study.
Treatment COW1: Private Property Trust Game
N-Pairs = 34 Mean Std. Dev. Minimum Maximum
Tokens X Sent 5.65 3.83 0 10
$Y Returned 6.65 6.43 0 20
$X Earned 11.00 5.08 0 20
$Y Earned 20.29 9.09 0 40
Treatment COW2: Common Property Trust Game
N-Pairs = 34 Mean Std. Dev. Minimum Maximum
Tokens X Left 6.71 3.88 0 10
$Y Returned 8.76 8.20 0 20
$X Earned 12.12 6.60 0 20
$Y Earned 20.85 9.76 5 40
Figure 1 shows the distributions of Type X choices in COW1 and COW2. In Treatment COW1,
there are modes at 0, 7, and 10 tokens sent. Treatment COW2, displays modes at 0, 4, and 10 tokens
left. The shapes of the distributions are quite similar, although the distribution for the CPT game is
more right skewed. Table 2 shows the results of some standard parametric and non-parametric tests on
Type X data. The number of tokens left (not withdrawn) in the CPT game is greater than the number of
dollars sent in the PPT game, but the difference is insignificant.6
Figure 1. Comparison of Type X data for COW1 and COW2
50
40 30
Percent
20 10
0
0 1 2 3 4 5 6 7 8 9 10
Amount Sent (Left) by Type X
COW1 "PPT" COW2 "CPT"
Table 2. Parametric and non-parametric tests of Type X data in COW study
Parametric Tests Nonparametric Tests
Means Test Variance Test Mann-Whitney Test
Test K-S Test
(t-test) (F-test) (Rank Sum Test)
Null S.D.(COW1)/ Distributions
COW1 = COW2 COW1 = COW2
Hypothesis S.D.(COW2) =1 are Equal
t = -1.1325
f = 0.9733 z = -1.212
Pr(|T| > |t|) = D = 0.2059
2*Pr(F < f) = Pr > |z| = 0.2255
Test Statistic 0.2614 Exact p-value =
0.9384 Pr(COW1>COW2) =
Pr(T7
Type Y data provide support for Axiom R, as indicated by the “Type X Sent or Left” variable’s
statistical significance. However, the data do not provide support for Axiom S because the “Common
Property Dummy” variable’s estimated coefficient is insignificant.
Table 3. Tobit analysis of Type Y data in COW study
Number of Observations 67
Constant Term -2.192
(.2668)
Type X Sent or Left 1.37
(.0000)***
Common Property Dummy .128
(.9486)
Heteroscedasticity Term 0.013
(.1993)
Sigma Disturbance of Std. Dev. 5.04
(.0006)***
*p < 0.05 **p < 0.01 ***p < 0.001
Hypothesis tests reported in COW do not reject the hypothesis that the two games are isomorphic.
This finding is consistent with the weak preference ordering contained in Axiom S but it does not
provide support for a strong preference ordering. One of two possibilities can explain their results: (1)
subjects have preferences consistent with Axiom R but not with a strict preference version of Axiom S;
or (2) this particular environment and institution did not elicit latent preferences consistent with a strict
preference version of Axiom S. In the spirit of the second explanation we change the environment by
adding saliency to private and common property ownership. Specifically, we ask if strengthening
property entitlements will reveal preferences that are consistent with a strict preference version of
Axiom S and lead to behavioral differences between the private and common property trust games.
4. Stronger Property Right Entitlements
In typical experiments, monetary endowments are used as resources or property which subjects use
to make purchases, transfers, and other decisions. More often than not, monetary endowments are
given to subjects simply for participating in the experiment. In other words they receive “house
money” from the experimenter’s research budget and are asked to make decisions with that money.
Subjects could treat this “house money” differently than if the same money came from their regular
income [11]. Milton Friedman’s permanent income (PI) hypothesis states that subjects who prefer to
smooth lifetime consumption will have a lower marginal propensity to consume a one-time gain in
income [11, 12]. Although some subjects participate in multiple experiments, experiment house money
is not a regular source of income. Some studies have found that unexpected one-time gains encourage
risk taking with the new money [13, 14, 15, 16, 17]. However, Clark [11] looked for “house money”
effects in the voluntary-contributions mechanism (VCM) public goods game and found none, so the
“house money” effect is not a robust phenomenon.8
Why may property right entitlements not be strong enough already? If subjects regard their
endowments as house money, then they may not care about the distinction between private property
and common property. If this is true, then property ownership is not salient to the subject. One way to
strengthen entitlements and make property ownership salient is to have subjects earn their private or
common property endowments.
How might earning endowments create a stronger sense of entitlement? Subjects must bear more
effort costs in obtaining the property than the usual costs of showing-up and devoting time to the
experiment, which can develop a stronger attachment to the property. This could motivate subjects’
selfish tendencies to ensure they get the most out of the effort they invested in the game. It could also
strengthen subjects’ preferences for fairness or their risk preferences could change. Once the property
has been earned all costs to obtain it should be considered sunk costs. Whether or not subjects ignore
this sunk cost is an empirical question. Daniel Friedman [18] tested to see if subjects commit the sunk
cost fallacy under a variety of different settings, but surprisingly found very few cases where they did.
Another convention is to randomly assign subjects to roles with symmetric entitlements. Cherry et
al. [19] compared decisions made with unearned endowments in a dictator game baseline to a
treatment with earned endowments. Low-stakes (high-stakes) endowments of $10 ($40) were earned
by dictators answering less than 10 (10 or more) questions correctly on a quiz. Non-dictators had $0
endowments, and had no opportunity to take the quiz so entitlements were asymmetric. The percentage
of dictators who transferred $0 to the non-dictator increased from 19% (15%) in the low-stakes (high-
stakes) baseline to 79% (70%) in the earned endowments treatment [19]. Fahr and Irlenbusch [20]
looked at the effect of the relative strength of property rights between the first mover and second
mover in the trust game. There were three treatments defined by whether the first mover, second
mover, or both had to crack walnuts to play the trust game. If required to crack walnuts, subjects had to
collect 150g of walnut kernels in about 30 minutes to earn the right to play. They found that the second
movers were more generous towards first movers when the first movers worked and even more
generous when the first movers worked and second movers did not work. First mover decisions were
similar across treatments. Hoffman et al. [21] tested the effects of allowing subjects to earn the right of
playing first mover in the ultimatum game by scoring high on a general knowledge quiz. They found
that first movers offered smaller splits to the second movers, who were less likely to reject the offers,
then in the baseline treatment in which subjects were randomly assigned to the first mover and second
mover roles.
Since there is evidence that adding earned entitlements to endowments or player roles has an effect
in games similar to the COW experiment, we ask whether adding stronger private and common
property entitlements affects behavior differently in the PPT and CPT games. Entitlements will be
symmetric, and this will be implemented by having all players perform the same effort task.
5. Experiment Design
The key design departure of this study from the COW study is the addition of the real effort task.
This also required a switch from the hand-run procedure in COW to a computer-run experiment to
save time needed for subjects to perform the real effort task.1 The content of the computerized decision
1
The computer-run procedure was programmed using the Visual Basic Express 2008 Edition software.9
forms and questionnaires is identical to that in the COW study. Decision forms, questionnaires, and
instructions used in this experiment are available from the authors. Undergraduate students at Georgia
State University were recruited by email using the Experimental Economics Center (ExCEN) recruiter
software. The experiment was run using a double-blind procedure which prevents the subjects and
experimenters from being able to personally identify any subject’s decisions and payments. After
signing in, subjects entered the ExCEN computer lab and began reading instructions for the real effort
task.
The real effort task was intended to give subjects a stronger sense of entitlement to their private
property or common property endowment. Subjects had to meet a performance quota to earn their
endowment, which they were told would be used in the next part of the experiment. Subjects were also
told in advance that if their quota was not met then they would be paid their show-up fee of $5 and
asked to leave the experiment without participating in the decision task.
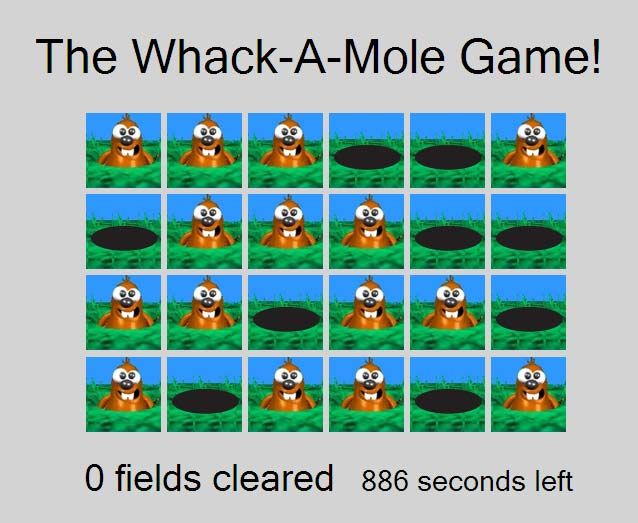
Figure 2. Computer screenshot of the real effort task
The real effort task was called the “whack-a-mole game.” Figure 2 shows a typical screen subjects
would see during the game. There is a 6 by 4 grid of moles and holes on the field. Each time the
subject mouse-clicked a mole picture the picture box would show a hole picture. If the subject clicked
on a hole picture nothing would happen. The object of the game is to mouse-click all of the moles until
the field is clear of moles (there is only a field of holes). Once a field is cleared the computer generates
a new field of moles for the subject to whack. Each picture box has an equal probability of being a
mole picture or a hole picture, so fields are halfway full of moles on average.2 The performance quota
required the subject to clear a pre-specified number of fields within an announced time limit. Subjects
2
Each subject faced the same fields in the same sequence because all subjects start with the same probability generating
seed.10
had to meet the quota to earn the tokens that were used in the PPT or CPT game. After the time ran out
for the whack-a-mole game anyone who did not meet the quota was paid $5 and asked to leave.3
Subjects were told that by meeting the performance quota they would earn an endowment to be
used in the next part of the experiment. The decision task was revealed after the whack-a-mole stage
was finished. In Treatment CH1, subjects had to clear 120 mole fields in 15 minutes to earn 10 tokens,
worth $1 each. These tokens became their private fund in the PPT game. In Treatment CH2, subjects
had to clear 120 mole fields in 15 minutes to earn 20 tokens, worth $1 each, which were combined
with the 20 tokens of another subject who met the quota and placed into a joint decision fund totaling
40 tokens, worth $40, to be used in the CPT game. Once the subjects who did not fulfill the quota left,
the remaining subjects were handed instructions for the PPT game if in Treatment CH1 or the CPT
game instructions if in Treatment CH2. After the whack-a-mole stage was completed the procedures of
the COW study were followed except the decisions were entered in computers.
For both games subjects were randomly paired as Type X and Type Y players. After reading the
instructions and listening to a scripted explanation, each subject chose a sealed envelope containing a
numbered mailbox key from a box containing identical envelopes. Subjects were told that the number
on the mailbox key was their private identification number. They were told the numbered key would
open a numbered mailbox containing their earnings from the decision making game plus their show-up
fee of $5. After subjects made their decisions, they filled out a questionnaire. While subjects were
filling out questionnaires, their payment envelopes were put in their mailboxes. Subjects collected their
earnings one at a time, in private, and subsequently left the laboratory.
6. Strategy Method Protocol Treatments
The COW study uses a sequential move protocol to elicit Type X and Type Y decisions. The
difficulty in testing Axiom S using the sequential move protocol is that only one Type Y decision is
made, and the potential responses to other opportunity sets the Type X could have offered are not
observed. Type X decisions could be distributed such that all possible decisions are observed
frequently, or decisions could be clustered. The latter case makes a direct test of Axiom S require a
very large sample under the sequential move protocol. The strategy method protocol offers the benefit
of making all potential responses observable. It does this by asking a Type Y player to submit a
planned response for each possible decision by a Type X player.
There are some potential problems with using the strategy method protocol. First is the reduction in
incentives for Type Y players. Type Y players now have to make multiple potentially binding
responses, yet only one decision determines their payoffs in the end. Their decision-making costs
increase, but their expected rewards do not. There is also a potential “hot” versus “cold” effect. A Type
Y response in the sequential move protocol is considered “hot” because it is potentially more
emotional for the Type Y player to learn the Type X player’s decision, and how the decision affects
their opportunities, before responding. The strategy method protocol is considered “cold” because
Type Y is submitting a planned response and does not know the Type X decision beforehand. There is
3
If only an odd number of subjects met the performance quota, then the subject who was closest to meeting the
performance quota was allowed to participate in the decision task.11
mixed evidence on the significance of hot versus cold responses. Three studies do not find a hot versus
cold effect [22, 23, 24], while two studies do find an effect [25, 26].
Treatments CH1 and CH2 use the strategy method protocol to elicit Type Y responses, which
requires 11 potentially binding decisions before learning the Type X player’s actual decision. Once a
pair of Type X and Type Y subjects make their decisions, the Type X decision makes the associated
Type Y response to that decision binding and the game is played out to calculate the final earnings.
Figure 3 shows a screen shot of the Type Y player’s decision sheet for the PPT game with the strategy
method protocol. The rows are organized by the Type X person’s potential actions in column A, with
the first row representing the status quo. A subject in enters an amount in each row of column C. The
computer calculates an amount for a row in column D after a value is entered in that row of column C.
The decision sheet for the CPT game is similar except the Type X player withdraws rather than
contributing so the value of column B decreases from $40 to $10.
Figure 3. Type Y decision screen for the strategy method protocol
126 undergraduate students from Georgia State University participated in Treatments CH1 and CH2
in four sessions. Table 4 shows the summary data for Treatments CH1 and CH2, the PPT and CPT
games, respectively. Treatment CH1 was conducted in two sessions and in total, 32 Type X decisions
were made (an average of $5.63 was sent) and 352 Type Y decisions were made (32 subjects made 11
decisions each and an average of $6.96 was returned).4 The CPT game was also conducted in two
4
Note that the average Type Y decisions in Treatments CH1 and CH2 cannot be directly compared to the average Type Y
decisions in COW which uses the sequential move protocol. First, Type Y players submit 11 decisions instead of one in the
strategy method protocol. Second, Type Y decisions correspond to actual Type X decisions in the sequential move protocol
but not in the strategy method protocol.12
sessions and in total, 31 Type X decisions were made (an average of $7.26 was left) and 341 Type Y
decisions were made (31 subjects made 11 decisions each and an average of $5.82 was returned).
Table 4. Summary data for strategy method treatments CH1 and CH2
Treatment CH1: Private Property Trust Game
N-Pairs=32
Mean Std. Dev. Minimum Maximum
(352 Y Decisions)
Tokens X Sent 5.63 3.94 0 10
$ Y Returned 6.96 6.25 0 20
$ X Earned 12.72 5.49 0 20
$Y Earned 18.53 8.87 0 40
Treatment CH2: Common Property Trust Game
N-Pairs = 31
Mean Std. Dev. Minimum Maximum
(341 Y Decisions)
Tokens X Left 7.26 3.64 0 10
$ Y Returned 5.82 6.70 0 25
$ X Earned 12.84 6.49 0 21
$Y Earned 21.68 7.56 10 40
Figure 4 compares the distributions of Type X decisions for the two games. For the PPT game there
are modes at 0, 3, and 10 tokens sent, and the distribution is W-shaped with a fat right tail at 10 tokens
sent. For the CPT game there are modes at 0, 5, and 10 tokens left, and the distribution is J-shaped
with half of the subjects choosing not to withdraw anything.13
Figure 4. Comparison of Type X data for CH1 and CH2
50
40
Percent
30
20
10
0
0 1 2 3 4 5 6 7 8 9 10
Amount Sent (Left) by Type X
CH1 "PPT" CH2 "CPT"
Table 5 shows the results of some standard parametric and nonparametric tests of Type X subject
data. The number of dollar left in the CPT game is greater than the number of dollars sent in the PPT
game, but the difference is insignificant.
Table 5. Parametric and non-parametric tests of Type X data
Parametric Tests Nonparametric Tests
Test Means Test Variance Test Mann-Whitney K-S Test
(t-test) (F-test) Test (Rank Sum
Test)
Null Hypothesis CH1 = CH2 S.D.(CH1)/ CH1 = CH2 Distributions are
S.D.(CH2) =1 Equal
Test Statistic t = -1.7088 f = 1.1710 z = -1.692 D = 0.2399
Pr(|T| > |t|) = 2*Pr(F < f) = Pr > |z| = 0.0906 Exact p-value =
0.0924 0.6673 Pr(CH1>CH2) = 0.256
Pr(T14
There are 352 and 341 Type Y decisions made in Treatments CH1 and CH2 respectively. Since
every Type Y player makes the same decision under the strategy method protocol a t-test can also be
conducted on the amounts returned, and significantly less is returned (p-value = 0.0104) in the CPT
game. Table 6 reports results from tobit estimation with data from Treatments CH1 and CH2. The
coefficient on the amount sent or left by Type X players is significantly positive, which provides
support for Axiom R. The coefficient on the common property dummy variable is significantly
negative, which provides support for Axiom S (together with Axiom R).
Table 6. Tobit analysis of Type Y data for Treatments CH1 and CH2
Number of Obs. 693
Constant Term -0.789
(.0634)
Type X Sent or Left 1.384
(.0000)***
Common Property Dummy -1.847
(.0001)***
Heteroscedasticity Term 0.0359
(.0000)***
Sigma: Disturbance of standard deviation 2.360
(.0000)***
*p < 0.05 **p < 0.01 ***p < 0.001
Suppose some first movers anticipate that second movers have preferences consistent with a strict
preference version of Axiom S. How would this affect their decisions? If a first mover is not
comfortable with fully trusting the second mover, then he may wish to some of send tokens (withdraw
less than 10 in the CPT game) but not send the maximum of 10 (withdraw more than 0 in the CPT
game). Sending a number of tokens less than ten in the PPT game may disappoint the second mover
but they may still make them happy because the status quo was even less generous. Withdrawing any
tokens may disappoint the second mover but also may anger them because the status quo was more
generous. At the extreme, in the CPT game the second mover may decide to punish the first mover for
withdrawing anything by leaving none of the remaining joint fund to the first mover. Four Type Y
subjects exhibit this extreme form of Axiom S consistency in Treatment CH2: they split equally the
remaining joint decision fund if zero tokens were withdrawn and left nothing for the Type X player if
she withdrew any tokens. If Type X players are preparing for the possibility of facing Type Y players
like these, then they are responding optimally by withdrawing 0 tokens if they are ready to fully trust
and 10 if they are not. If the first mover partially trusts the second mover, but is afraid the second
mover may also punish him for withdrawing, then he may respond optimally by withdrawing the
maximum of 10 tokens or none at all. These extremes are traditionally interpreted as “no trust” and
“full trust” although the latent levels of trust by first movers may be less extreme (because of the
presence of altruism). Figure 4 shows that modal responses in the CPT game are at these extremes;15
also more first movers choose not to withdraw anything (i.e., leave all 10) then to withdraw everything
possible.
7. Discussion
Why does the real effort task provides stronger support for Axiom S (i.e., rejection of the
isomorphism)? The real effort task may create a stronger sense of entitlement to the endowments with
which the Type X and Type Y subjects make decisions. When the Type X withdraws tokens in the
CPT game she destroys property that is not just jointly owned but now the Type X and Type Y players
may have a stronger sense of partial entitlement to the joint fund. In other words the real effort task
may create entitlements which make the property right assignments salient enough to bring Axiom S
preferences out of latency.
It is natural for one to ask whether the rejection of isomorphism is due to the adding of a real effort
task or to use of the strategy method. Both design changes may affect behavior. The real effort task
makes property ownership more salient. The strategy method lowers incentives because Type Y
subjects have to submit 11 decisions instead of one for the same expected payoff. To get more insight
we conducted sequential move protocol treatments with stronger property right entitlements.
7.1 Sequential Move Protocol Treatments
The experiment design and procedures for our sequential move protocol treatments are similar to
the COW study, except there are stronger property right entitlements. In Treatment CH3, subjects had
to clear 120 mole fields in 15 minutes to play the PPT game. In Treatment CH4, subjects had to clear
120 mole fields in 15 minutes to play the CPT game. In Treatment CH5, subjects had to clear 240 mole
fields in 30 minutes to earn the tokens necessary to play the same CPT game played in Treatment CH4.
Treatment CH5 was conducted to set the mole-whacking effort per dollar of endowment earned equal
to that in Treatments CH1 and CH3. The potential final earnings are identical in all three treatments.
184 undergraduate students from Georgia State University participated in Treatments CH3, CH4,
and CH5 run in seven sessions.5 Table 7 displays the summary statistics for these treatments using the
sequential move protocol. 56 subjects participated in Treatment CH3, the PPT game with a 120 mole
field task. Treatment CH3 generated 28 Type X decisions (an average of $4.75 was sent) and 28 Type
Y decisions (an average of $6.59 was returned). Treatment CH4, the CPT game with a 120 mole-field
quota, data was conducted in three sessions that generated 32 Type X decisions (an average of $5.28
was sent) and 32 Type Y decisions (an average of $6.14 was returned). Treatment CH5, the CPT game
with a 240 mole-field quota, data was conducted in two sessions, which generated 32 Type X decisions
(an average of $4.84 was sent) and 32 Type Y decisions (an average of $5.70 was returned).
5
188 subjects actually participated in the experiment. However 4 subjects were asked to leave because they were unable to
meet the mole quota in the last session of Treatment CH4. 3 of the 4 subjects could not meet the mole quota because the
computer software shutdown during the middle of the task for these individuals. Since the subjects faced unusual
circumstances, all 4 subjects were paid $15 in private for participation once they left the lab. Two subjects, in different
sessions, did not meet the mole quota in time for Treatment CH3. These 2 subjects were allowed to play the PPT game
because an even number of subjects was needed to generate unique Type X and Type Y pairings.16
Table 7. Summary data for sequential move protocol Treatments CH3, CH4, and CH5
Treatment CH3:Private Property Trust Game (Mole Quota = 120)
N-Pairs = 28 Mean Std. Dev. Minimum Maximum
Tokens X Sent 4.75 3.45 0 10
$ Y Returned 6.59 7.43 0 20
$ X Earned 11.84 5.36 0 20
$Y Earned 17.66 6.86 10 40
Treatment CH4: Common Property Trust Game (Mole Quota = 120)
N-Pairs = 32 Mean Std. Dev. Minimum Maximum
Tokens X Left 5.28 4.70 0 10
$ Y Returned 6.14 7.85 0 20
$ X Earned 10.87 5.86 0 20
$Y Earned 18.77 10.53 0 40
Treatment CH5: Common Property Trust Game (Mole Quota = 240)
N-Pairs = 32 Mean Std. Dev. Minimum Maximum
Tokens X Left 4.84 4.78 0 10
$ Y Returned 5.70 8.35 0 20
$ X Earned 10.86 5.99 0 20
$ Y Earned 18.83 10.27 0 40
Differences between Treatment CH4 and Treatment CH5 data are insignificant, so the Treatment
CH4 and CH5 data are pooled in some of our analysis. Table 8 summarizes the pooled Type X and
Type Y decisions from Treatments CH4 and CH5, the CPT game. 128 subjects participated in
Treatments CH4 and CH5 combined, which generated 64 Type X decisions (an average of $5.06 was
left) and 64 Type Y decisions (an average of $5.92 was returned).
Table 8. Treatments CH4 and CH5 combined common property trust game data
N-Pairs = 64 Mean Std. Dev. Minimum Maximum
Tokens X Left 5.06 4.71 0 10
$ Y Returned 5.92 8.04 0 20
$ X Earned 10.86 5.88 0 20
$Y Earned 18.80 10.32 0 40
Figure 5 displays the distributions of Type X decisions in all three treatments. Treatment CH4, the
PPT game, has a W-shaped distribution with modes at 0, 4, 5, and 10. Treatments CH4 and CH5, the
CPT game treatments, both have U-shaped distributions with heavy modes at 0 and 10. The
distribution of the higher mole quota treatment is even more sharply U-shaped with heavy modes at 0
and 10. Type X decisions move to the extremes of “full trust” and “no trust” in the CPT game but not
in the PPT game. This result is more pronounced in the sequential move protocol treatments.17
Figure 5. Comparison of Type X data for Treatments CH3, CH4, and CH5
50
40 30
Percent
20 10
0
0 1 2 3 4 5 6 7 8 9 10
Amount Sent (Left) by Type X
CH3 "PPT 120" CH4 "CPT 120" CH5 "CPT 240"
How does the PPT game compare to the CPT game in the sequential move protocol treatments
only? Table 9 reports parametric and non-parametric tests with Type X data. All tests fail to reject the
Table 9. Parametric and non-Parametric tests of Type X data
Parametric Tests Nonparametric Tests
Mann-Whitney Test Distributions Test
Null Hypothesis Means Test (t-test)
(Rank Sum Test) (K-S Test)
t = -0.0878 z = 0.277
Treatment CH3 = D = 0.2589
Pr(|T| > |t|) = 0.9303 Pr > |z| = 0.7821
Treatment CH5 Exact p-value = 0.224
Pr(T>t) = 0.4652 Pr(CH1>CH3) = 0.520
t = -0.5031 z = -0.245
Treatment CH3 = D = 0.2545
Pr(|T| > |t|) = 0.6168 Pr > |z| = 0.8065
Treatment CH4 Exact p-value = 0.240
Pr(TCH2) = 0.482
Treatment CH3 = t = 0.3559 z = -0.018
D = 0.2388
Treatment CH4 & Pr(|T| > |t|) = 0.7230 Pr > |z| = 0.9858
Exact p-value = 0.181
CH5 Pooled Pr(T>t) = 0.3615 Pr(CH2 |t|) = 0.7132 Pr > |z| = 0.6459
Treatment CH5 Exact p-value = 0.999
Pr(T18
null hypothesis that all treatments have similar mean amounts sent (left). The Komolgorov-Smirnov
test implies that no distribution is significantly different from another in any treatment comparison.
There appears to be no difference in the central tendency of tokens sent (left) by Type X players.
Table 10 reports that, for Type X data, the standard deviation of the CPT game (4.71) is
significantly greater than the standard deviation of the PPT game (3.45) for a standard deviation ratio
F-test (one-sided p-value = 0.0384). Table 11 shows the proportions tests of Type X data comparing
PPT and CPT sequential move protocol treatments. There are significantly greater proportions of 0 and
Table 10. Variance tests of Type X data
Null Hypothesis Standard Deviation Ratio Test
f = 0.5208
S.D.(Treatment CH3)/S.D.(Treatment CH5) =1 2*Pr(F < f) = 0.0889
Pr(F < f) = 0.0444*
f = 0.5389
S.D.(Treatment CH3)/S.D.(Treatment CH4) =1 2*Pr(F < f) = 0.1065
Pr(F < f) = 0.0533
f = 0.5370
S.D.(Treatment CH3)/S.D.(Treatments CH4 and CH5 pooled) =1 2*Pr(F < f) = 0.0767
Pr(F < f) = 0.0384*
f = 1.0347
S.D.(Treatment CH4)/S.D.(Treatment CH5) =1 2*Pr(F > f) = 0.9250
Pr(F > f) = 0.5375
*p < 0.05 **p < 0.01 ***p < 0.001
Table 11. Proportions tests of Type X data
Type X sent Private Property Common Property
N one-sided p-value N
(left) Trust Game Trust Game
0 0.1786 5 0.390625 0.0229* 25
1 0.0357 1 … 0.0642 0
2 0.0357 1 0.0625 0.301 4
3 0.1071 3 0.03125 0.0698 2
4 0.1429 4 0.015625 0.0066** 1
5 0.1429 4 0.03125 0.023* 2
6 0.1071 3 0.015625 0.0238* 1
7 0.0357 1 … 0.0642 0
8 ... 0 … … 0
9 … 0 … … 0
10 0.2143 6 0.453125 0.015* 29
*p < 0.05 **p < 0.01 ***p < 0.00119
10 tokens left in the CPT game. There are significantly greater proportions of 4, 5, and 6 sent (left) in
the PPT game, although there are fewer observations in the middle for comparison.
Table 12 reports three tobit regressions with Type Y return amounts as the dependent variable using
data from Treatments CH3, CH4, and CH5. The independent variables include the Type X amount sent
(left) variable and CPT game dummy variable. The Type Y data are consistent with Axiom R as
indicated by the “Type X Sent or Left” variable’s statistical significance. The data do not support a
strict preference version of Axiom S, as indicated by the “Common Property Dummy” variable’s
statistical insignificance. The lack of significance is likely coming from differences in the distribution
of Type X decisions between the PPT and CPT games. Roughly 1/3 of all Type X decisions are to send
0 or 10 tokens in the PPT game whereas to 2/3 of all Type X decisions are to withdraw 0 or 10 tokens
in the CPT game. The modal Type Y response to 0 tokens sent (10 tokens withdrawn) is to return
(leave) $0. When 10 tokens are sent in the PPT game, the average return is $16.67 (standard deviation
8.16), and when 0 tokens are withdrawn in the CPT game the average returned is $12.14 (standard
deviation 8.23). The average return in the PPT game is not significantly different (t-test one-sided p-
value = 0.1140), which is likely due to only 6 cases of all 10 tokens sent in the PPT game compared to
29 cases of 0 tokens withdrawn in the CPT game.6
Table 12. Tobit regressions of Type Y data in Treatments CH3, CH4, and CH5
Regression (1) (2) (3)
Data Set Treatment CH3, Treatment CH3 and Treatment CH3 and
CH4, and CH5 Data CH4 Data CH5 Data
N 92 60 60
Constant -4.108 -3.861 -3.352
(.0667) (.1117) (.0937)
Type X Sent or Left 1.799 1.753 1.727
(.0000)*** (.0000)*** (.0001 )***
Common Property Dummy -1.869 -1.995 -2.380
(.4914) (.4469) (.3592)
240 Mole Field-Quota -1.396 … …
(.5266)
Heteroscedasticity Term 0.017 0.014 .0313
(.0705) (.1776) (.0349 )*
Sigma: Disturbance Std. Dev. 4.650 4.913 2.766
(.0003)*** (.0007)*** (.0325)*
*p < 0.05 **p < 0.01 ***p < 0.001
The entitlements appear to be salient enough for the Type X person to anticipate the possibility of
Axiom S consistent Type Y choices in the sequential move protocol treatments. As a result, the Type
X person responds by withdrawing none or all 10 tokens from the joint decision fund based on the
6
If the number of cases were increased from 6 to 14, holding the mean and standard deviation constant, the difference
would become significant (t-test one-sided p-value = 0.0489).20
level of trust he has in the paired Type Y player. One interesting finding is that stronger evidence that
the PPT and CPT game pairs are not isomorphic in the sequential move protocol treatments comes
from Type X decisions. In the common property treatments 2/3 of Type X decisions were to withdraw
0 or all 10 tokens, that is, to fully trust or completely withdraw from trusting the Type Y player. One
possible interpretation is that the Type X person has some expectation that he may be paired with a
trustworthy Type Y player with reciprocal preferences consistent with Axiom R. If the Type X player
is playing the PPT game, he may choose to send an amount consistent with his level of trust (or
perceived probability of being matched with a trustworthy Type Y player). In the CPT game, a Type X
player may also wonder if the Type Y person has preferences consistent with Axiom R and Axiom S.
Suddenly, the act of withdrawing tokens out of partial trust is not a good strategy if the paired Type Y
with strongly Axiom S consistent preferences may refuse to reward a less but not least generous
opportunity set. In that case, the Type X person may decide to leave all (withdraw all) tokens if her
trust is high (low).
7.2 Questionnaire Data
After making their trust game decisions, subjects in all treatments were paid $5 to fill out a
questionnaire that asks for demographic information and answers to three questions about attitudes
toward trust. The three questions are:
1. Generally speaking, would you say that most people can be trusted or that you can’t be too
careful dealing with people?
Possible Answers: Can’t be too careful, Most people can be trusted, Don’t know
2. Would you say that most of the time people try to be helpful or that they are mostly just
looking out for themselves?
Possible Answers: Just look out for themselves, Try to be helpful, Don’t know
3. Do you think that most people would take advantage of you if they got a chance or would they
try to be fair?
Possible Answers: Most people would take advantage, They would try to be fair, Don’t know
Two dummy variables are created for the answers to each question. For question 1, the “Trust Pos”
dummy variable codes “Most people can be trusted” as 1, and the “Trust Null” Dummy variable codes
“Don’t know” as 1. Similar dummy variables are defined for questions 2 and 3.
Table 13 displays tobit regressions for Type X data using the variables described above. The tobit
lower and upper limits were set at 0 and 10. The first regression uses all of the data. The CPT game
dummy variable is significantly positive. The strategy method protocol dummy variable also has a
positive and significant effect on the amounts sent. The dummy variable for COW data is positive but
insignificant. It is intuitive why the coefficient for the Trust Pos and Fair Pos dummy variables are
significantly positive. Regressions (2) and (3) look at only one trust game at a time to see if the results
are robust to each game. The effect of the strategy method protocol on Type X decisions is stronger in21
the CPT game. Interestingly, an affirmative answer to the trust question has a stronger effect on the
amount left in the CPT game than on the amount sent in the PPT game. Responses to the fairness
question did a better job than trust question responses in explaining Type X decisions in the PPT game.
These findings suggest that there is a greater need for trust in the CPT game, and that perceptions of
fairness are relatively more important in the PPT game.
Table 13. Tobit regressions for Type X choice and questionnaire data
Regression (1) (2) (3)
Private Property Trust Common Property
Data Set All Data
Game Data Trust Game Data
N 220 92 128
Constant -12.042 -24.018 -11.275
(.0566) (.0102) (.2447)
Common Property 2.725 … …
Trust Game Dummy (.0489)*
COW Study 2.187 -0.190 4.185
Dummy (.1801) (.9006) (.2098)
Strategy Method 5.153 2.043 11.002
Dummy (.0027)** (.2012) (.0022)**
Male Gender 1.798 2.391 2.340
Dummy (.1916) (.0628) (.3932)
Age 0.520 1.279 0.426
(.0792) (.0053)** (.3287)
Trust Pos Dummy 6.831 2.590 12.996
(.0006)*** (.1272) (.0043)**
Trust Null Dummy 3.638 -0.083 9.703
(.1068) (.9650) (.0658)
Helpful Pos Dummy 0.767 -1.223 3.738
(.6422) (.4135) (.2721)
Helpful Null -4.465 -4.424 -4.790
Dummy (.0782) (.0518) (.3744)
Fair Pos Dummy 7.117 7.828 6.951
(.0001)*** (.0000)*** (.0638)
Fair Nul Dummy 3.940 1.953 5.199
(.0412)** (.3146) (.1513)
Sigma Disturbance: 8.595 5.217 12.209
Standard Deviation (.0000)*** (.0000)*** (.0000)***
*p < 0.05 **p < 0.01 ***p < 0.00122
Table 14 displays tobit regressions with Type Y data using the questionnaire variables described
above.7 The tobit lower and upper limits were set at 0 and the Type Y fund (or remaining joint fund).
The first regression uses all of the data. The CPT game dummy variable has a negative and significant
effect on Type Y decisions. The strategy method protocol dummy variable has a significantly positive
effect on the amounts returned. An affirmative response to the trust and fairness question has a positive
Table 14. Tobit regressions for Type Y choice and questionnaire data
Regression (1) (2) (3)
Data Set All Data Private Common Property
Property Trust Trust Game Data
Game Data
N 838 403 435
Constant 1.241 0.703 14.637
(.4624) (.7435) (.0007)
Tokens Type X Sent 1.435 (1.3790) 1.644
(.0000)*** (.0000)*** (.0000)***
COW Study 1.704 1.258 1.145
(.0919) (.3028) (.5005)
Common Property -2.21 … …
(.0000)***
Strategy Method 1.885 0.986 2.571
(.0282)* (.3349) (.0598)
Male Gender -2.538 -2.954 -1.876
(.0000)*** (.0000)*** (.0284)*
Age -0.167 -0.068 -1.081
(.0096)** (.4289) (.0000)***
Trust Pos Dummy 1.898 2.360 1.402
(.0073)** (.0002)*** (.3914)
Trust Null Dummy -1.050 0.452 -4.192
(.1730) (.5345) (.0313)*
Helpful Pos Dummy 0.654 -0.046 5.259
(.2651) (.9289) (.0017)**
Helpful Null Dummy 3.075 -1.024 5.742
(.0009)*** (.5919) (.0001)***
Heteroscedasticity Term 0.029 0.037 0.016
(.0000)*** (.0000)*** (.0013)***
Sigma Disturbance Std. Dev. 2.758 1.872 4.520
(.0000)*** (.0000)*** (.0000)***
*p < 0.05 **p < 0.01 ***p < 0.001
7
The Fair Pos Dummy and Fair Null Dummy variables were dropped because the LimDep tobit regression limits the
number of explanatory variables to 13 and they had less explanatory power than the Trust and Helpful Variables.23
and significant effect on the amount sent or left. All three regressions show that men are significantly
less trustworthy than women. Regressions (2) and (3) look at only one game at a time to see if the
results are robust to each game. Age has an economically and statistically significant negative effect on
Type Y choices in the CPT game. This suggests that older students may respond more strongly to
deviations from the status quo. The ages of the four Type Y players who returned $20 if $0 was
withdrawn and returned $0 otherwise are 21, 21, 27, and 32 while the average age was 20.9 for Type Y
subjects in Treatment CH2. In the CPT game regression an affirmative response to the helpful question
has a strong effect on increasing Type Y generosity. Perhaps people who believe others “try to be
helpful” are extra generous to those who confirm their beliefs and decide not to destroy their common
property. From the trust question we find that the Trust Pos dummy variable has a stronger effect in the
PPT game, and the Trust Null dummy variable has a stronger effect in the CPT game.
8. Conclusion
We added a real effort task where subjects had to meet a performance quota to earn the right to play
in the PPT game or the CPT game. This was done to give the subjects a stronger sense of entitlement
to their private or common property endowments and increase the saliency of property rights. To
reveal the choice implications of Type Y preferences less frequently observed in the sequential move
protocol we employ the strategy method protocol in Treatments CH1 and CH2. The strategy method
protocol asks Type Y subjects to submit a planned response to each possible Type X choice. The
strategy method protocol treatments reveal that reciprocity is lower in the CPT game. This finding
supports Axiom S from revealed altruism theory [2] and is inconsistent with the isomorphism of the
PPT and CPT games implied by unconditional social preference and economic man theories.
Treatments CH3, CH4, and CH5 employ the sequential move protocol, as did the COW study.
Looking only at the means and tobit analysis, data from the PPT and CPT games seem to be consistent
with isomorphism of the games under our sequential move design: the means comparison tests do not
reject the null hypothesis that the means are the same, and the tobit analysis finds the CPT game
dummy variable to be insignificant. However isomorphism breaks down when we look at the
distributions of Type X decisions: Type X decisions move to the extremes of “full trust” and “no trust”
in the CPT game but not in the PPT game. There is some weak evidence that reciprocity is lower in the
CPT game, but we observe very few Type X decisions that fall between withdrawing 0 tokens and 10
tokens, which limits inferences that can be made on Type Y decisions. However, differences in Type Y
decisions are consistent with the findings in the strategy method protocol treatments.
We generate new evidence that suggests that the PPT and CPT games are not isomorphic under
stronger property entitlements. Outside the lab, private and common property rights are usually
acquired by real effort. We find evidence of Type Y preferences that support Axiom S, which provides
some insights into the differences in the need for trust and cooperation between private property
environments and common property environments. We also provide further evidence that having
subjects earn their endowments is an important experimental design consideration in testing theory.
One notable finding is that Type X players move towards the extremes when stronger entitlements
are added and particularly when the sequential move protocol is employed. If Type X players are
responding optimally to the possibility that Type Y players have preferences consistent with Axiom S,24
then revealed altruism theory may provide a useful foundation on which to build new theory to explain
first mover behavior in sequential games that involve social dilemmas.
Another interesting observation is that the possible “hot” versus “cold” effect appears but not in the
expected direction for trust games. A Type Y player responds to generous decisions made by a Type X
player, therefore the “hot” sequential move protocol should generate a more positive emotional
response and more generous return. Casari and Cason [26] find that the strategy method protocol has
no effect on Type X decisions and reduces generosity in Type Y decisions. Their results are in the
expected direction for Type Y decisions. However, we find that the strategy method protocol has a
positive and significant effect on Type Y returns when the questionnaire variables are added to the
tobit regression. In the strategy method protocol a Type X player knows that the Type Y player will
not know her decision before making the Type Y decision and hence that she cannot directly influence
a positive emotional response that could elicit a high return from the Type Y player. If a Type X player
believes this then he should send or leave fewer tokens under the strategy method protocol. Contrary to
this, we find that the strategy method protocol increases generosity in Type X decisions.
Two explanations are offered why Type X generosity increased in the strategy method treatment.
However, these explanations are speculative and not testable with the data from this experiment. The
first explanation is that betrayal by Type Y players may be less emotional and personal under the
strategy method protocol for Type X players, thus betrayal aversion is reduced. However, this
argument also implies that Type Y players would also feel less guilty about betraying Type X players
and as a result would return less under the strategy method protocol. This explanation is only plausible
for the Type X players.
The second explanation is that it is more difficult for the Type Y player to ignore or neglect all of
the opportunity sets the Type X player could have chosen under the strategy method protocol. If the
Type X player offers the most generous opportunity set to the Type Y player, it is transparent that she
could have offered one of ten less generous opportunity sets instead. If the Type Y player fails to
recognize this, he may return less because of a failure to fully appreciate the generosity of the Type X
player. We go to great efforts to make sure subjects fully understand the game, the choice set of the
Type X player, and how each Type X choice affects the choice set of the Type Y player. We delay
Type X or Type Y role assignment until after the instructions are read silently by the subjects,
explained verbally by the experimenter, and all remaining subject questions about the trust game are
answered. We do this because we want the subjects to pay attention to each role in the game. Under the
strategy method protocol, Type Y players must fill out a table so they cannot ignore the alternative
Type X choices. This is more likely to bring reciprocal preferences out of latency for Type Y players.
Type X players may be more confident that Type Y players will reciprocate and, as a result, be more
generous.
Acknowledgements
We thank Krawee “Kevin” Ackaramongkolrotn, Todd Swarthout, and Jason Delaney for advice on
experiment software development. Financial support was provided by the National Science
Foundation (grant number SES-0849590).You can also read