Bridge Center - OFFERING MEMORANDUM - LoopNet
←
→
Page content transcription
If your browser does not render page correctly, please read the page content below

Bridge Center

OFFERING MEMORANDUM
CONFIDENTIALITY AND DISCLAIMER

The information contained in the following Marketing Brochure is proprietary and strictly confidential. It is intended to be reviewed only by the party receiving it from
Marcus & Millichap and should not be made available to any other person or entity without the written consent of Marcus & Millichap. This Marketing Brochure has
been prepared to provide summary, unverified information to prospective purchasers, and to establish only a preliminary level of interest in the subject property.
The information contained herein is not a substitute for a thorough due diligence investigation. Marcus & Millichap has not made any investigation, and makes no
warranty or representation, with respect to the income or expenses for the subject property, the future projected financial performance of the property, the size
and square footage of the property and improvements, the presence or absence of contaminating substances, PCB’s or asbestos, the compliance with State and
Federal regulations, the physical condition of the improvements thereon, or the financial condition or business prospects of any tenant, or any tenant’s plans or
intentions to continue its occupancy of the subject property. The information contained in this Marketing Brochure has been obtained from sources we believe to
be reliable; however, Marcus & Millichap has not verified, and will not verify, any of the information contained herein, nor has Marcus & Millichap conducted any
investigation regarding these matters and makes no warranty or representation whatsoever regarding the accuracy or completeness of the information provided.
All potential buyers must take appropriate measures to verify all of the information set forth herein.

                                                          NON-ENDORSEMENT NOTICE
Marcus & Millichap Real Estate Investment Services, Inc. (“M&M”) is not affiliated with, sponsored by, or endorsed by any commercial tenant or lessee identified in
this marketing package. The presence of any corporation’s logo or name is not intended to indicate or imply affiliation with, or sponsorship or endorsement by, said
corporation of M&M, its affiliates or subsidiaries, or any agent, product, service, or commercial listing of M&M, and is solely included for the purpose of providing
tenant lessee information about this listing to prospective customers.

Marcus & Millichap is not affiliated with, sponsored by, or endorsed by any commercial tenant or lessee identified in this marketing package. The presence of
any corporation’s logo or name is not intended to indicate or imply affiliation with, or sponsorship or endorsement by, said corporation of Marcus & Millichap, its
affiliates or subsidiaries, or any agent, product, service, or commercial listing of Marcus & Millichap, and is solely included for the purpose of providing tenant lessee
information about this listing to prospective customers.

                  ALL PROPERTY SHOWINGS ARE BY APPOINTMENT ONLY. PLEASE CONSULT YOUR
                              MARCUS & MILLICHAP AGENT FOR MORE DETAILS.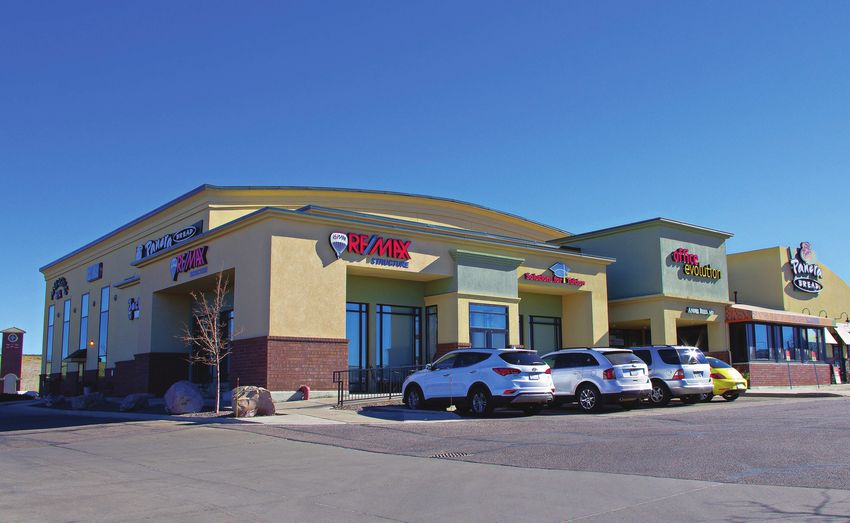
exclusively listed
Bridge Center

Table of Contents

PROPERTY DESCRIPTION                                                                                                       COMPARABLES
  Investment Overview & Highlights .  .  .  .  .  .  .  .  .  .  .  .  .  .  .  . 2                                         Rent Comparables Map & Summary .  .  .  .  .  .  .  .  .  .  .  .  .  . 21
  Regional Map  .  .  .  .  .  .  .  .  .  .  .  .  .  .  .  .  .  .  .  .  .  .  .  .  .  .  .  .  .  .  .  . 3            Rent Comparables .  .  .  .  .  .  .  .  .  .  .  .  .  .  .  .  .  .  .  .  .  .  .  .  . 22-23
  Local Map  .  .  .  .  .  .  .  .  .  .  .  .  .  .  .  .  .  .  .  .  .  .  .  .  .  .  .  .  .  .  .  .  .  .  . 4      Recent Sale Comparables Map & Summary .  .  .  .  .  .  .  .  . 24
  Aerial Maps  .  .  .  .  .  .  .  .  .  .  .  .  .  .  .  .  .  .  .  .  .  .  .  .  .  .  .  .  .  .  .  . 5-7           Recent Sale Comparables .  .  .  .  .  .  .  .  .  .  .  .  .  .  .  .  .  .  .  . 25-27
                                                                                                                            Traffic Count Map .  .  .  .  .  .  .  .  .  .  .  .  .  .  .  .  .  .  .  .  .  .  .  .  .  .  .  . 28
MARKET OVERVIEW
  Demographic Report  .  .  .  .  .  .  .  .  .  .  .  .  .  .  .  .  .  .  .  .  .  .  .  .  .  .  . 9
  Lone Tree Entertainment District .  .  .  .  .  .  .  .  .  .  .  .  .  . 10-11
  Lone Tree Business Improvement District  .  .  .  .  .  .  .  .  .  . 12
  City of Lone Tree .  .  .  .  .  .  .  .  .  .  .  .  .  .  .  .  .  .  .  .  .  .  .  .  .  .  .  .  . 13
  The Yard .  .  .  .  .  .  .  .  .  .  .  .  .  .  .  .  .  .  .  .  .  .  .  .  .  .  .  .  .  .  .  .  .  .  .  . 14
  Panera Bread Drive-Thru .  .  .  .  .  .  .  .  .  .  .  .  .  .  .  .  .  .  .  .  .  .  . 15

FINANCIAL ANALYSIS
  Financial Overview .  .  .  .  .  .  .  .  .  .  .  .  .  .  .  .  .  .  .  .  .  .  .  .  .  .  .  . 17
  Tenant & Lease Summary  .  .  .  .  .  .  .  .  .  .  .  .  .  .  .  .  .  .  . 18-19
description
         PROPERTY DESCRIPTION
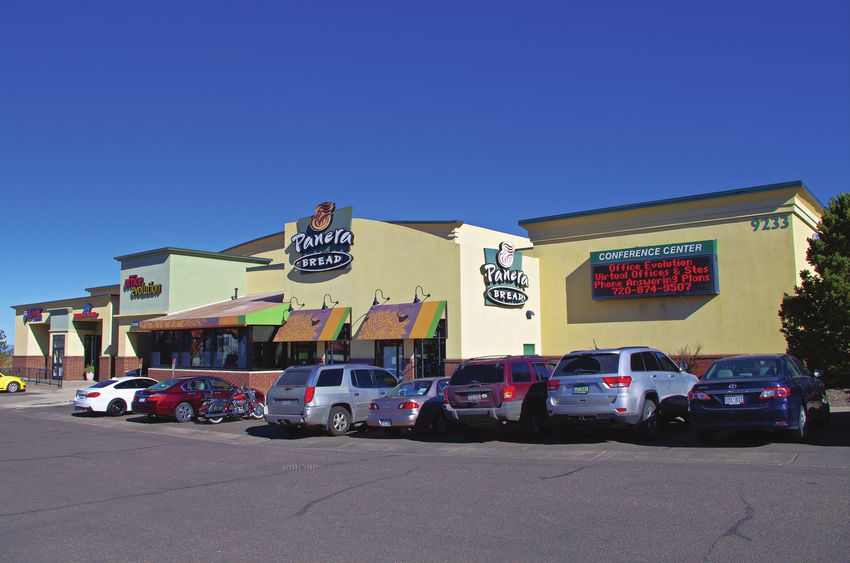
PROPERTY DESCRIPTION                                                                                                                                                                                 Bridge Center

INVESTMENT OVERVIEW

                                                                                                                                                                                                                                                                                                DESCRIPTION
                                                                                                                                                                                                                                                                                                 PROPERTY
Marcus & Millichap is pleased to exclusively present to qualified
investors the Bridge Center, located in the Park Meadows
Entertainment District of Lone Tree, Colorado. This 100 percent
occupied office/retail investment opportunity is anchored by Panera
Bread, a national brand restaurant retailer.

Bridge Center is a highly visible asset just south of the General Growth
Park Meadows Mall, a 1.6 million square foot shopping mall including

                                                                                                                                                                                                                                                                                                OVERVIEW
                                                                                                                                                                                                                                                                                                 MARKET
anchor tenants such as Dillard’s, JCPenney, Macy’s and Nordstrom.
The average household income is above $140,000 within a three mile
radius, and the population is estimated to increase over 9 percent
over the next five years. It sits just off South Yosemite Street and Park
Meadows Boulevard just two blocks from the C-470 interchange.
Bridge Center is virtually in the heart of shopping, entertainment and
the major employment district of Lone Tree.                                                                                         INVESTMENT HIGHLIGHTS

                                                                                                                                                                                                                                                                                                FINANCIAL
                                                                                                                                                                                                                                                                                                ANALYSIS
                                                                                                                                      ■■      Satellite Retail/Office Space to Park Meadows Mall
The anchor, Panera Bread, has recently extended their lease for an                                                                    ■■      100% Occupied
additional ten years. They have a total of 2,000 locations in the United                                                              ■■      Anchored by Panera Bread
States and Canada and are publicly traded on NASDAQ (PNRA).
                                                                                                                                      ■■      Panera Bread’s Lease Extended to 06/2027 With Options, 6%
Panera Bread is in the process of obtaining permits from the City of
Lone Tree to install a drive thru at an estimated cost of $480,000.                                                                           Escalator in Year Six and Options
                                                                                                                                      ■■      Outstanding Demographics with Average Household Income

                                                                                                                                                                                                                                                                                                  COMPARABLES
This investment opportunity is being offered free of debt thus                                                                                Exceeding $140,000
allowing a new purchaser the opportunity to place new financing on                                                                    ■■      Some Medical Tenants On Site
the property at today’s historically low interest rates.                                                                              ■■      Highly Visible with High Traffic Counts
                                                                                                                                      ■■      The Yard is a New Office/Retail Development Located
                                                                                                                                              Directly Across The Street with Asking Rents of $22-$30/SF,
                                                                                                                                              NNN

                              This information has been secured from sources we believe to be reliable, but we make no representations or warranties, expressed or implied, as to the accuracy of the information. References to square footage or age are approximate. Buyer must verify the

                                                                                                                                                                                                                                                                                                  2
                       information and bears all risk for any inaccuracies. Any projections, opinions, assumptions or estimates used herein are for example purposes only and do not represent the current or future performance of the property. Marcus & Millichap Real Estate Investment
                                                                                                                                                    Services is a service mark of Marcus & Millichap Real Estate Investment Services, Inc. © 2016 Marcus & Millichap ACT ID Y0050314
PROPERTY DESCRIPTION                                                                                                                                                                     Bridge Center
REGIONAL MAP

                                                                                                                                                                                                                                                                                    DESCRIPTION
                                                                                                                                                                                                                                                                                     PROPERTY
                                                                                                                                                                                                                                                                                    OVERVIEW
                                                                                                                                                                                                                                                                                     MARKET
                                                                                                                                                                                                                                                                                    FINANCIAL
                                                                                                                                                                                                                                                                                    ANALYSIS
                                                                                                                                                       Subject Property

                                                                                                                                                                                                                                                                                      COMPARABLES
                  This information has been secured from sources we believe to be reliable, but we make no representations or warranties, expressed or implied, as to the accuracy of the information. References to square footage or age are approximate. Buyer must verify the

                                                                                                                                                                                                                                                                                      3
           information and bears all risk for any inaccuracies. Any projections, opinions, assumptions or estimates used herein are for example purposes only and do not represent the current or future performance of the property. Marcus & Millichap Real Estate Investment
                                                                                                                                        Services is a service mark of Marcus & Millichap Real Estate Investment Services, Inc. © 2016 Marcus & Millichap ACT ID Y0050314
PROPERTY DESCRIPTION                                                                                                                                                                      Bridge Center
LOCAL MAP

                                                                                                                                                                                                                                                                                     DESCRIPTION
                                                                                                                                                                                                                                                                                      PROPERTY
                                                                                                                                                                                                                                                                                     OVERVIEW
                                                                                                                                                                                                                                                                                      MARKET
                                                                                                               Subject Property

                                                                                                                                                                                                                                                                                     FINANCIAL
                                                                                                                                                                                                                                                                                     ANALYSIS
                                                                                                                                                                                                                                                                                       COMPARABLES
                   This information has been secured from sources we believe to be reliable, but we make no representations or warranties, expressed or implied, as to the accuracy of the information. References to square footage or age are approximate. Buyer must verify the

                                                                                                                                                                                                                                                                                       4
            information and bears all risk for any inaccuracies. Any projections, opinions, assumptions or estimates used herein are for example purposes only and do not represent the current or future performance of the property. Marcus & Millichap Real Estate Investment
                                                                                                                                         Services is a service mark of Marcus & Millichap Real Estate Investment Services, Inc. © 2016 Marcus & Millichap ACT ID Y0050314
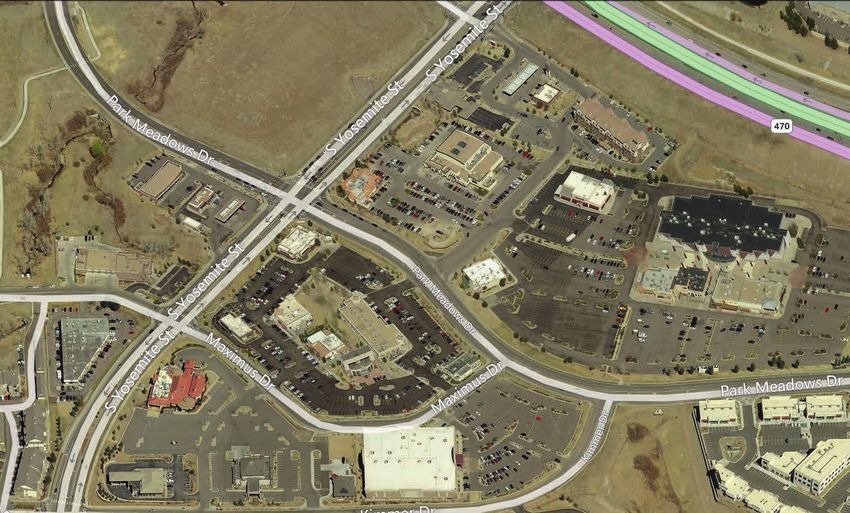
PROPERTY DESCRIPTION                                                                                                                                                                   Bridge Center
AERIAL

                                                                                                                                                                                                                                                                                  DESCRIPTION
                                                                                                                                                                                                                                                                                   PROPERTY
                                                               Bridge Center

                                                                                                                                                                                                                                                                                  OVERVIEW
                                                                                                                                                                                                                                                                                   MARKET
                                                                                                                                                                                                                                                                                  FINANCIAL
                                                                                                                                                                                                                                                                                  ANALYSIS
                                                                                                                                                                                                                                                                                    COMPARABLES
                This information has been secured from sources we believe to be reliable, but we make no representations or warranties, expressed or implied, as to the accuracy of the information. References to square footage or age are approximate. Buyer must verify the

                                                                                                                                                                                                                                                                                    5
         information and bears all risk for any inaccuracies. Any projections, opinions, assumptions or estimates used herein are for example purposes only and do not represent the current or future performance of the property. Marcus & Millichap Real Estate Investment
                                                                                                                                      Services is a service mark of Marcus & Millichap Real Estate Investment Services, Inc. © 2016 Marcus & Millichap ACT ID Y0050314
PROPERTY DESCRIPTION                                                                                                                                                                      Bridge Center
AERIAL

                                                                                                                                                                                                                                                                                     DESCRIPTION
                                                                                                                                                                                                                                                                                      PROPERTY
                   Quebec Village                                                                                                                                         Centennial Promenade

                                                                                                                                                                                                                                                                                     OVERVIEW
                                                                                                                                                                                                                                                                                      MARKET
         Meadows Marketplace
                                                                                                                                                                                  Park Meadows Mall

                                                                                                                                                                                                                                                                                     FINANCIAL
                                                                                                                                                                                                                                                                                     ANALYSIS
             The Yard

                    Subject Property

                                                                                                                                                                                                                                                                                       COMPARABLES
         Entertainment District

                   This information has been secured from sources we believe to be reliable, but we make no representations or warranties, expressed or implied, as to the accuracy of the information. References to square footage or age are approximate. Buyer must verify the

                                                                                                                                                                                                                                                                                       6
            information and bears all risk for any inaccuracies. Any projections, opinions, assumptions or estimates used herein are for example purposes only and do not represent the current or future performance of the property. Marcus & Millichap Real Estate Investment
                                                                                                                                         Services is a service mark of Marcus & Millichap Real Estate Investment Services, Inc. © 2016 Marcus & Millichap ACT ID Y0050314
PROPERTY DESCRIPTION Bridge Center
AERIAL
DESCRIPTION
PROPERTY
Located less than 1 mile from Bridge Center, Park Meadows Mall is Colorado’s biggest and best shopping mall and known as “Colorado’s only retail resort”.
It boasts 185 stores and restaurants, and is anchored by Dillard’s, Nordstrom, Dick’s Sporting Goods and Macy’s. Park Meadows is also home to the Colorado
flagship stores of several national tenants, including Arhaus Furniture, Nordstrom and Pottery Barn. In additon to the 12 quick-serve restaraunts in the dining
hall, there are 14 full-service restaurants on premise. Park Meadows Mall is a recipient of ICSC’s International Design and Development Award and the Urban
Land Institute’s Award of Excellence, and is currently owend by General Growth Properties .
Park Meadows Mall
OVERVIEW
MARKET
FINANCIAL
ANALYSIS
The Yard
Subject Property
COMPARABLES
This information has been secured from sources we believe to be reliable, but we make no representations or warranties, expressed or implied, as to the accuracy of the information. References to square footage or age are approximate. Buyer must verify the
7
information and bears all risk for any inaccuracies. Any projections, opinions, assumptions or estimates used herein are for example purposes only and do not represent the current or future performance of the property. Marcus & Millichap Real Estate Investment
Services is a service mark of Marcus & Millichap Real Estate Investment Services, Inc. © 2016 Marcus & Millichap ACT ID Y0050314overview
MARKET OVERVIEWMarket Overview Bridge Center
DEMOGRAPHIC REPORT - 5 MILE RADIUS
Population
DESCRIPTION
HOUSING 1 Mile 3 Miles 5 Miles INCOME 1 Mile 3 Miles 5 Miles
PROPERTY
In 2014, the population in your selected geography is 193,682. The population
2000 Population 8,843 48,491 137,770 has changed by 40.58% since 2000. It is estimated that the population in your $ 0 - $14,999 6.30% 4.20% 3.90%
2010 Population 8,251 63,035 184,376 area will be 211,446 five years from now, which represents a change of 9.17% $ 15,000 - $24,999 3.30% 3.60% 3.70%
from the current year. The current population is 49.15% male and 50.84%
2014 Population 8,632 66,049 193,682 $ 25,000 - $34,999 4.20% 4.60% 4.70%
female. The median age of the population in your area is 37.8, compare this
2019 Population 9,765 70,545 211,447 to the entire US average which is 37.3. The population density in your area is $ 35,000 - $49,999 10.90% 9.70% 9.50%
2000 Households 3,089 17,796 50,347
2,462.62 people per square mile. $ 50,000 - $74,999 16.90% 15.50% 15.70%
$ 75,000 - $99,999 12.50% 15.10% 14.80%
2010 Households 3,625 25,551 71,149 Households
$100,000 - $124,999 13.60% 14.00% 14.20%
2014 Households 3,787 26,805 74,730 There are currently 74,730 households in your selected geography. The number
of households has changed by 48.43% since 2000. It is estimated that the $125,000 - $149,999 7.50% 10.00% 10.20%
2019 Households 4,465 29,485 83,011
number of households in your area will be 83,010 five years from now, which $150,000 - $199,999 8.80% 11.10% 11.10%
OVERVIEW
2014 Average
MARKET
Household Size
2.38 2.47 2.57 represents a change of 11.08% from the current year. The average household $200,000 - $249,999 7.00% 5.30% 5.30%
size in your area is 2.57 persons.
2014 Daytime $250,000 + 9.00% 7.00% 7.00%
13,420 85,908 167,539
Population
Income 2014 Median Household
$91,355 $95,425 $96,018
2000 Owner Occu- In 2014, the median household income for your selected geography is $96,018, Income
86.57% 80.30% 83.20%
pied Housing Units compare this to the Entire US average which is currently $51,972. The median 2014 Per Capita Income $58,360 $51,582 $49,298
2000 Renter Occu- household income for your area has changed by 15.63% since 2000. It is esti-
10.84% 15.79% 13.55% 2014 Average Household
pied Housing Units mated that the median household income in your area will be $111,638 five Income
$133,033 $127,057 $127,376
years from now, which represents a change of 16.26% from the current year.
FINANCIAL
The current year per capita income in your area is $49,297, compare this to
ANALYSIS
2nd MOST HIGHLY
the Entire US average, which is $28,599. The current year average household
income in your area is $127,376, compare this to the Entire US average which
6th Highest
EDUCATED is $74,533. Income County
STATE IN THE NATION Housing IN THE U.S.
In 2000, there were 43,294 owner occupied housing units in your area and – CNN MONEY
– CENSUS BUREAU there were 7,052 renter occupied housing units in your area. The median rent
at the time was $1,025.
Employment
#1 Best Places
COMPARABLES
2 BESTnd In 2014, there are 167,538 employees in your selected area, this is also known
as the daytime population. The 2000 Census revealed that 85.78% of employees
STATE TO LIVE are employed in white-collar occupations in this geography, and 15.52% are for Business and
– FORBES
employed in blue-collar occupations. In 2014, unemployment in this area is
5.45%. In 2000, the average time traveled to work was 25.5 minutes.
Careers
– FORBES
This information has been secured from sources we believe to be reliable, but we make no representations or warranties, expressed or implied, as to the accuracy of the information. References to square footage or age are approximate. Buyer must verify the
9
information and bears all risk for any inaccuracies. Any projections, opinions, assumptions or estimates used herein are for example purposes only and do not represent the current or future performance of the property. Marcus & Millichap Real Estate Investment
Services is a service mark of Marcus & Millichap Real Estate Investment Services, Inc. © 2016 Marcus & Millichap ACT ID Y0050314(TAP). Th
Tree Entertainment District show a commitment to developm
a new vision for the area. The Entertainment market an
MARKET OVERVIEW Bridge Center
District is home to a variety of attractions, including
a movie theater, bowling center, indoor skydiving,
miniature golf, hotels, an athletic club, health spas,
and interv
represent
officials. T
several restaurants and financial institutions. The City Coun
District is located east of Yosemite Street along the Entert
both the north and south sides of Park Meadows was never
LONE TREE ENTERTAINMENT DISTRICT Drive. never wel
DESCRIPTION
PROPERTY
continued
Recent public and private investments in the Lone Tree Entertainment District show a
only after
commitment to a new vision for the area. The Entertainment District is home to a variety
of attractions, including a movie theater, bowling center, indoor skydiving, miniature golf, Following
hotels, an athletic club, health spas, several restaurants and financial institutions. The District pursuit of
of a consu
is located east of Yosemite Street along both the north and south sides of Park Meadows Design, R
Drive. consultan
with focus
stakehold
The City of Lone Tree has long recognized the value of the Entertainment District and has makes it u
OVERVIEW
always seen the potential for creating a more cohesive district and gathering place. Originally District co
MARKET
developed in the 1990s, the area has many successful businesses, but has been challenged the comm
creation in
with fractured ownership; multiple property management companies; no sense of place or define the
focal point; uncertain entries and vague boundaries; no champion for implementing a vision several po
for the District; and a lack of safe pedestrian connections. in the are
Public Commitment and Investment In 2015, e
Over the years, there were several attempts by the City and property owners to organize The City of Lone Tree has long recognized the value Currently
a collaborative approach to solving common problems. However, because there was no of the Entertainment District and has always seen in late De
FINANCIAL
ANALYSIS
the potential for creating a more cohesive district intersectio
common vision, those efforts were never sustained. Still committed to the District, in 2012
and gathering place. Originally developed in the Drive at K
the City Council engaged the services of the Colorado Chapter of the Urban Land Institute’s 1990s, the area has many successful businesses, and pedes
Technical Advisory Panel (TAP). The panel included experts in real estate development, but has been challenged with fractured ownership; and safer
multiple property management companies; no pedestrian
urban design, traffic engineering and market analysis. They reviewed technical reports and
sense of place or focal point; uncertain entries and south side
interviewed property owners, business representatives, Lone Tree residents and elected vague boundaries; no champion for implementing a
officials. The panel then presented its findings to City Council, concluding that the original vision for the District; and a lack of safe pedestrian Between t
intent of the Entertainment District as a destination venue was never realized in part because connections. to the we
Drive will
the vision was never well articulated. The panel encouraged continued public investment
COMPARABLES
Over the years, there were several attempts by the eliminate
and leadership, but only after a more specific vision was created. City and property owners to organize a out of the
collaborative approach to solving common north and
problems. However, because there was no common begin on a
vision, those efforts were never sustained. Still dedicated
committed to the District, in 2012 the City Council Park Mead
engaged the services of the Colorado Chapter of the congestio
Urban Land Institute’s Technical Advisory Panel businesse
This information has been secured from sources we believe to be reliable, but we make no representations or warranties, expressed or implied, as to the accuracy of the information. References to square footage or age are approximate. Buyer must verify the
10
information and bears all risk for any inaccuracies. Any projections, opinions, assumptions or estimates used herein are for example purposes only and do not represent the current or future performance of the property. Marcus & Millichap Real Estate Investment
Services is a service mark of Marcus & Millichap Real Estate Investment Services, Inc. © 2016 Marcus & Millichap ACT ID Y0050314MARKET OVERVIEW Bridge Center
LONE TREE ENTERTAINMENT DISTRICT - CONTINUED
DESCRIPTION
PROPERTY
Following the recommendations of the ULI panel, in pursuit of that vision, the City
engaged the services of a consultant team including 505 Design, Norris Design, Ricker/
Cunningham and Matrix Design. The consultants conducted community meetings, met
with focus groups, and engaged a wide variety of stakeholders in a dialogue about Lone Tree,
what makes it unique, and how the Entertainment District could be improved to meet the
Lone Tree Entertainment District
desires of the community. This public process, and the creation in 2013 of the Vision Book,
• Lone Tree Business Improvement
helped further define the potential for the district and identified several potential public and
private improvements in the area.
District (BID)
OVERVIEW
MARKET
In 2015, exciting changes began taking shape. Currently under construction, and expected
to open in late December–(weather Fallpermitting),
2015 is a new intersection and traffic signal at
• Kimmer/Park Meadows
Park Meadows Drive at Kimmer Drive. This four-way traffic signal and pedestrian crossing
will create a more efficient and safer connection for automobiles and pedestrians accessing
businesses on the north Intersection
and south sides of Park Meadows Drive.
– Spring
Between this new intersection and Yosemite2016
Street to the west, raised medians along Park
Meadows Drive will be installed to improve traffic flow and eliminate dangerous left turn
• outYosemite/Park Meadows
FINANCIAL
ANALYSIS
movements coming of the Entertainment District from both the north and the south.
Intersection
In 2016, construction will begin on an additional lane on northbound Yosemite dedicated
to vehicles turning right, or east, onto Park Meadows Drive. This improvement will relieve
congestion in the area and– Summer
improve 2016
access to businesses.
The City and the •SouthEntertainment District
Suburban Parks and Recreation District Park
are partnering to develop
– Summer 2017
a small park on land that is now a detention pond at the southeast corner of Park Meadows
Drive and Kimmer Drive. The proposed park is currently in the design stage with a
COMPARABLES
master plan expected to be approved in 2016. Thanks to support from Douglas County,
Entertainment District visitors will also enjoy a new trail connection providing direct access
between the Entertainment District and the Lincoln Light Rail Station.
This information has been secured from sources we believe to be reliable, but we make no representations or warranties, expressed or implied, as to the accuracy of the information. References to square footage or age are approximate. Buyer must verify the
11
information and bears all risk for any inaccuracies. Any projections, opinions, assumptions or estimates used herein are for example purposes only and do not represent the current or future performance of the property. Marcus & Millichap Real Estate Investment
Services is a service mark of Marcus & Millichap Real Estate Investment Services, Inc. © 2016 Marcus & Millichap ACT ID Y0050314southeast corner of Park Meadows Drive and app
Kimmer Drive. The proposed park is currently in the prop
design stage with a master plan expected to be upg
MARKET OVERVIEW approved in 2016. Thanks to support from Douglas Bridge Center crea
County, Entertainment District visitors will also side
enjoy a new trail connection providing direct access sing
between the Entertainment District and the Lincoln on p
LONE TREE BUSINESS IMPROVEMENT DISTRICT Light Rail Station. an o
DESCRIPTION
PROPERTY
In 2015, property owners in the Entertainment District came together for the first time as a
unified group to establish a new Business Improvement District (BID). A BID is a public- Priv
private partnership designed to enhance economic development within its boundaries. The Man
– fu
BID boundary includes most of the businesses located on the north side of Park Meadows
and
Drive. As a statutorily authorized entity, a BID has the authority to maintain and construct
Arti
improvements and promote and market its facilities. To raise revenue, a BID can levy ad
am
valorem property taxes, charge fees or tolls, and create special assessments. the
In the summer of 2015, the Lone Tree BID was initiated by a petition from property owners Bru
OVERVIEW
MARKET
that owned more than 50 percent of the land and assessed value of the District. As a result own
of the petition, the City Council incorporated the BID by ordinance on September 1, 2015. exte
Subsequently, the BID Board of Directors referred tax questions to its voters to provide inte
revenue for its operations. In the November election, property owners voted to unanimously rece
approve the BID’s taxing authority. On December 2, 2015, the BID Board of Directors Mus
Sta
approved a 15 millon dollar property tax on their own properties to support property
a re
maintenance and upgrades within the designated BID area. The creation of a BID sets the
Sky
groundwork for the north side of the Entertainment District, to operate as a single, unified
FINANCIAL
Ente
ANALYSIS
destination and enables collaboration on projects throughout the Entertainment DistrictCreating
in a Business Improvement District incl
an organized setting. In 2015, property owners in the Entertainment Thin
Many businesses have made recent improvements – further evidence of their commitment District came together for the first time as a unified
to the area and the vision for the Entertainment District. United Artists Theater renewedgroup
its to establish a new Business Improvement
District (BID). A BID is a public-private partnership
lease and has completed a multi-million dollar interior renovation, including the installation
of premium stadium seating. The Brunswick Zone bowling center is under new ownership designed to enhance economic development within
its boundaries. The BID boundary includes most of
by Bowlero Bowl and has completed exterior improvements, and is underway with interior
the businesses located on the north side of Park
COMPARABLES
improvements. Other businesses with recent enhancements include Mimi’s Cafe, Mellow
Meadows Drive. As a statutorily authorized entity, a
Mushroom, Fox and Hound Sports Tavern and Starbucks.
BID has the authority to maintain and construct
improvements and promote and market its
facilities. To raise revenue, a BID can levy ad
valorem property taxes, charge fees or tolls, and
create special assessments.
This information has been secured from sources we believe to be reliable, but we make no representations or warranties, expressed or implied, as to the accuracy of the information. References to square footage or age are approximate. Buyer must verify the
12
information and bears all risk for any inaccuracies. Any projections, opinions, assumptions or estimates used herein are for example purposes only and do not represent the current or future performance of the property. Marcus & Millichap Real Estate Investment
Services is a service mark of Marcus & Millichap Real Estate Investment Services, Inc. © 2016 Marcus & Millichap ACT ID Y0050314
In the summer of 2015, the Lone Tree BID wasMARKET OVERVIEW Bridge Center
CITY OF LONE TREE
DESCRIPTION
PROPERTY
The City of Lone Tree was incorporated in 1995 and is ten square miles in size and
currently boasts a Median Household Income of $149,232. It is a premier Colorado
community connected by great neighborhoods, vibrant public spaces, a beautiful
natural environment, and thriving businesses.
The City of Lone Tree is part of the Denver South Economic Development Partnership,
and at the strategic crossroads of C-470 and I-25. 2016 will be a record year for
transportation and community investment projects within the City of Lone Tree.
RidgeGate East
Over $500 million expected in current and upcoming projects. Part of this investment
OVERVIEW
will result in an increased I-25 capacity from six lanes to eight lanes and expanded
• Light-Rail Construction Begins
MARKET
Lincoln Avenue north-bound on-ramp to two lanes. Other improvements as a result
RidgeGate East Project
of this investment are a new Lincoln Pedestrian Bridge, Lone Tree Library and RTD
Southeast Light Rail Extension to name a few.
The median Lone
• Single TreeSalesCity
Family Home Price isCenter
$675,000 and will be the
the Average Single
primary TOD location and include
Family Home Sales Price is $764,315. The unemployment rate is 2.6% with city
population doubling during business hours from a resident population of 13,175 to a
upof 25,216.
daytime population to 11Theremillion
is 3.6 millionSFsquareoffice space
feet of Retail space and 3.1
FINANCIAL
ANALYSIS
million square feet of Office space. The 2015 vacancy rates were 3.6 percent and 9.2
• RidgeGate
percent respectively. In 2015 there was $1.6East BillionVillage
in total Retail will
Sales.
include
There are over 39,000,00 squareup feet ofto 2.3
office space,million SF retail
attracting employers including
Charles Schwab, Level 3 Communications and Sky Ridge Medical Center. Charles
Schwab has 3,200and
employeesup as ofto 7,000
January new
1, 2016 and they arehomes
the largest private sector
employer in Douglas County. Level 3 Communications, a Fortune 500 employer,
has 1,200 employees in the Lone Tree community. Sky Ridge Medical Center has
COMPARABLES
3,000 employees including both staff and contract positions. As more residential and
commercial development continues to flourish in the area we see a continued demand
for employment expansion and growth in Retail sales driving new retailers to the area
and maintaining a steady increase in rental rates for existing and future Retail space.
This information has been secured from sources we believe to be reliable, but we make no representations or warranties, expressed or implied, as to the accuracy of the information. References to square footage or age are approximate. Buyer must verify the
13
information and bears all risk for any inaccuracies. Any projections, opinions, assumptions or estimates used herein are for example purposes only and do not represent the current or future performance of the property. Marcus & Millichap Real Estate Investment
Services is a service mark of Marcus & Millichap Real Estate Investment Services, Inc. © 2016 Marcus & Millichap ACT ID Y0050314MARKET OVERVIEW Bridge Center
THE YARD
DESCRIPTION
PROPERTY
In the heart of one of Denver’s most successful retail trade areas, The Yard will take advantage of a phenomenal convergence of high income demographics,
strong traffic counts, and 4.5 million square feet of retail within one mile, currently 99 percent occupied. Its outdoor-centric, pedestrian-friendly format is
unique in an otherwise well served market. The Yard will be situated on 14 acres of land with more 84,400 square feet of leasable space that will create 400
permanent jobs. Construction is expected to be complete in November 2017.
“Clustered around an open-air
OVERVIEW
MARKET
expanse alive with the buzz of
The Yard meeting and eating, The Yard’s
first-to-market restaurants will
invite diners to a new culinary
experience where out is in and
FINANCIAL
ANALYSIS
the contagious energy of shared
Subject Property
good times resonates among
lingering crowds and patio tables
with a view.”
COMPARABLES
This information has been secured from sources we believe to be reliable, but we make no representations or warranties, expressed or implied, as to the accuracy of the information. References to square footage or age are approximate. Buyer must verify the
14
information and bears all risk for any inaccuracies. Any projections, opinions, assumptions or estimates used herein are for example purposes only and do not represent the current or future performance of the property. Marcus & Millichap Real Estate Investment
Services is a service mark of Marcus & Millichap Real Estate Investment Services, Inc. © 2016 Marcus & Millichap ACT ID Y0050314PROPERTY DESCRIPTION Bridge Center
FUTURE PANERA BREAD DRIVE-THRU
DESCRIPTION
PROPERTY
OVERVIEW
MARKET
FINANCIAL
ANALYSIS
COMPARABLES
This information has been secured from sources we believe to be reliable, but we make no representations or warranties, expressed or implied, as to the accuracy of the information. References to square footage or age are approximate. Buyer must verify the
15
information and bears all risk for any inaccuracies. Any projections, opinions, assumptions or estimates used herein are for example purposes only and do not represent the current or future performance of the property. Marcus & Millichap Real Estate Investment
Services is a service mark of Marcus & Millichap Real Estate Investment Services, Inc. © 2016 Marcus & Millichap ACT ID Y0050314analysis
FINANCIAL ANALYSISFINANCIAL ANALYSIS Bridge Center
FINANCIAL OVERVIEW Annualized Operating Data
Income Year 1
DESCRIPTION
PROPERTY
Bridge Center Scheduled Base Rental Revenue $774,516
9233 Park Meadows Drive Expense Reimbursements $136,934
Lone Tree, CO 80124 Effective Gross Income $911,450
Vacancy (2.5%) ($18,531)
Price $8,400,000 Gross Effective Income $892,919
Down Payment 25% / $2,100,000 Total Operating Expenses $338,301
Gross Leasable Area (GLA) 28,889 Net Operating Income $554,618
Net Leasable Area (NLA) 25,486 Debt Service ($409,554)
Price / SF of Net Leaseable Area $329.59 Debt Coverage Ratio 1.35
OVERVIEW
MARKET
CAP Rate - Year 1 6.60% Net Cash Flow After Debt Service $145,064
Lot Size 3.50 AC
Cash-on-Cash Return 6.90%
Year Built 1999
Expenses Year 1
Real Estate Taxes* $160,577
Financing Insurance $8,000
Repairs & Maintenance $10,207
FIRST TRUST DEED Trash $3,594
Loan Amount $6,300,000 Water & Sewer $10,771
FINANCIAL
ANALYSIS
Loan Type Proposed New Gas & Electric $83,258
Interest Rate 4.25% Janitorial $18,951
Amortization 25 Years HVAC Maintenance $6,291
Loan to Value 75% Professional Fees $6,275
Fire, Security & Misc. $3,720
Management Fee (3% of EGI) $26,657
Loan information is time sensitive and subject to change. Contact your TOTAL EXPENSES $338,301
local Marcus & Millichap Capital Corporation representative. EXPENSES/SF $13.27
COMPARABLES
*Lone Tree Business Improvement District includes real estate
taxes, snow removal, lot sweeping, landscaping and sprinkler
repair and maintenance.
This information has been secured from sources we believe to be reliable, but we make no representations or warranties, expressed or implied, as to the accuracy of the information. References to square footage or age are approximate. Buyer must verify the
17
information and bears all risk for any inaccuracies. Any projections, opinions, assumptions or estimates used herein are for example purposes only and do not represent the current or future performance of the property. Marcus & Millichap Real Estate Investment
Services is a service mark of Marcus & Millichap Real Estate Investment Services, Inc. © 2016 Marcus & Millichap ACT ID Y0050314FINANCIAL ANALYSIS Bridge Center
TENANT AND LEASE SUMMARY
Start End Monthly Monthly Escalation Escalated Lease
Tenant SF $/SF Options
Date Date Rent CAM Date(s) Rent(s) Type
Allstate Insurance 250 12/01/2013 11/30/2018 $48.60 $1,012 N/A 12/01/2017 $1,052.87 Gross One, 5 Year Option
Dr. Allison Fall 500 03/01/2016 04/30/2019 $33.60 $1,400 N/A N/A N/A Gross One, 3 Year Option
03/01/2018 $5,152.11
Eco Salon 1,820 03/01/2016 02/28/2021 $19.71 $5,000 $2,086.93 03/01/2019 $5,227.95 NNN One, 7 Year Option
03/01/2020 $5,303.78
10/01/2018 $4,357.85 2016
Eco Salon-Expansion 1,396 01/01/2017 02/28/2021 $36.96 $4,300 N/A 10/01/2019 $4,416.00 Base One, 5 Year Option
10/01/2020 $4,474.18 Year
06/01/2018 $23,423
06/01/2019 $23,809
06/01/2020 $24,195
2015
06/01/2021 $24,581
Office Evolution 9,266 06/01/2016 05/31/2026 $29.08 $23,037 N/A Base N/A
06/01/2022 $24,967
Year
06/01/2023 $25,353
06/01/2024 $25,739
06/01/2025 $26,125
Panera Bread 5,000 TBD 10 Years $30.12 $12,545 $5,356.52 TBD +6%/5 Years NNN Four, 5 Year Options
Sandler 250 06/01/2014 05/31/2019 $75.59 $1,575 N/A 06/01/2018 $1,637.80 Gross One, 5 Year Option
Solution for Tuition 500 01/01/2013 12/31/2017 $48.00 $2,000 N/A N/A N/A Gross One, 5 Year Option
This information has been secured from sources we believe to be reliable, but we make no representations or warranties, expressed or implied, as to the accuracy of the information. References to square footage or age are approximate. Buyer must verify the
18
information and bears all risk for any inaccuracies. Any projections, opinions, assumptions or estimates used herein are for example purposes only and do not represent the current or future performance of the property. Marcus & Millichap Real Estate Investment
Services is a service mark of Marcus & Millichap Real Estate Investment Services, Inc. © 2016 Marcus & Millichap ACT ID Y0050314FINANCIAL ANALYSIS Bridge Center
TENANT AND LEASE SUMMARY
Start End Monthly Monthly Escalation Escalated Lease
Tenant SF $/SF Options
Date Date Rent CAM Date(s) Rent(s) Type
09/04/2017 $3,589.74
09/04/2018 $3,769.23
RE/MAX 2,004 09/05/2015 09/04/2023 $20.47 $3,419 $1,921.00 09/04/2019 $3,957.69 NNN One, 5 Year Option
09/04/2020 $4,155.57
09/04/2021 $4,363.35
09/04/2022 $4,581.52
04/30/2018 $4,439.07
04/30/2019 $4,616.63
RE/MAX 2,500 05/01/2016 09/04/2023 $20.49 $4,268 $2,046.74 04/30/2020 $4,801.30 NNN N/A
04/30/2021 $4,993.35
04/01/2022 $5,193.08
04/01/2023 $5,400.81
01/01/2018 $3,626.00
Waxing the City 2,000 01/01/2014 09/30/2019 $20.92 $3,487 N/A Gross One, 5 Year Option
01/01/2019 $3,771.00
Key Bank ATM
N/A 06/01/2011 5/31/2018 N/A $2,500 N/A N/A N/A Gross Two, 5 Year Options
Drive-Thru
Total Rental Total CAM
Occupancy GLA
Income Income
(100%) 25,486 Monthly $64,543 $11,411
Annually $774,516 $136,934
This information has been secured from sources we believe to be reliable, but we make no representations or warranties, expressed or implied, as to the accuracy of the information. References to square footage or age are approximate. Buyer must verify the
19
information and bears all risk for any inaccuracies. Any projections, opinions, assumptions or estimates used herein are for example purposes only and do not represent the current or future performance of the property. Marcus & Millichap Real Estate Investment
Services is a service mark of Marcus & Millichap Real Estate Investment Services, Inc. © 2016 Marcus & Millichap ACT ID Y0050314comparables
COMPARABLESCOMPARABLES
Bridge Center
Bridge Center
LONE TREE, CO RENT COMPARABLES
RENTRENT COMPARABLES
COMPARABLES MAP AVG. OCCUPANCY: 93%
DESCRIPTION
PROPERTY
100.00
90.00
80.00
70.00
60.00
6 50.00
40.00
30.00
20.00
OVERVIEW
1 3
MARKET
10.00
2 0.00
Subject Meadows Lone Tree Mellow Strawberry Hill Park Meadows The Yard
5 Property Shopping Entertainment Mushroom Strip Center
Center District
4
AVG. RENT: $22.50 PER SF
34.00
32.00
30.00
FINANCIAL
ANALYSIS
28.00
26.00
24.00
Rent Comparables 22.00
20.00
Bridge Center 18.00
Subject 1) Meadows Shopping Center 16.00
2) Lone Tree Entertainment District I 14.00
1 Meadows Shopping Center 4 Strawberry Hill
3) Lone Tree Entertainment District II 12.00
4) Mellow Mushroom 10.00
2 Lone Tree Entertainment District I 5 Park
5) Meadows Strip Center
Strawberry Hill 8.00
6.00
6) Park Meadows Strip Center
7) The Yard 4.00
3 Mellow Mushroom 6 The Yard 2.00
0.00
COMPARABLES
Subject Meadows Lone Tree Mellow Strawberry Hill Park Meadows The Yard
Property * Shopping Entertainment Mushroom Strip Center
Center District
*Rent/SF for Subject Property adjusted for gross leases
This information has been secured from sources we believe to be reliable, but we make no representations or warranties, expressed or implied, as to the accuracy of the information. References to square footage or age are approximate. Buyer must verify the
21
information and bears all risk for any inaccuracies. Any projections, opinions, assumptions or estimates used herein are for example purposes only and do not represent the current or future performance of the property. Marcus & Millichap Real Estate Investment
Services is a service mark of Marcus & Millichap Real Estate Investment Services, Inc. © 2016 Marcus & Millichap ACT ID Y0050314COMPARABLES Bridge Center
RENT COMPARABLES
1 Meadows Shopping Center 8848 Maximus Drive, Lone Tree, CO 80124
DESCRIPTION
PROPERTY
Date of Survey: 2/2017
Major Tenants
Clothes Mentor
Occupancy: 92%
Children’s Choice Childcare Year Built: 1986/2005
Arch Pizza Gross Leasable Area (GLA): 19,656 SF
Mr. Donut Rent/SF (GLA): $20.00
Fleur de Lis Salon
Available SF: 1,548
Lot Size: 1.75 Acres
Lease Type: NNN
Comments: The Meadows Shopping Center has current average rents of approximately $20.00/SF NNN.
OVERVIEW
MARKET
2 Lone Tree Entertainment District 9535 Park Meadows Drive, Lone Tree, CO 80124
Date of Survey: 2/2017
Major Tenants
United Artist Theaters
Occupancy: 88%
Mimi’s Cafe Year Built: 2000
Woodhouse Day Spa Gross Leasable Area (GLA): 20,416 SF
The Rio Grande Mexican Rent/SF (GLA): $19.00-$24.00/SF
Restaurant
Available SF: 2,600
Lot Size: 1.89 Acres
FINANCIAL
ANALYSIS
Lease Type: NNN
Comments: This retain/restaurnat strip fronts a 12-screen movie theater. Asking rents for the retail space are between $19.00 and $24.00/SF. The Rio Grande Mexican restaurant just expanded theri space to include an additional 1,539 square feet for
$24.00/SF
3 Mellow Mushroom 9271 Park Meadows Drive, Lone Tree, CO 80124
Date of Survey: 2/2017
Major Tenant
Mellow Mushroom
Occupancy: 100%
Year Built: 2000
Gross Leasable Area (GLA): 6,796 SF
COMPARABLES
Rent/SF (GLA): $24.00/SF
Available SF: N/A
Lot Size: 1.50 Acres
Lease Type: NNN
Comments: Large, single-tenant, net-leased restaurant space with in-place rent of approximately $24.00/SF.
This information has been secured from sources we believe to be reliable, but we make no representations or warranties, expressed or implied, as to the accuracy of the information. References to square footage or age are approximate. Buyer must verify the
22
information and bears all risk for any inaccuracies. Any projections, opinions, assumptions or estimates used herein are for example purposes only and do not represent the current or future performance of the property. Marcus & Millichap Real Estate Investment
Services is a service mark of Marcus & Millichap Real Estate Investment Services, Inc. © 2016 Marcus & Millichap ACT ID Y0050314COMPARABLES Bridge Center
RENT COMPARABLES
DESCRIPTION
4 Strawberry Hill 9064 Frosstrom Rive, Lone Tree, CO 80124
PROPERTY
COMPARABLES
Major Tenants
Date of Survey:
Occupancy:
2/2017
83%
State Farm Insurance
Karate Studio Year Built: 2006
Nail Salon Gross Leasable Area (GLA): 9,000 SF
Physical Therapy Clinic Rent/SF (GLA): $17.00-$19.00/SF
Available SF: 1,500
Lot Size: 1.10 Acres
Lease Type: NNN
OVERVIEW
Comments: A two-strip property with asking rents at $19.00/SF with actual rents ranging between $15.00/SF and $19.00/SF.
MARKET
5 Park Meadows Strip Center 10025 Park Meadows Drive, Lone Tree, CO 80124
Date of Survey: 2/2017
Major Tenants
Rocky Mountain Law
Occupancy: 100%
Enforcement Federal Credit Year Built: 2001/2012
Union Gross Leasable Area (GLA): 7,314 SF
Rent/SF (GLA): $18.00/SF
Available SF: N/A
Lot Size: 2.23 Acres
FINANCIAL
ANALYSIS
Lease Type: FS
Comments: The Rocky Mountain Law Enforcement Building was recently renovated and leased to the Rocky Mountain Law Enforcement Federal Credit Union for $18.00/SF full service gross.
6 The Yard South Yosemite Street, Lone Tree, CO 80124
Date of Survey: 2/2017
Major Tenant
TBD
Occupancy: 0%
Year Built: TBD
Gross Leasable Area (GLA): 85,142 SF
COMPARABLES
Rent/SF (GLA): $22.00-$30.00/SF
Available SF: 85,142 SF
Lot Size: 14.1 Acres
Lease Type: NNN
Comments: The Yard is a proposed office/retail development located across form the subject property. The project will occupy the entire northeast corner of South Yosemite Street & Park Meadows Drive bordered by the C-470 tollway. Alberta
Development Partners is working together with Galloway Architects to produce a unique addition to the area focusing on being outdoor-centric and pedestrian friendly.
This information has been secured from sources we believe to be reliable, but we make no representations or warranties, expressed or implied, as to the accuracy of the information. References to square footage or age are approximate. Buyer must verify the
23
information and bears all risk for any inaccuracies. Any projections, opinions, assumptions or estimates used herein are for example purposes only and do not represent the current or future performance of the property. Marcus & Millichap Real Estate Investment
Services is a service mark of Marcus & Millichap Real Estate Investment Services, Inc. © 2016 Marcus & Millichap ACT ID Y0050314CO RECENT SALES
ALES MAP
COMPARABLES Bridge Center
RECENT SALE COMPARABLES
DESCRIPTION
AVG. CAP RATE: 6.61%
PROPERTY
3
8
8.00
7.00
6.00
5.00
4.00
3.00
4
2.00
OVERVIEW
MARKET
1 1.00
0.00
Subject Meadows Shops at Shoppes at Serenity Promenade Park Valley Pinehill Lakewood
Property Shopping Robinson Tower Ridge at Castle Center VI Crossing City Center
Center Ranch Crossing Rock
6 7
2 AVG. PRICE PER SF: $365.00
5
600.00
550.00
FINANCIAL
ANALYSIS
500.00
Sale Comparables 450.00
400.00
Subject Bridge Center
1) Pinehill Crossing Shopping Center350.00
1 Meadows Shopping Center 5 Promenade at Castle
2) Shops Rock Ranch
at Robinson 300.00
3) The Shoppes at Tower Crossing 250.00
2 Shops at Robinson Ranch 6 Park Valley Center
4) Shops VI Meadows
at Park 200.00
3 The Shops at Tower Crossing 7 Pinehill Crossing 150.00
100.00
4 Serenity Ridge 8 Lakewood City Center 50.00
COMPARABLES
0.00
Subject Meadows Shops at Shoppes at Serenity Promenade Park Valley Pinehill Lakewood
Property Shopping Robinson Tower Ridge at Castle Center VI Crossing City Center
Center Ranch Crossing Rock
This information has been secured from sources we believe to be reliable, but we make no representations or warranties, expressed or implied, as to the accuracy of the information. References to square footage or age are approximate. Buyer must verify the
24
information and bears all risk for any inaccuracies. Any projections, opinions, assumptions or estimates used herein are for example purposes only and do not represent the current or future performance of the property. Marcus & Millichap Real Estate Investment
Services is a service mark of Marcus & Millichap Real Estate Investment Services, Inc. © 2016 Marcus & Millichap ACT ID Y0050314COMPARABLES Bridge Center
RECENT SALE COMPARABLES
1 Meadows Shopping Center 8848 Maximus Drive, Lone Tree, CO 80124
DESCRIPTION
PROPERTY
Major Tenants Close of Escrow: 1/2017
Clothes Mentor Year Built: 1986/2005
Children’s Choice Childcare Gross Leasable Area (GLA): 19,656 SF
Arch Pizza
Sales Price: $5,150,000
Mr. Donut
CAP Rate: 6.60%
Fleur de Lis Salon
Price/SF (GLA): $321.25
Lot Size: 2.50 Acres
Comments: The Meadows Shopping Center is located directly accross the street from the Bridge Center and sold for $5,150,000 in January of 2017.
OVERVIEW
MARKET
2 Shops at Robinson Ranch 12311 Pine Bluffs Way, Parker, CO 80134
Major Tenants Close of Escrow: 12/2015
Takoda Tavern Year Built: 2008
Tai Kwondo Gross Leasable Area (GLA): 20,230 SF
Parker Rehabilitation
Sales Price: $5,000,000
My House Fitness
CAP Rate: 6.98%
Price/SF (GLA): $247.16
Lot Size: 2.47 Acres
FINANCIAL
ANALYSIS
Comments: This sale was for a 20,230 square foot strip center situated on 2.47 acres. The center was built in 2008 and was 83% leased at the time of sale. The net operating income was $349,156 which reflects the captitalization rate of 6.98%.
3 The Shoppes at Tower Crossing 3551 South Tower Road, Aurora, CO 80013
Close of Escrow: 7/2015
Major Tenants
Year Built: 2005
Starbucks
Chase Gross Leasable Area (GLA): 10,140 SF
Verizon Wireless Sales Price: $5,200,00
COMPARABLES
CAP Rate: 6.21%
Price/SF (GLA): $512.82
Lot Size: 1.76 Acres
Comments: This fully leased retail strip center was sold in July 2015 for $5,200,000 which represents a 6.21% capitalization rate.
This information has been secured from sources we believe to be reliable, but we make no representations or warranties, expressed or implied, as to the accuracy of the information. References to square footage or age are approximate. Buyer must verify the
25
information and bears all risk for any inaccuracies. Any projections, opinions, assumptions or estimates used herein are for example purposes only and do not represent the current or future performance of the property. Marcus & Millichap Real Estate Investment
Services is a service mark of Marcus & Millichap Real Estate Investment Services, Inc. © 2016 Marcus & Millichap ACT ID Y0050314COMPARABLES Bridge Center
RECENT SALE COMPARABLES
4 Serenity Ridge 25791 East Smoky Hill Road, Aurora, CO 80016
DESCRIPTION
PROPERTY
Major Tenants Close of Escrow: 9/2016
Papa Murphy’s Year Built: 2016
Supercuts Gross Leasable Area (GLA): 23,801 SF
Subway
Sales Price: $10,250,000
Blue Sky Lounge and Spa
CAP Rate: 6.45%
Serenity Cleaners
Price/SF (GLA): $430.89
Lot Size: 3.05 Acres
Comments: The 23,801 square feet buildiing was 100% occupied at the time of purchase, with an net operating income of $662,000. The transaction was the up-leg in a 1031 exchange.
OVERVIEW
MARKET
5 Promenade at Castle Rock 4989 Meadows Parkway, Castle Rock, CO 80108
Major Tenants Close of Escrow: 9/2016
Mod Pizza Year Built: 2016
AT&T Gross Leasable Area (GLA): 10,113 SF
Jersey Mikes
Sales Price: $6,000,000
Bar Nails
CAP Rate: 6.25%
Price/SF (GLA): $569.46
Lot Size: 1.36 Acres
FINANCIAL
ANALYSIS
Comments: Construction on this building was completed in July of 2016, and has five tenants, including a local bank branch and a major cell phone retailer.
6 Parker Valley Center VI 11280 South Twenty Mile Road, Parker, CO 80134
Major Tenants Close of Escrow: 4/2016
Firehouse Subs Year Built: 2003
Nationwide Insurance Gross Leasable Area (GLA): 23,000 SF
U.S. Navy Recruiting Sales Price: $7,825,00
COMPARABLES
Parker Smiles
CAP Rate: 6.55%
Tequila Joe’s
Price/SF (GLA): $340.22
Lot Size: 2.11 Acres
Comments: This 23,000 building was 39.4% occuipied at the time of sale, with a total of ten tenants in the bulding.
This information has been secured from sources we believe to be reliable, but we make no representations or warranties, expressed or implied, as to the accuracy of the information. References to square footage or age are approximate. Buyer must verify the
26
information and bears all risk for any inaccuracies. Any projections, opinions, assumptions or estimates used herein are for example purposes only and do not represent the current or future performance of the property. Marcus & Millichap Real Estate Investment
Services is a service mark of Marcus & Millichap Real Estate Investment Services, Inc. © 2016 Marcus & Millichap ACT ID Y0050314COMPARABLES Bridge Center
RECENT SALE COMPARABLES
7 Pinehill Crossing 19878 East Hilltop Drive, Parker, CO 80134
DESCRIPTION
PROPERTY
Major Tenants Close of Escrow: 5/2016
Hilltop Tap House Year Built: 2008
Sweet Peats Gross Leasable Area (GLA): 11,753 SF
Red Carpet Boutique
Sales Price: $3,600,000
Milano Nails
CAP Rate: 7.10%
Hilltop Cleaners
Price/SF (GLA): $306.30
Lot Size: 1.25 Acres
Comments: The Higgins Group closed on the Pinehill Crossing Shopping Center located in Parker, Colorado. At the time of the sale, the property was 100% occupied with a local restaurant, liquor store, a dry cleaner and others.
OVERVIEW
MARKET
8 Lakewood City Center 650-670 Wadsworth Blvd. Lakewood, CO 80226
Major Tenants Close of Escrow: 2/2017
Panera Bread Year Built: 1993
Firehouse Subs Gross Leasable Area (GLA): 44,983 SF
Crazy Scrubs
Sales Price: $8,400,000
Jenny Craig
CAP Rate: 7.01%
Fro Yo Zone
Price/SF (GLA): $192.00
Lot Size: 4.23 Acres
FINANCIAL
ANALYSIS
Comments: Lakewood City Center is located accross the street form the Belmar Shopping Center, which is Lakewood’s largest shopping desitnation. It sold in early 2017 for $8,400,00, which reperesnted a price/SF of $192.00.
COMPARABLES
This information has been secured from sources we believe to be reliable, but we make no representations or warranties, expressed or implied, as to the accuracy of the information. References to square footage or age are approximate. Buyer must verify the
27
information and bears all risk for any inaccuracies. Any projections, opinions, assumptions or estimates used herein are for example purposes only and do not represent the current or future performance of the property. Marcus & Millichap Real Estate Investment
Services is a service mark of Marcus & Millichap Real Estate Investment Services, Inc. © 2016 Marcus & Millichap ACT ID Y0050314Bridge Center
TRAFFIC COUNT MAP
DESCRIPTION
PROPERTY
VPD
920
28,
11
5,
68
6
VP
OVERVIEW
MARKET
D
PD
4V
Subject Property
21 ,27
35
,36
3V
PD
FINANCIAL
ANALYSIS
PD
5V
,55
27
COMPARABLES
This information has been secured from sources we believe to be reliable, but we make no representations or warranties, expressed or implied, as to the accuracy of the information. References to square footage or age are approximate. Buyer must verify the
28
information and bears all risk for any inaccuracies. Any projections, opinions, assumptions or estimates used herein are for example purposes only and do not represent the current or future performance of the property. Marcus & Millichap Real Estate Investment
Services is a service mark of Marcus & Millichap Real Estate Investment Services, Inc. © 2016 Marcus & Millichap ACT ID Y0050314exclusively listed
You can also read