Investor Presentation Cactus, Inc. (NYSE: WHD) March 2021 - Cactus Wellhead

Page created by Tom Long
 
CONTINUE READING
Investor Presentation Cactus, Inc. (NYSE: WHD) March 2021 - Cactus Wellhead
Investor Presentation
Cactus, Inc. (NYSE: WHD)
March 2021
Investor Presentation Cactus, Inc. (NYSE: WHD) March 2021 - Cactus Wellhead
Important Disclosures
Non-GAAP Measures
This presentation includes references to EBITDA, Adjusted EBITDA, Adjusted EBITDA Margin, and EBIT, which are not measures calculated in accordance with accounting principles
generally accepted in the United States of America (“GAAP”). A reconciliation of EBITDA, Adjusted EBITDA and EBIT to net income, the most directly comparable measure calculated in
accordance with GAAP, is provided in the Appendix included in this presentation. While management believes such measures are useful for investors, these measures should not be
used as a replacement for financial measures that are calculated in accordance with GAAP.
Forward-Looking Statements
The information in this presentation includes “forward-looking statements” within the meaning of Section 27A of the Securities Act of 1933, as amended, and Section 21E of the Securities
Exchange Act of 1934, as amended. All statements, other than statements of historical fact included in this presentation, regarding our strategy, future operations, financial position,
estimated revenues and losses, projected costs, prospects, plans and objectives of management are forward-looking statements. When used in this presentation, the words “may,”
“hope,” “potential,” “could,” “believe,” “anticipate,” “intend,” “estimate,” “expect,” “project” and similar expressions are intended to identify forward-looking statements, although not all
forward-looking statements contain such identifying words. These forward-looking statements are based on Cactus’ current expectations and assumptions about future events and are
based on currently available information as to the outcome and timing of future events. We caution you that these forward-looking statements are subject to all of the risks and
uncertainties, most of which are difficult to predict and many of which are beyond our control, incident to the operation of our business. When considering forward-looking statements, you
should keep in mind the risk factors and other cautionary statements described under the heading ‘‘Risk Factors’’ included in our SEC filings. These forward-looking statements are based
on management’s current belief, based on currently available information, as to the outcome and timing of future events. Important factors that could cause actual results to differ
materially from those in the forward-looking statements include, but are not limited to: demand for our products and services, which is affected by, among other things, changes in the
price of crude oil and natural gas in domestic and international markets; the level of growth or decline in the number of rigs, pad sizes, well spacings and associated well count; availability
of takeaway and storage capacity; availability of capital and the associated capital spending discipline exercised by customers; the financial health of our customers and our credit risk of
customer non-payment; changes in the number of drilled but uncompleted wells and the level of completion activity; the size and timing of orders; availability of raw materials and imported
items; shipping costs and availability of ocean freight from China; transportation differentials associated with reduced capacity in and out of the storage hub in Cushing, Oklahoma;
expectations regarding raw materials, overhead and operating costs and margins; availability of skilled and qualified workers; potential liabilities such as warranty and product liability
claims arising out of the installation, use or misuse of our products; the possibility of cancellation of orders; our business strategy; our financial strategy, operating cash flows, liquidity and
capital required for our business; our future revenue, income and operating performance; our ability to pay dividends and the amount of any such dividends; corporate consolidation
activity involving our customers; the addition or termination of relationships with major customers or suppliers; laws and regulations, including environmental regulations, that may increase
our costs, limit the demand for our products and services or restrict our operations; disruptions in the political, regulatory, economic and social conditions domestically or internationally;
the ultimate severity and duration of the ongoing outbreak of coronavirus (COVID-19) and the extent of its impact on our business; outbreaks of other pandemic or contagious diseases
that may disrupt our operations, suppliers or customers or impact demand for oil and gas; the impact of actions taken by the Organization of Petroleum Exporting Countries (OPEC) and
other oil and gas producing countries affecting the supply of oil and natural gas; increases in import tariffs assessed on products from China and imported raw materials used in the
manufacture of our goods in the United States which could negatively impact margins and our working capital; the significance of future liabilities under the tax receivable agreement (the
“TRA”) we entered into with certain current or past direct and indirect owners of Cactus LLC in connection with our initial public offering; a failure of our information technology
infrastructure or any significant breach of security; potential uninsured claims and litigation against us; competition within the oilfield services industry; our dependence on the continuing
services of certain of our key managers and employees; currency exchange rate fluctuations associated with our international operations; and plans, objectives, expectations and
intentions contained in this presentation that are not historical. You are cautioned not to place undue reliance on any forward-looking statements, which speak only as of the date of this
presentation. We disclaim any duty to update and do not intend to update any forward-looking statements, all of which are expressly qualified by the statements in this section, to reflect
events or circumstances after the date of this presentation.
Industry and Market Data
This presentation has been prepared by Cactus and includes market data and other statistical information from third-party sources, including independent industry publications,
government publications or other published independent sources. Some data is also based on Cactus’ good faith estimate. Although Cactus believes these third-party sources are reliable
as of their respective dates, Cactus has not independently verified the accuracy or completeness of this information.
Information Presented
Except as otherwise indicated or required by the context, references in this presentation to the “Company,” “Cactus,” “we,” “us” and “our” refer to (i) Cactus Wellhead, LLC (“Cactus LLC”)
and its consolidated subsidiaries prior to the completion of our IPO and (ii) Cactus, Inc. (“Cactus Inc.”) and its consolidated subsidiaries (including Cactus LLC) following the completion of
our IPO on February 12, 2018. Cactus LLC is our accounting predecessor.
                                                                                                                                                                                                       2
Investor Presentation Cactus, Inc. (NYSE: WHD) March 2021 - Cactus Wellhead
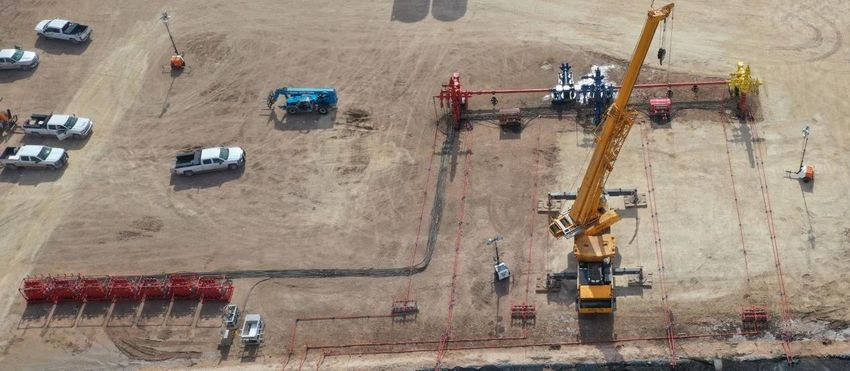
Experienced Executive Team
                          ◼   Mr. Bender has served as President and CEO since co-founding Cactus Wellhead, LLC (“Cactus LLC”) in 2011.
                          ◼   Mr. Bender previously was President of Wood Group Pressure Control from 2000 to 2011.
    Scott Bender          ◼   Mr. Bender successfully built and monetized Ingram Cactus Company (sold to Cameron in 1996) and led Wood Group
   President & CEO            Pressure Control’s profitable expansion until its sale to General Electric in 2011.
                          ◼   Mr. Bender graduated from Princeton University in 1975 with a Bachelor of Science in Engineering and from the
                              University of Texas at Austin in 1977 with a Master of Business Administration.

                          ◼   Mr. Bender has served as Senior Vice President and COO since co-founding Cactus LLC in 2011.
                          ◼   Mr. Bender previously was Senior Vice President of Wood Group Pressure Control from 2000 to 2011.
     Joel Bender
                          ◼   Mr. Bender successfully built and monetized Ingram Cactus Company (sold to Cameron in 1996) and led Wood Group
Senior Vice President &
                              Pressure Control’s profitable expansion until its sale to General Electric in 2011.
Chief Operating Officer
                          ◼   Mr. Bender graduated from Washington University in 1981 with a Bachelor of Science in Engineering and from the
                              University of Houston in 1985 with a Master of Business Administration.

                          ◼   Mr. Bender has served as Vice President of Operations of Cactus LLC since 2011, managing all US service center and
                              field operations.
   Steven Bender
   Vice President of      ◼   Mr. Bender previously was Rental Business Manager of Wood Group Pressure Control from 2005 to 2011.
      Operations
                          ◼   Mr. Bender graduated from Rice University in 2005 with a Bachelor of Arts in English and Hispanic Studies and from the
                              University of Texas at Austin in 2010 with a Master of Business Administration.

                          ◼   Mr. Tadlock has served as Vice President, Chief Financial Officer & Treasurer, since March 2019.
                          ◼   Mr. Tadlock previously served as Vice President and Chief Administrative Officer since March 2018 and has also served
   Steve Tadlock
                              as VP of Corporate Services since June 2017. He has worked with Cactus LLC since its founding in 2011 as a Board
 Vice President, Chief        observer.
  Financial Officer &
                          ◼   Mr. Tadlock previously worked at Cadent Energy Partners, where he served as a Partner from 2014 to 2017.
       Treasurer
                          ◼   Mr. Tadlock graduated from Princeton University in 2001 with a Bachelor of Science in Engineering and from the
                              Wharton School at the University of Pennsylvania in 2007 with a Master of Business Administration.

                          ◼   Mr. Isaac has served as Vice President of Administration and General Counsel since September 2018.
     David Isaac          ◼   Mr. Isaac previously worked at Rockwater Energy Solutions, Inc. and most recently served as Senior Vice President of
   Vice President of          Human Resources and General Counsel.
  Administration and      ◼   Mr. Isaac previously was the Vice President of Human Resources and General Counsel of Inmar, Inc.
   General Counsel        ◼   Mr. Isaac graduated from The College of William & Mary in 1983 with a Bachelor of Arts in Economics and from The Ohio
                              State University in 1986 with a Juris Doctor.

                                                                                                                                                       3
Investor Presentation Cactus, Inc. (NYSE: WHD) March 2021 - Cactus Wellhead
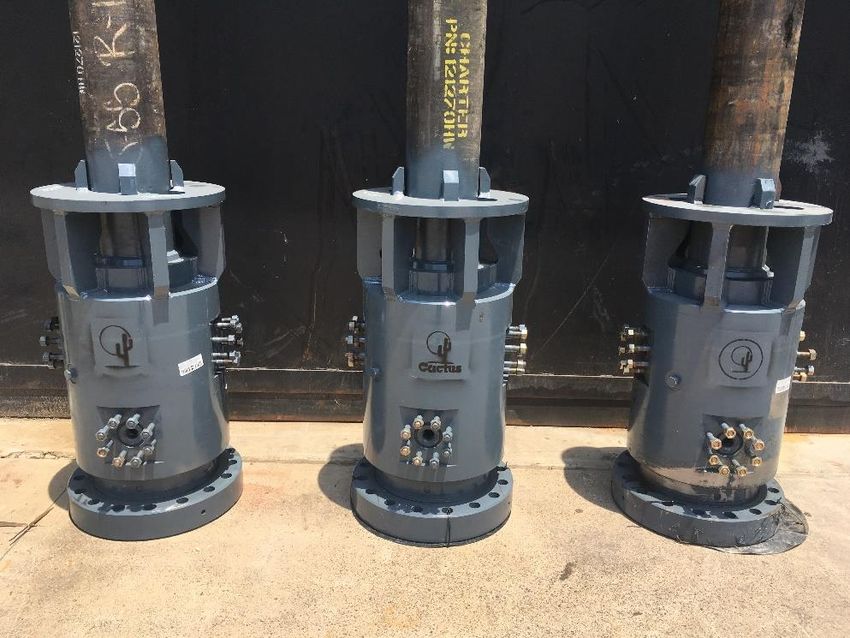
Investment Highlights
     A Leading Pure Play Wellhead and Pressure Control
1    Equipment Solutions Provider for Onshore Markets

     Innovate & Differentiated Products & Services That
2    Drive Relative Margin Stability Through the Cycle

                                                          Through-Cycle
3    Dynamic Operating and Manufacturing Capabilities
                                                          Outperformance

4    Returns Focused with Large Net Cash Balance

     Experienced Management Team with Significant
5    Equity Ownership & Strong Industry Relationships

                                                                           4
Investor Presentation Cactus, Inc. (NYSE: WHD) March 2021 - Cactus Wellhead
Company Overview
          Cactus designs, manufactures, sells and rents highly engineered products which generate
                   improved drilling and completions efficiencies while enhancing safety
               2020 Revenue by Type                                                         Revenue ($ in millions)
                                                                                                                                                                                                              $628.4
                                                                                                                                                                              $544.1

                         Field                                                                                                                $341.2                                                                                          $348.6
                        Service
                          and                                                                                 $155.0
                         Other
                         22%

                  Rental                      Product                                                           2016                            2017                           2018                            2019                            2020
                   19%                         59%                                                        33.4%              37.1%

                                                                                              Adjusted EBITDA(1) ($ in millions)
                                                                                                          Margin             Margin

                                                                                                                                                                              $212.6                         $229.0

                                                                                                                                              $112.1                                                                                         $121.0

                                                                                                               $32.2
     *Product Revenue Includes Drilling and Production
                     Consumables
                                                                                                               2016                            2017                            2018                            2019                           2020
     Selected Active Basins                                                               Adj. EBITDA(1)
                                                                                          as % of        20.8%                                  32.9%                          39.1%                           36.4%                          34.7%
    ◼     Bakken                       ◼    DJ / Powder River                             Revenue

                                                                                              Adjusted EBITDA(1) – Net Capital Expenditures(2) as % of Revenue
    ◼     Eagle Ford                   ◼    Marcellus / Utica
                                                                                                                                                                                                              27.5%                          29.5%
    ◼     Permian                      ◼    Haynesville                                                                                       23.9%                           26.5%

                                                                                                               9.6%
                ◼     Cooper, Australia

                                                                                                               2016                            2017                            2018                            2019                           2020

Source: Company filings.                                                                                                                                                                                                                                           5
1)    EBITDA and Adjusted EBITDA are non-GAAP financial measures. The Appendix at the back of this presentation contains a reconciliation of EBITDA and Adjusted EBITDA to net income, the most comparable financial measure calculated in accordance with GAAP.
2)    Net Capital Expenditures equals net cash flows from investing activities.
Investor Presentation Cactus, Inc. (NYSE: WHD) March 2021 - Cactus Wellhead
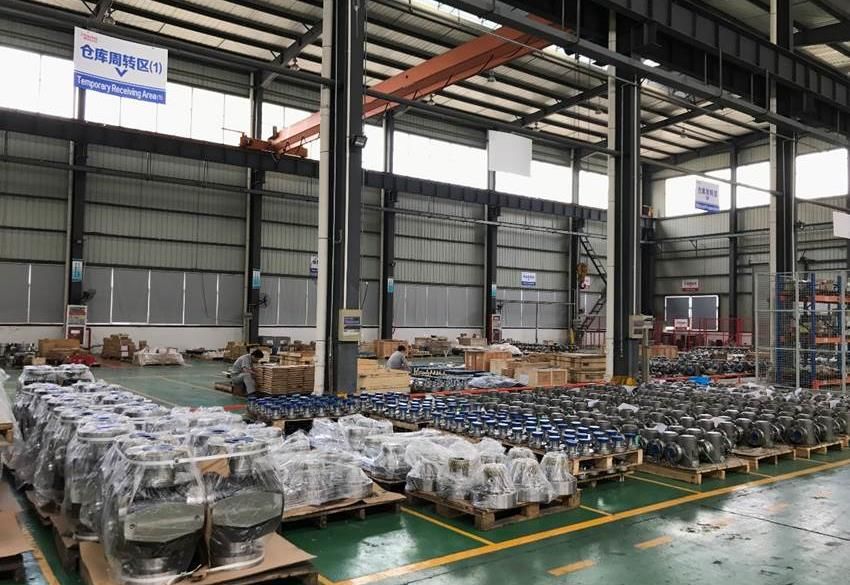
Proprietary Equipment Across Drilling, Completion, and
Production Phases of a Well
Technologically advanced wellhead and frac solutions deliver greater reliability and time savings
◼   Designed for pad drilling and intense completion environments

◼   Principal products: SafeDrill® wellheads, frac related rentals and production trees

◼   Time savings can exceed 30 hours of rig time per well

            Drilling                        Completion (Frac)                             Production

    Consumable Sale                        Temporary Rental                      Consumable Sale

               Cactus Also Provides Field Service, Installation & Maintenance
                                                                                                       6
Investor Presentation Cactus, Inc. (NYSE: WHD) March 2021 - Cactus Wellhead
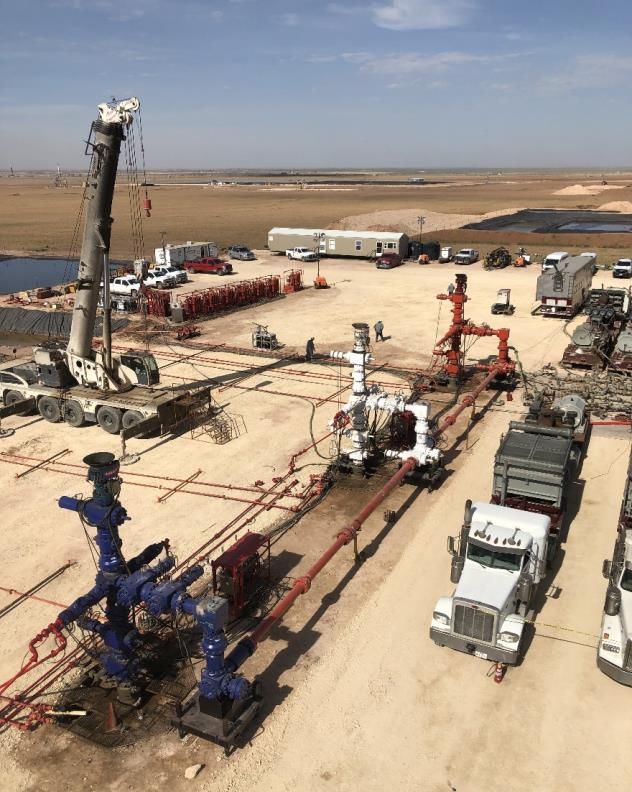
Market Leader with Strong Market Share Growth
   Historical U.S. Onshore Market Share(1)
 400                                                                                                                                                                                                                                                                        50.0%

                                                                                                                                                                                                                                                                            45.0%
 350                                                                                                                                                                                                                                                          43.1%
                       Cactus Rigs Followed
                                             (1)                                                                                                                                                                                                                            40.0%
                       Market Share                                                                                                                                                                       295
 300
                                                                                                                                                                                             275                        276                      32.7%                      35.0%

 250                                                                                                                                                                           245                                                   240
                                                                                                                                                                                                                                                                            30.0%
                                                                                                                                                                  220                                                               30.9%
                                                                                                                                                                                                                       29.3%
                                                                                                                                                                                                         28.2%
 200                                                                                                                                                                                       26.6%                                                                            25.0%
                                                                                               179                                                 21.5%                      27.0%
                                                                                 158                                                                             24.4%
                                                                                                                                     17.5%                                                                                                                                  20.0%
 150
                                                                                                                                                    129                                                                                                         127
                                                                    119                                     119         14.5%
                                                                                                                                                                                                                                                                            15.0%
                                                      100                                                                 99
 100                                                                                                                                                                                                                                               87
                                                                                                          14.4%
                                          75
                                                                                                                                        68                                                                                                                                  10.0%
                            47                                                                9.8%
  50                                                                             8.9%
                                                                   7.0%                                                                                                                                                                                                     5.0%
               15                                     5.9%
                                        4.3%
             0.8%          2.5%
    0                                                                                                                                                                                                                                                                       0.0%
           Dec-11        Jun-12       Dec-12        Jun-13       Dec-13        Jun-14       Dec-14       Jun-15        Dec-15       Jun-16        Dec-16       Jun-17       Dec-17        Jun-18       Dec-18        Jun-19       Dec-19        Jun-20 Q4 2020
 U.S.
Onshore     1,931         1,899        1,729         1,694        1,703         1,780         1,820         825           684           388          601           902          909         1,035         1,045          941           777          266           295
 Rigs

                                                                        U.S. Market Share Continues to Increase
 Source: Baker Hughes Rig Count Data, as published on the Friday on or immediately preceding the 15th day of each month presented, and Cactus analysis.
 1)    Represents the number of active U.S. onshore rigs Cactus followed divided by the total number of active U.S. onshore rigs, as of mid-period. The number of active U.S. onshore rigs Cactus followed represents the approximate number of active U.S. onshore drilling
       rigs to which Cactus was the primary provider of wellhead products and corresponding services during drilling, as of mid-month. Cactus believes that comparing the total number of active U.S. onshore rigs to which it is providing its products and services at a given
       time to the total number of active U.S. onshore rigs on or about such time provides Cactus with a reasonable approximation of its market share with respect to its wellhead products sold and the corresponding services it provides. Q4 2020 represents the average
       number of active U.S. onshore rigs Cactus followed (which Cactus defines as the number of active U.S. onshore drilling rigs to which it was the primary provider of wellhead products and corresponding services during drilling) as of mid-month for each of the three
       months in the applicable quarter divided by the Baker Hughes U.S. onshore rig count quarterly average.                                                                                                                                                                       7
Investor Presentation Cactus, Inc. (NYSE: WHD) March 2021 - Cactus Wellhead
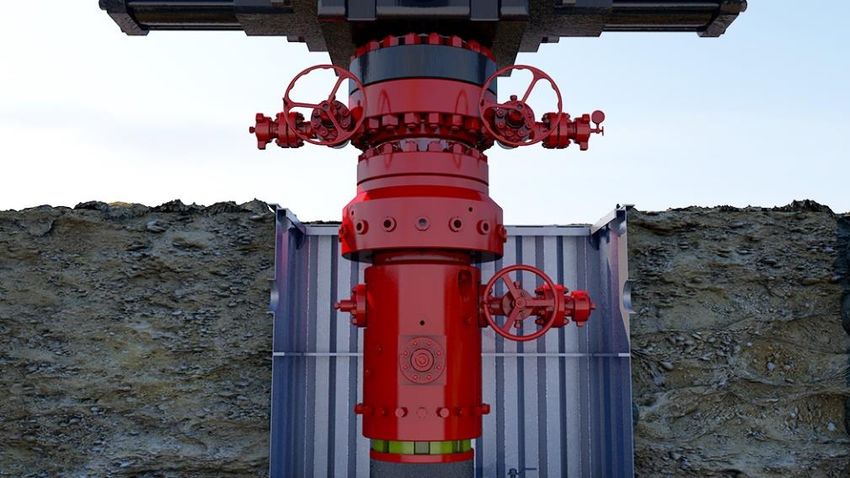
Differentiated Margin Profile Through the Cycle
       Historical Adjusted EBITDA Margins (2014 – YTD 2020) (1)(2)                                                                                  Adjusted EBITDA Margin (2014 – YTD 2020) (1)(2)

                                                                                                                                                     35%           34%
        40%

        35%                                                                                                                                          30%
                                                                                                                                                                                  27%
        30%
                                                                                                                                                     25%
                                                                                                                                                                                                23%
        25%

                                                                                                                                                     20%
        20%                                                                                                                                                                                                    18%

                                                                                                                                                                                                                             15%
        15%                                                                                                                                          15%                                                                                   14%            14%           14%

        10%
                                                                                                                                                     10%

          5%
                                                                                                                                                       5%
          0%
                        2014           2015            2016            2017            2018            2019            2020
                                                                                                                                                       0%
                                       WHD                  Peer A              Peer B               Peer C
                                                                                                                                                                  WHD           Peer A Peer B Peer C Peer D Peer E Peer F Peer G
                                       Peer D               Peer E              Peer F               Peer G

             Strength of margin profile relative to peers maintained through the cycle
Source: Factset, Company filings.
1)    Peer data represents Adjusted EBITDA where available per company filings and presentations. Peers include: ChampionX, Core Laboratories, DMC Global Inc., Dril-Quip, National Oilwell Varco, Oil States International and TechnipFMC. Cactus’ computation of Adjusted
      EBITDA may not be comparable to other similarly titled measures of other companies. TechnipFMC data represents FMC Technologies financial data from 2014 to 2016 and TechnipFMC plc data pro forma for the separation of Technip Energies thereafter.
2)    Cactus data represents Adjusted EBITDA, defined as EBITDA excluding (gain) loss on debt extinguishment, stock-based compensation, severance expenses, non-cash adjustments for the revaluation of the liability related to the tax receivable agreement, and equity offering   8
      expenses. The Appendix at the back of this presentation contains a reconciliation of EBITDA and Adjusted EBITDA to net income, the most comparable financial measure calculated in accordance with GAAP. Adjusted EBITDA Margin is defined as Adjusted EBITDA
      expressed as a percentage of Revenue. YTD 2020 data based on latest publicly available data as of February 2021 and represents data through December 31, 2020 or September 30, 2020.
Investor Presentation Cactus, Inc. (NYSE: WHD) March 2021 - Cactus Wellhead
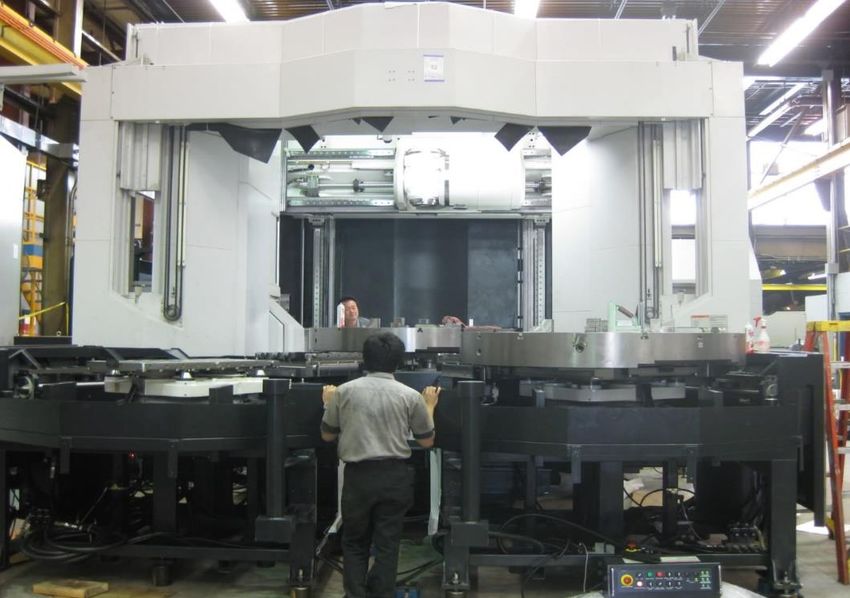
Cactus is Well Prepared for a Recovery
     Highlights                                                                       2017 Incremental EBITDA Margins(1)(2)

◼     Greater operating leverage
      provides benefits as activity levels
      increase                                                                                                                                           80%

◼     Incremental EBITDA margins were
      strong during the last market
      recovery (2017)

◼     Slower activity environment                                                                             45%
                                                                                                                                                                                                                                                43%
      provided opportunity to improve
      internal processes and provide
      solutions to issues faced by clients                                                                                                                                                          28%

◼     Cactus maintained and added key
      sales & engineering talent through
      the downturn

◼     Favorable changes in plant                                                                                                                                                                                                                                       (3)
      absorption costs anticipated as                                                                      Product                                     Rental                             Field Service &                         Total Adj. EBITDA
                                                                                                                                                                                               Other
      activity increases

                            Total Company Incremental Adjusted EBITDA Margins Over 40% in 2017(2)(3)

1.    The Appendix at the back of this presentation contains a reconciliation of EBITDA and Adjusted EBITDA to net income, the most comparable financial measure calculated in accordance with GAAP.
2.    Product, Rental and Field Service & Other incremental EBITDA margins represent annual change in category gross profit (excluding depreciation & amortization) divided by change in category revenue in 2017 versus 2016. Incremental Total Adj. EBITDA margin represents
      change in annual Adjusted EBITDA divided by change in annual revenue in 2017 versus 2016.
                                                                                                                                                                                                                                                                                 9
3.    Includes selling, general and administrative expenses.
Investor Presentation Cactus, Inc. (NYSE: WHD) March 2021 - Cactus Wellhead
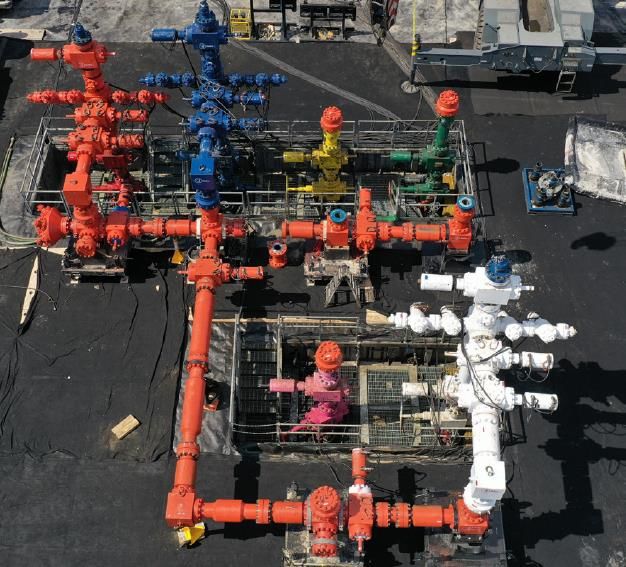
Technologically Advanced Pad Drilling Wellhead Systems
Cactus SafeDrill®                 SafeDrill® Advantages

                                          Safety                  Time Savings
                                   Fewer trips into            Eliminates time
                                    confined space (cellar)      consuming BOP
                                    -                            manipulation

                                   No BOP manipulation  No waiting on cement
                                    after intermediate           after running casing
                                    casing has been              strings
                                    installed                    -
Conventional Wellhead
                                   No “hot work” required  Mandrel hangers, pack
                                    to cut casing with torch     offs run and set through
                                                                 BOPs

                                                                                            10
Innovations Enhance Rental Business Value Proposition
    Complement & enhance legacy rental offerings without additional personnel
◼   Additional product introductions awaiting more constructive pricing environment
◼   Significantly reduce non-productive time (“NPT”) by increasing reliability and automation
◼   Increase safety and reduce costs by removing personnel from the exclusion zone
◼   SafeLinkTM
        ◼ Singular, continuous, compact & adaptable connection between missile and multiple frac trees

◼   SafeInject®
                                                                                               SafeClamp®
       ◼ Digital & remotely operated method to perform frac tree           SafeInject®
         maintenance and collect valuable data at wellsite
◼   SafeClamp®
       ◼ Reliable method to connect the wireline lubricator to the frac
         tree without the need for human intervention within the
         exclusion zone

                Legacy Setup                                SafeLinkTM

                                                                                                SafeLinkTM
                                                                                                             11
Differentiated Offerings Enable Customers to
Meet ESG Goals
Faster                                  Safer                                Cleaner
◼   Cactus enables customers to         ◼   Cactus’ equipment increases      ◼   In late-stage development of
    drill and complete wells faster         employee safety by enabling:         equipment allowing for:
◼   Translates to fewer rigs, frac           ◼   Automation of human-             ◼   Environmentally friendly
    crews & associated equipment                 performed connections                method for powering
◼   Lower operator emissions per             ◼   Routine tasks to be                  Cactus’ equipment and
    barrel of production                         performed remotely                   operations

◼   Reduced carbon intensity per             ◼   Fewer trips into                 ◼   Electric power generation
    well                                         underground cellars                  at the wellsite

     ◼   Fewer drilling days per well        ◼   No “hot work” required to        ◼   Reduced diesel usage

     ◼   More frac stages completed              cut casing with torch
         per day

                                                                                                                  12
Small Expenditures Can Have a Big Impact on Operators

     Cactus Value Proposition                     Components of Onshore Well Costs(1)

     ◼   Cactus offerings make up a
                                                              Other
         relatively small portion of the                      15%

         overall cost to drill & complete a
         well                                                                           Completion
                                                                                          54%

     ◼   Efficiency and reliability can cause
         a disproportionate amount of
         benefit for operators
                                                Drilling
                                                 29%
     ◼   Operators prioritize cost savings on
         larger ticket items

                                                        Cactus        Cactus
                                                       Products       Rentals
                                                          1%            1%

                                                                                                13
1)    Source: EIA and Management estimates.
Flexible and Scalable Operating Footprint
U.S. Operations
                                                                                United States
◼   Service centers support field services and provide repair
    services                                                        Bakken
                                                                                  Bossier City, Louisiana
                                                                     Powder       Manufacturing Facility
                                                                      River
◼   Spread across all key producing basins                            Basin                                  Marcellus

                                                                                                            Utica
◼   Flexible cost structure at branches & Bossier City           DJ / Niobrara
                                                                        SCOOP / STACK

                                                                 Delaware
    ◼   Ability to scale costs and right-size in real-time                      Barnett
                                                                      Midland        Haynesville

    ◼   Minimal maintenance capex required                              Eagle Ford
                                                                                          Gulf Coast

                                                                                            Manufacturing   Service Centers
                                                                                            Headquarters    Oil & Gas Basin

International Operations
                                                                  Australia
◼   Shipped first batch of Rental equipment to the Middle                                          China

    East in early 2021                                                                                                Suzhou, China
                                                                                                                    Manufacturing Facility

    ◼   Utilizing existing fleet of rental & support equipment
        and no near-term capital requirement for facilities
                                                                                 Middle East

◼   Australian operations predominantly natural gas focused

◼   Low fixed cost for Chinese manufacturing base limits
    impact from changes in activity levels
                                                                                                                                             14
A Dynamic Manufacturing Advantage; Responsive,
    Highly Scalable and Lower Cost
Responsive manufacturing in the U.S. supplemented by high volume production in China
Bossier City Facility                                                                                Suzhou Facility

◼ Rapid-response      manufacturing of equipment           ◼ Less   time-sensitive, high-volume wellhead equipment
     ◼ 5-axis   computer numerically controlled machines   ◼ Wholly   foreign owned enterprise (WFOE)
◼   “Just-in-time” product capabilities allow Cactus to    ◼ Continue to increase product types assembled and
    offer fast delivery time for parachute orders           tested in Suzhou
◼ No   large near-term capital needs following 2018
                                                           ◼ Low    cost of operation with low sensitivity to utilization
    expansion
◼ Cash    cost of operations is highly variable            ◼ Assessing    additional international sourcing

                   Highly Scalable and Low Fixed Cost Manufacturing Footprint
                                                                                                                            15
Experienced and Well Aligned Management Team with
Strong Industry Relationships
◼   Management team is well incentivized as it owns more than 25% of the business
          ◼   Over 80% of executive compensation deemed “at risk”
          ◼   Performance-based stock compensation tied to Return on Capital Employed (“ROCE”)
◼   Management team has built the foundation of this company over four decades
◼   Track record of building and successfully monetizing similar businesses                                                         Current

◼   Strength of leadership is attested by management and operating teams that joined from past
    ventures

 1959     1975                1980            1985             1990         1995           2000         2005              2010            2015

                                                                      ICC sold to
                                 Joel Bender                                                                        Scott Bender
                                                                      Cooper Cameron                                                      Cactus, Inc.
                                 appointed Vice                                                                     leaves WGPC
                                                                      Corporation                                                         IPO (2018)
                                 President of                                                                       (2010)
                                                                      (1996)
                                 CWE (1984)

              Scott Bender
              appointed
              President of              CWE Merges with Ingram
Cactus        Cactus                    Petroleum Services, forming            Scott and Joel                          WGPC
                                                                                                    Steven Bender                     Scott and          Cactus, Inc.
Pipe          Wellhead                  Ingram Cactus                          Bender appointed                        Sold to GE
                                                                                                    appointed                         Joel Bender        initiates
founded       Equipment                 Company (“ICC”)                        President and SVP,                      Oil and
                                                                                                    Rental                            found              regular
(1959)        (“CWE”), a                                                       respectively, of                        Gas (2011)
                                        ◼   Scott and Joel Bender                                   Business                          Cactus LLC         quarterly
              subsidiary of                 become President                   Wood Group                                             with 18 key
                                                                                                    Manager of                                           dividend
              Cactus Pipe                   and VP Operations,                 Pressure Control                                       managers
                                                                                                    WGPC (2005)                                          (2019)
              (1977)                        respectively, of                   (“WGPC”)                                               (2011)
                                            ICC (1986)

                                                                                                                                                                        16
Well Established Relationships with Recently
         Increasing Representation by Private Operators
     2020 Total Revenue by Customer Type                                                         2020 Product Revenue by Customer Type                                                      2020 Rental Revenue by Customer Type

                                        Other        Majors                                                                           Other         Majors                                                                       Other
                                         1%           7%                                                                               1%            3%                                               Private                     0%                       Majors
           Private                                                                                       Private
            19%                                                                                                                                                                                        18%                                                  19%
                                                                                                          20%

                                                                                                                                                                                            SMID
                                                                                                                                                                                            E&P
   SMID                                                                                                                                                                                      7%
   E&P                                                                                             SMID
    8%                                                                                             E&P
                                                                                                    9%

                                                                        Large                                                                                           Large                                                                                         Large
                                                                         E&P                                                                                             E&P                                                                                           E&P
                                                                         65%                                                                                             67%                                                                                           56%

           Majority of customer base represented by larger, well capitalized operators

Note: Cactus’ Field Service revenue driven by the Company’s Product & Rental activity. Large E&P represents exploration & production companies with market capitalization of over $2bn as of February 26, 2021 per FactSet. Majors include international oil companies that engage
                                                                                                                                                                                                                                                                                     17
in upstream and downstream activities
Recent Success With Private Operators
     Cactus’ Onshore Rigs Followed (Private Operators)(1)

                                                                                                                                                                                                                                      40

                                                                                                                                                                         30

                                                21
                                                                                                             18

                                        Q2 2020                                                     Q3 2020                                                      Q4 2020                                              QTD Q1 2021

            Cactus’ Onshore Rigs Followed with Private Operators Has More Than Doubled Since Q2 2020

Note: Private operators are firms that are not listed on a publicly traded stock exchange.
1.     The average number of active U.S. onshore rigs Cactus followed (which Cactus defines as the number of active U.S. onshore drilling rigs to which it was the primary provider of wellhead products and corresponding services during drilling) as of mid-month for each of the
                                                                                                                                                                                                                                                                                       18
       three months in the applicable quarter. Quarter-to-date 2021 represents the average of Cactus’ mid-momth rigs followed for January and February 2021.
Returns & Margins Have Outperformed Peers
 YTD 2020 Adjusted EBITDA
 Margin (%)
    40.0%

                                                                                                                                                                                                               (1)

    30.0%                                                     NCSM

                                                            SBO

    20.0%
                                                                                            FTI
                                                   OIS

                                                                       WEIR

                                      NOV
                                             FET
                                               HTG

    10.0%

                                                                                                                                                                                                                                      ROCE(2)
      0.0%                                                                             DRQ                                                                                                                                     (2016 – YTD 2020) (%)
         (10.0%)                                     0.0%                                 10.0%                                  20.0%                                  30.0%                                 40.0%

Source: Company filings and Factset.
Note: Adj. EBITDA Margins based on latest publicly available data as of February 2021. Cactus’ computation of Adjusted EBITDA may not be comparable to other similarly titled measures of other companies.
1)     Cactus EBIT = Adjusted EBITDA – depreciation and amortization. The Appendix at the back of this presentation contains a reconciliation of Adjusted EBITDA to net income, the most comparable financial measure calculated in accordance with GAAP.                  19
2)     ROCE reflects weighted average of 2016, 2017, 2018, 2019 and YTD 2020. ROCE = (Adj. EBITDA less D&A) / (Average of the subject year and preceding year capitalization including capital leases). ChampionX ROCE data represents legacy Apergy for 2015 – 2019 and
       ChampionX for 2020.
Execution Has Driven Equity Outperformance
       Share Price Performance of Cactus vs. the OSX since IPO

                                                                                     68%

                   0%

                                                                                                                                  (61%)

                                                                                   WHD                                            OSX

                          Cactus Share Price Outperformed the OSX in 2018, 2019 and 2020
Note: Data based on share price performance from 2/7/2018 to 2/26/2021.Cactus 2/7/2018 price set as IPO price of $19 per share.
                                                                                                                                          20
Source: Factset
History of Prudent Investment Strategy
       Goodwill, Intangible, Long-Lived & Other Asset Impairment Expenses ($mm) (2015 – YTD 2020)

                      ($mm)
                                                                     $10,597                     $7,661
                      $1,000

                         $750
                                                                                                                              $664
                                                                                                                                                        $648

                         $500

                         $250
                                                                                                                                                                                   $180
                                                                                                                                                                                                              $133

                                                                                                                                                                                                                                         $37
                                               $0
                             $-
                                             WHD                       Peer A                     Peer B                    Peer C                     Peer D                     Peer E                    Peer F                     Peer G

                        Cactus Has Recorded Zero Impairment Charges Through the Cycle
Note: Peers include: ChampionX, Dril-Quip, Core Labratories, DMC Global, National Oilwell Varco, Oil States International and TechnipFMC. ChampionX data represents legacy Apergy prior to merger. TechnipFMC financial data represents FMC Technologies from 2015-2016 and
TechnipFMC pro forma for the separation from Technip Energies from 2017 – September 30, 2020.
                                                                                                                                                                                                                                                                              21
Source: Company filings and annual reports.
Clean Balance Sheet & Low Capital Intensity
                                                                                                                                           Adjusted EBITDA(1) – Net Capital Expenditures(2) ($ in
                       Balance Sheet & Capital Summary                                                                                     millions)

       ◼    Year-end 2020 cash balance of approximately                                                                                                                                                                         $173.1
            $289 million
                                                                                                                                                                                                        $144.4

                     ◼     Cash balance grew by over $86 million
                                                                                                                                                                                                                                                        $102.9
                           during 2020 despite approximately $25
                                                                                                                                                                                $81.4
                           million in dividends and associated
                           distributions
                                                                                                                                                        $14.8
       ◼    Modest maintenance capex requirements
                                                                                                                                                         2016                    2017                    2018                    2019                    2020
       ◼    Full year 2021 net capital expenditure guidance
            of $10 million to $15 million                                                                                                  Net Capital Expenditures(2) ($ in millions)

       ◼    2021 capex driven by environmental-related                                                                                                                                                   $68.2
            enhancements of equipment, modest                                                                                                                                                                                    $55.9
            expansion at Bossier City manufacturing facility
            and general maintenance
                                                                                                                                                                                $30.7

                     ◼     Minimal capital outflows related to                                                                                          $17.4                                                                                            $18.1

                           international expansion efforts expected
                           in 2021                                                                                                                       2016                    2017                    2018                    2019                     2020

                                Strong balance sheet with track record of cash flow generation
Source: Company filings.
1)    EBITDA and Adjusted EBITDA are non-GAAP financial measures. Cactus defines Adjusted EBITDA as EBITDA excluding (gain) loss on debt extinguishment, stock-based compensation, non-cash adjustments for the revaluation of the liability related to the tax receivable   22
      agreement, and equity offering expenses. The Appendix at the back of this presentation contains a reconciliation of EBITDA and Adjusted EBITDA to net income, the most comparable financial measure calculated in accordance with GAAP.
2)    Net Capital Expenditures equals net cash flows from investing activities.
Recent Performance & Outlook
     Fourth Quarter 2020 Performance
     ◼   Grew revenues by 14% sequentially

     ◼   Generated Adjusted EBITDA margins of 29%

     ◼   Increased Product market share(1) to 43%

     ◼   Generated over $20 million in free cash flow(2)

     Outlook & Recent Developments
     ◼   Q1 2021 revenues expected to improve approximately 20%
         sequentially with Rental revenues expected to be up over
         40% sequentially (inclusive of the impact from winter storms)
     ◼   Rigs followed anticipated to be up approximately 25% in Q1
         2021
     ◼   Shipped first batch of equipment into the Middle East early in
         2021
          ◼     Currently evaluating the shipment of additional equipment
                into the region
          ◼     Platform for further growth

1)   Represents the average number of active U.S. onshore rigs Cactus followed (which Cactus defines as the number of active U.S. onshore drilling rigs to which it was the primary provider of wellhead products and corresponding services during drilling) as of mid-   23
     month for each of the three months in the applicable quarter divided by the Baker Hughes U.S. onshore rig count quarterly ave rage.
2)   Free cash flow defined as cash flow from operating activities less cash flow from investing activities less distributions to members not associated with dividends paid to Class A common shareholders.
Positive Developments with Limited Capital Required

◼   Product
       ◼   Continued increases in rig efficiency as operators
           improve processes (more wells drilled per rig)
◼   Rental
       ◼   Rental innovations potentially drive market share
           gains
       ◼   Introduction of additional completion technologies
           currently in development
       ◼   Buildout of environmental-friendly capabilities
           differentiates vs. competition and comes at limited
           cost
◼   International
       ◼   Shipped first batch of rental equipment into the
           Middle East in early 2021
       ◼   Currently evaluating shipment of additional
           equipment
       ◼   Able to re-deploy existing assets in order to limit
           capex requirements

                                                                 24
Cactus Is Committed to ESG
                                  Environmental                                                                                   Social
          ◼    Cactus, Inc. is committed to reducing its impact on the                  ◼      Cactus, Inc. is dedicated to improving lives and protecting human
               environment. We will continue to strive to improve our                          rights. We seek to make the world a better place by encouraging
               environmental performance over time and to initiate projects and                fairness, equal opportunity and human dignity.
               activities that will further reduce our impact on the environment.

                                         ◼   All manufacturing facilities API
                                             and ISO 9001 certified to
                                             ensure the highest level of
                                             quality and safety

                                         ◼   Products & equipment reduce
                                             the need for personnel and
                                             equipment at the well site and
                                             oil & activities’ impact on the
                                             environment

                                                                                Governance
                                                                                                                                           2020 CEO Target Pay Mix
        ◼     Our board of directors believes that sound governance                             Independent Directors
              practices and policies provide an important framework to              6

                                                                                                                                                       Base Salary
              assist it in fulfilling its duty to stockholders                                                                                            14%

                                                                                    5
                                                                                                                                                             STI Target
                                                                                                                                                               14%
        ◼     Bylaws recently amended to permit Eligible Stockholders
              to make nominations for election to the Board and to have             4
                                                                                                                                                 LTI
                                                                                                                                                72%

              those nominations included in the Company's proxy
              materials under certain circumstances                                 3
                                                                                            At IPO                      Current                    86% at risk

                                                                                                                                                                          25
Source: Company filings.
Strong & Improving Track Record of Safety
HSE Highlights                                   Total Recordable Incident Rate

◼   Comprehensive and formal company-
                                                  2.0
    wide HSE management program for the
    safety of Associates

◼   Committed to the well-being and
    protection of individuals at all field and
    company locations

◼   Adhere to our own strict safety
    standards as well as those of our valued
    customers, minimizing risks of                1.0

    incidents on projects worldwide

                                                  0.0
                                                         2016      2017       2018   2019   2020

                                                                                                   26
Appendix
Company Organizational Structure
     Company Profile                                                                                        Organizational Structure(1)

        Ticker                                                                                 WHD (NYSE)
        Class A Shares Outstanding(1)                                                          47.9mm
                                                                                                                        CW Unit                                           Public
        Class B Shares Outstanding(1)                                                          27.7mm                   Holders                                         Investors
        Total Shares Outstanding(1)                                                            75.5mm
        Market Capitalization(2)                                                               ~$2.4bn                            Class B Common Stock     Class A Common Stock
                                                                                                                                   (36.6% voting power)     (63.4% voting power)

        Finance Lease Obligations(3)                                                           $6.1mm
                                                                                                                                               Cactus, Inc.
        Cash and Cash Equivalents(3)                                                           $288.7mm
                                                                                                                                              (NYSE: WHD)
        Quarterly Dividend Per Share                                                           $0.09
                                                                                                                       27.7mm CW Units           47.9mm CW Units
        Annual Dividend Yield(2)                                                               1.1%                 (36.6% economic rights)   (63.4% economic rights)

                                                                                                                                        Cactus Wellhead, LLC
     Ownership Profile(4)
                                                                                                                                        (operating subsidiary)
                                Cadent Energy
                                  Partners
                                    11%                                                                                                               100%

                 Management &                                                                                                                  Subsidiaries
                  Employees
                     26%
                                                                                   Public Float
                                                                                      63%

                                    Class A & Class B Shareholders Have Equal Voting Rights
Source: Company filings.
1.    As of February 23, 2021. Excludes effect of dilutive securities.
2.    As of February 26, 2021. Market capitalization utilizes total shares outstanding.                                                                                             28
3.    As of December 31, 2020.
4.    As of February 23, 2021. Management and employees made up of Cactus WH Enterprises and Lee Boquet.
Cactus Equipment Positioned on a Multi-Well Pad

                                                                                                                                                                            1

                                                                                                      2            3
                     4

                                                                                                                                                        1

                                                                                                                                         4

                                                3

                                                                                                                                                                            1
       1           Product Sold                              2       Equipment Rented                     3    Equipment Rented              4    Services Provided

       ▪ Wellheads are required                              ▪ Frac stacks are                            ▪ Zipper manifolds, mono-          ▪ Assist with the
         by each well over                                     connected to the                             bore flowline and remote           installation, maintenance
         production life                                       wellhead for the                             greasing units used                and handling of the
                                                               fracturing phase                             during the fracturing              wellhead and pressure
       ▪ One of the first pieces                               of a well                                    process                            control equipment
         of equipment to
         be installed                                        ▪ Must reliably withstand                    ▪ Allow fracing to                 ▪ Variety of equipment to
                                                               all liquids and proppants                    seamlessly shift from well         install and service, such
       ▪ Cactus wellheads                                      that are pumped                              to well while reducing             as high-pressure flow
         installed below surface                               downhole                                     connections for high-              iron, closing units, crane
       ▪ Production trees installed                            to fracture                                  pressure equipment                 trucks and testing units
         on the wellhead after the
         frac stacks are removed

Note: Cactus equipment shown not inclusive of all Rental innovations described on preceding slides.                                                                             29
Non-GAAP Reconciliation
Important Disclosure Regarding Non-GAAP Measures

EBITDA and Adjusted EBITDA are not measures calculated in accordance with GAAP. EBITDA and Adjusted EBITDA are supplemental non-GAAP financial measures that are used by
management and external users of our consolidated financial statements, such as industry analysts, investors, lenders and rating agencies. We define EBITDA as net income excluding net
interest, income tax and depreciation and amortization. We define Adjusted EBITDA as EBITDA excluding severance expenses, revaluation of tax receivable agreement, (gain) loss on debt
extinguishment, stock-based compensation, and equity offering expenses. We define Adjusted EBITDA Margin as Adjusted EBITDA as a percentage of Revenue.

Our management believes EBITDA and Adjusted EBITDA are useful, because they allow management to more effectively evaluate our operating performance and compare the results of our
operations from period to period without regard to financing methods or capital structure, or other items that impact comparability of financial results from period to period. EBITDA and
Adjusted EBITDA should not be considered as alternatives to, or more meaningful than, net income or any other measure as determined in accordance with GAAP. Our computations of
EBITDA and Adjusted EBITDA may not be comparable to other similarly titled measures of other companies. We present EBITDA and Adjusted EBITDA because we believe they provide
useful information regarding the factors and trends affecting our business.

                                                                                                           Year Ended
($ in thousands)                                                                                          December 31,
                                                            2020                 2019                 2018            2017                      2016                  2015
Net income (loss)                                              $59,215             $156,303             $150,281         $66,547                   ($8,176)              $21,224
Interest (income) expense, net                                    (701)                (879)               3,595          20,767                    20,233                21,837
Income tax expense                                              10,970               32,020               19,520           1,549                       809                   784
EBIT                                                            69,484              187,444              173,396          88,863                    12,866                43,845
Depreciation and amortization                                   40,520               38,854               30,153          23,271                    21,241                20,580
EBITDA                                                        $110,004             $226,298             $203,549        $112,134                   $34,107               $64,425
Severance expenses                                               1,864                    -                    -               -                         -                     -
Revaluation of tax receivable agreement liability                  555               (5,336)                   -               -                         -                     -
Secondary offering related expenses                                  -                1,042                    -               -                         -                     -
(Gain) loss on debt extinguishment                                   -                    -                4,305               -                    (2,251)               (1,640)
Stock-based compensation                                         8,599                6,995                4,704               -                       361                   359
Adjusted EBITDA                                               $121,022             $228,999             $212,558        $112,134                   $32,217               $63,144

Revenue                                                       $348,566             $628,414             $544,135             $341,191             $155,048              $221,395
Adjusted EBITDA Margin                                          34.7%                36.4%                39.1%                32.9%                20.8%                 28.5%

                                                                                                                                                                                       30
Non-GAAP Reconciliation
Important Disclosure Regarding Non-GAAP Measures

EBITDA and Adjusted EBITDA are not measures calculated in accordance with GAAP. EBITDA and Adjusted EBITDA are supplemental non-GAAP financial measures that are used by
management and external users of our consolidated financial statements, such as industry analysts, investors, lenders and rating agencies. We define EBITDA as net income excluding net
interest, income tax and depreciation and amortization. We define Adjusted EBITDA as EBITDA excluding severance expenses, revaluation of tax receivable agreement, (gain) loss on debt
extinguishment, stock-based compensation, and equity offering expenses. We define Adjusted EBITDA Margin as Adjusted EBITDA as a percentage of Revenue.

Our management believes EBITDA and Adjusted EBITDA are useful, because they allow management to more effectively evaluate our operating performance and compare the results of our
operations from period to period without regard to financing methods or capital structure, or other items that impact comparability of financial results from period to period. EBITDA and
Adjusted EBITDA should not be considered as alternatives to, or more meaningful than, net income or any other measure as determined in accordance with GAAP. Our computations of
EBITDA and Adjusted EBITDA may not be comparable to other similarly titled measures of other companies. We present EBITDA and Adjusted EBITDA because we believe they provide
useful information regarding the factors and trends affecting our business.
                                                                                                                          Year Ended
                               ($ in thousands)                                                                          December 31,
                                                                                                                     2017            2016
                               Revenues
                                Product revenue                                                                        $189,091             $77,739
                                Rental revenue                                                                           77,469              44,372
                                Field service and other revenue                                                          74,631              32,937
                                  Total revenues                                                                       $341,191            $155,048

                               Costs and expenses
                                 Cost of product revenue                                                               $124,030             $62,766
                                 Cost of rental revenue                                                                  40,519              33,990
                                 Cost of field service and other revenue                                                 60,602              28,470
                                 Selling, general and administrative expenses                                            27,177              19,207
                                   Total costs and expenses                                                            $252,328            $144,433
                               Income from operations                                                                   $88,863             $10,615
                               Depreciation and amortization
                                Product depreciation and amortization                                                    $3,169               $2,869
                                Rental depreciation and amortization                                                     14,912               15,121
                                Field service and other depreciation and amortization                                     4,786                2,659
                                Selling, general and administrative expense depreciation and amortization                   404                  592
                                  Total depreciation and amortization                                                   $23,271              $21,241

                               EBITDA
                                 Product EBITDA                                                                         $68,230              $17,842
                                 Rental EBITDA                                                                           51,862               25,503
                                 Field Service EBITDA                                                                    18,815                7,126
                                 Selling, general and administrative expense EBITDA                                     (26,773)             (18,615)
                                 Gain on debt extinguishment                                                                  -                2,251
                                   Total EBITDA                                                                        $112,134              $34,107
                                 Gain on debt extinguishment                                                                  -               (2,251)
                                 Stock-based compensation                                                                     -                  361
                               Total Adjusted EBITDA                                                                   $112,134              $32,217
                                                                                                                                                                                       31
Investor Relations Contact

            John Fitzgerald
Director of Corporate Development &
          Investor Relations
             713-904-4655
        IR@CactusWHD.com

                                      32
You can also read