Embassy Office Parks REIT - 1Q FY2020 Investor Materials August 12, 2019
←
→
Page content transcription
If your browser does not render page correctly, please read the page content below

Embassy Office Parks REIT
1Q FY2020 Investor Materials
August 12, 2019

                               1
1Q FY2020 Investor Materials

Disclaimer
This presentation is prepared for Unitholders and issued by Embassy Office Parks Management Services Private Limited (the “Manager”) in its capacity as the Manager of the Embassy
Office Parks REIT (“Embassy REIT”), for general information purposes only, without regards to the specific objectives, financial situation or requirements of any person. This presentation
may not be copied, published, distributed or transmitted, in whole or in part, for any purpose, and should not be construed as legal, tax, investment or other advice.
This presentation does not constitute a prospectus, placement document, offering circular or offering memorandum and is not an offer or invitation or recommendation or solicitation or
inducement to buy or sell any securities including any securities of: (i) the Embassy REIT, its holdcos, SPVs and investment entities; or (ii) its Sponsors or any of the subsidiaries of the
Sponsors, nor shall part, or all, of this presentation form the basis of, or be relied on, in connection with, any contract or investment decision in relation to any securities.
Unless otherwise stated in this presentation, the information contained herein is based on management information and estimates. The information contained herein is only current as of its
date, has not been independently verified and may be subject to change without notice. Please note that the recipient will not be updated in the event the information in the presentation
becomes stale, and that past performance is not indicative of future results. The Manager assumes no responsibility to publicly amend, modify or revise any forward-looking statements,
based on any subsequent development, information or events, or otherwise. The Manager, as such, makes no representation or warranty, express or implied, as to, and does not accept
any responsibility or liability with respect to, the fairness, accuracy, completeness or correctness of the content of this presentation including any information or opinions contained herein.
Any opinions expressed in this presentation or the contents of this presentation are subject to change without notice. Neither the delivery of this presentation nor any further discussions of
the Manager with any of the recipients shall, under any circumstances, create any implication that there has been no change in the affairs of the Embassy REIT since the date of this
presentation.
This presentation contains forward-looking statements based on the currently held beliefs, opinions and assumptions of the Manager. Forward-looking statements involve known and
unknown risks, uncertainties and other factors, which may cause the actual results, financial condition, performance, or achievements of the Embassy REIT or industry results, to differ
materially from the results, financial condition, performance or achievements expressed or implied by such forward-looking statements. Given these risks, uncertainties and other factors,
recipients of this presentation are cautioned not to place undue reliance on these forward-looking statements. The Manager disclaims any obligation to update these forward-looking
statements to reflect future events or developments. In addition to statements which are forward looking by reason of context, the words ‘may’, ‘will’, ‘should’, ‘expects’, ‘plans’, ‘intends’,
‘anticipates’, ‘believes’, ‘estimates’, ‘predicts’, ‘potential’ or ‘continue’ and similar expressions identify forward-looking statements.
By reading this presentation the recipient acknowledges that the recipient will be solely responsible for its own assessment of the market and the market position of the Embassy REIT and
that the recipient will conduct its own analysis and be solely responsible for forming its own view of the potential future performance of the business of the Embassy REIT. This presentation
may not be all inclusive and may not contain all of the information that the recipient considers material. The distribution of this presentation in certain jurisdictions may be restricted by law.
Accordingly, any persons in possession of this presentation should inform themselves about and observe any such restrictions.
None of the Embassy REIT, the Manager, the Sponsors of the Trustee or any of their respective affiliates, advisers or representatives accept any liability whatsoever for any loss howsoever
arising from any information presented or contained in this presentation. Furthermore, no person is authorized to give any information or make any representation which is not contained in,
or is inconsistent with, this presentation. Any such extraneous or inconsistent information or representation, if given or made, should not be relied upon as having being authorized by or on
behalf of Embassy REIT, its holdcos, SPVs and investment entities or the Manager. Investors are advised to consult their investment advisor before making an investment decision.
The comparative quarterly financial information included herein is being presented to provide investors with a general overview of the Embassy REIT’s performance in 1Q FY2020 as
compared, in the manner determined by the Manager, against 1Q FY2019 on the basis of certain key parameters for general information purposes only and does not purport to present a
comprehensive representation of the financial performance of the Embassy REIT for these periods. The Embassy REIT, the Trustee and the Manager make no representation, express or
implied, as to the suitability or appropriateness of this comparative information to any Investor or to any other person. This information should not be used or considered as financial or
investment advice, a recommendation or an offer to sell, or a solicitation of any offer to buy any Units of the Embassy REIT.
The comparative quarterly financial information has been prepared by the Manager, in the manner determined by the Manager, and has not been subjected to limited review or audit by the
statutory auditors of the Embassy REIT. While the Manager has exercised reasonable diligence in the preparation of this comparative quarterly financial information, and in the Manager’s
view, this comparative quarterly financial information provides a reasonable scheme of reference for Investors with respect to the key parameters chosen by the Manager, investors are
requested to not place undue reliance upon such information and to not regard such information as an indication of future trends or guarantee of future performance..
Investors should also take note that Embassy REIT was listed on April 1, 2019 and the Embassy REIT assets were acquired between March 22, 2019 and March 25, 2019. Accordingly, the
comparative quarterly financial information has been prepared by comparing, in the manner determined by the Manager as referenced above, combined unaudited financial statements for
1Q FY2019 (assuming that the Embassy REIT held the Embassy REIT assets in its present form during 1Q FY2019) as against consolidated reviewed condensed financial information for
1Q FY2020.
THIS PRESENTATION DOES NOT CONSTITUTE OR FORM ANY PART OF ANY OFFER, INVITATION OR RECOMMENDATION TO PURCHASE OR SUBSCRIBE FOR ANY
SECURITIES IN THE UNITED STATES OR ELSEWHERE.

                                                                                                                                                                                          2
1Q FY2020 Investor Materials

Table of Contents
 I.            Key Highlights             4

 II.           Overview                   9

 III.          Market Outlook             17

 IV.           Commercial Office Update   22

 V.            Development Update         26

 VI.           Hospitality Update         31

 VII.          Financial Update           34

 VIII.         Other Updates              39

 IX.           Looking Ahead              44

 X.            Appendix                   46

                                               3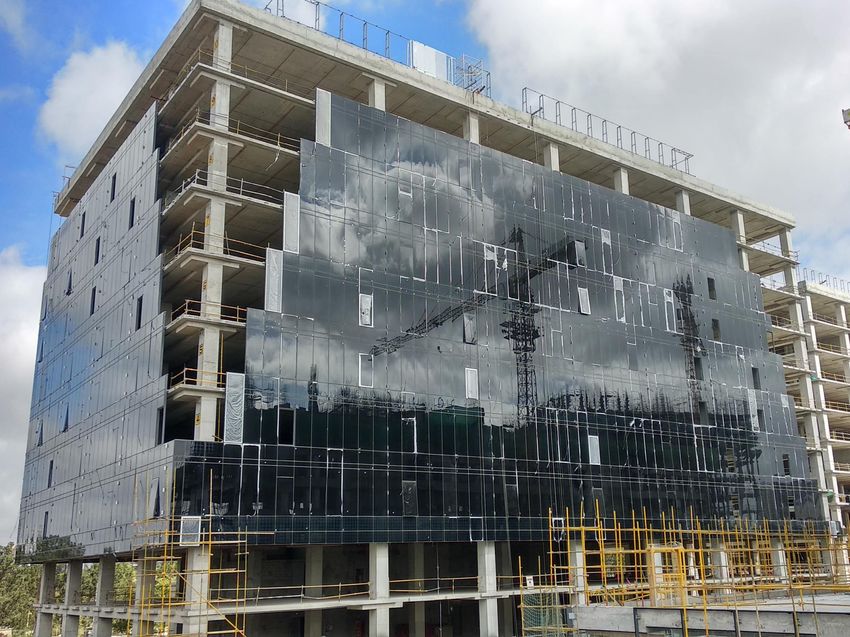
1Q FY2020 Investor Materials

I. Key Highlights

Embassy Manyata, Bengaluru
1Q FY2020 Investor Materials
I. Key Highlights
Listing Highlights
Listing of Embassy REIT was a landmark transaction and first of its kind in India
Key Transaction Highlights
First REIT to list on Indian stock exchanges
Largest REIT in Asia by square footage (c.33 msf total portfolio area)
Initial Public Offering
₹47,500 mn Strong Sponsor commitment; no sell-down in IPO
Listed Strong endorsement by international and domestic investors
April 1, 2019
Transaction 2.6x subscribed; 3.1x on Non-Institutional portion
Ticker:
NSE: EMBASSY
BSE: 542602 Priced against backdrop of global equity volatility and Indian
elections
Key Metrics
Issue price per Unit at listing (₹)(1) 300 Use of issue proceeds of ₹47,500 mn(1):
Market Cap at listing (₹ mn)(2) 231,500 o Repay Existing Debt – ₹37,100 mn
o Acquisition of Embassy One Assets – ₹4,682 mn
Price as at end of 1Q FY2020 (₹)(3) 367
o General Corporate Purposes – ₹3,918 mn
Performance as at end of 1Q FY2020(3) 22.3%
o Issue Expenses – ₹1,800 mn
(3)
Market Cap as at end of 1Q FY2020 (₹ mn) 283,101
Notes:
(1) Based on ‘Final Offer Document’ dated March 27, 2019 5
(2) Market Capitalization upon listing on April 1, 2019
(3) Computed as of June 28, 2019
1Q FY2020 Investor Materials
I. Key Highlights
Business Highlights
Robust leasing, timely execution of near-term development projects and active asset management has
driven strong performance in 1Q FY2020
94.3% occupancy on 24.8 msf completed commercial office portfolio
595k sf new lease-up, including 50.6% re-leasing spreads on 572k sf area re-leased
Leasing
226k sf renewals at 28.5% renewal spreads
500k sf strong leasing pipeline across technology, healthcare, consulting & research sectors
1.4 msf near-term development projects at Embassy Manyata & Embassy Oxygen
‒ Both these projects 2 quarters ahead of targeted delivery
Development
42% or 246k sf of 0.6 msf U/C Tower 2 at Embassy Oxygen pre-let to MetLife(1)
1.9 msf medium-term developments under various stages of design, excavation & pre-construction
230 keys Four Seasons Hotel at Embassy One launched in May’2019
Hospitality
619 keys Hilton hotels at Embassy Manyata under development with target completion of 3Q FY2022
220 KVA sub-station at Embassy Manyata commissioned
Asset Management / Flyover and Master-plan upgrade works underway at Embassy Manyata
Sustainability
‘Energize’ Tenant engagement programs conducted across portfolio
100 MW green energy initiative, to offset an estimated 200mn kg of CO2 annually(2)
Notes:
(1) Excludes 45k sf growth option. Factoring the growth option, area pre-let at Embassy Oxygen would be 50%. These options are exercisable till Jun’2021 6
(2) Indicative based on “CO2 baseline database for the Indian power sector June 2018” and assuming 215 mn units generation p.a.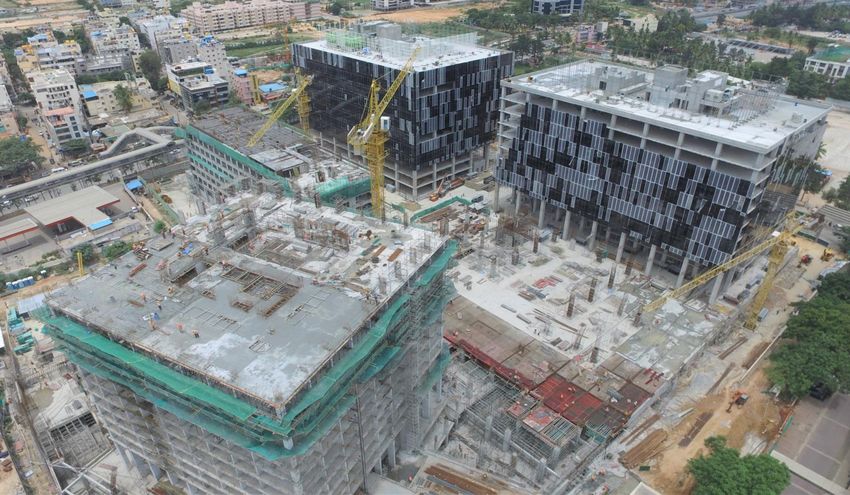
1Q FY2020 Investor Materials
I. Key Highlights
Financial Highlights
Healthy Revenue from Operations and NOI for 1Q FY2020 – both higher by 19% YoY
1Q FY2020 1Q FY2019
Remarks
(mn)(1) (mn)(2) Variance %
Lease-up of 1.4 msf vacancy across Embassy Manyata,
Revenue FIFC, Embassy 247 & others
from ₹5,351 ₹4,494 +19% Ramp-up in solar power generation at Embassy Energy; and
Operations Pre-lease of recently delivered 0.5 msf Tower 3 at Embassy
Oxygen
NOI ₹4,528 ₹3,818
NOI increase in-line with increase in Revenue from
+19%
Operations
Margin (%) 85% 85%
Higher one-off interest income in 1Q FY2019 (previous year)
EBITDA ₹4,369 ₹3,938 due to inter-corporate deposits(3)
+11%
Margin (%) 82% 88% Adjusted for this one-off item, EBITDA margin for 1Q
FY2019 was c.81%; in-line with 1Q FY2020
Distribution ₹4,167 – Distribution of ₹4,167 mn for 1Q FY2020 represents a
NA
payout ratio of 99.7% to NDCF at REIT level
Payout ratio 99.7% –
Notes: Above results exclude Revenue, NOI and EBITDA from Embassy Golflinks since our stake is 50%. Embassy Golflinks revenue is ₹957 mn and EBITDA is ₹847 mn for 1Q FY2020
(1) Figures for 1Q FY2020 are basis unaudited consolidated financials 7
(2) Figures for 1Q FY2019 are basis unaudited combined financials and may not be comparable. For further details refer notes on slide 50
(3) Refers to inter corporate deposits to related parties in FY2019 which were repaid fully in Mar’2019 prior to listing
1Q FY2020 Investor Materials
I. Key Highlights

Distribution Overview
 Distribution for 1Q FY2020 stood at ₹4,167 mn i.e. ₹5.4 per unit with scheduled payment date on or
 before August 27, 2019

                                      Distribution schedule for 1Q FY2020

 Distribution for the period                                            April 1, 2019 – June 30, 2019

 Distribution amount                                                             ₹4,167 mn

 Outstanding units                                                              771,665,343

 Distribution per unit                                                             ₹5.40

   - Interest                                                                      ₹2.30

   - Amortization of SPV level debt                                                ₹3.10

   - Dividend                                                                        -

 Ex-date                                                                      August 12, 2019

 Record date                                                                  August 21, 2019

 Payment date                                                           On or before August 27, 2019

                                                                                                        8
1Q FY2020 Investor Materials

II. Overview

Embassy Techzone, Pune

1Q FY2020 Investor Materials
II. Overview

Who We Are: Quick Facts
  We run a commercial office portfolio that serves as essential corporate infrastructure to multinational
  tenants

       33 msf(1)                                     160+                                  94.3%
          Portfolio                                Blue-chip                             Occupancy
                                                    tenants
                                                                                                                  Noida (9%)

                11                                   1,096                               100 MW
       Commercial                                 Hotel Keys                              Solar Park
         Offices

                                                                                                       Mumbai (16%)

             31%                                      43%                                7 Years
                                                                                                             Pune (14%)
    Mark-to-Market                              Gross Rents                                   WALE
       Upside                                   from Fortune
                                                 500 Clients

                                                                                                                      Bengaluru (61%)

     ₹5,351 mn                                ₹4,167 mn                                       11%
      1Q FY2020                                  1Q FY2020                               Net Debt to
     Revenue from                                Distribution                               TEV
      operations
Notes: City wise split by % of GAV as per CBRE Mar’19 valuation. Valuation undertaken semi-annually
(1)   Includes completed, under construction & proposed future development                                                              10
1Q FY2020 Investor Materials II. Overview Seven Infrastructure-like Office Parks (30.4 msf)(1) Embassy Manyata Embassy Quadron Bengaluru (14.2 msf) Pune (1.9 msf) Embassy Golflinks Embassy Techzone Bengaluru (2.7 msf) Pune (5.5 msf) Embassy Oxygen Embassy Galaxy Embassy Qubix Noida (3.3 msf) Noida (1.4 msf) Pune (1.5 msf) Notes: (1) Includes completed, under construction & proposed future development 11
1Q FY2020 Investor Materials
II. Overview

Four Prime City-center Offices (2.3 msf)
Express Towers                 FIFC
Mumbai (0.5 msf)               Mumbai (0.4 msf)

                               Embassy 247        Embassy One
                               Mumbai (1.2 msf)   Bengaluru (0.3 msf)

                                                                        12
1Q FY2020 Investor Materials
II. Overview
What We Do: Our Strategy
Maximize distributions and NAV per unit through organic growth & new acquisitions
4
Prudent Capital
Management
3
First-mover Acquisition Build leverage
Advantage selectively
2
Use strong balance
Deliver on Development 42.8 msf of ROFO
1 sheet to drive accretive
opportunity from
growth through
Embassy Sponsor
Powerhouse Leasing Deliver 7.9 msf on-
disciplined acquisitions
campus development Pan-India acquisitions
Quarterly distributions
potential from 3rd parties
with minimum 90% of
94.3% occupancy Proactive pre-leasing
Capitalize on NDCF to be distributed
across portfolio strategy to de-risk new
development fragmented office
Low expenses and fees
Experienced on-ground market
Select infrastructure
enhancing Unitholders’
teams & hands-on
upgrade and execute value
approach to leasing
ancillary projects
Consistently deliver (hotels, flyovers etc.) to
mark-to-market upside increase entry barriers
Best-in-class tenant Provide total business
engagement ecosystem
Proactive asset management to drive value with strong corporate governance
131Q FY2020 Investor Materials
II. Overview
Our Opportunity: India as the Global Technology Innovation Hub
India continues to attract global corporations for large scale services operations due to availability of
abundant talent and cost savings; thereby leading to continued strong office demand
Indian IT-BPM Landscape – Foundation of Global Technology(1)(2) Space Occupied by Technology Sector (msf)(3)
Services $177 bn
• Information Technology • Engineering R&D (6.1% growth)
331
• BPM • Digital
Revenue
Software $136 bn
• Systems • Cybersecurity (8.3% growth)
• Enterprise • Fintech /Edtech Exports
Indian eCommerce ₹2.9 tn
• Social Shopping • Intelligence (7.9% growth)
• Voice Commerce • Digital Payments
Domestic
37
Technologies 4.14 mn
• Cloud / Robotics • Blockchain (4.3% growth)
CY2000 CY2019F
• Intelligent Automation • Reality AR/VR
Employees
Global Capability Centres (GCCs) are increasingly leveraging India for shared services specific to IT, F&A, HR & Procurement
With over 1,250 GCCs, demand from GCC across six major Indian cities is estimated at c.30-35 msf between CY2019-21
Indian IT / ITeS services turning towards leasing vs. owning. Sharp rise in IT / ITeS hiring, c.4-5%(4) p.a. growth in CY2019-22
Source:
(1) Nasscom IT-BPM Sector in India 2019 (Decoding Digital) 14
(2) Colliers International Information Technology Office Services May 2019 Report (‘India – Reinventing the World’s Tech Disclosure’)
(3) CBRE Research 2019, Embassy REIT
(4) Bank of America Merrill Lynch Research Jun’2019, Embassy REIT1Q FY2020 Investor Materials
II. Overview
Our Tenant Base
Global business with a diversified portfolio across established & growth sectors
Industry Diversification(1) 41% of Gross Rentals Originate From Top 10 Tenants
Others
10% Top 10 % of
Sector
Tenants Rentals
Research, Technology
Consulting & 49%
Analytics IBM Technology 13%
9%
Cognizant Technology 10%
Cerner Healthcare 3%
NTT Data Technology 3%
Research, Consulting &
PwC 2%
Analytics
Financial NOKIA Telecom 2%
Services
13%
J.P. Morgan JP Morgan Financial Services 2%
DHL KPMG Lowe's Retail 2%
McAfee Technology 2%
Healthcare
6% DBS Financial Services 2%
Total 41%
Telecom
5%
Retail
8%
Notes:
(1) Represents industry diversification percentages based on Embassy REIT’s share of gross rentals 151Q FY2020 Investor Materials
II. Overview
Our Portfolio Summary
25 msf Portfolio of Grade A office assets (94.3% occupied, 7 years WALE and 31% MTM opportunity)
Leasable Area (msf)/Keys/MW WALE(3) Occupancy Rent (₹ psf / mth) GAV(4)
Property Completed Development Total (yrs) (%) In-place Market(4) MTM (%) ₹ mn % of total
Embassy Manyata 11.0 3.3 14.2 7.6 99.3% 56 83 47.9% 132,813 42%
(1)
Embassy Golflinks 2.7 - 2.7 8.2 100.0% 108 146 35.3% 26,174 8%
Embassy One 0.3 - 0.3 9.5 2.0% 150 153 2.0% 5,972 2%
Bengaluru Sub-total 14.0 3.3 17.2 7.8 97.7% 66 95 43.7% 164,960 52%
Express Towers 0.5 - 0.5 5.5 96.7% 253 275 8.9% 18,849 6%
Embassy 247 1.2 - 1.2 4.2 91.6% 98 104 6.1% 17,323 5%
FIFC 0.4 - 0.4 4.4 60.8% 293 285 (2.9%) 14,957 5%
Mumbai Sub-total 2.0 - 2.0 4.7 87.2% 162 171 5.2% 51,129 16%
Embassy Techzone 2.2 3.3 5.5 6.1 78.1% 52 48 (7.7%) 20,586 7%
Embassy Quadron 1.9 - 1.9 5.9 91.4% 41 50 22.3% 14,610 5%
Embassy Qubix 1.5 - 1.5 5.4 100.0% 37 48 29.5% 10,253 3%
Pune Sub-total 5.5 3.3 8.8 5.8 88.4% 44 49 11.7% 45,449 14%
Embassy Oxygen 1.9 1.3 3.3 10.0 89.2% 44 54 22.3% 19,938 6%
Embassy Galaxy 1.4 - 1.4 3.8 100.0% 31 44 39.8% 8,478 3%
Noida Sub-total 3.3 1.3 4.6 7.8 93.6% 39 50 28.6% 28,416 9%
Subtotal (Office) 24.8 7.9 32.7 7.0 94.3% 65 85 30.9% 289,954 92%
Four Seasons at Embassy One (2) 230 Keys - 230 Keys - 3.8% (5) - - - 7,983 3%
(5)
Hilton at Embassy Golflinks 247 Keys - 247 Keys - 70.2% - - - 4,824 2%
Hilton at Embassy
- 619 Keys 619 Keys - - - - - 2,581 1%
Manyata (5 & 3 star)
Embassy Energy 100MW - 100MW - - - - - 10,782 3%
Subtotal (Infrastructure Assets) 477 Keys / 100MW 619 Keys 1096 Keys / 100MW 26,170 8%
24.8 msf / 477 Keys 32.7 msf / 1096
Total 7.9 msf / 619 Keys 316,124 100%
/ 100MW Keys / 100MW
Notes:
(1) Details included in the above table are for a 100% stake in Embassy Golflinks, except GAV which reflects only our 50% economic interest
(2) Launched in May’2019
(3) Weighted against Gross Rentals assuming tenants exercise their renewal options after the end of the initial commitment period 16
(4) As per CBRE valuation March 31, 2019, valuation undertaken semi-annually; Embassy Golflinks is based on 50% economic interest
(5) Average for 1Q FY2020 / average since launch in May’20191Q FY2020 Investor Materials III. Market Outlook Embassy One, Bengaluru
1Q FY2020 Investor Materials
III. Market Outlook

Commercial Office Fundamentals
 Strong demand-supply fundamentals resulting in robust demand and low vacancy across our four
 office markets

                                                                                                                                           34.7
                                                                                                                                                  31.9   32.4
                                            30.4                                                                                                                30.7
                                                                                       29.6
                        26.9                                                                                               27.5
                                                       26.4
                                                                                                                                  24.5
             22.5                                                          21.9                            21.8     22.1

                       19.2                          18.6
                                                                                     15.5
                                                                                                                    14.5          14.2            13.8          13.2

                CY2014                         CY2015                          CY2016                            CY2017     CY2018          CY2019F       CY2020F
                                                                       Supply (msf)                     Absorption (msf)     Vacancy (%)

Notes: Represents Embassy REIT market, vis. Bengaluru, Mumbai, NCR & Pune. Figures updated as of June 30, 2019
Source: CBRE Research 2019, Embassy REIT                                                                                                                         18
1Q FY2020 Investor Materials
III. Market Outlook
Our Markets
Portfolio well positioned in India’s four key office markets
Embassy REIT markets represent 75% of India’s office
absorption
72%
Of India’s Grade A office stock concentrated in
Embassy REIT markets
Others
25%
Bengaluru
33%
34%
Absorption growth since CY2013 for % of absorption for top 7 Indian
Embassy REIT markets cities(1)
Pune
10%
846 bps NCR
Mumbai 16%
Increase in occupancy since CY2013 for 16%
Embassy REIT markets
Source: CBRE Research 2019, Embassy REIT. India’s top 7 cities include Mumbai, NCR, Bengaluru, Pune, Chennai, Hyderabad and Kolkata
Notes: 19
(1) Absorption for period CY2013 to 2Q CY20191Q FY2020 Investor Materials
III. Market Outlook
City wise Market Outlook
While Bengaluru continued to lead office absorption globally, Pune witnessed increased levels of
activity driven by strong technology sector hiring
Bengaluru continues to remain landlord favorable market with c.4% vacancy
Healthy hiring trend, competitive rentals and quality office space continue to drive demand over
Bengaluru 2019-2023
Pre-commitment trend continues given limited available stock, timely delivery of announced
supply remains priority
Given adequate space availability, overall market remains occupier favorable with c.22% vacancy
Mumbai Core markets of BKC and Nariman Point have significantly lower vacancy at c.9%
Limited non strata-sold space availability in core markets favors institutional quality properties
Revival in IT/ITeS hiring since mid-2018, combined with competitive rentals, continue to drive
demand in Hinjewadi market with c.4% existing vacancy
Pune Increasing rental differential between West (Hinjewadi) and East Pune office markets aids rental
growth in Hinjewadi market
Limited supply of institutional owned quality office space despite c.23% overall vacancy
Quality properties continue to receive traction compared to strata-sold low-quality properties
NCR
Noida is witnessing demand by captive centres and IT-BPM with demand keeping pace with
supply
Source: CBRE Research 2019, Embassy REIT
201Q FY2020 Investor Materials
III. Market Outlook
Supply Outlook
Factoring for city, location, project timing, quality etc., comparable supply for Embassy REIT projects
is estimated to be a small proportion of overall market supply
Stock Vacancy Rent Growth Supply 2018 Absorption 2018 Supply for 2 years
City
(msf) (% of stock) (CAGR since 2013) (msf) (msf) 2019 & 2020 (msf)
Bengaluru 154.2 3.8% 8.8% 11.9 13.3 27.1
Mumbai 121.8 22.0% (0.7%) 6.7 4.4 12.2
Pune 50.0 4.4% 6.1% 3.3 2.7 10.0
NCR 105.5 23.0% 8.2% 5.6 4.2 17.8
Embassy REIT Markets 431.5 13.7% 3.7% 27.5 24.5 67.1
Chennai 63.9 6.2% 8.6% 1.4 2.8 11.1
Hyderabad 68.1 10.8% 7.4% 3.6 4.6 28.7
Kolkata 32.0 39.3% (0.3%) 1.4 0.6 3.6
Other Markets 164.0 14.6% 6.2% 6.4 8.0 43.4
Grand Total 595.5 13.9% 4.3% 33.8 32.5 110.5
165 msf 78 msf 70 msf 20 msf
300 Projects 151 Projects 132 Projects 34 Projects
Pan India Supply (2019-2021)
Pan India forecast Specific to Actual pipeline REIT comparable &
Embassy REIT
supply across top 7 Markets Realistic supply competing supply
cities a) < 50% of total hitting the market c.12% of pan India
supply
b) > 75% of supply
absorption
While total projected market supply for next 3 years is c.165 msf, comparable & competing supply estimated at c.20 msf
Against this supply, Embassy REIT has total upcoming lease-up of c.4 msf in next 3 years (including new deliveries)
Our average annual lease-up during last 4 years is c.1.8 msf p.a. between FY2016-19
Source: CBRE Research 2019, Embassy REIT. Figures updated as of June 30, 2019
211Q FY2020 Investor Materials
IV. Commercial Office
Update
FIFC, Mumbai1Q FY2020 Investor Materials
IV. Commercial Office Update
Leasing Highlights for 1Q FY2020
595k sf new leases signed across 8 deals with existing tenant expansion accounting for 57% of space
take-up
1Q FY2020 Highlights Key Leases Signed
New Leases signed (‘000 sf) 595 Tenant Property City Area ('000 sf)
HCL Embassy Techzone Pune 236
– Area Released (‘000 sf) 572 Infosys BPM Embassy Techzone Pune 128
Facebook Embassy Golflinks Bengaluru 104
– Re-leasing Spread 50.6% Dell Embassy Golflinks Bengaluru 54
Calsoft Embassy Techzone Pune 24
Existing Tenant Expansion 56.7% The Executive Centre FIFC Mumbai 22
Various Various Various 26
Renewals (‘000 sf) 226 Total 595
Leases Signed in 1Q FY2020:
DELL
Facebook
Notes: Total leases signed includes area re-leased, excludes renewals
231Q FY2020 Investor Materials
IV. Commercial Office Update
Continued Leasing Momentum
Leased 595k sf in 1Q FY2020 demonstrating continued leasing momentum, of this 572k sf re-leased at
50.6% spreads
Particulars 1Q FY2020 Average FY2019 FY2018 FY2017 FY2016
Completed Area msf 24.8 (2016-19) 24.8 24.2 23.1 22.5
Occupancy % 94.3% 94.0% 94.3% 93.5% 94.7% 93.4%
New Leases Signed msf 0.6 1.8 1.8 1.3 1.9 2.1
Re-Leasing msf 0.6 0.8 1.2 0.5 1.1 0.3
Re-Leasing Spreads % 50.6% 42.2% 34.9% 35.3% 60.7% 26.6%
New Leasing to Existing Tenant % 56.7% 61.8% 59.0% 69.0% 50.0% 71.0%
Renewals msf 0.2 1.9 0.9 2.9 1.6 2.3
1.8 msf average new leases signed between FY2016-19 42.2% Average re-leasing spread between FY2016-19
60.7%
2.1
1.9 50.6%
1.8
35.3% 34.9%
1.3
26.6%
0.6
FY2016 FY2017 FY2018 FY2019 1Q FY2020 Area FY2016 FY2017 FY2018 FY2019 1Q FY2020
Re-Leased
Area (msf) (msf) 0.3 1.1 0.5 1.2 0.6
Notes: New leases signed includes area re-leased, excludes renewals
241Q FY2020 Investor Materials
IV. Commercial Office Update
Embedded Mark-to-Market Growth
Re-leased 572k sf at higher than in-place rents & c.690k sf of brought forward expiries. Opportunity to
re-lease additional c.6 msf at market rents over next 3-4 years
Current market rents are 31% above in-place rents 20% of leases expire between FY2020–23
Rent (₹ psf/month) Area Expiring (msf)
85
3.1
65
0.7
1.3
0.9
0.6 0.6
FY2019 FY2020 FY2021 FY2022 FY2023
Mark-to-market
56% 20% 67% 53%
opportunity
Rents Expiring 3.4% 3.1% 5.1% 8.7%
Preponed 0.7 msf lease expiries between FY2020-23
(1) Proactive lease up 0.5 msf of expiries in 1Q FY2020 resulting in earlier
In-place Rents Market Rents
realization of MTM potential
Notes: Refer slide 40 for more details
(1) Market Rents as per CBRE Research 2019, Embassy REIT 251Q FY2020 Investor Materials V. Development Update Embassy Manyata, Bengaluru
1Q FY2020 Investor Materials
V. Development Update
Development Pipeline
4.0 msf on-campus new build pipeline in next 4 years. Of this, 1.4 msf near-term development projects
are 2 quarters ahead of targeted delivery
Development Track Record (msf) & Pipeline(1) Development Status as of August 12, 2019
Structure complete, Façade and MEP
nearing completion
Embassy Oxygen
Targeting 3Q FY2020 completion (vis-
2.4 (Tower 2, 0.6 msf)
à-vis 1Q FY2021 projected earlier)
42% or 246k sf pre-let to MetLife(2)
Embassy Manyata Structure complete, Façade and MEP
Front Parcel underway
(NXT Block, Targeting 4Q FY2020 completion (vis-
0.8 msf) à-vis 2Q FY2021 projected earlier)
M3 Block (Embassy Manyata, 1 msf)
0.7 Design complete, under excavation &
1.5 pre-construction
Hudson Block (Embassy Techzone,
1.0 0.5 msf) - Design completed for
0.9 Others
0.8 revised area of 0.5 msf from earlier
(3 blocks totaling
0.6 0.3 msf, excavation and pre-
0.5 1.9 msf)
construction underway
Ganges Block (Embassy Techzone,
FY 2019 FY 2020 FY 2021 FY 2022 FY 2023 Post FY 0.4 msf) - Design & pre-construction
2023
Embassy Manyata Embassy Oxygen Embassy Techzone underway, targeting to bring forward
launch timeline
Notes:
(1) Excludes 619 hotel keys across Hilton & Hilton Garden Inn at Embassy Manyata 27
(2) Excludes 45k sf growth option. Factoring the growth option, area pre-let at Embassy Oxygen would be 50%. These options are exercisable till Jun’20211Q FY2020 Investor Materials
V. Development Update
Embassy Manyata (Front Parcel)
Front Parcel at Embassy Manyata (0.8 msf commercial blocks, 58k sf retail and 619 keys hotel)
currently U/C, targeting completion of commercial block in 4Q FY2020 and hotels in 3Q FY2022
NXT Office Tower 2
382k sf
NXT Office Tower 1
399k sf
Hilton Garden Inn
3-Star - 353 keys
Hilton Hotel: 5-Star
266 keys
Retail &
Convention Center
58k sf
Note: Aug’2019 picture
281Q FY2020 Investor Materials
V. Development Update
Embassy Oxygen
0.5 msf Tower 3 delivered in November 2018 as per schedule. 0.6 msf Tower 2 is currently nearing
completion, targeting completion in 3Q FY2020; 2 quarters ahead of targeted delivery
Tower 3 – 0.5 msf Tower 2 – 0.6 msf
Delivered on schedule 2 quarters ahead of schedule (pre-let 42%)(1)
Notes: Aug’2019 pictures
(1) Excludes 45k sf growth option. Factoring the growth option, area pre-let at Embassy Oxygen would be 50%. These options are exercisable till Jun’2021 291Q FY2020 Investor Materials
V. Development Update
Existing Asset Upgrades
Select infrastructure, upgrade and ancillary projects underway to further enhance competitiveness
Embassy 247 – Facade work Embassy Manyata – 220KV Substation
(WIP, targeting 2Q FY2020 completion) (Commissioned in 1Q FY2020)
Embassy Manyata Flyover
(WIP, targeting 3Q FY2021 completion)
Notes: Aug’2019 pictures
301Q FY2020 Investor Materials VI. Hospitality Update Hilton at Embassy Golflinks, Bengaluru
1Q FY2020 Investor Materials
VI. Hospitality Update
Hilton and Four Seasons
With recent launch of Four Seasons hotel, 477 hotel keys are now operational and additional 619 keys
under development at Embassy Manyata
Hilton at Four Seasons at Hilton & Hilton Garden Inn at
Embassy Golflinks Embassy One Embassy Manyata (Front parcel)
Status: Fully Operational Status: Launched in May’2019 Status: Under Construction.
Keys: 247 Keys: 230 Structure nearing completion,
Façade & MEP underway
Format: 5-Star Format: 5-Star deluxe
Keys: 619
Occupancy(1): 70.2% Occupancy(2): 3.8% ̶ Hilton: 266 keys
ADR(1): ₹8,880 ADR(2): ₹12,539 ̶ Hilton Garden Inn: 353 keys
Format:
RevPAR(1): ₹6,230 60+ corporate accounts signed
̶ Hilton: 5-Star
̶ Hilton Garden Inn: 3-Star
Expected Completion: 3Q FY2022
Notes:
(1) Average for 1Q FY2020 32
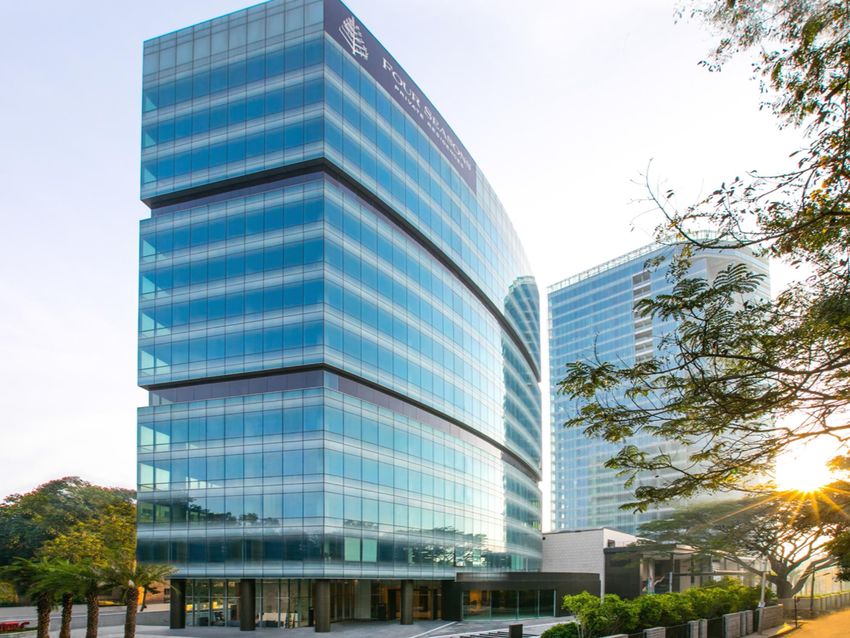
(2) Average since launch in May’2019, currently under stabilization1Q FY2020 Investor Materials
VI. Hospitality Update
Four Seasons Hotel Launch Update
Known for its world class hospitality, Four Seasons at Embassy One commenced operations in May
2019
Lobby Swimming Pool
CUR8 – All Day Dining Guest Room
Notes: Aug’2019 pictures
331Q FY2020 Investor Materials VII. Financial Update Embassy Quadron, Pune
1Q FY2020 Investor Materials
VII. Financial Update

Revenue Contribution by Segment & Geography
 Commercial Office segment contributed 89% of Revenue from Operations for 1Q FY2020

Revenue from Operations (₹ mn)                                                                                                                ₹5,351 mn
                                                                                                                             Revenue from Operations (1Q FY2020)(1)
                                                                                                               % of
                    Property                                        City                           1Q FY2020
                                                                                                               Total
Embassy Manyata                                                Bengaluru                             2,132     40%                   Others
                                                                                                                                      7%
Embassy Techzone                                                   Pune                               507       9%
                                                                                                                       Hospitality
Embassy Energy                                           Bellary, Karnataka                           388       7%        4%
Express Towers                                                   Mumbai                               388       7%
                                                                                                                                              Contribution by
Embassy Quadron                                                    Pune                               375       7%                              Segment
Embassy 247                                                      Mumbai                               355       7%
Embassy Oxygen                                                     NCR                                355       7%                                              Commercial
Embassy Qubix                                                      Pune                               229       4%                                                Office
                                                                                                                                                                  89%
Embassy Galaxy                                                     NCR                                226       4%
Hilton at Embassy Golflinks                                    Bengaluru                              206       4%              NCR (Noida)
                                                                                                                                   11%
FIFC                                                             Mumbai                               171       3%
                                                                                                                                                                Bengaluru
Four Seasons at Embassy One(2)                                 Bengaluru                              19        0%                                                51%
Revenue from Operations                                                                              5,351     100%          Pune
                                    (3)                                                                                      21%
Portfolio Investment                                                                                                                          Contribution by
Embassy Golflinks                                              Bengaluru                              957                                       Geography

                                                                                                                            Mumbai
                                                                                                                             17%

Notes:
(1)    Revenue from Operations does not include contribution from GLSP                                                                                             35
(2)    Four Seasons at Embassy One was launched in May’2019 and is currently under stabilization
(3)    Figure for 100% of GLSP. Embassy REIT owns a 50% stake in GLSP
1Q FY2020 Investor Materials
VII. Financial Update
Revenue Drivers
Revenue in 1Q FY2020 was higher by 19% YoY, mainly on account of contracted escalations,
new lease-ups and MTM
Revenue from Operations (₹ mn)
12 68
261
516
38.8 5,351
4,494
1Q FY2019 Contracted Lease-up and Development Income from 1Q FY2020
Revenue MTM Hotels and Others
% of revenue increase 60.2% 30.4% 1.4% 8.0% Revenue Growth YoY
Contracted lease Lease-up of 1.4 msf Pre-lease at recently Launch of Four Seasons in
escalations vacancy across Embassy delivered 0.5 msf May’2019
Ramp-up of Solar plant at Manyata, FIFC, Embassy Tower 3 at Embassy Straight lining and other
Embassy Energy 247 & others Oxygen Ind-AS adjustments
Key MTM on c.0.5 msf at
Increase in maintenance 19%
Drivers and other contracted Embassy Quadron,
income Embassy Manyata,
Embassy Techzone &
others
Net of downtime
361Q FY2020 Investor Materials
VII. Financial Update
Leverage Update
Successfully priced and allotted ₹30 bn NCDs, to repay existing debt and for general corporate
purposes
Listed NCD Issuance post IPO
₹30 bn ₹30 bn NCDs allotted on May 3, 2019
Listed NCD Issuance
AAA / Stable CRISIL Rating
YTM of 9.4% maturing in June 2022; to be paid as premium on
redemption
AAA / Stable Utilized to repay debt and for general corporate purposes
CRISIL Rating
Financing Strategy
9.4%
Construction finance to fund ongoing capex needs
YTM
Ample headroom for acquisitions
Regulatory cap at 49% of asset value
11% Majority Unitholders approval required if debt exceeds 25% of asset
Net Debt to TEV value
371Q FY2020 Investor Materials
VII. Financial Update
Fortress Balance Sheet
Post utilization of IPO proceeds, our conservative Balance Sheet provides significant flexibility for
growth
Total Enterprise Value (₹ mn) Debt to Market Capitalization
As of Mar’2019
Particulars June 30, 2019
Gross Debt
Market Capitalization 283,101 ₹79,111 mn
25%
Add: Net Debt 35,120
Gross Debt 39,287
Pre-listing
Less: Cash & Cash Equivalents (1,930)
Less: Short-term treasury investments (1) (2,237)
Total Enterprise Value (TEV) 318,221 Equity
₹231,500 mn
75%
Leverage Ratios
As of Jun’2019
Particulars June 30, 2019 Gross Debt
₹39,287 mn
Net Debt to TEV 11% 12%
(2)
Net Debt to EBITDA 2.0x
Interest Coverage Ratio (excluding capitalized interest) 5.9x
1Q FY2020
Interest Coverage Ratio (including capitalized interest) 4.0x
Equity
₹283,101 mn
88%
Notes:
(1) Includes short-term liquid fund investment, fixed deposits etc., net of 1Q FY2020 distribution of ₹4,167 mn 38
(2) EBITDA has been annualized for comparability purposes1Q FY2020 Investor Materials VIII. Other Updates Embassy Golflinks, Bengaluru
1Q FY2020 Investor Materials
VIII. Other Updates
Embassy Tech Zone Case Study
Backfilled c.75% of unscheduled vacancy from a significant tenant at Embassy Techzone at 37%
re-leasing spreads without any lease void period
3Q FY2019: Anchor tenant occupying 480k sf commences
Situation Overview
early exit discussions due to its global merger & relocation
4Q FY2019: Despite lease under lock-in, early exit request
considered given:
‒ In-place rent on 480k sf existing lease 6% below market
‒ Renewed hiring & interest for near term available spaces by
IT / ITeS firms
‒ Lack of quality supply in Hinjewadi micro-market
1Q FY2020
Hands-on Asset
‒ Backfilled 360k sf to 2 tenants at 37% higher than in-place
Management
rents
‒ Seamless transition to new tenants with no rental void
period
2Q FY2020
‒ Active discussions with 3 tenants for balance 120k sf
Quick turnaround, successful backfill
Value Add
Reduced tenant concentration
Ahead of schedule MTM realization
Availability of incubation space for growth tenants
Existing Rent Re-leased Rent
401Q FY2020 Investor Materials
VIII. Other Updates
Environment, Social & Governance
Our focus on energy sustainability and environment conservation differentiates us from our
competition
100 MW Solar Plant
100MW green energy initiative (215 mn units estimated annual
capacity) supplying power to our Bengaluru & other assets
Sustainable
Energy Estimated offset of upto 200mn kg of CO2 annually (1)
Introduced 100% electric vehicles in Embassy Golflinks for park
employees
Battery operated electric vehicles
2 British Safety Council Sword of Honour winning parks (2017)
for select assets
Environment,
Health and Safety Environmental, Health and Safety Certifications such as ISO /
OHSAS for select assets
Many LEED Platinum / Gold rated assets
Government School Inauguration
Creating a sense of community by supporting CSR initiatives,
Community especially around our properties
Engagement
Inauguration of 650 student primary school in Bengaluru in
partnership with ANZ & Government of Karnataka
Notes:
(1) Indicative based on “CO2 baseline database for the Indian power sector June 2018 and assuming 215 mn units generation p.a. 411Q FY2020 Investor Materials
VIII. Other Updates
Environment, Social & Governance (cont’d)
Embassy REIT has world class corporate governance standards
Minimum 80% of value in completed and leased properties
Asset Minimum 90% of distributable cash flows to be distributed
Restrictions on speculative land acquisition
Majority unitholder approval required if debt exceeds 25% of asset value
Debt
Debt cannot exceed 49% of asset value
50% independent directors on the Board, with 50% representation on all committees
Manager Manager can be removed with 60% approval of unrelated Unitholders
Alignment with Unitholder interests due to a distribution linked management fees structure
Sponsors are prohibited from voting on their related party transactions
Majority Unitholder approval required for acquisition or disposal of asset which exceeds 10% of REIT
value
Strong Related Party
Safeguards Acquisition or sale price of new asset cannot deviate from average valuation of two independent valuers
by +/- 10%
Fairness opinion from independent valuer required if related party leases exceed 20% of the total REIT
area
421Q FY2020 Investor Materials
VIII. Other Updates
Tenant Engagement
Conducted various ‘Energize’ events at properties across portfolio as part of total business eco-
system offering
5-a-side Football Tournament Cricket 6-a-side League Women's Throwball
World Environment Day International Yoga Day Workout Wednesdays
431Q FY2020 Investor Materials IX. Looking Ahead Embassy Qubix, Pune
1Q FY2020 Investor Materials
IX. Looking Ahead

Key Growth Drivers
  Growth Levers and near-term priorities for FY2020 in-line with historic delivery

                                                                                                                                                              Achieved           Near term priority
                                                                                                                                                              1Q FY2020                FY2020

                                                                                                                                                    Four Seasons Hotel
                                                                                                                                                                               Stabilize Four Seasons
                                                                                                                                                    launched and
                                                                                                                                                                               Hotel
                                                             Hotel                                                                                  operational

                                                      Stabilization                                                                                 1.4 msf across Embassy
                                                                                                                                                    Oxygen & Embassy
                                                                                                                                                    Manyata.                   Deliver 1.4 msf across
                                                                                                                                                                               Embassy Oxygen &
                                                      Development                                                                                   ‒ 2 quarters ahead of      Embassy Manyata;
                                                                                                                                                      scheduled delivery       Proactively Pre-lease
                                                                                                                                                    ‒ pre-let 42% to
                                                                                                                                                      MetLife(1)

                                              Re-Leasing to Market
                                                                                                                                                    Re-leased 572k sf at       Re-lease 0.8 msf, at
                                                                                                                                                    50.6% spreads              56% spreads

                                                Vacancy Lease-up                                                                                                               Lease-up 1.4 msf across
                                                                                                                                                    New lease-up of 595k sf
                                                                                                                                                                               Embassy One, FIFC
                                                                                                                                                    to 8 tenants
                                                                                                                                                                               and others

                                                                                                                                                    Achieved 12-15%            Contracted 12-15%
                                           Contractual Escalations                                                                                  escalation on c.0.9 msf,   escalation on c.4.5 msf,
                                                                                                                                                    10+ tenants                35+ tenants

Notes:
(1)    Excludes 45k sf growth option. Factoring the growth option, area pre-let at Embassy Oxygen would be 50%. These options are exercisable till Jun’2021                                       45
1Q FY2020 Investor Materials X. Appendix Embassy Galaxy, Noida
1Q FY2020 Investor Materials
X. Appendix

Walkdown of Financial Metrics
  NOI & EBITDA margins for 1Q FY2020 were healthy at 85% & 82% respectively. Distribution payout
  ratio for 1Q FY2020 is 99.7% of NDCF at REIT level ₹4,180 mn

                                                                                                                                                                                   (Amount in ₹ mn)

                                                                                                               (1)                                   (2)
                                                                                                 1Q FY2020                                   1Q FY2019
                                                                                         Total                   Per Unit            Total               Per Unit   Variance (%)
  Revenue from Operations                                                                5,351                                       4,494                             19%

                                                                                                                                                                                     NOI
  Property Taxes and Insurance                                                           (179)                                       (191)                             (6%)
  Direct Operating Expenses                                                              (643)                                       (486)                             33%

NOI                                                                                      4,528                                       3,818                              19%

                                                                                                                                                                                           NDCF at SPV level
  Other Income                                                                            142                                        466                               (69%)
  Property Management Fees                                                               (119)                                       (68)                              74%
  Indirect Operating Expenses                                                            (174)                                       (277)                             (37%)
EBITDA                                                                                   4,378                                       3,938                              11%

                                                                                                                                                                                                               Distribution
  Working Capital Adjustments                                                             857                                        (313)                            (374%)
  Cash Taxes                                                                             (326)                                       (618)                             (47%)
  Other Adjustments                                                                      (209)                                       (288)                             (28%)
Cash Flow from Operating Activities                                                      4,701                                       2,718                              73%
  External Debt (Interest & Principal)                                                   (667)                                        NR                                NA
  Other Adjustments                                                                       117                                         NR                                NA
NDCF at SPV level                                                                        4,151                                        NA                                NA
  Distribution from SPVs to REIT                                                         3,749                                        NA                                NA
  Distribution from Embassy Golflinks                                                     480                                         NA                                NA
  REIT Management Fees                                                                    (42)                                        NA                                NA
  Other Inflows at REIT (Net of Expenses)                                                  (7)                                        NA                                NA
NDCF at REIT level                                                                       4,180                                        NA                                NA
Distribution                                                                             4,167                       5.40             NA                   NA           NA

Notes:                                                                                                                                                                                        47
(1)    Figures for 1Q FY2020 are basis unaudited consolidated financials
(2)    Figures for 1Q FY2019 are basis unaudited combined financials and may not be comparable. For further details refer slide 50
1Q FY2020 Investor Materials
X. Appendix
REIT Fundamentals
REIT stands for Real Estate Investment Trust
A REIT is a trust that owns, operates or finances income-producing real estate
• REITs give all investors access to the benefits of real estate investment with the advantage of investing in publicly
traded units
A REIT is a tax-efficient vehicle that
• enables owners of real estate to pool income generating assets together in a portfolio; and
• allows investors to buy ownership in real estate assets in the form of equity
REITs globally are a US$2 trillion asset class; first REIT started in the US in the 1960s
• REITs are universally accepted by global institutions and individual investors as a product that provides:
- Liquidity
- Transparency
- Diversification
- Dividends
- Performance
► REITs must pay out majority of earnings as distributions to Unitholders
• Indian regulations require REITs to pay out 90% of distributable cash flows
► REITs must have at least 80% of their assets be completed and income-producing
• A low level of development (20% or less) means less risk to the cash flows
► REITs are typically listed on stock exchanges through an Initial Public Offering (IPO)
• Once listed, they serve as permanent capital vehicles to raise debt and equity in the capital markets to acquire new
assets to grow
481Q FY2020 Investor Materials
X. Appendix
Embassy REIT structure
Blackstone Embassy
Sponsor Groups Sponsor Entity
Public
Unitholders
Management
Trustee Embassy Services
REIT Manager
(Axis Acts on Behalf of (EOPMSPL)
Trustee) Unitholder
100%
Embassy Office Parks Private Limited
(Embassy Techzone)
36% 80% 50%(1)
100% 100% 100% 100% 100% 100% 100% 64% 20% 100%
Indian
Quadron Qubix Oxygen Golflinks
Express Earnest Vikhroli Galaxy Manyata Embassy Umbel
Business Business Business Software
Newspapers Towers Corporate Square Promoters Energy Properties
Park Park Park Park
(Mumbai) Private Park Private Private Private Private
Private Private Private Private
Private Limited Private Limited Limited Limited Limited
Limited Limited Limited Limited
Limited Limited
Embassy
Quadron, Hilton at
Express Embassy Embassy Embassy Embassy Embassy Embassy Embassy
Embassy FIFC Embassy
Towers Qubix 247 Galaxy Oxygen Manyata Energy Golflinks
One & Four Golflinks
Seasons
Notes:
(1) Balance 50% owned by JV partner 491Q FY2020 Investor Materials
X. Appendix
Key Terms & Definitions
Notes: 27. MTM – Mark to Market
► All figures in this presentation are as of June 30, 2019 unless specified otherwise 28. MW – Mega-Watt
29. Mumbai – Refers to Mumbai Metropolitan Region (MMR)
► All figures corresponding to year denoted with “FY” are as of or for the one-year period ending (as may be relevant) 31st
March of the respective year. Similarly, all figures corresponding to year denoted with “CY” are as of or for the one-year period 30. NAV – Net Asset Value
ending (as may be relevant) 31st December of the respective year 31. NCD – Non-Convertible Debentures
32. NXT – Manyata front parcel office towers
► Some of the figures in this Presentation have been rounded-off to the nearest decimal for the ease of presentation
33. NDCF refers to Net Distributable Cash Flows
► All details included in the presentation considers 100% stake in GLSP. However, we own 50% economic interest in GLSP 34. Net Debt – Gross Debt minus short term treasury investment and cash and cash equivalents
which owns Embassy Golflinks. Accordingly, its revenues are not consolidated into our revenue from operations. Also, Market
35. NM – Not material
Value or GAV reflects only our 50% economic interest in GLSP.
36. NOI – Net Operating Income calculated by subtracting Direct Operating expenses from Revenue from operations
► Any reference to long-term leases or WALE (weighted average lease expiry) assumes successive renewals by tenants at their 37. NSE – National Stock Exchange
option 38. OC – Occupancy certificate
► Given Embassy REIT was listed on April 1, 2019 and Embassy REIT assets were acquired between March 22, 2019 & March 39. Occupancy / % Occupied / % Leased – Occupancy is defined as the ratio of the Occupied Area and the Completed Area
25, 2019, the comparative quarterly financial information included herein are the combined unaudited financial statements for 40. Occupied Area – Completed area of property which has been leased or rented out in accordance with an agreement entered
1Q FY2019 (assuming that the Embassy REIT held the Embassy REIT assets in its present form during 1Q FY2019) as into for the purpose
against consolidated unaudited financial information for 1Q FY2020 and hence may not be comparable. 41. Portfolio – Together, the Portfolio Assets and the Portfolio Investment
42. Proposed Development Area – The Leasable Area of a property for which the master plan for development has been
► Key Terms and Definitions: obtained, internal development plans are yet to be finalized and applications for requisite approvals required under the law
for commencement of construction are yet to be received
1. Base Rentals – Rental income contracted from the leasing of Completed Area; does not include fit-out and car
parking income 43. psf – Per square feet
2. bn – Billions 44. REIT – Real Estate Investment Trust
3. BPS – Basis points 45. REIT Regulations – Securities and Exchange Board of India (Real Estate Investment Trusts) Regulations, 2014
4. BSE – Bombay Stock Exchange 46. Rents – Refers to Gross Rentals unless specified otherwise. Gross Rentals are defined as the sum of Base Rentals, fit-out
and car parking income from Occupied Area for the month of Jun’2019
5. CAGR – Compounded Annual Growth Rate
47. RevPAR – Revenue Per Available Room (RevPAR) is a hotel industry financial metric calculated by multiplying the Average
6. CBRE – CBRE South Asia Private Limited Daily Rate by the percentage occupancy
7. Completed Area – the Leasable Area of a property for which occupancy certificate has been received 48. ROFO – Right of First Offer
8. EBITDA – Earnings before interest, tax, depreciation and amortization 49. SF – Square feet
9. Embassy Group – refers to the Embassy Sponsor or its subsidiaries or limited liability partnerships 50. Sponsor(s) – Embassy Property Developments Private Limited and BRE/ Mauritius Investments
10. Embassy REIT refers to Embassy Office Parks REIT 51. SPV – Special purpose vehicles, as defined in Regulation 2(l)(zs) of the REIT Regulations, in this case being, MPPL, UPPL,
11. EOPMSPL – Embassy Office Parks Management Services Private Limited EEPL, IENMPL, VCPPL, ETPL, QBPL, QBPPL, OBPPL and GSPL
12. FY – Period of 12 months ended March 31 of that particular year, unless otherwise stated 52. TEV – Total Enterprise Value
13. GAV – Gross Asset Value 53. tn – Trillions
14. GLSP – Golflinks Software Park Private Limited 54. Units – An undivided beneficial interest in the Embassy REIT, and such units together represent the entire beneficial interest
in the Embassy REIT
15. HVAC – Heat ventilated air conditioning
55. U/C – Under construction
16. Holdco – Refers to Embassy Office Parks Private Limited
56. Under Construction Area – The Leasable Area of a property for which the master plan for development has been obtained,
17. IPO – Initial Public Offering of units of Embassy Office Parks REIT internal development plans have been finalized and applications for requisite approvals required under the law for
18. Investment Entity – Refers to Golflinks Software Park Private Limited commencement of construction have been applied, construction has commenced, and occupancy certificate is yet to be
received
19. Leasable Area – Total square footage that can be occupied by a tenant for the purpose of determining a tenant’s
rental obligations. Leasable Area is the sum of Completed Area, Under Construction Area and Proposed 57. WALE – Weighted Average Lease Expiry
Development Area
58. WIP – Work-in-progress
20. Manager – Embassy Office Parks Management Services Private Limited 59. Years – Refers to fiscal years unless specified otherwise
21. MAT – Minimum Alternate Tax 60. YoY – Year on year
22. MEP – Mechanical, Electrical & Plumbing 61. YTM – Yield to Maturity
23. mn – Millions
24. MNC – Multinational Corporations
25. msf – Million square feet
501Q FY2020 Investor Materials
You can also read