All materials are property of - Metromile

Page created by Kathy Higgins
 
CONTINUE READING
All materials are property of - Metromile
All materials are property of   1
All materials are property of - Metromile
Digital insurance
         for a digital world

All materials are property of   2
All materials are property of - Metromile
Disclaimer
          This presentation is provided for informational purposes only and has been prepared to assist interested parties in making their own evaluation with respect to a potential business combination (the “proposed business combination”) between
          MetroMile, Inc. (“Metromile”) and INSU Acquisition Corp. II (“INSU II”) and related private placement financing (the “Transactions”) and for no other purpose. No representations or warranties, express or implied are given in, or in respect of, this
          presentation. To the fullest extent permitted by law in no circumstances will Metromile, INSU II or any of their respective subsidiaries, stockholders, affiliates, representatives, partners, directors, officers, employees, advisers or agents be responsible
          or liable for any direct, indirect or consequential loss or loss of profit arising from the use of this presentation, its contents, its omissions, reliance on the information contained within it, or on opinions communicated in relation thereto or otherwise
          arising in connection therewith. Industry and market data used in this presentation have been obtained from third-party industry publications and sources as well as from research reports prepared for other purposes. Neither Metromile nor INSU II
          has independently verified the data obtained from these sources and cannot assure you of the data’s accuracy or completeness. This data is subject to change. In addition, this presentation does not purport to be all-inclusive or to contain all of the
          information that may be required to make a full analysis of Metromile or the Transactions. Viewers of this presentation should each make their own evaluation of Metromile and of the relevance and adequacy of the information and should make such
          other investigations as they deem necessary.

          Forward-Looking Statements
          This presentation includes “forward-looking statements” within the meaning of the “safe harbor” provisions of the U.S. Private Securities Litigation Reform Act of 1995. Forward-looking statements may be identified by the use of words such as
          “estimate,” “plan,” “project,” “forecast,” “intend,” “will,” “expect,” “anticipate,” “believe,” “seek,” “target” or other similar expressions that predict or indicate future events or trends or that are not statements of historical matters. These forward-looking
          statements include, but are not limited to, statements regarding estimates and forecasts of financial and performance metrics, projections of market opportunity and market share, potential benefits and the commercial attractiveness to its
          customers of Metromile’s products and services, the potential success of Metromile’s marketing and expansion strategies, including launching with automotive OEMs, Metromile’s ability to scale, and potential benefits of the Transactions (including
          with respect to stockholder value), and expectations related to the terms and timing of the Transactions. These statements are based on various assumptions, whether or not identified in this presentation, and on the current expectations of
          Metromile’s and INSU II’s management and are not predictions of actual performance. These forward-looking statements are provided for illustrative purposes only and are not intended to serve as, and must not be relied on by any investor as, a
          guarantee, an assurance, a prediction or a definitive statement of fact or probability. These forward-looking statements are subject to a number of risks and uncertainties, including risks associated with regulatory changes; economic changes
          (nationally or on a market level), reinsurance markets, marketing success, competition, data breaches, continued technology development, partnerships, fraud claims, actual loss ratios (or any component parts), other expenses, or natural disaster, as
          well as Metromile’s ability to attract and retain customers and expand customers’ use of Metromile’s services; the impact of the COVID-19 pandemic on Metromile’s business and the global economy; the inability of the parties to successfully or timely
          consummate the proposed business combination, including the risk that any required regulatory approvals are not obtained, are delayed or are subject to unanticipated conditions that could adversely affect the combined company or the expected
          benefits of the proposed business combination or that the approval of the stockholders of INSU II or Metromile is not obtained; failure to realize the anticipated benefits of the proposed business combination; risks relating to the uncertainty of the
          projected financial and operating information with respect to Metromile; risks related to future market adoption of Metromile’s offerings; risks related to Metromile’s marketing and growth strategies; the effects of competition on Metromile’s future
          business; the amount of redemption requests made by INSU II’s public stockholders; the ability of INSU II or the combined company to issue equity or equity-linked securities in connection with the proposed business combination or in the future,
          and those factors discussed in INSU II’s final prospectus filed on September 4, 2020, and Quarterly Report on Form 10-Q for the quarter ended September 30, 2020, in each case, under the heading “Risk Factors,” and other documents of INSU II filed,
          or to be filed, with the Securities and Exchange Commission (“SEC”). If any of these risks materialize or any of INSU II’s or Metromile’s assumptions prove incorrect, actual results could differ materially from the results implied by these forward-looking
          statements. There may be additional risks that neither INSU II nor Metromile presently know or that INSU II and Metromile currently believe are immaterial that could also cause actual results to differ from those contained in the forward-looking
          statements. In addition, forward-looking statements reflect INSU II’s and Metromile’s expectations, plans or forecasts of future events and views as of the date of this presentation. INSU II and Metromile anticipate that subsequent events and
          developments will cause INSU II’s and Metromile’s assessments to change. However, while INSU II and Metromile may elect to update these forward-looking statements at some point in the future, INSU II and Metromile specifically disclaim any
          obligation to do so. These forward-looking statements should not be relied upon as representing INSU II’s and Metromile’s assessments as of any date subsequent to the date of this presentation. Accordingly, undue reliance should not be placed
          upon the forward-looking statements.

          Use of Projections
          This presentation contains projected financial information with respect to Metromile, namely non-GAAP financial measure (“NGFM”) contribution profit/(loss) and contribution margin, projected revenue, operating profit, and the financial information
          including in reconciliation of NGFMs for 2020-2024, and other financial information included in Metromile’s long-term target operating model. Such projected financial information constitutes forward-looking information and is for illustrative
          purposes only and should not be relied upon as necessarily being indicative of future results. The assumptions and estimates underlying such projected financial information are inherently uncertain and are subject to a wide variety of significant
          business, economic, competitive and other risks and uncertainties that could cause actual results to differ materially from those contained in the prospective financial information. See “Forward- Looking Statements” above. Actual results may differ
          materially from the results contemplated by the projected financial information contained in this presentation, and the inclusion of such information in this presentation should not be regarded as a representation by any person that the results
          reflected in such projections will be achieved. Neither of the independent registered public accounting firms of Metromile or INSU II have audited, reviewed, compiled, or performed any procedures with respect to the projections for the purpose of
          their inclusion in this presentation, and accordingly, neither of them expressed an opinion or provided any other form of assurance with respect thereto for the purpose of this presentation.

          Financial Information; Non-GAAP Financial Measures
          The financial information and data contained in this presentation is unaudited, preliminary and subject to change. Metromile is in the process of completing its Public Company Accounting Oversight Board (“PCAOB”) audits for the fiscal years ended
          December 31, 2018 and 2019 and the review procedures for the nine months ended September 30, 2019 and September 30, 2020, respectively, and, therefore, all of Metromile’s historical financial information included in the presentation is preliminary
          and subject to change. Metromile’s independent registered public accounting firm, Moss Adams LLP, has not audited or reviewed, and does not express an opinion with respect to, any of the financial information or data included in this presentation.
          The financial information included in this presentation is not a comprehensive statement of Metromile’s financial results for the periods shown, and Metromile’s actual results may differ materially from the financial information included in this
          presentation due to the completion of the audits and review of Metromile’s financial statements referenced above and other developments that may arise between now and the time those audits and review are completed. Accordingly, the financial
          information and data contained in this presentation may not be included in, may be adjusted in or may be presented differently in, any proxy statement, registration statement, or prospectus to be filed by INSU II with the SEC.

All materials are property of                                                                                                                                                                                                                                                 3
All materials are property of - Metromile
Disclaimer (cont’d)
          Further, some of the financial information and data contained in this presentation, such as contribution profit/(loss) and contribution margin, and the financial information included in Metromile’s long-term target operating model, have not been
          prepared in accordance with generally accepted accounting principles in the United States (“GAAP”). Contribution profit/(loss), a NGFM, is defined as gross profit/(loss), excluding the effects of reinsurance arrangements on both total revenue and
          losses and loss adjustment expense. It also excludes enterprise software revenues, as well as amortization of internally developed software, devices, while including other policy servicing expenses. Metromile believes the resulting calculation is
          inclusive of the variable costs of revenue incurred to successfully service a policy, but without the volatility of reinsurance. Metromile uses contribution profit/(loss) as a key measure of its progress towards profitability and to consistently evaluate the
          variable contribution to its business from insurance operations from period to period because it is the result of direct earned premiums, plus investment income earned at the insurance company, minus losses, loss adjustment expense, premium
          taxes, bad debt, payment processing fees, data costs, underwriting reports, and other costs related to servicing policies. The NGFM has not been calculated in accordance with GAAP and should be considered in addition to results prepared in
          accordance with GAAP and should not be considered as a substitute for, or superior to, GAAP results. In addition, contribution profit/(loss) should not be construed as an indicator of Metromile’s operating performance, liquidity or cash flows
          generated by operating, investing and financing activities, as there may be significant factors or trends that it fails to address. INSU II and Metromile caution investors that NGFMs, by their nature, depart from traditional accounting conventions.
          Therefore, the use of NGFMs, such as contribution profit/(loss) and contribution margin can make it difficult to compare Metromile’s current results with Metromile’s results from other reporting periods and with the results of other companies. The
          reconciliation of NGFMs for full years 2020-2024 is based on current estimations only and is not prepared in accordance with GAAP. Such information is inherently uncertain. You should review Metromile’s audited financial statements, which will be
          included in the Registration Statement (as defined below) relating to the proposed business combination.

          Additional Information About the Proposed Business Combination and Where To Find It
          The proposed business combination will be submitted to stockholders of INSU II for their consideration. INSU II intends to file a registration statement on Form S-4 (the “Registration Statement”) with the SEC, which will include preliminary and
          definitive proxy statements to be distributed to INSU II’s stockholders in connection with INSU II’s solicitation for proxies for the vote by INSU II’s stockholders in connection with the proposed business combination and other matters as described in
          the Registration Statement, as well as the prospectus relating to the offer of the securities to be issued to Metromile’s stockholders in connection with the completion of the proposed business combination. After the Registration Statement has been
          filed and declared effective, INSU II will mail a definitive proxy statement and other relevant documents to its stockholders as of the record date established for voting on the proposed business combination. INSU II's stockholders and other
          interested persons are advised to read, once available, the preliminary proxy statement / prospectus and any amendments thereto and, once available, the definitive proxy statement / prospectus, in connection with INSU II's solicitation of proxies
          for its special meeting of stockholders in lieu of its first annual meeting to be held to approve, among other things, the proposed business combination, because these documents will contain important information about INSU II, Metromile and the
          proposed business combination. Stockholders may also obtain a copy of the preliminary or definitive proxy statement, once available, as well as other documents filed with the SEC regarding the proposed business combination and other documents
          filed with the SEC by INSU II, without charge, at the SEC's website located at www.sec.gov or by directing a request to INSU II by telephone at (215) 701-9693 or at its principal executive offices at 2929 Arch Street, Suite 1703, Philadelphia,
          Pennsylvania 19104.

          INVESTMENT IN ANY SECURITIES DESCRIBED HEREIN HAS NOT BEEN APPROVED OR DISAPPROVED BY THE SEC OR ANY OTHER REGULATORY AUTHORITY NOR HAS ANY AUTHORITY PASSED UPON OR ENDORSED THE MERITS OF THE OFFERING
          OR THE ACCURACY OR ADEQUACY OF THE INFORMATION CONTAINED HEREIN. ANY REPRESENTATION TO THE CONTRARY IS A CRIMINAL OFFENSE.

          Participants in the Solicitation
          INSU II, Metromile, and certain of their respective directors and officers and other members of management and employees may be deemed participants in the solicitation of proxies of INSU II stockholders in connection with the proposed business
          combination under applicable SEC rules. INSU II stockholders and other interested persons may obtain, without charge, more detailed information regarding the directors and officers of INSU II in INSU II’s filings with the SEC.
          You can find more information about INSU II’s directors and executive officers in INSU II’s final prospectus filed with the SEC on September 4, 2020. Information regarding the persons who may, under SEC rules, be deemed participants in the
          solicitation of proxies to INSU II stockholders in connection with the proposed transaction will be set forth in the proxy statement / prospectus for the transaction when available. Stockholders, potential investors and other interested persons should
          read the proxy statement / prospectus carefully when it becomes available before making any voting or investment decisions. You may obtain free copies of these documents from the sources indicated above.

          No Offer or Solicitation
          This presentation does not constitute an offer to sell or the solicitation of an offer to buy any securities, or a solicitation of any vote or approval, nor shall there be any sale of securities in any jurisdiction in which such offer, solicitation or sale would be
          unlawful prior to registration or qualification under the securities laws of any such jurisdiction.

          Trademarks
          This presentation contains trademarks, service marks, trade names and copyrights of Metromile, INSU II and other companies, which are the property of their respective owners.

All materials are property of                                                                                                                                                                                                                                                    4
All materials are property of - Metromile
Overview of INSU Acquisition Corp. II
                                    •   INSU II’s sponsor, Cohen & Company, has deep insurance sector experience
                 Domain expertise   •   Over $4.3B investments across 208 insurance companies

                                    •   Embraced the SPAC structure as early as 2015 and innovated on a variety of features
                 Pioneer in SPACs       making it a favorable alternative for many companies looking to become public

                Our people          •   Team comprises founders, operators, and investors in FinTech

                Track record        •   Sponsor team members have been part of the CardConnect, Intermex, Shift, and Paya
                of success              success stories

             FNTC IPO unit investors saw
             +90% investment appreciation
                                                              FNTE IPO unit investors
                                                              saw +82% investment                                               $185M                                     $250M
             from IPO to acquisition by                       appreciation since IPO²                                           Upsized Pipe                              Upsized Pipe
             First Data in July 2018¹
                                        Note: Past results are no guarantee of future successes.
                                        ¹ Return based on acquisition consideration paid by First Data of $15 per share of CCN common stock and $3.99 per CCN warrant (assumes warrants were issued within 30 days of
                                        acquisition closing), per tender offer statements initially filed by CCN and First Data with the SEC on June 7, 2017.
All materials are property of           ² Return based on IMXI common stock closing price as of October 21, 2020. For each whole warrant, reflects .201 shares of IMXI common stock and $1.12 in cash issued to warrant   5
                                        holders pursuant to IMXI’s Offer to Exchange Warrants filed on Form S-4 with the SEC on March 28, 2019.
All materials are property of - Metromile
Transaction overview
                                                                                                                                                                                         Sources                                                                                         All values in $M
                  Key highlights
                                                                                                                                                                                            INSU II Equity2                                                                               230
                         $900mm pre-transaction enterprise value ($956mm pro
                                                                                                                                                                                            Metromile Equity Rollover                                                                     842
                          forma enterprise value)
                                                                                                                                                                                            PIPE Financing8                                                                               160
                         21.5x 2022E contribution profit1 or 15.9x 2022E adjusted gross
                          profit1                                                                                                                                                           Total sources                                                                                 $1,232

                         Metromile stockholders receive $842mm2 in equity

                         Metromile receives $294mm in primary proceeds to fund                                                                                                          Uses                                                                                           All values in $M
                          growth3                                                                                                                                                           Metromile Equity Rollover2                                                                    842

                         Existing Metromile shareholders will receive 10mm earn-out                                                                                                        Metromile Stockholder Cash Consideration2                                                     30
                          shares if stock price exceeds $15.00 per share4
                                                                                                                                                                                            Debt Repayment9                                                                               31
                         Metromile management will continue to operate the business                                                                                                        Transaction Expenses10                                                                        35
                          post-closing
                                                                                                                                                                                            Cash to Merged Company Balance Sheet11                                                        294
                         Transaction expected to close in Q1 2021                                                                                                                          Total uses                                                                                    $1,232

                  Pro forma capitalization (at $10.00)                                                           All values in $M                                                        Pro forma ownership3,12 (%) at closing
                                                                                                                                                                                           Sponsor shares
                      Pro Forma Implied Enterprise Value                                                          $956                                                                     5.5%

                       Pro Forma Gross Debt5                                                                      (28)                                                                     PIPE shares
                                                                                                                                                                                           12.3%
                       Pro Forma Cash6                                                                            325                                                                      INSU II IPO shares                                                                                  64.6%
                       Pro Forma Implied Market Capitalization7                                                   $1,253
                                                                                                                                                                                           17.6%                                                  69.8%                             Existing Metromile
                                                                                                                                                                                                                                                                                       shareholders

1 Multiples based off pro forma implied enterprise value; 2022E contribution profit $44.5mm and 2022E adj. gross profit of $60.2mm; 2 Represents total seller equity, inclusive of options and warrants; Assumes retention of 100% of INSU II equity. Metromile stockholder cash consideration may be reduced, including to the extent of INSU II
stockholder redemptions; 3 Assumes a $160mm PIPE financing and no INSU II stockholder redemptions; 4 Earn-out shares will be issued if closing stock price exceeds $15.00 per share for 20 out of any 30 consecutive trading days during the first 24 months; 5 Assumes outstanding debt liability of $28.0mm post completion; 6 Exclusive of
restricted cash, includes $31mm of existing balance sheet cash; 7 Assumes $10.00 share price; Includes (a) 0.5mm shares from Sponsor unit investment and (b) 23.5% of the total 6.7mm promote shares, or 1.6mm shares that are not subject to transfer restrictions following the close of a business combination. The two remaining 38.2%
tranches of promote shares cannot be sold or transferred until a closing stock price of the shares exceeds $15.00 and $17.00 respectively, for any 20 trading days within a 30-day trading period following the business combination; Excludes earn-out shares; 8 Model assumes PIPE financing issued at $10.00 per share; 9 Assumes repayment of
$31mm of existing debt based on unaudited balance sheet data as of September 30, 2020; 10 Reflects estimated transaction costs. Actual costs may vary; 11 Proceeds from the Trust account (net of INSU II stockholder redemptions) and the PIPE financing, after the payment of debt, cash consideration and transaction expenses will increase
All  materials
the amount   of cash are   property
                     to balance sheet; 12of
                                          Includes all tranches of sponsor promote shares, and excludes out of the money warrants, earn-out shares & LTIP                                                                                                                                                                                           6
All materials are property of - Metromile
Visionary, technology-experienced leadership team

                                     Dan Preston                                                             Dave Friedberg
                                     Chief Executive Officer                                                 Founder & Executive Chairman

      Paw Andersen                            Jim Huscroft                  Mark Gundacker                                Lindsay Alexovich
      Chief Technology Officer                VP Claims                     Chief People Officer                          Chief Accounting Officer
     Engineering Leader of                    27 year veteran of            HR Leader at Salesforce and                   SF Chief Auditor and InsurTech
     Autonomous Software at Uber              Progressive                   Bank of America                               Strategy Leader at PwC

      Debra Jack                              Matt Stein                    Jesse McKendry                                Amrish Singh
      VP Corp. Communication                  VP Product                    VP Insurance                                  GM, Enterprise
     1st VP Comms at SoFi & LendUp            Design leader at Salesforce   14 year veteran of Progressive                Product leader, startup co-founder
     15 year veteran of Edelman               User experience at Autodesk   Engineer at Daimler Chrysler                  Deloitte, SAP

All materials are property of                                                                                                                                  7
All materials are property of - Metromile
Auto insurance is unfair
        to most consumers
         Linear relationship between miles driven
          and expected losses
                                                                             Price every driver pays
         35% of drivers drive more than half the miles
          and cause more than half the losses

                                                          Expected Losses
         Drivers are assigned to a “class” and all are
          charged the same rate

         Within a class there is a wide range                                                    65% of drivers
          of miles driven                                                                         subsidize the other 35%

                                                                            Annual Miles Driven
         65% of drivers overpay for auto insurance

All materials are confidential
                  property of and property of                                                                               8
All materials are property of - Metromile
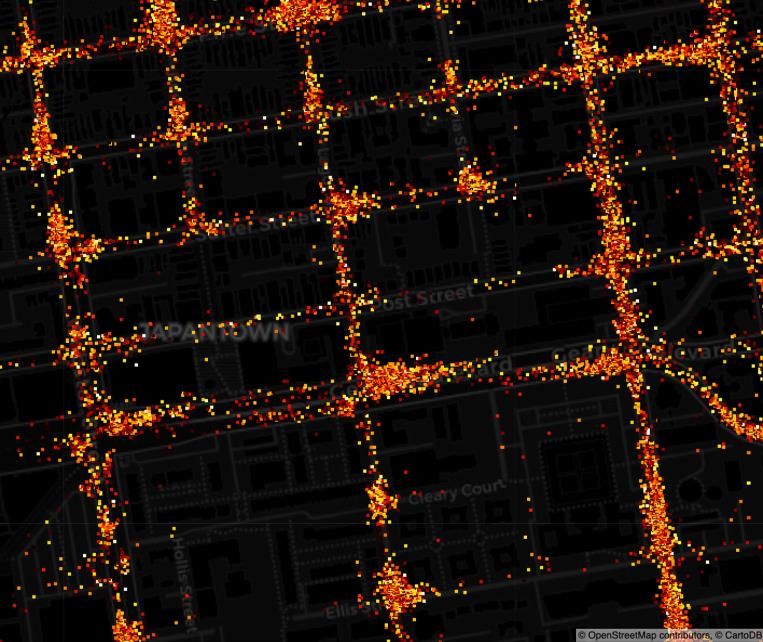
We aim to offer what
         no one else can…

         Insurance you pay for
         only when you use it.

All materials are property of    9
All materials are property of - Metromile
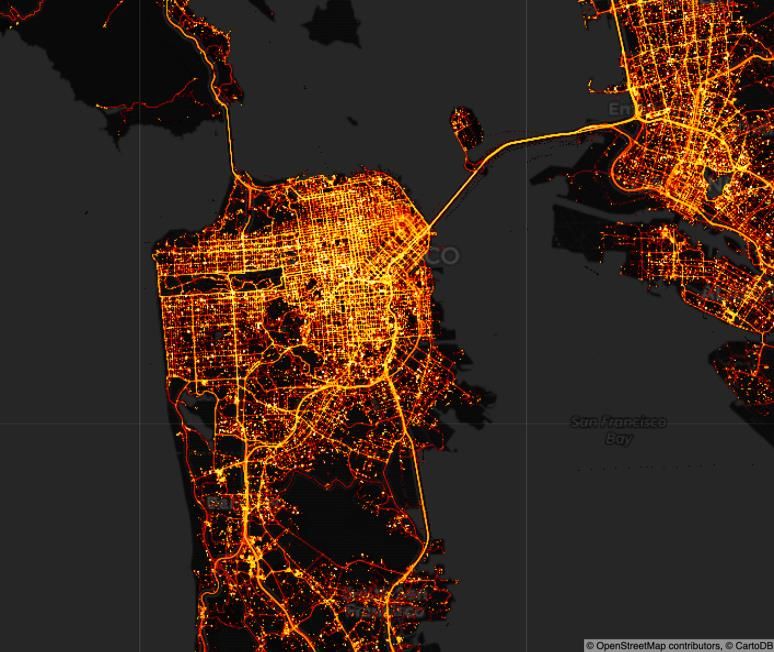
We are a data science company
            We are focused on auto insurance
            We are the world’s leading digital insurer

                           $111M               76%                     $1B               $48M
                   Q4 2020E insurance   average annual premium   2024E YE insurance    2024E Enterprise
                    premium run-rate       growth 2015-2019       premium run-rate     software revenue

                                2.8B           52%                    22%                  3.1x
                           miles data           Q2 2020                Q2 2020            Q2 2020
                           collected           loss ratio        contribution margin      LTV/CAC

All materials are property of                                                                             10
Investment Highlights
                 Massive, inefficient market
                 Incumbents are largely marketers with inequitable product offerings

                 Unique customer value proposition
                 65% of US drivers save, average savings of 47%

                 Data science driven economic advantages
                 Unique data and data science powers top line growth and profitability

                 Industry-leading unit economics
                 Profitable insurance operation today with expanding margin profile

                 Scaling rapidly through proven channels
                 Taking market share with unique acquisition models

                 Significant insurance revenue upside
                 Large market and high profit margin self-funds growth for many years ahead

                 Significant enterprise software revenue upside
                 Best-in-class enterprise software solution already deployed and scaling rapidly

                                                                                                   11
All materials are property of                                                                      11
Massive fragmented market

                              $250B           $700B              $363B                        $1.7T
                      US personal auto         global auto      US P&C personal      global P&C personal
                      insurance market      insurance market   insurance market1      insurance market

          US Auto Insurance Market Share¹
               State Farm
                                                                       No US carrier has more than
                     Geico
                                                                           20% market share
               Progressive

                   Allstate

                    USAA

             Liberty Mutual

                                                                   Over 110 carriers with greater than
         Farmers Insurance

               Nationwide

          American Family
                                                                     $100M in premium per year
                 Travelers

All materials are property of                                                         ¹S&P Global, based on 2019 Direct Premiums Written   12
Metromile is built for a changing world

        Traditional insurance                                                 Digital-first insurance
        is unprepared                                    Ubiquity of Mobile
                                                                              embraces this future

                  Built for a “class of driver”                                  Built for the individual
                  • Static rate by proxy                                         • Dynamic rate using sensors
                  • Six month billing cycle                                      • Billed by the mile

                  Static car/driver model                                        Dynamic vehicle use
                  • Ignores new mobility modes          New Mobility Modes       • Dynamic risk on/off by usage
                  • Ignores autonomous features                                  • Incorporates OEM data directly
                                                                                   into risk models

                  Low engagement                                                 High engagement
                  • Transactional                                                • Guided to your personal needs
                  • Set and forget                                               • Daily helpful features
                                                        Connected Vehicles
                  Low margin                                                     High margin
                  • Manual claims servicing                                      • End-to-end automated claims
                  • Margin created by investing float                            • Low fraud rates with
                                                                                   telematic reporting
                                                        Autonomous Vehicles

All materials are property of                                                                                       13
The only data science company in the
           world focused on auto insurance

                       More Data             Better Models             Better Products

                                         Personalized per-mile

                                OBD-2    Behavioral pricing
                                                                         Pay-per-mile car insurance

                                         Customer lifetime value

                                         Predictive maintenance

                       Mobile Phone      Parking ticket avoidance

                                         Claims approval automation

                                         Fraud detection
                                OEM

All materials are property of                                                                         14
Metromile is driving a digital evolution in auto insurance
                                                                              Pay only for what you
                                Sign Up      Connect
                                                                              use each month

                   Get a Quote & Buy       Metromile Pulse        Save more when you drive less

                                                                    $29
                                                                 Fixed fee based on
                                                               fixed operating costs
                                                                                       +     5.4¢/mile
                                                                                            Few cents per mile based
                                                                                            on personalized risk/mile

              Try before you buy with     Connected Vehicle   If you drive 2,500ml         Save: $961/yr
                   Ride along app
                  Save up to 40%+ more
                                                              If you drive 6,000ml         Save: $741/yr

                                                              If you drive 10,000ml        Save: $489/yr
                                                                                               Savings calculated as of 2018

All materials are property of                                                                                                  15
Our customers
       love Metromile                                                                 I've been using Metromile for 2 years now & it's everything I
                                                                                      had hoped it would be. My monthly bill is half of what I was
                                                                                      paying Geico... I filed a claim & they responded immediately

       Love fosters loyalty &                                                         & paid the claim ASAP. I love the dongle & the app, which
                                                                                      makes all of the basic processing super easy.

       word of mouth                                                                  — Steven W., Google Review

                                           47%
                                            Avg savings1
                                                                                      I always recommend Metromile, even over the insurance
                                                                                      company I work for! My 60-year-old mom is on my policy &
                                                                                      my 85-year-old grandma has her Metromile policy; so does

                     55                                                     75
                                                                                      my aunt.
                                                                                      — Kalona R., Customer Interview

                         NPS2                                           Claims NPS2

                                              4.7
                                                App store
                                                                                      Excellent customer service, excellent customer service
                                                                                      reps, very polite. Very easy to use app & I don't have to
                                                 rating                               worry about anything cuz y'all take care of the billing &
                                                                                      the automatic payment. Everything is way too easy.
1   Customers who reported savings when switching to Metromile as of 2018             — Julio M., NPS Survey
2   Scores as of end of Q2-20

All materials are property of                                                                                                                         16
Average Monthly Retention Per Policy

         + Better pricing          99%
                                                                     *Trailing 6-month average

         + In-app features
                                   98%

                                   97%

         + Better claim            96%

           experience
                                   95%

                                   94%
                                         1   11      21        31     41         51

                                                          Months

         = Customers stay
           with us longer       3.4 years                     5.2 years
                                Average life expectancy       Average life expectancy of
                                of a new policy               a policy in place over 1 year

All materials are property of                                                            As of Q2-20   17
Our focus on prioritizing unit economics over growth-at-all-costs has
      positioned us well to grow into a profitable and durable enterprise

              2012 - 2015                                2016-2017                2018 - 2019                        2020                   2021 - 2022

       OR        WA        CA        IL                Acquire Carrier
                                                                                        AZ                                                  Begin to scale
                                                                                                CM                                        existing states to
                                                        Build In-House         AVA
                                                       Claims Servicing                       Positive¹                                   1%+ market share
            NJ        PA        VA

                                                                                                                                         Expand nationwide

           Proven Model                              Full Stack Carrier          Positive Unit                    LTV > CAC                Profitability
         Build infrastructure                    Recapture economics with         Economics                                               Cash flow positive
         and prove product                         seamless experience
                                                                                                                 High—Margin
                                                                            Achieve unique economics
                                                                             as a fully digital insurer          SaaS Offering

                                                 +   Unit Economics

                                                                                                   +      Growth Engine

                                                                                                                                     Scale and
                                                                                                                                 +   Profitability
All materials are confidential and property of                                                                                                                               18
All materials are property of                                                                                                                 1 CM   = Contribution Margin   18
Metromile sustains superior unit
                    economics, while earning
                     fiercely loyal customers

All materials are property of                        19
As the world’s leading digital insurer,
            our technology enables superior unit economics

      Unique capabilities:                          Loyal customer benefits:           Industry leading economics:
       Fair pricing, paid by mile                   Customers save 47%                Lower CAC

       Try before you buy                           See & Earn more Savings           High referral rate

       An app for beyond the claim                  Everyday car help                 Higher Retention

       AI Accident Reconstruction                   Honest customers save more        Lower Loss Ratio

       End-to-end automated claims                  Instant claims handling           Lower Expense Ratio

                                                                                         = Higher LTV/CAC

                           For far too long, customer happiness and cost efficiency have been trade-offs.
                           Metromile’s technology ensures they are the same.
All materials are property of                                                                                  20
We understand driving down to the moment
            Actual Metromile telematics data (San Francisco – February 1, 2020)

           Driving behavior data from mobile phones, plug-in devices, and OEMs built directly into pricing and underwriting

All materials are property of                                                                                                 21
Traditional Process
                                                                          (Phone Calls + Fax)

                                                                       Accident
                                                                       happens

                                                                                                Claims intake
                                                                                                  30m call

                                                           Schedule
                                                         appointment
                                                          over phone

                                                                                                      Bring car
                                                                                                       to shop

                                                                  41%

       Simple automated claims built with data science            of customers who
                   using telematics data                          intend to switch
                                                                  insurance after a claim
All materials are property of                                                                                   22
Our Automated Fraud Discovery delivers 10%+
           improvement in contribution margin
                                                                                      Net Fraud Discovery
                                                                                          (% of Claims)

                 Traditional
                                •   Up to 17% of claims paid are fraudulent                 ~1%
                                •   Up to $8B excess payments annually
                 Insurers
                                •   ~3% profit lost

                                                                                              3x
                                    Algorithmic Accident Reconstruction
                                     replaces manual investigation
                                    More potential fraud cases identified
                                
                                
                                     More potential cases successfully investigated
                                     More confirmed fraud
                                                                                            3.2%

All materials are property of                                                                               23
We have consistently improved our unit economics
                                     Loss Ratio

                  101%
    100%
                                 83%      82%

      75%
                                                  73%                                                                                              Q220                        2024E
                                                             59%

                                                                                                            LTV/CAC                                3.1x                        5.5x
      50%
                   2016          2017     2018    2019       1H 20

                                Contribution Margin
      30%

      20%                                                    13%
      10%
                                                      1%
       0%
                                          (10%)                           Contribution Profit is defined as premiums, interest and other
    (10%)                        (17%)                                    income, minus losses, loss adjustment expense, taxes, bad
    (20%)        (25%)                                                    debt, payment processing fees, data costs, underwriting
    (30%)                                                                 reports, and other costs related to servicing policies.
                   2016          2017     2018        2019   1H 20

                                                                     2016 and 2017 ratios are inclusive of economics related to Metromile policies underwritten by a non-affiliated entity, prior to Metromile
All materials are property of                                                                                 becoming a full-stack insurance carrier. These economics are not reflected on Metromile's P&L.     24
                                                                      Contribution Margin is a non-GAAP financial measure and is defined as contribution profit over premiums, interest, and other income
We already enjoy industry-leading unit metrics
                                                                                                                                                                                                       Personal
                                                                       Metromile                                 Lemonade                                      Root
                                                                                                                                                                                                       Auto Avg
                                                                        (Q2 20)                                   (Q2 20)                                     (Q2 20)
                                                                                                                                                                                                        (2019)

             Annualized Premium                                             $995                                      $1902                                    $1,8186                                   $1,22110

             Loss Ratio                                                    52.4%                                     67.0%3                                    70.4%7                                    64.6%11

             Renewal Loss Ratio                                            48.8%                                       N/A                                     75.0%8                                      N/A

             One Year Retention                                            63.1%1                                    62.0%4                                    33.2%9                                      N/A

             LTV/CAC                                                          3.1x                                     1.1x5                                     N/A                                       N/A

         1Retention after one year, i.e. two policy terms, including adjustment for company initiated cancellations; 2 Premium per customer as per investor presentation; 3 Gross loss ratio including LAE; 4 One year retention as
         per S-1 adjusted for company initiated cancellations; 5 As per Thomvest Ventures research as of June 15, 2020; 6 Q2 20 annualized premiums for auto policies per S-1; 7 Q2 20 direct loss ratio per S-1; 8 LTM June 2020
         direct accident period renewal loss ratio per S-1; 9 Retention after one year, i.e. two policy terms, including adjustment for company initiated cancellations per S-1; 10 Average of 2019 average premiums per policy of
         State Farm, Allstate, Farmers, Nationwide, Liberty Mutual, Travelers, Mercury, GEICO, Progressive, USAA per William Blaire Research; 11 2019 loss ratio for US auto industry as per SNL Financial

All materials are property of                                                                                                                                                                                                         25
Our technology will continue to enhance our margin advantage

                                        Industry Average:
                Revenue
                 100%                   64%

              Premiums                                                                                                                    5.5x LTV/CAC
                100%                                           Loss                                                                              vs
                                                               62%                                                                      Industry Average:
                                             Loss Ratio
                                                                                                                                             1.5-2.0x¹
                                                63%

                                                                                                                                                         Industry Average:
                                                                 Industry Average:
                                                                 11%                                                                                     16%
                                                                                         LAE
                                                                                                                                     Cross-Sell
                                                                      Loss Adjustment     7%                                                                 Contribution
                                        ● 3x fraud                                                                                      2%
                                            identification                Expense                                Investment Income                             Margin
                                                                            7%                                         1%                                       28%
                                        ● 3% premium
                                            recovery through     70% of claims
                                            telematics           fully automated                 Servicing
                                            underwriting                                            6%
                                        ● Industry leading
                                                                                            Fully digital
                                            segmentation
                                                                                            servicing

                                                                                        2024 expected run rate

All materials are confidential and property of                                                                                                    ¹William Blair, based on 2019 numbers   26
All materials are property of                                                                                                                                                             26
Leveraging our infrastructure: Metromile Enterprise Software
           Metromile turns a cost-center into a substantial revenue opportunity

          Loss Adjustment                           ~25% gain in claims efficiency
          Expense                    $28B

                                                                                ~20% reduction
          Premium loss                 $8B
          due to fraud
                                                                                ~4% reduction

                                    Industry
                                    Average

       REPORT                   DETECT              PORTAL             STREAMLINE           REPLAY
  (Dynamic FNOL)            (Fraud Detection)   (Customer Portal)   (Process Automation)   (Telematics)

                                                                                                                      Our platform accrues a unique data advantage
                                                                                                                        as it scales across multiple deployments

             Launched in 2019, Metromile Enterprise is scaling to be a substantial contributor to operating profit
All materials are property of                                                                             1   Based on Metromile Insurance’s Financial Analysis & Claims Handling Time Study at Top US Carrier 27
Metromile is poised for
                                  substantial scale

All materials are property of                             28
Multiple channels of growth
                                                                                                                        Cross-sell Homeowners,
                                                                                                                        Renters, Pet, Warranties
                                                                                                                        & Maintenance

                                                                                                     Grow Enterprise
                                                                                                     Software Revenue
                                                                              Scale Partnerships &
                                                                              Ride Along Channels

                                                        Expand into markets
                                                        nationwide

                                Accelerate existing
                                footprint (30% of US)

             Now                                                                                                                       2021-2022

All materials are property of                                                                                                                      29
45M drivers can save with Metromile today, and 143M by 2022
                                           Representing $160B of potential premiums

                    Current (8)

                    2021 (21)

                    2022 (49)

All materials are property of                                                                   30
As markets scale, contribution margins improve
                                          25%

                                          20%
                                                                                                        WA
                                          15%
                   Contribution Margin

                                          10%                     IL                               CA
                                                                                                            OR
                                                         VA
                                           5%

                                           0%
                                                 0.00%   0.05%   0.10%        0.15%        0.20%    0.25%        0.35%
                                          (5%)                           AZ
                                                                                      NJ
                                         (10%)

                                         (15%)           PA

                                         (20%)

                                         (25%)

                                                                          Market Share
All materials are property of                                                                                            31
Expanded, optimized omnichannel customer growth engine

                                Lead Generation             Quote              Sign Up                               Acquired Customer

   Online

   Aggregators

   Auto OEM
   Partners

   Referrals:
   Ride Along App

           New Growth Channels
                                                        Cost Per Quote   Cost Per Acquisition                 Customer Acquisition Cost
                                                Q2
                                                            (CPQ)               (CPA)                                  (CAC)
                                              Results
                                                              $17                $91                                   $238*

All materials are property of
                                                                                                * Includes   underwriting fees and pulse device cost (cash basis)   32
Recent work improves our growth engine

                 2019 Q4                  2020 Q1                    2020 Q2                   2020 Q3                    Nov 2020

                 New affiliate            New quote engine           Launch of                 45 new affiliate           Auto OEM partnerships live
                 partner                                             Ride Along app            channels signed up
                                          ●   Lowered time-to-                                                            ●   Potential for 1M+ annual leads
                 underwriting                 quote from over 5 to                                                            at estimated CPA of $225
                                                                     ●   25% organic           ●   Highly scalable
                                              under 2 minutes            referral rate             channel with average
                 ●   Improved affiliate
                     partner channel                                                               $25 CPQ
                                          ●   Increased conversion   ●   20% conversion rate
                     retention by 55%         by 11%+

All materials are property of                                                                                                                                  33
Ride Along enables viral growth
                                                             11%                                                 25%
                                                                                                                   Referral rate
                                                              of abandoned quotes

                                                                                                                 20%
                                                              try Ride Along

                                                              Improves conversion of
                            Download the                      existing prospects
                            Metromile App                                                                        Conversion rate

                            Drive as usual for
                            ~2 weeks.

                            Estimate and save up
                            to an additional 40%*
                            for safe driving

                                                                              August                September                October

                                                                      New Ride Along Drivers Per Month

All materials are property of                       * Additional discount available in select states today; expected to expand in 2020Q4 and 2021   34
First major automotive OEM partnerships launching in Q4

           67.3m connected vehicles today             OEM connected to Metromile     Seamless targeted sales
                and growing rapidly¹                  New car owners drive 30 days    to low-mileage drivers

                                ¹ Statista Sep 2017

                                     1M+                                2                     8
                             Leads/year at                       OEMs connected to    OEMs expected to be
                         estimated CPA of $225                    Metromile today      connected by 2022
All materials are property of                                                                                  35
Covid has proven the durability of our model,
          but has been relatively neutral to our financial performance

         The Good                                            The Bad
         Paying per-mile saved our customers 30%+ on Day 1   Premium per customer declined 30%+ due to per-
                                                             mile billing
         Loss Ratio remained within target
                                                             Competitors’ lower loss ratios led to increasing
         Metromile a strong fit for work-from-home           marketing budgets and higher digital CPAs

         Bottom Line:
         Era of fixed price auto insurance
         is coming to an end
All materials are confidential
                  property of and property of                                                                   36
Metromile Enterprise is actively deployed                                                    4
                                                                                                       active
                                         Active Deployments                                         deployments
                                     A Top 10                 US
                                    US Carrier              Carrier              Insurance

                                                                                                       22
                                                                                                   deployments
                                                                                                     by 2022

        All values in $M        2019A     2020E    2021E         2022E        2023E    2024E

        Revenue                   0.8       5.6     12.4              21.7     33.7     48.3
                                                                                                        46
        Operating Profit         (2.8)     (0.9)    (1.2)             (1.9)     5.0      13.4     opportunities with
                                                                                                   global insurance
                                                                                                carriers in the pipeline

All materials are property of                                                                                              37
We are a capital-efficient full-stack insurance carrier

       Program Benefits
        ● Capital-efficient model
        ● Premium can grow with minimal increase in surplus
        ● More efficient cost of capital than alternatives
        ● Mitigates large/tail losses

                                      Current Program            Expected Go-Forward
                                      (expires April 30, 2021)

    Quota Share                                85%                      65%
    New policy one-time
                                    ~$313 per new policy                 $0
    commission
    Net cost of reinsurance
                                      ~14% over 5 years                 ~3%
    (as % of Gross Premium)
    RBC Ratio                                >300%                     >300%

 Current reinsurance partners

All materials are property of                                                          38
After achieving scalable profitability, we aim to achieve operating profitability in
           Q2 2022 and self-sustaining growth by YE 2023
            Metromile, Inc.                                                                                                      Actual                                                                                  Outlook
            All values in $M, except Policy and Avg Prem                                                     2016              2017       2018                       2019               2020               2021             2022                  2023                 2024
            Ending Policies (unaudited metric)                                                             41,098            56,268     81,504                     88,099              91,944           128,864          235,839               446,820               696,277

            Ending Bal - Annualized Prem (unaudited metric)                                                    44.0              63.0               97.0              106.0               111.0             176.0             328.0                686.0             1,099.0

            P&L
            Direct Earned Premium (MIC only)                                                                                                         82.1             102.2              101.5              140.6              253.2                  523.6              901.8
            Other Income1                                                                                                                             0.2                 1.0               1.0                 1.5                4.2                  11.4              29.3
            Insurance Revenue                                                                                                                       82.3              103.3             102.5                142.1             257.4                  535.0               931.1

            Direct Losses                                                                                                                           67.7                74.7              64.3                95.5             168.3                  337.3              564.3
            Direct LAE                                                                                                                              12.0                12.8               13.3               16.5               24.7                  40.2                61.2
            Servicing                                                                                                                                11.2               14.2               13.6               13.9              20.0                   34.0               50.5
            Contribution Profit                                                                                                                    (8.6)                  1.5      A       11.3               16.2               44.5                 123.5              255.1

            Revenue from Enterprise Segment                                                                                                                              0.8                5.6               12.4                21.7                 33.7               48.3
                                                                                                                                                       -
            EBS Specific Costs, Software Development and G&A                                                                                        32.7                 45.1              41.8               49.3                63.1                 70.2               78.5

            Operating Profit Before Acquisition Expense                                                                                           (41.2)             (42.8)             (24.8)             (20.7)                  3.1        B        87.1             225.0

            Total Acquisition Expenses                                                                                                              24.6                27.9               13.7              20.0                46.7                  94.9              128.0

            Operating Profit After Acquisition Expense                                                                                           (65.8)              (70.6)             (38.5)             (40.8)             (43.6)                  (7.8)      C        97.0
              All values represent non-GAAP measures, some (Direct Earned Premium, Direct Losses, Direct LAE, and Revenue from Enterprise Segment) which are derived from GAAP financial measures and some (Other Income, Servicing, EBS Specific Costs, Software
              Development and G&A, and Total Acquisition Expenses) which are unaudited. The underlying 2018-2019 GAAP financial measures are taken from Metromile, Inc. consolidated financial statements for the years ended December 31, 2018 and 2019. Metromile
              is in the process of finalizing its audits conducted under PCAOB standards for the years ended December 31, 2018 and 2019. A reconciliation to Non-GAAP Contribution Profit can be found on slide 44. 1 Other Income is comprised of interest income, cross-sell,
              and referral income.

All materials are property of                                                      A       Contribution Margin Positive: Q1 2019                     B       Op Margin (Less Acquisition Expense) Positive: Q2 2022                               C      Op Margin Positive: YE 2023   39
Investment summary

                Massive, inefficient market                              $250B                              65%
                                                                      US auto insurance               Drivers overpay

                Unique customer value proposition                          47%                               55
                                                                  Average customer savings            Customer NPS

                Data science driven economic advantages                    52%                               3x
                                                                     Q2 2020 Loss ratio        Fraud recovery over industry avg

                Industry-leading unit economics                            22%                              3.1x
                                                                 Q2 2020 contribution margin             LTV / CAC

                Scaling rapidly through proven channels                    $238                            20%
                                                                        Q2 2020 CAC              Ride Along conversion rate

                Significant insurance premium upside
Appendix

All materials are property of              41
Per-mile insurance is for all

                                  Age Distribution of Policies¹                                                                Metromile Credit Mix²

          25.00%                                                                                      35%

                                                                                                      30%
          20.00%

                                                                                                      25%

          15.00%
                                                                                                      20%

                                                                                                      15%
          10.00%

                                                                                                      10%

           5.00%
                                                                                                      5%

           0.00%                                                                                      0%
                      16-20     21-21   26-30   31-35   36-40   41-45   46-50   51-55   56-60   60+         No Hit   Thin   201-300   301-400   401-500   501-600   601-700   701-800       801+

                                                                                                                                                                                ¹ As of 9/1/2020
All materials are property of                                                                                                                                                    ² As of 10/31/20
                                                                                                                                                                                                    42
Non-GAAP reconciliations

            All values in $M, except percentages
                                                                                                                                                                                         2018            2019             1Q20              2Q20
            Total GAAP Revenue                                                                                                                                                          54.3             52.8               8.7               7.4

            Loss and LAE                                                                                                                                                               (40.7)          (30.8)              (5.4)             (2.4)
            Other Insurance Expense 1                                                                                                                                                  (23.1)          (26.9)              (7.3)             (6.9)

            Gross profit / (loss)                                                                                                                                                        (9.5)           (4.9)             (4.0)             (1.9)
            GAAP Gross Margin                                                                                                                                                           -17%              -9%             -46%              -25%

            Adjustment to Revenue 2                                                                                                                                                     28.0             50.5              16.5              15.3

            Adjustment to Cost of Revenue 3                                                                                                                                            (27.1)          (44.0)            (10.8)              (8.6)

            Non-GAAP Contribution Profit                                                                                                                                                 (8.6)            1.5               1.7               4.9
            Non-GAAP Contribution Margin                                                                                                                                                -10%               1%                7%              22%

            Note: Financial results taken from Metromile, Inc consolidated financial statements for the years ended December 31, 2019 and 2019. Metromile is in the process of finalizing its audits conducted under PCAOB standards for the years
            ended December 31, 2018 and 2019.
            1 Includes amortization of capitalized software and policy servicing expense and other
            2 Addition of reinsurance economics to go from Net premiums to Direct premiums, deduction of enterprise segment revenue, and addition of interest income and other
            3 Deduction of reinsurance economics to go from Net Loss and LAE to Direct Loss and LAE, amortization of internally developed software, device costs, and other policy servicing costs

All materials are property of                                                                                                                                                                                                                        43
Non-GAAP reconciliations

            All values in $M                                                                                         2018A               2019A               2020E               2021E               2022E               2023E               2024E

            GAAP Gross Profit                                                                                          (9.5)               (4.9)             (11.6)                 7.7               30.9              100.5               221.9

            Amortization of Internally Developed Software                                                              9.5                10.6                 9.4                 9.8                11.6               12.1                12.7
            Device Costs                                                                                               3.2                 3.9                 3.9                 5.5                 7.8               11.1                14.2
            Other Policy Servicing1                                                                                    7.0                 8.3                 9.4                 8.6                12.7               20.2                27.9
            Non-GAAP Adjusted Gross Profit                                                                            10.2                17.9                11.1                31.7                63.0              144.0               276.7

            Revenue Adjustments Related to Reinsurance 2                                                              27.8                49.4                73.1                83.0               140.2              276.0               459.2
            Revenue from Enterprise Segment                                                                              -                (0.8)               (5.6)              (12.4)              (21.7)             (33.7)              (48.3)
            Interest Income and Other3                                                                                 0.2                 1.9                 1.7                (1.1)                1.6                2.6                 1.0
            Adjustment to Revenue                                                                                     28.0                50.5                69.2                69.5               120.1              244.9               411.9

            Loss and LAE Adjustments Related to Reinsurance 4                                                        (39.2)              (56.7)              (59.5)              (75.7)            (125.4)             (245.3)             (406.6)
            Other Policy Servicing1                                                                                   (7.0)               (8.3)               (9.4)               (8.6)             (12.7)              (20.2)              (27.9)
            Bad Debt , Report Costs and Other Expenses                                                                (0.6)               (1.8)               (0.2)               (0.8)              (0.5)                0.2                 0.9
            Net Adjustment to Cost of Revenue                                                                        (46.8)              (66.9)              (69.0)              (85.1)            (138.6)             (265.3)             (433.5)

            Non-GAAP Contribution Profit                                                                               (8.6)                1.5               11.3                16.2                44.5              123.5               255.1

            Note: GAAP Gross Profit is defined as GAAP revenue less Losses, LAE and other insurance expenses; Adjusted Gross Profit is shown for illustrative purposes only and is not a metric Metromile uses to evaluate its financial performance;
            Contribution Profit is the measure Metromile uses to manage its business. Financial results taken from Metromile, Inc consolidated financial statements for the years ended December 31, 2019 and 2019. This information is preliminary
            and subject to change. Metromile is in the process of completing its audits conducted under PCAOB standards for the years ended December 31, 2018 and 2019.

            1Other policy servicing costs include payment processing costs, personnel costs and allocated overhead
            2 Addition of reinsurance economics to go from Net premiums to Direct premiums. Represents the net benefit of onboarding fee income (2018 to 2021 only), ceded premiums, and profit commissions related to quota share
            arrangements with reinsurers
            3 Includes interest income and bad debt expense
            4 Deduction of reinsurance economics to go from Net Loss and LAE to Direct Loss and LAE. Represents ceded losses and LAE related to quota share arrangements with reinsurers

All materials are property of                                                                                                                                                                                                                           44
Condensed Income Statement
           All values are in $M
           Consolidated Statements of Operations                                                                                                                               2018A                        2019A
           Revenue
            Premiums earned, net                                                                                                                                                $33.8                        $23.8
            Interest income                                                                                                                                                       1.4                          1.9
            Other revenue 1                                                                                                                                                      19.1                         27.1
           Total revenue                                                                                                                                                         54.3                         52.8

            Losses and loss adjustment expense                                                                                                                                   40.7                         30.8
            Policy servicing expense and other                                                                                                                                   13.6                         16.3
            Amortization of capitalized software                                                                                                                                  9.5                         10.6
           Gross profit                                                                                                                                                          (9.5)                        (4.9)

           Operating expenses
            Sales, marketing and other acquisition costs                                                                                                                         18.2                         24.0
            Research and development                                                                                                                                              6.4                          9.1
            Other operating expense                                                                                                                                              14.6                         18.9
           Loss from operations                                                                                                                                                 (48.7)                       (56.9)

           Other expense                                                                                                                                                          0.8                           0.3

           Net loss before tax                                                                                                                                                  (49.5)                       (57.2)

           Net loss after tax                                                                                                                                                  ($49.4)                      ($57.2)

           Total comprehensive loss2                                                                                                                                           ($49.4)                      ($57.2)
           Note: Condensed financial position has been derived from Metromile, Inc. consolidated financial statements as of December 31, 2018 and 2019, respectively. Metromile is in the process of finalizing audits
           conducted under PCAOB standards for the years ended December 31, 2018 and 2019.
           1 Other revenue consists of enterprise revenue, commission on NGI policies, and revenue related to policy acquisition costs
           2 Total comprehensive loss includes the impact of taxes and unrealized net gain on marketable securities

All materials are property of                                                                                                                                                                                            45
Condensed Balance Sheet
            All values are in $M
            Assets                                                                                                                                                                                   2018A                            2019A
            Cash, restricted cash, and cash equivalents                                                                                                                                             $112.8                             $42.9
            Marketable securities and restricted marketable securities                                                                                                                                 $3.2                            $46.3
            Premiums receivable                                                                                                                                                                        15.6                              16.6
                                               1
            Reinsurance recoverable                                                                                                                                                                    25.2                              41.4
            Prepaid reinsurance premium                                                                                                                                                                  8.8                             12.9
            Accounts receivable                                                                                                                                                                          5.7                              5.6
            Website and software development costs, net                                                                                                                                                15.0                              16.5
            Intangible assets, net                                                                                                                                                                       7.5                              7.5
            Telematics devices, improvements and equipment, net                                                                                                                                          6.9                             10.6
                             2
            Other assets                                                                                                                                                                               6.2                             10.2
            Total assets                                                                                                                                                                            $206.8                           $210.5

            Liabilities, convertible preferred, and stockholder's deficit                                                                                                                            2018A                            2019A
            Loss and loss adjustment expense reserves                                                                                                                                                 $41.2                            $52.2
            Ceded reinsurance premium payable                                                                                                                                                          23.0                             36.9
            Unearned premium reserve                                                                                                                                                                   14.1                             15.2
            Notes payable                                                                                                                                                                               1.6                             24.1
            Other liabilities3                                                                                                                                                                         10.9                            20.7
            Total liabilities                                                                                                                                                                         $90.9                          $149.0

            Convertible preferred stock                                                                                                                                                               304.5                            304.5

            Total stockholder's deficit                                                                                                                                                            ($188.6)                         ($243.0)

            Total liabilities, convertible preferred, and stockholder's deficit                                                                                                                     $206.8                           $210.5
           Note: Condensed financial position has been derived from Metromile, Inc. consolidated financial statements as of December 31, 2018 and 2019, respectively. Metromile is in the process of finalizing audits conducted under PCAOB
           standards for the years ended December 31, 2018 and 2019.
           1 Reinsurance recoverable on paid and unpaid losses
           2 Other assets includes prepaid expenses and other assets, deferred policy acquisition costs, net and receivable for securities
           3 Other liabilities includes payables to carriers – premiums and LAE net, deferred revenue, accounts payable and accrued expenses , payable for securities, deferred tax liabilities, warrant liability, and other liabilities

All materials are property of                                                                                                                                                                                                                   46
Condensed Statement of Cash Flows
           All values are in $M
           Cash flows from operating activities                                                                                                                                   2018A                                    2019A
           Net loss                                                                                                                                                               ($49.4)                                  ($57.2)
            Adjustments to reconcile net loss to cash used in operating activities
               Depreciation and amortization                                                                                                                                        14.3                                     15.7
               Changes in operating assets and liabilities 1                                                                                                                         4.6                                      8.5
            Other2                                                                                                                                                                   2.3                                      2.3
           Net cash used in operating activities                                                                                                                                  ($28.2)                                  ($30.7)

           Cash flows from investing activities                                                                                                                                   2018A                                    2019A
            Purchases of telematics devices, improvements, and equipment                                                                                                           ($5.2)                                   ($8.0)
            Payments relating to capitalized website and software development costs                                                                                                (10.2)                                   (12.2)
            Purchase of securities                                                                                                                                                (172.8)                                  (204.0)
            Sales and maturities of marketable securities                                                                                                                          184.4                                    160.9
           Net cash used in investing activities                                                                                                                                   ($3.8)                                  ($63.3)

           Cash flows from financing activities                                                                                                                                   2018A                                    2019A
            Proceeds from notes payable                                                                                                                                                -                                    $24.4
            Payment on notes payable                                                                                                                                                (3.2)                                    (1.7)
            Proceeds from insurance of convertible preferred stock - Series E, net of issuance cost                                                                                 90.5                                        -
            Proceeds from exercise of comon stock options and warrants                                                                                                               0.6                                      1.3
           Net cash provided by financing activities                                                                                                                               $87.8                                    $24.1

           Net increase (decrease) in cash, cash equivalents, restricted cash and restricted cash equivalents                                                                      $55.8                                   ($69.9)

           Note: Condensed financial position has been derived from Metromile, Inc. consolidated financial statements as of December 31, 2018 and 2019, respectively. Metromile is in the process of finalizing audits conducted under
           PCAOB standards for the years ended December 31, 2018 and 2019.
           1 Changes in operating assets and liabilities includes premiums receivable, accounts receivable, reinsurance recoverable on paid loss, reinsurance recoverable on unpaid loss, prepaid reinsurance premium, prepaid expenses

           and other assets, deferred policy acquisition costs net, accounts payable and accrued expenses, ceded reinsurance premium payable, loss and loss adjustment expense reserves, payable to carriers – premiums and LAE net,
           unearned premium reserve, deferred revenue, deferred tax liability, and other liabilities
           2 Other cash flows include change in fair value of warrant liability, amortization of debt issuance costs, noncash interest and other expenses, stock-based compensation, telematic devices unreturned and used in

           promotional activities

All materials are property of                                                                                                                                                                                                             47
You can also read