RDS 2021 Realistic Disaster Scenarios Scenario Specification January 2021 - Lloyd's of London
←
→
Page content transcription
If your browser does not render page correctly, please read the page content below
EM 337 v1.0

RDS 2021
Realistic Disaster Scenarios
Scenario Specification
January 2021

                               Classification: Confidential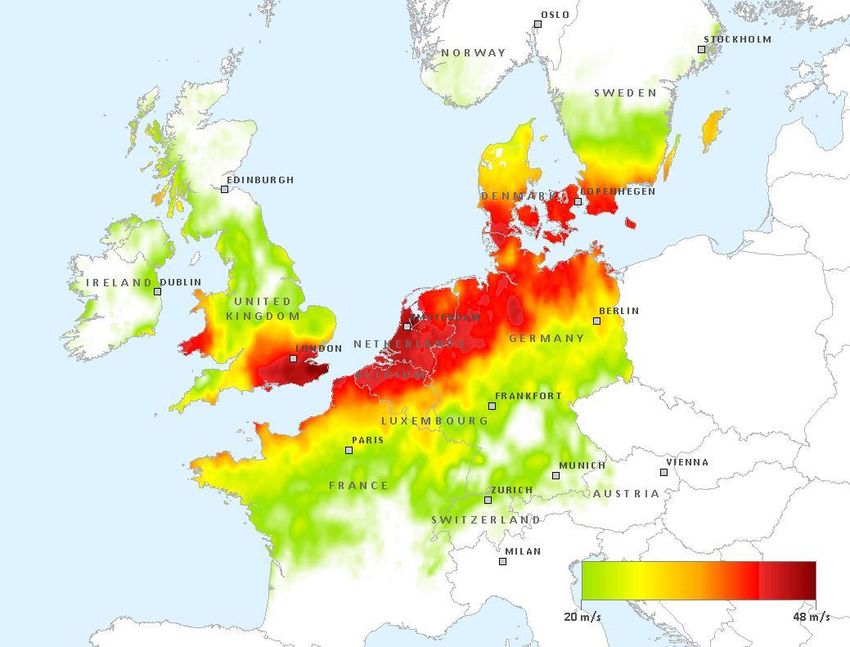
Key Contacts

Head of Portfolio Risk Management
Kirsten Mitchell-Wallace
020 7327 5839
kirsten.mitchell-wallace@lloyds.com

Exposure Management                               Outwards Reinsurance
Emma Watkins                                      Chris Wallings
020 7327 5719                                     020 7327 5048
emma.watkins@lloyds.com                           chris.wallings@lloyds.com
Steven Champion
020 7327 5983
steven.champion@lloyds.com
Ceara Howey
020 7327 6228
ceara.howey@lloyds.com
Charlie Melly
020 7327 6496
charlie.melly@lloyds.com
David Ryan
020 7327 6402
david.ryan@lloyds.com

Robin Knight
020 7327 5399
robin.knight@lloyds.com

                                      Classification: Confidential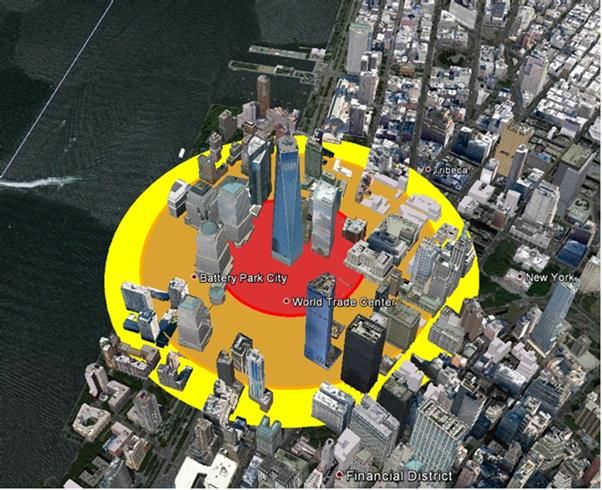
IT Support
ITG Data Management Helpdesk
020 7327 5252
ITGApplicationSupport2@lloyds.com

Acknowledgements
In producing the documentation for the RDS framework, Lloyd’s has worked closely with the Lloyd’s Market
Association (LMA) to incorporate market expertise via various market panels and groups. The assistance of the
individuals involved and the support of their respective organisations has been invaluable and their contribution is
greatly appreciated.

The spatial data used to generate the revised maps within this document were as follows: -
    • Gulf of Mexico blocks - the Bureau of Ocean Management (http://www.boem.gov/Oil-and-Gas-Energy
         Program/Mapping-and-Data/Maps-And-Spatial-Data.aspx);
    • all other maps - Natural Earth (http://www.naturalearthdata.com/downloads/)

Disclaimer
This document has been produced by Lloyd's for general information purposes only. While care has been taken in
gathering the data and preparing the document, Lloyd's does not make any representations or warranties as to its
accuracy or completeness and expressly excludes to the maximum extent permitted by law all those that might
otherwise be implied.
Lloyd's accepts no responsibility or liability for any loss or damage of any nature occasioned to any person as a
result of acting or refraining from acting as a result of, or in reliance on, any statement, fact, figure or expression of
opinion or belief contained in this document. This document does not constitute advice of any kind.

                                                    Classification: Confidential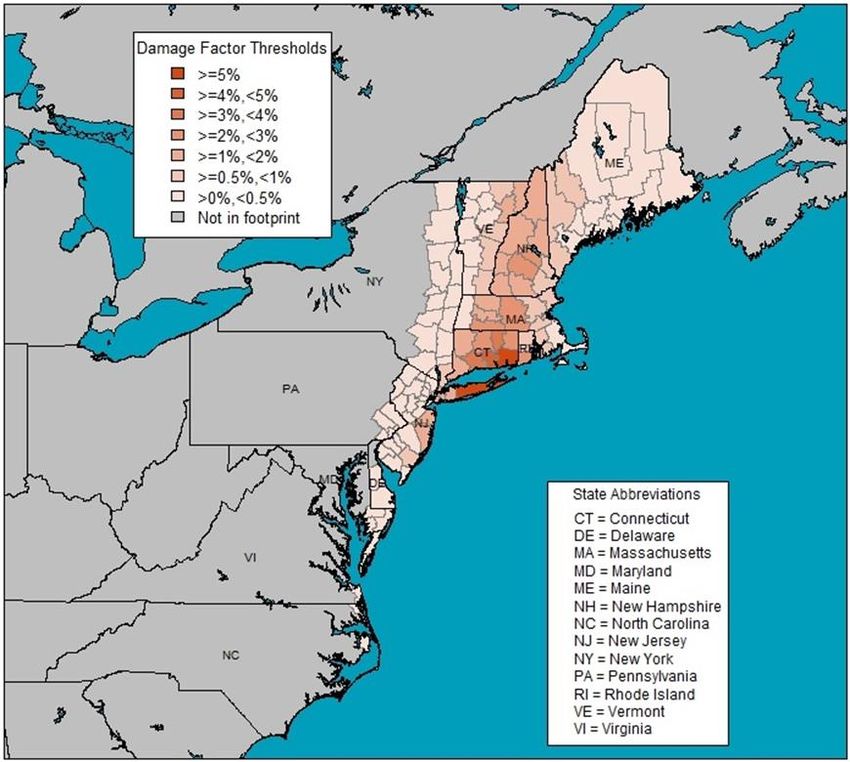
© Lloyd’s 2021 All rights reserved

                                     Classification: Confidential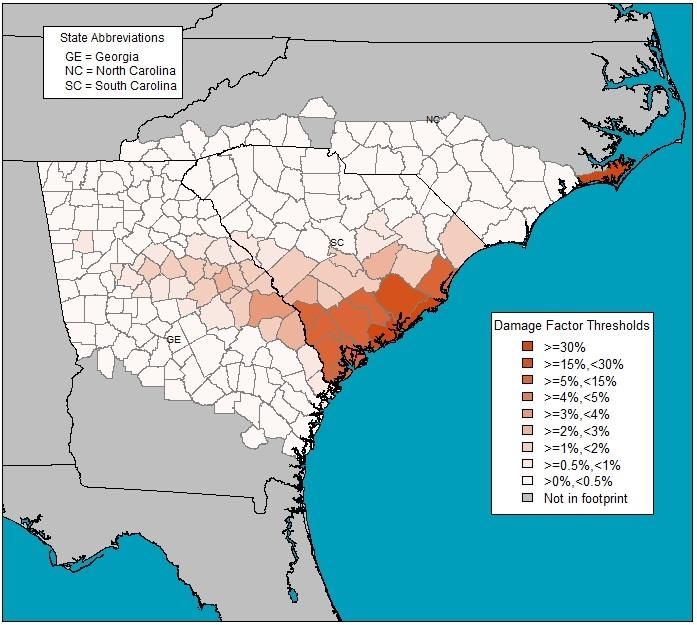
Document history
v1.0   December 2020   Original publication

                                  Classification: Confidential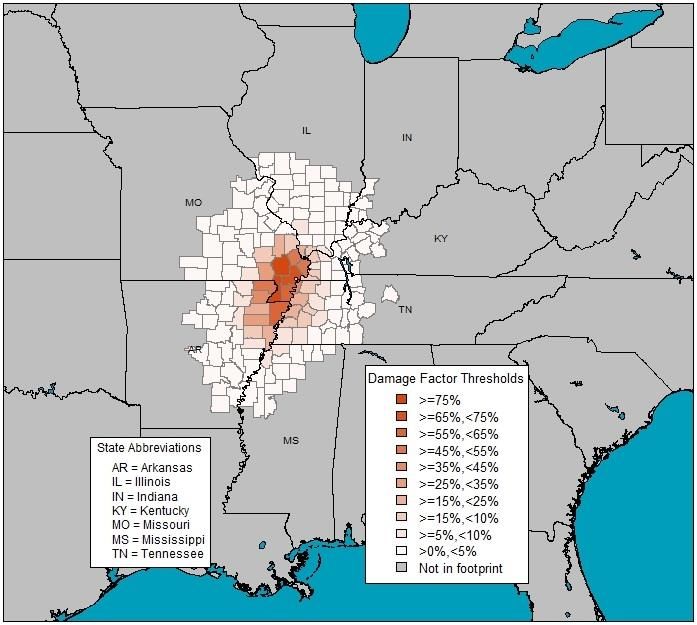
Contents
1    Introduction ............................................................................................................................................7

2    Two Windstorm events .......................................................................................................................10

3    Florida windstorm: Miami Dade .........................................................................................................15

4    Florida windstorm: Pinellas ...............................................................................................................17

5    Gulf of Mexico windstorm ..................................................................................................................19

6    European Windstorm ..........................................................................................................................22

7    Japanese typhoon ...............................................................................................................................24

8    California Earthquake : Los Angeles ................................................................................................26

9    California Earthquake : San Francisco .............................................................................................28

10   New Madrid earthquake ......................................................................................................................30

11   Japanese earthquake ..........................................................................................................................33

12   UK Flood................................................................................................................................................35

13   Terrorism: Rockefeller Center ...........................................................................................................37

14   Terrorism: One World T rade Center .................................................................................................39

15   Alternative scenarios A & B ...............................................................................................................40

16   Marine scenarios..................................................................................................................................42

17   Loss of major complex .......................................................................................................................43

18   Aviation collision .................................................................................................................................44

19   Satellite risks ........................................................................................................................................45

20   Liability risks ........................................................................................................................................48

21   Cyber - Major data security breach ...................................................................................................50

22   Political risks ........................................................................................................................................51

                                                                                                                                                             6

                                      Classification: Confidential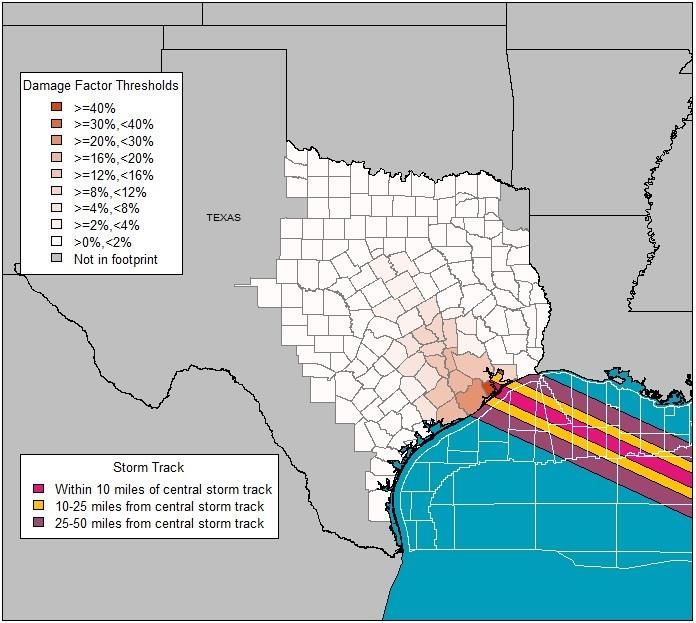
1    Introduction
     The purpose of this document is to describe the loss assumptions for each of Lloyd’s Realistic Disaster
     Scenarios [RDS].
     For information about Lloyd's 2021 reporting requirements, please see the 2021 RDS Guidance &
     Instructions.

1.1 Specification of the RDS events

     For each compulsory scenario (see section 1.2.1) this document contains: -
     •      a definition of the physical event, with a map showing the footprint or storm track;
     •      the assumed industry insured loss for property, split by primary class of business;
     •      additional lines of business that managing agents are recommended to consider;
     •      where applicable, a catalogue of major infrastructure (i.e. ports) that may be affected by the
            event;
     •      where applicable, supplementary information that managing agents are required to provide (i.e.
            offshore energy).

     For each de minimis scenario this document contains: -
     •      a description of the event, or type of event;
     •      additional information to the loss return which managing agents should provide;
     •      where applicable, examples of scenarios - or types of scenarios - which managing agents may
            choose;
     •      where applicable, assumptions about reinsurance protections.

     For details of the Political Risks scenarios, please see the separate 2021 RDS Political Risks Scenario
     Specification document which is available on request from Lloyd's Risk Aggregation team or the LMA
     Political Risks panel.

1.2 Scenarios
1.2.1 Compulsory scenarios

     There are sixteen compulsory scenarios which managing agents must complete for all syndicates.
     Lloyd's does not prescribe how managing agents should calculate losses from these scenarios. The
     Calculation Principles in the RDS Guidance & Instructions describe some possible methodologies and
     the reporting conditions applying to each.
     Managing agents who use the Lloyd's damage factors and/or Lloyd's suggested property distributions
     will find them in the RDS Damage Factors spreadsheets. Table 1 shows the scenarios for which this data
     is available.

                                                                                                               7

                                 Classification: Confidential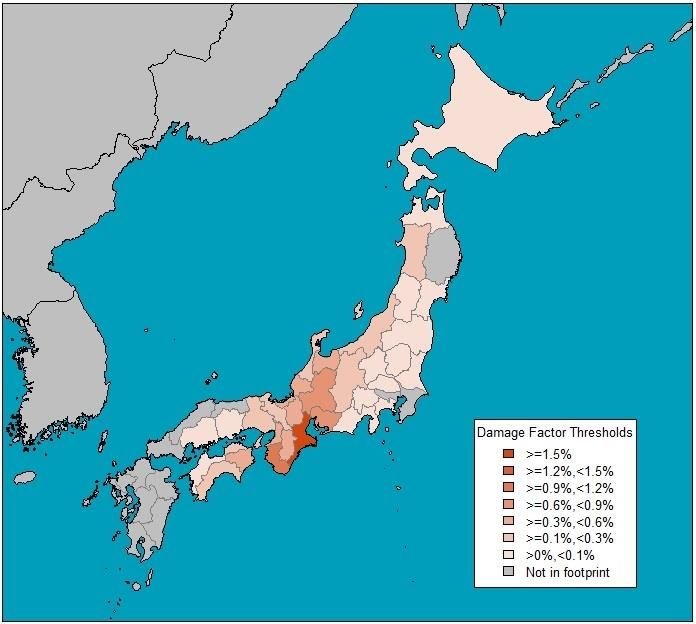
Lloyd’s property
                                                                        Lloyd’s damage-                        Scenario
                              RDS                      Industry Loss                       distribution tables
                                                                       factors provided?                          ID
                                                                                               provided?

        Two events – North-East windstorm               USD 81bn             Yes                   No               41

        Two events – South Carolina windstorm           USD 39bn             Yes                   No               42

        Florida Windstorm – Miami-Dade                  USD 131bn            Yes                   No               2

        Florida Windstorm – Pinellas                    USD 134bn            Yes                   No               3

                                            Onshore     USD 111bn            Yes                   No
        Gulf of Mexico Windstorm                                                                                    12
                                            Offshore    USD 7.1bn             No                   n/a

        European Windstorm                                € 24bn             Yes                   Yes              8

        Japanese Typhoon                                  ¥ 1.7trn           Yes                   Yes              13

        California Earthquake – Los Angeles             USD 78bn             Yes                   Yes              4

        California Earthquake – San Francisco           USD 80bn             Yes                   Yes              5

        New Madrid Earthquake                           USD 44bn             Yes                   Yes              6

        Japanese Earthquake                               ¥ 8trn             Yes                   Yes              9

        UK Flood                                        GBP 6.2bn             No                   No               51

        Terrorism – Rockefeller Center                      n/a               No                   No               43

        Terrorism – One World Trade Center                  n/a               No                   No               78
        Table 1

        Managing agents should report two further realistic events (Alternative A and B) that represent potential
        material impact to the syndicate but are not listed in either the compulsory or de minimis scenarios.

1.2.2   De minimis scenarios
        The following scenarios are subject to de minimis reporting. Please see RDS Guidance & Instructions
        2021 for definition of de minimis thresholds.

                                                         RDS                                             Scenario i/d

          1       Marine (two scenarios)                                                                    79,80
          2       Loss of Major Complex                                                                      17

          3       Aviation Collision                                                                         18

          4       Satellite risks (four scenarios)                                                       70,71,72,73

          5       Liability risks (two scenarios)                                                           53,54

          6       Cyber – Major Data Security Breach                                                         76

          7       Political risks (see RDS Political Risks Scenario Specification 2021 document)
        Table 2

                                                                                                                         8

                                       Classification: Confidential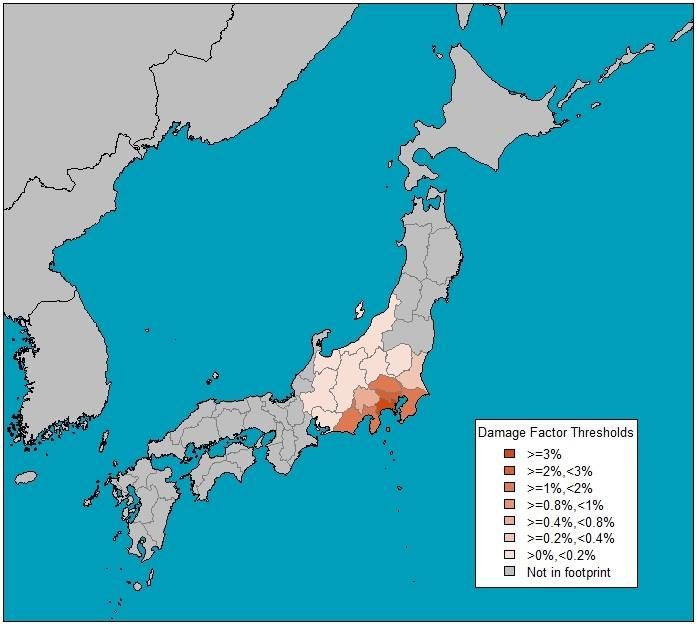
Compulsory
Scenarios

                                  9

   Classification: Confidential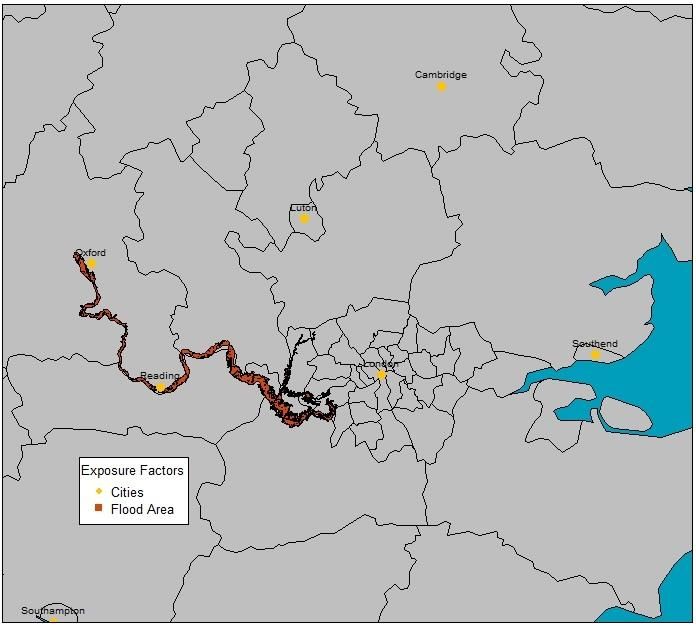
2    Two Windstorm events
     A North-East US hurricane, immediately followed by a South Carolina hurricane.
     Managing agents should return separate loss estimates for each event.
     Managing agents should assume that these events fall in the same reinsurance year, and that there has
     not been sufficient time between events to purchase add itional reinsurance protection.

2.1 Event definition 1 - North East hurricane
     A North East hurricane making landfall in New York State, including consideration of demand surge and
     storm surge. The hurricane also generates significant loss in the States of New Jersey, Connecticut,
     Massachusetts, Rhode Island and Pennsylvania.

2.1.1 Event footprint 1 – North East hurricane
     Map 1 illustrates the footprint and combined damage levels for the North East Hurricane Event.

     Map 1

                                                                                                         10

                               Classification: Confidential
2.1.2 Industry Loss Levels – North East hurricane
This event results in an estimated Industry Property Loss of USD81bn with the following components:
Residential Property $49.50bn
Commercial Property $31.50bn
Auto $1.75bn
Marine $0.75bn
Table 3
Managing agents should consider all other lines of business that would be affected, including:
1) Specie/Fine Art
2) Personal Accident
3) Aviation
4) Liability
5) Cancellation
2.1.3 Exclusion of Contingent Business Interruption Losses
Lloyd’s recognizes the difficulties involved in modelling losses from Contingent Business Interruption
(CBI) covers. Managing agents should therefore exclude CBI losses from this event.
2.2 Exposure information for North East hurricane
2.2.1 Major ports
Table 4 lists the main affected ports that managing agents should consider in assessing their potential
exposures. They should also consider smaller ports that fall within the footprint of the event.
Port County State
Camden Camden New Jersey
New York/New Jersey
Philadelphia Delaware Pennsylvania
Table 4
11
Classification: Confidential2.2.2 Major airports
Table 5 lists the main international airports in the affected areas. Managing agents should also have
regard to exposures in smaller airports that fall within the footprint of the event.
Airport County State
Atlantic City International Airport (ACY) Atlantic New Jersey
Bradley International Airport (BDL) Hartford Connecticut
Edward Lawrence Logan International Airport (BOS) Suffolk Massachusetts
John F. Kennedy International Airport (JFK) Queens New York
La Guardia Airport (LGA) Queens New York
Lehigh Valley International Airport (ABE) Lehigh Pennsylvania
Newark International Airport (EWR) Essex New Jersey
Philadelphia International Airport (PHL) Delaware Pennsylvania
Providence - T.F. Green Airport (PVD) Kent Rhode Island
Tetarboro Airport (TEB) Bergen New Jersey
Wilkes-Barre/Scranton International Airport (AVP) Luzerne Pennsylvania
Table 5
12
Classification: Confidential2.3 Event definition 2 – South Carolina hurricane
A hurricane making landfall in South Carolina, including consideration of demand surge and storm surge.
2.3.1 Event footprint 2 – South Carolina hurricane
Map 2 illustrates the footprint and combined damage levels for the South Carolina Windstorm Even t.
Map 2
2.3.2 Industry Loss Levels – South Carolina hurricane
This event results in an estimated Industry Property Loss of USD 39bn including consideration of storm
surge and demand surge. Managing agents should assume the following components of the loss.
Residential Property $26.00bn
Commercial Property $13.00bn
Auto $0.53bn
Marine $0.27bn
Table 6
Managing agents should consider all other lines of business that would be affected by the event.
Particular consideration should be given to losses arising from:
1) Specie/Fine Art
2) Personal Accident
3) Aviation
13
Classification: Confidential4) Liability
5) Cancellation
2.3.3 Reinsurance
For reinsurance purposes, managing agents should assume that the South Carolina hurricane falls in the
same reinsurance year as the North East hurricane, and that there has not been sufficient time between
events to purchase additional reinsurance protection.
2.4 Exposure information for South Carolina hurricane
2.4.1 Major Ports
Table 7 lists the main ports in South Carolina that would be affected by the windstorm that managing
agents should consider in assessing their potential exposures. They should also have regard to
exposures in smaller ports that fall within the footprint of the event.
Port County
Charleston Charleston
Georgetown Georgetown
Port Royal Beaufort
Table 7
2.4.2 Major Airports
Table 8 lists the main international airports in the affected areas, which managing agents should
consider in assessing their potential exposures. They should also have regard to exposures in smalle r
airports that fall within the footprint of the event.
Airport County
Charleston International Airport (CHS) Charleston
Greenville - Spartanburg International Airport (GSP) Greenville
Table 8
14
Classification: Confidential3 Florida windstorm: Miami Dade
3.1 Event definition
A Florida Windstorm landing in Miami-Dade County, including storm surge and demand surge.
3.1.1 Event footprint
Map 3 illustrates the event footprint and combined damage levels for the Miami -Dade Windstorm Event,
which are detailed in the 2021 RDS Damage Factors available from Lloyd’s.
Map 3
3.1.2 Industry Loss Level
This event results in an estimated Industry Property Loss of USD 131bn including consideration for storm
surge and demand surge. Managing agents should assume the following components of the loss: -
Residential Property $66.00bn
Commercial Property $65.00bn
Auto $2.25bn
Marine $1.00bn
Table 9
15
Classification: ConfidentialManaging agents should consider all other lines of business that would be affected by the event.
Particular consideration should be given to losses arising from:
1) Specie/Fine Art
2) Personal Accident
3) Aviation
4) Liability
5) Cancellation
3.1.3 Exclusion of Contingent Business Interruption Losses
Lloyd’s recognises the difficulties involved in modelling losses from Contingent Business Interruption
(CBI) covers. Managing agents should therefore exclude CBI losses from this event.
3.2 Exposure information
3.2.1 Major ports
Table 10 lists the main ports in Florida, which managing agents should consider in assessing their
potential exposures.
They should also have regard to exposures in smaller ports that fall within the footprint of the events.
Port County
Jacksonville Duval
Miami Miami-Dade
Palm Beach Palm Beach
Port Canaveral Brevard
Port Everglades Broward
Port Manatee Manatee
Tampa Hillsborough
Table 10
3.2.2 Major airports
Table 11 lists the main international airports in Florida, which managing agents should consider in
assessing their potential exposures.
They should also have regard to exposures in smaller airports that fall within the footprint of the events.
Airport County
Fort Lauderdale/Hollywood Broward
Miami Miami-Dade
Orlando Orange
Tampa Hillsborough
Table 11
16
Classification: Confidential4 Florida windstorm: Pinellas
4.1 Event definition
A Florida Windstorm landing in Pinellas County, including storm surge and demand surge.
4.1.1 Event footprint
Map 4 illustrates the footprint and combined damage levels for the Pinellas Windstorm Event, which are
detailed in the 2021 RDS Damage Factors that are available from Lloyd’s.
Map 4
4.1.2 Industry Loss Levels
This event results in an estimated Industry Property Loss of USD 134bn, including consideration for
storm surge and demand surge. Managing agents should assume the following components of the loss: -
Residential Property $94.5bn
Commercial Property $39.5bn
Auto $2.00bn
Marine $1.00bn
Table 12
Managing agents should consider all other lines of business that would be affected by the event.
Particular consideration should be given to losses arising from:
17
Classification: Confidential1) Specie/Fine Art
2) Personal Accident
3) Aviation
4) Liability
5) Cancellation
4.1.3 Exclusion of Contingent Business Interruption Losses
Lloyd’s recognises the difficulties involved in modelling losses from Contingent Business Interruption
(CBI) covers. Managing agents should therefore exclude CBI losses from this event.
4.2 Exposure information
Please see section 3.2 above.
18
Classification: Confidential5 Gulf of Mexico windstorm
5.1 Event definition
A Gulf of Mexico hurricane resulting in: -
• mainland property losses including the consideration of demand surge and storm surge; and
• offshore energy insured losses.
Managing agents should return a single combined loss (onshore and offshore) for this scenario.
5.2 Offshore component
5.2.1 Storm track
Map 5 below illustrates the damage track of the windstorm in the Gulf of Mexico.
Map 5
Position of centre of damage track: -
Start Latitude 25° 50’ 30.8401" North Longitude 86° 00’ 50.0400" West
End Latitude 30° 52’ 53.7600" North Longitude 98° 43’ 16.3200" West
Table 13
19
Classification: Confidential5.2.2 Industry Loss Levels - offshore
This event results in offshore energy insured loss of USD7.1bn (estimated USD17bn insurable loss).
5.3 Onshore component
5.3.1 Storm track - onshore
The map in section 5.2 highlights the footprint and combined damage levels for the onshore component
of the affected counties. These damage levels are detailed in the Event Damage Factor Tables that are
available from Lloyd’s.
5.3.2 Industry Loss Levels - onshore
This event results in onshore insured loss of USD111bn including consideration of storm surge and
demand surge. Managing agents should assume the following components of the loss: -
Residential Property $67.5bn
Commercial Property $43.5bn
Auto $1.00bn
Marine $1.00bn
Table 14
Managing agents should consider all other lines of business that would be affected by the event.
Particular consideration should be given to losses arising from:
1) Specie/Fine Art
2) Personal Accident
3) Aviation
4) Liability
5) Cancellation
5.3.3 Exclusion of Contingent Business Interruption Losses
Lloyd’s recognises the difficulties involved in modelling losses from Contingent Business Interruption
(CBI) covers. Managing agents should therefore exclude CBI losses from this event.
5.4 Exposure information
5.4.1 Major Ports
Table 15 lists the main ports in Texas that would be affected by the windstorm, which managing agents
should consider in assessing syndicate potential exposures. They should also have regard to exposures
in smaller ports that fall within the footprint of the event.
Port County
Beaumont Jefferson
Freeport Brazoria
Galveston Galveston
Houston Harris
Matagorda Ship Channel Calhoun
Orange Orange
Port Arthur Jefferson
Texas City Galveston
Victoria Victoria
Table15
20
Classification: Confidential5.4.2 Major Airports
Table 16 lists the main airports in Texas that would be affected by the windstorm, which managing
agents should consider in assessing their potential exposures. They should also have regard to
exposures in smaller airports that fall within the foo tprint of the event.
Airport County
Brazoria County Brazoria
Clover Field Brazoria
David Wayne Hooks Memorial Harris
Easterwood Field Brazos
Ellington Field Harris
George Bush Intercontinental Harris
Killeen Municipal Bell
Robert Gray Army Air Field Bell
Salaika Aviation Brazoria
Scholes International Galveston
Southeast Texas Regional Jefferson
Sugar Land Municipal Fort Bend
Victoria Regional Victoria
Waco Regional Mclennan
William P. Hobby Harris
Table 16
21
Classification: Confidential6 European Windstorm
6.1 Event definition
This event is based upon a low-pressure track originating in the North Atlantic basin resulting in an
intense windstorm with maximum/peak gust wind speeds in excess of 20 metres per second (45 mph or
39 knots). The stro ngest winds occur to the south of the storm track, resulting in a broad swath of
damage across southern England, northern France, Belgium, Netherlands, Germany and Denmark .
6.1.1 Storm track
Map 6 illustrates the windstorm track and affected regions (i mage courtesy of AIR Worldwide).
Map 6
6.1.2 Industry Loss Levels
This event results in an estimated Industry Property Loss of €24bn. Managing agents should assume the
following components of the loss: -
Residential Property €16.00bn
Commercial Property €6.5bn
Agricultural €1.50bn
Auto €0.75bn
Marine €0.40bn
Table 17
22
Classification: ConfidentialManaging agents should consider all other lines of business that would be affected by the event,
including: -
1) Specie/Fine Art
2) Personal Accident
3) Aviation
4) Liability
6.2 Exposure information
6.2.1 Property value distribution
Tables outlining Lloyd’s assumptions for the distribution of property values for this event are listed in the
2021 RDS Damage Factors that are available from Lloyd’s.
23
Classification: Confidential7 Japanese typhoon
7.1 Event definition
This event is based on the Isewan (‘Vera’) typhoon event of 1959.
7.1.1 Storm track
Map 7 highlights the footprint and residential ground-up damage levels for the Japanese typhoon event.
These damage levels are detailed in the Event Damage Factor Tables that are available fro m Lloyd’s.
Map 7
7.1.2 Industry Loss Levels
This event results in a present-day Industry Property Loss estimate of ¥1.7trn. Managing agents should
assume the following components of the loss: -
Residential Property ¥750bn
Commercial Property ¥950bn
Marine ¥50bn
Table 18
Managing agents should consider all other lines of business that would be affected by the event,
including particularly: -
24
Classification: Confidential1) Specie/Fine Art
2) Personal Accident
3) Aviation
4) Liability
5) Marine
7.2 Exposure information
7.2.1 Property value distribution
Lloyd’s assumptions for the distribution of property values at prefecture level are detailed in the 20 21
RDS Damage Factors that are available from Lloyd’s.
7.2.2 Major Ports
Table 19 below lists the main Japanese ports in the Typhoon Isewan (Vera) footprint, which managing
agents should consider in assessing syndicate potential exposures. They should also have regard to
exposures in smaller ports that fall within the footprint of the event.
Port
Chiba Port
Nagoya Port
Yokohama Port
Kawasaki Port
Mitzushima Port
Kitakyushu Port
Tokyo Port
Osaka Port
Tomakomai Port
Kobe Port
Table 19
7.2.3 Major Airports
Table 20 lists the main international and domestic airports potentially impacted by the Typhoon, which
managing agents should consider in assessing syndicate potential exposures.
Airport
Narita International Airport
Central Japan International Airport
Kansai International Airport
Tokyo International Airport
Osaka International Airport
Table 20
25
Classification: Confidential8 California Earthquake: Los Angeles
8.1 Event definition
An earthquake causing major damage to Los Angeles from shake and fire-following, gross of take-up
rates and including consideration of demand surge.
8.1.1 Event footprint
Map 8 illustrates the footprint and residential, ground-up shake damage levels for the Los Angeles
earthquake event.
Map 8
8.1.2 Industry Loss Levels
This event results in an estimated USD78bn Industry Property Loss (shake and fire following), after
taking into account take-up rates but before applying policy terms. Demand surge is included. Managing
agents should assume the following components of the loss:
Residential Property $36.00bn
Commercial Property $42.00bn
Workers Compensation $5.50bn
Marine $2.25bn
Personal Accident $1.00bn
Auto $1.00bn
Table 21
26
Classification: ConfidentialManaging agents should consider all other lines of business that would be affected by the event.
Particular consideration should be given to losses arising from:
1) Specie/Fine Art
2) Liability
3) Cancellation
4) PA and WCA losses – it should be assumed that there will be 2,000 deaths and 20,000 injuries as a
result of the earthquake. Managing agents shoul d assume that 50% of those injured will have PA
cover.
5) Estimation of Aviation Hull losses – Lloyd’s has commissioned research that indicates that minimal
Aviation Hull losses would be expected to arise from an earthquake. Managing agents should take
account of these findings in calculating syndicate loss estimates.
8.1.3 Exclusion of Contingent Business Interruption Losses
Lloyd’s recognises the difficulties involved in modelling losses from Contingent Business Interruption
(CBI) covers. Managing agents should th erefore exclude CBI losses from this event.
8.2 Exposure information
8.2.1 Property value distribution
Lloyd’s assumptions for the distribution of property values are detailed in the 2021 RDS Damage Factors
spreadsheet available from Lloyd’s.
8.2.2 Major Ports
Table 22 lists the main ports in California, which managing agents should consider in assessing th eir
potential exposures. They should also give regard to exposures in smaller ports that fall within the
footprint of the events.
Port County
Long Beach Orange
Los Angeles Los Angeles
Oakland Alameda
Port Hueneme Ventura
Richmond Contra Costa
San Diego San Diego
San Francisco San Francisco
Stockton San Joaquin
Table 22
8.2.3 Major Airports
Table 23 lists the main international airports in California, which managing agents should consider in
assessing their potential exposures. They should also have regards to exposures in smaller airports that
fall within the footprint of the events.
Airport County
Los Angeles (LAX) Los Angeles
San Diego-Linderbergh (SAN) San Diego
San Francisco (SFO) San Francisco
San Jose (SJC) San Jose
Table 23
27
Classification: Confidential9 California Earthquake: San Francisco
9.1 Event definition
An earthquake causing major damage to San Francisco, from shake and fire-following, gross of take-up
rates and including consideration of demand surge.
9.1.1 Event footprint
Map 9 illustrates the footprint and residential, ground-up shake damage levels for the San Francisco
earthquake event.
Map 9
9.1.2 Industry Loss Levels
This event results in an estimated USD80bn Industry Property Loss (shake and fire following), after
taking into account take-up rates but before applying policy terms. Demand surge is included. Managing
agents should assume the following components of the loss:
Residential Property $40.00bn
Commercial Property $40.00bn
Workers Compensation $5.50bn
Marine $2.25bn
Personal Accident $1.00bn
Auto $1.00bn
Table 24
28
Classification: ConfidentialManaging agents should consider all other lines of business that would be affected by the event.
Particular consideration should be given to losses arising from:
1) Specie/Fine Art
2) Liability
3) Cancellation
4) PA and WCA losses – it should be assumed that there will be 2,000 deaths and 20,000 injuries as a
result of the earthquake. Managing agents should assume that 50% of those injured will have PA
cover.
5) Estimation of Aviation Hull losses – Lloyd’s has commissioned research that indicates that minimal
Aviation Hull losses would be expected to arise from an earthquake. Managing agents should take
account of these findings in calculating syndicate loss estimates.
9.1.3 Exclusion of Contingent Business Interruption Losses
Lloyd’s recognises the difficulties involved in modelling losses from Contingent Business Inter ruption
(CBI) covers. Managing agents should therefore exclude CBI losses from this event.
9.2 Exposure information
See section 8.2.
29
Classification: Confidential10 New Madrid earthquake
10.1 Event definition
An earthquake causing major damage within the New Madrid Seismic Zone (‘NMSZ’), from shake and
fire-following, gross of take-up rates and including consideration of demand surge.
10.1.1 Event footprint
Map 10 illustrates the footprint and residential, ground-up shake damage levels for the New Madrid
earthquake event.
Map 10
10.1.2 Industry Loss Levels
This event results in an estimated USD44bn Industry Property Loss (shake and fire following), after
taking into account take-up rates but before applying policy terms. Demand surge is included. Managing
agents should assume the following components of the loss:
30
Classification: ConfidentialResidential Property $30.50bn
Commercial Property $13.50bn
Workers Compensation $2.50bn
Marine $1.50bn
Personal Accident $0.50bn
Auto $0.50bn
Table 25
Managing agents should consider all other lines of business that would be affected by the event.
Particular consideration should be given to losses arising from:
1) Specie/Fine Art
2) Liability
3) Cancellation
4) PA and WCA – it should be assumed that there will be 1,000 deaths and 10,000 injuries as a result
of this earthquake. Managing agents should assume that 50% of those injured will have PA cover.
5) Aviation – Lloyd’s has commissioned research that indicates th at minimal Aviation Hull losses
would be expected to arise from an earthquake. Managing agents should take account of these
findings in calculating syndicate loss estimates.
6) Business Interruption – overland transport systems are severely damaged and business impacted,
leading to significant business interruption exposure for a period of 30 days. This is restricted to the
inner zone of maximum earthquake intensities (highlighted on the event footprint).
10.2 Exposure information
10.2.1 Property value distribution
Lloyd’s assumptions for the distribution of property values are detailed in the 2021 RDS Damage Factors
spreadsheet available from Lloyd’s.
10.2.2 Major Ports
Table 26 lists the main ports in the NMSZ, which managing agents should consider in assessing
syndicate potential exposures. They should also have regard to exposures in smaller ports that fall within
the footprint of the events.
Port County State
Pascagoula Jackson Mississippi
Gulfport Harrison Mississippi
South Louisiana St John the Baptist Mississippi
Baton Rouge West Baton Rouge Louisiana
Mobile Mobile Alabama
Memphis Shelby Tennessee
St. Louis St Louis Missouri
Table 26
31
Classification: Confidential10.2.3 Major Airports
Table 27 lists the main domestic and international airports in the NMSZ, which managing agents should
consider in assessing syndicate potential exposures. They should also have regard to exposures in
smaller ports that fall within the footprint of the even ts.
Airport County State
Jonesboro Municipal Craighead Arkansas
Cape Girardeau Regional Scott Missouri
Barkley Regional McCracken Kentucky
McKellar-Sipes Regional Madison Tennessee
Memphis International Shelby Tennessee
Lambert-St Louis International Saint Louis Missouri
Table 27
32
Classification: Confidential11 Japanese earthquake
11.1 Event definition
This event is based on the Great Kanto earthquake of 1923.
11.1.1 Event footprint
Map 11 illustrates the footprint and residential, shake only damage levels for Japan, which are detailed in
the Event Damage Factor Tables that are available from Lloyd’s.
Map 11
11.1.2 Industry Loss Levels
This event results in a present-day Industry Property Loss estimate of ¥8trn. Managing agents should
assume the following components of the loss:-
Residential Property ¥2.5trn
Commercial Property ¥5.5trn
Marine ¥150bn
Personal Accident ¥50bn
Table 28
33
Classification: ConfidentialManaging agents should consider all other lines of business that would be affected by the event.
Particular consideration should be given to losses arising from:
1) Personal Accident - it should be assumed that 2,000 deaths and 20,000 injuries will arise as a
result of this major earthquake. Assume that 50% of those injured will have PA cover.
2) Liability Business
3) Aviation - following research undertaken by Lloyd’s, managing agents should assume that minimal
Aviation Hull losses will arise from an earthquake of this magnitude.
4) Business Interruption - overland transport systems are severely damaged and businesses
impacted, leading to significant business interruption exposure for a period of 60 days. This is
restricted to the inner zone of maximum earthquake intensities (highlighted on Event footprint).
11.2 Exposure information
11.2.1 Property value distribution
Lloyd’s assumptions for the distribution of property values at prefecture level are detailed in the 20 21
RDS Damage Factors that are available from Lloyd’s.
11.2.2 Major Ports
Table 29 lists the main ports in the Great Kanto footprint, which managing agents should consider in
assessing syndicate potential exposures. They should also have regard to exposures in smaller ports
that fall within the footprint of the event.
Port
Chiba Port
Nagoya Port
Yokohama Port
Kawasaki Port
Mizushima Port
Kitakyushu Port
Tokyo Port
Osaka Port
Tomakomai Port
Kobe Port
Table 29
11.2.3 Major Airports
Table 30 below lists the main international and domestic airports potentially impacted by the Great Kanto
earthquake event, which managing agents should consider in assessing syndicate potential exp osures.
They should also have regard to exposures in smaller airports that fall within the footprint of the event.
Airport
Narita International Airport
Central Japan International Airport
Kansai International Airport
Tokyo International Airport
Osaka International Airport
Table 30
34
Classification: Confidential12 UK Flood
12.1 Event definition
This scenario is based on a heavy rainfall event moving from west to east across south east England
resulting in extensive flooding of the River Thames from Oxford to Teddington with secondary flooding
on the River Colne from Ruislip south and surface flooding on the western and southern edges of
Heathrow. The total flood extent covers 194 km 2 and would cause significant impact on the major
populated areas of Oxford, Reading, Slough, and the Henley areas of western London.
12.1.1 Event footprint
Map 12 illustrates the flood footprint for the UK flood event.
Map 12
12.1.2 Industry loss levels
This event results in an Industry Property Loss of £6.2bn. Managing agents should assume the f ollowing
components of the loss:
Residential £4.50bn
Commercial/Industrial £1.60bn
Agriculture £0.05bn
Motor £0.05bn
Table 31
35
Classification: ConfidentialManaging agents should also consider other lines of business that may be affected by the event.
Particular consideration should be given to the potential for losses arising from:
1) Cargo
2) Specie/Fine Art
3) Cancellation (Event \ Travel)
12.1.3 Event duration
Managing agents should assume that the flood event will not exceed 168 hours.
12.2 Other loss characteristics
12.2.1 Major roads
Table 32 lists the major roads within the flood footprint which managing agents should consider in
assessing business interruption:
Major Roads
M25
M3
M4
A40
A34
A404
A437
A4180
Table 32
12.2.2 Major rail
Rail disruption will occur between London (Waterloo) and western services towards Oxford, Bristol, and
Cardiff. There will be little disruption to the London Underground system except for flooding of Pinner
station on the Metropolitan line.
12.2.3 Heathrow airport
Surface flooding will cause disruption to Heathrow Airport with flooding from the west encroaching into
Terminal 5 and the end of both runways. Further flooding from the south will affect cargo transit and
handling facilities.
12.2.4 Treatment of pollution
Managing agents are advised that pollution may follow the flood event. Although no specific details are
provided here, managing agents should consider the impact and operation of Seepage and Pollution
exclusions, and consider the impact of pollution as an aggravating factor in residential losses. Managing
agents may wish to refer to historical analogues, including the Carlisle floods of 2005. The impact of
pollutants should also be considered for indirect losses at London Heathrow airport. Liability associated
with potential pollution episodes will be difficult to calculate and as such should not be included in
managing agents’ assumptions.
12.2.5 Contingent Business Interruption Losses
Wherever possible, managing agents should consider the potential for additional losses from Named
Customer/Supplier extensions in respect of policies identified as sustaining direct losses. For the
purpose of the RDS, the potential for CBI losses from policies not directly affected by the flood event can
be discounted.
36
Classification: Confidential13 Terrorism: Rockefeller Center
13.1 Event definition
The Midtown Manhattan area, New York, at 11:00am on 1 January 2021 suffers a 2 tonne bomb blast
attack causing:
Property
Zone Impact Description Damage Zones Fire Loss
Damage
1 Collapse and fire following Inner zone, radius 200m 100% 10%
2 Massive debris damage to surrounding 400m radius 25% 2.5%
properties
3 Light debris damage to surrounding 500m radius 10% 1%
properties
Table 33
Radii measurements are taken from the Rockefeller Center as a reference point.
Figure 1
37
Classification: Confidential13.2 Loss characteristics
13.2.1 Number of Deaths and Injuries
1,000 blue/white collar worker deaths in total and 2,500 injuries in total. Managing agents to determine a
worst case split across lines of business (WCA, PA, Group PA, etc.) and document assumptions using
the commentary facility in CMR form 990. The following percentage split should be used for non-fatal
injuries:
• 14% life threatening
• 35% moderate
• 51% minor
13.2.2 Business Interruption
Overland/underground transport systems are partially damaged, leading to significant business
interruption exposure for a period of three months.
13.2.3 Affected Classes of Business
All possible affected business classes should be included in the calculations, such as Contingent
Business Interruption and Specie/Fine Art.
13.2.4 Fire Following
Taking ‘Fire Following’ into consideration, managing agents should assume the same damage zones
with the appropriate Fire Loss percentage ap plied. Managing agents should assume that all property
policies are impacted, given the New York state ruling that property policies cannot exclude fire. Any
assumptions concerning Fire-Following Terrorism are to be documented using CMR form 990.
13.2.5 ‘CBRN’ Status
It should be assumed that there are no Chemical, Biological, Radiological or Nuclear hazard exposures
arising from these events.
13.2.6 Granularity of Treaty Exposures
Syndicates with low resolution treaty exposure data should use a damage factor based upon claims
experience from the World Trade Center attacks of 2001.
38
Classification: Confidential14 Terrorism: One World Trade Center
14.1 Event definition
The lower Manhattan area, New York, at 11:00am on 1 January 2021 suffers a 2 tonne bomb blast
attack causing:
Property
Zone Impact Description Damage Zones Fire Loss
Damage
1 Collapse and fire following Inner zone, radius 200m 100% 10%
Massive debris damage to surrounding
2 400m radius 25% 2.50%
properties
Light debris damage to surrounding
3 500m radius 10% 1%
properties
Table 34
Radii measurements are taken from One World Trade Center as a reference point.
Figure 2
14.2 Loss characteristics
The loss characteristics for this event are the same as for Terrorism: Rockefeller Plaza. Please see
section 13.2 above for details.
39
Classification: Confidential15 Alternative scenarios A & B
Managing agents should report two further realistic events that represent the most material accumulation
risks that are not already covered by compulsory or de minimis scenarios.
Examples include:
1) Earthquakes other than those occurring in the US (California, New Madrid) and Japan – for
example in China, Australia, South America, New Zealand;
2) A ‘Selby-type’ liability loss;
3) A major flood incident;
4) Accumulation of casualties to members of sports team
5) Caribbean/USA hurricane windstorm clash;
6) Pandemic risk;
7) Terrorism accumulations other than Manhattan;
40
Classification: ConfidentialScenarios subject
to de minimis
reporting
41
Classification: Confidential16 Marine scenarios
Managing agents should return a marine loss scenario for both of the following inciden ts. In both
scenarios, excess layers of liability, hull and cargo should be included, based on maximum Aggregate
exposures.
Please note that for both scenarios, liability costs exceed the coverage afforded by the International
Group Programme. Please consider any other covers in force at 1st January 2021 that may be impacted,
both Marine and Non-Marine, e.g. Personal Accident and D&O.
16.1 Scenario 1 - Marine Collision in US waters
A cruise vessel carrying 2,000 passengers and 800 staff and crew is involved in a high energy collision
with a fully laden tanker of greater than 50,000 DWT with 20 crew.
The incident involves the tanker sinking and spilling its cargo; there are injuries and loss of lives aboard
both vessels.
Assume 30% tanker owner/70% cruise vessel apportionment of negligence, and that the collision occurs
in US waters.
Assume that the cost of pollution clean -up and compensation fund amounts to USD2bn. This would
result in claims against the International Group of P&I Associations’ General Excess of Loss
Reinsurance Programme, and any other covers that might be in force.
Assume an additional compensation to all passengers and crew for death, injury or other costs of
USD1.15bn and removal of wreck for the Tanker of USD100m. The cruise ship is severely damaged but
is towed back to a safe harbour (repair estimate USD50m and USD10m for salvage operations).
16.2 Scenario 2 - Major Cruise Vessel Incident
A US owned cruise vessel carrying 4,000 passengers and 1,500 staff and crew is sunk w ith attendant
loss of life, bodily injury, trauma and loss of possessions.
Assume a final settlement of USD3.2bn for all deaths, injuries and other associated costs. In addition,
assume an additional Protection and Indemnity loss of USD1.15bn to cover removal of wreck and
USD75m for Pollution.
42
Classification: Confidential17 Loss of major complex
Assume a total loss to all platforms and bridge links of a major complex.
Include property damage, removal of wreckage, liabilities, loss of production income and capping of well.
Managing agen ts should use the commentary facility in form 990 (supplementary scenario information)
to name the complex and to provide details of modelling assump tions. Should a mobile drilling rig
present potential material exposure to a syndicate, managing agents may wish to report this under the
Alternative A or B scenario.
43
Classification: Confidential18 Aviation collision
Assume a collision between two aircraft over a major city, anywhere in the world, using the syndicate’s
two highest airline exposures. Assume a total liability loss of up to USD4bn: comprising up to USD2bn
per airline and any balance up to USD1bn from a major product manufacturer’s product liability
policy(ies) and/or an air traffic control liability policy(ies), where applicable.
Consideration should be given to other exposures on the ground.
Assumptions should be stated clearly using the event commentary facility in form 990.
Managing agents should include the following information in their return;
1) the city over which the collision occurs;
2) the airlines involved in the collision;
3) the airlines policy limits and syndicate’s line and exposure per policy;
4) maximum hull value per aircraft involved
5) maximum liability per aircraft involved
6) name of each product manufacturer and the applicable policy limits;
7) name of the air traffic control authority and the applicable policy limit.
44
Classification: Confidential19 Satellite risks
Managing agents should return satellite loss information relating to the single largest loss from the
following events, if this figure produces a loss in excess of the de-minimis reporting level.
Managing agents should also consider any other lines of business that would be affected by the following
events and in particular exposure under any l ive satellite third party liability policies that may accumulate.
19.1 Space weather – Solar energetic particle event
19.1.1 Event description
A solar energetic particle event such as a solar flare or coronal mass ejection produces a vast outpouring
of protons, electrons and other charged particles which will cause permanent damage to semiconductor
devices. This scenario specifically considers the effect of such events on the solar cells of a satellite. A
certain number of solar energetic particle events are allowed for in the design of every satellite, but an
anomalously large event, such as the Carrington event of 1859, could result in a significant number of
satellites simultaneously incurring a reduction in operational capability due to the degradation of the
satellite power source.
Satellite age and construction will also determine how an event will affect a particular satellite. However,
a single large event (or a number of smaller events in close succession) has the potential to affect all
geosynchronous satellites and could result in a loss of power on a majority of satellites.
19.1.2 Loss estimation
For the purposes of this RDS, it should be assumed that either a single anomalous event or a number of
events in quick succession results in a loss of power to all satell ites in geosynchronous orbit. All live
exposures in this orbit will be affected by the proton flare. Managing agents should assume a 5%
insurance loss to all affected policies.
The loss under this RDS will therefore be the sum of the following calculation for all live policies covering
geosynchronous satellites:
(Insured Satellite Value) x (Loss to Policy)
Therefore, if a syndicate’s share of two geosynchronous satellites is USD 10m on the first and USD 8m
on a second, the loss to the syndicate would be c alculated as:
(USD 10,000,000 + USD 8,000,000) x 5% = USD 900,000
Managing agents should note that under this RDS, “Total Loss Only” policies, component specific
policies and policies not covering power losses will not be triggered.
Frequency: the frequency of this type of scenario is considered to be 1-in-100 years.
19.2 Space weather – Design deficiency
In 1994 two satellites of the same type were severely affected by a large space weather event,
subsequently attributed to a design deficiency which made the satellites abnormally sensitive to this
particular phenomenon. One of the satellites was ultimately a total loss. In 2010 a similar space weather
event led to control of a satellite being lost for a period of eight months before the satellite was
recovered.
19.2.1 Event description
For the purposes of this scenario, it should be assumed that a design deficiency leaves a particular
geosynchronous satellite type vulnerable to space weather events. Such a deficiency should be
assumed to leave the satellite, or component part thereof, prone to the effects of deep di -electric
charging, surface charging, electrostatic discharge, total radiation dose or other similar effect which could
be triggered by a large solar energetic particle event or related disturbances in the Earth’s geomagnetic
field. In a disaster scenario it is assumed that an anomalously large space weather event results in four
satellites of the same type being declared total losses.
45
Classification: Confidential19.2.2 Loss estimation
To calculate the loss under this RDS, managing agents should consider all live policies covering
geosynchronous satellites. The four largest lines for each satellite type (from the types listed below)
should be summed and the largest of these figures reported as the Space Weather Design Deficiency
RDS figure.
The following specific satellite types should be considered individually:
• Astrium Eurostar 3000 (all variants)
• Boeing Space Systems 702 and GEM (all variants)
• Lockheed Martin A2100 (all variants)
• Mitsubishi Electric DS2000 (all variants)
• Orbital Sciences Corporation Star 2 (all variants)
• Space Systems Loral LS1300 (all variants)
• Thales Alenia Space Spacebus 4000 (all variants)
Frequency: the frequency of this type of scenario is considered to be 1-in-50 years.
19.3 Generic defect
Supply chain consolidation means that many Western satellite prime manufacturers purchase subsystem
units and component parts from small numbers of suppliers. Traveling wave tube amplifiers, reaction
wheels, command receivers, solar cells and batteries are typically available from only two suppliers.
19.3.1 Event description
A generic defect that develops in one of these supplied parts has the potential to affect a number of
different satellites. For any satellite commencing coverage in good health with all redundant units and
margin intact it is considered that a total loss would be unlikely and a worst case loss of 50% is
assumed. The likelihood of such a loss is considered to be directly related to the remaining coverage
period of the insurance policy. From past experience with gen eric defects, it is considered safe to
assume that after satellites have been in orbit for five years they have passed the point at which a
generic defect is likely to occur. Based on the current build rates of the major manufacturers it is
reasonable to assume that a generic defect could affect a maximum of ten satellites.
19.3.2 Loss estimation
For all live policies covering each of the satellite types listed under section 19.2.2 and which have not
surpassed the fifth anniversary of their launch date, managing agents should calculate a generic defect
loss as follows and sum the ten largest resultant figures:
(Insured Satellite Value) x (Risk Period Factor) x (50% Loss)
The Risk Period Factor should be calculated from the following table:
Period Remaining on Policy Risk Period Factor
Greater than 24 Months 100%
18 Months – 24 Months 80%
12 Months – 18 Months 60%
6 Months – 12 Months 40%
Less than 6 Months 20%
Table 35
Frequency: the frequency of this type of scenario is considered to be 1-in-20 years.
46
Classification: Confidential19.4 Space debris
Space debris poses an increasing threat to satellite assets in all orbits. The only collisions to have
occurred to date were in low Earth orbit [LEO].
A satellite break up or collision in LEO results in the generation of a cloud of debris that progresses, over
time, both around the orbit and above and below the orbit. The debris cloud then poses an increased
threat for other satellites in LEO. Experience from the Iridium 33 / Cosmos 2252 collision of 2009
illustrated that debris from such a collision could reach up to +/- 200 km from the altitude at which the
collision took place. Following a collision, the growth of the debris cloud and the likelihood of further
collisions is considered to be directly related to remaining policy period of the insurance c overage
provided.
19.4.1 Event description
Considering insured assets in LEO, two groups can be considered. It is considered unlikely that a single
event within one of these groups would result in a debris cloud expanding sufficiently to affect the other
group. The two groups are as follows:
Group 1: Satellites with orbits in the range of altitudes between 400km and 800km (i.e. +/- 200km of
600km). This group encompasses all of the insured imaging satellites and the Iridium and Orbcomm
constellations of communication satellites. All other insured satellites known to orbit within this altitude
range should also be included in the RDS calculation.
Group 2: The Globalstar constellation of communication satellites with an altitude of 1400km. All other
insured satellites known to orbit within +/-200 km of this altitude should also be included in the RDS
calculation.
19.4.2 Loss estimation
For each of these two groups managing agents should sum the result of the following calculation for all
satellites on live policies and report the larger of the two figures as the Space Debris RDS:
(Insured Satellite Value) x (Risk Period Factor) x (100% Loss)
Risk Period Factor is the same as shown in the table in section 19.3.2 above.
Frequency: the frequency of this type of scenario is considered to be 1-in-15 years.
47
Classification: Confidential20 Liability risks
Managing agents should report two internally modelled liability loss scenarios fo r each syndicate, subject
to the de minimis criteria. Where exposed to both professional and non-professional lines liability
scenarios, one of each type should be reported.
20.1 Professional lines
The following example scenarios are provided to help guide managing agents in considering the type,
scale and impact of their internally modelled scenarios.
20.1.1 Mis-selling of a financial product
Any systemic loss arising from the mis-selling of a financial product including the distribution of said
financial product through the appropriate channels. This could comprise two distinct sources of liability
attributable to: 1) product and 2) distribution channel. Regulatory investigation might be a trigger to this
type of systemic loss but would not of itself be the systemic l oss.
20.1.2 Failure/Collapse of a Major Corporation
The failure or collapse of a major corporation listed on one or more Global Stock Exchanges.
20.1.3 Failure of a Merger
The failure or collapse of a merger involving one or major corporations listed on any Global Stock
Exchange.
20.1.4 Failure of a Construction Project
The failure of a construction project involving all of the syndicate’s casualty risk codes (for example, non -
marine liability, architects, surveyors and engineers, etc.).
As an example, from the past, the London 2012 Olympics represented a major exposure in terms of
potential failure of a large construction project. Problems had affected construction for the Greek
Olympics; during 2008 – 2011 it would have been reasonable to assume that a similar scenario c ould
arise for the London Games.
20.1.5 Recession-Related Losses
A managing agent may identify that its syndicate is exposed to a dramatic fall in the housing market,
associated with high negative equity, mortgage shortfalls and defaults. It could model syndicate
exposures by utilising casualty risk codes, including: Independent Financial Advisors (IFAs), Solicitors,
Surveyors, Lenders, Accountants.
Modelled exposures should also consider a rising unemployment rate thus potentially increasing the
exposures to Employment Practices Liability underwritten as a stand alone product or as part of Directors
& Officers Liability policies.
20.2 Non-Professional lines
The following example scenarios are provided to help guide managing agents in considering the type,
scale and impact of their internally modelled scenarios:
20.2.1 Industrial/Transport Incident
A managing agent may identify that it has a high potential syndicate exposure to an extreme loss arising
from a release of chlorine at an industrial site or from a train travelling th rough a major city.
The managing agent would develop a physical model of the incident, with assumptions for the area and
populations affected, and the effects of the chlorine gas itself. The model should identify the various
organisations that would be held liable, including joint ventures and professional advisors that the
syndicate covers.
48
Classification: ConfidentialYou can also read