Ammonia Emissions from Differing Manure Storage Facilities at Two Midwestern Free-Stall Dairies - MDPI
←
→
Page content transcription
If your browser does not render page correctly, please read the page content below
atmosphere
Article
Ammonia Emissions from Differing Manure Storage
Facilities at Two Midwestern Free-Stall Dairies
Richard H. Grant *        and Matthew T. Boehm
 Department of Agronomy, Purdue University, 915 W. State St., West Lafayette, IN 47907, USA;
 mtboehm@hotmail.com
 * Correspondence: rgrant@purdue.edu

 Received: 2 October 2020; Accepted: 14 October 2020; Published: 16 October 2020

 Abstract: Dairies contribute a major portion of agricultural ammonia emissions in the United States.
 Emissions were monitored over two years from an anaerobic lagoon receiving manure from cows
 in the milking parlor and holding area in Indiana (IN), USA and a storage basin receiving manure
 from cows in barns as well as the milking parlor and holding area in Wisconsin (WI), USA. Emissions
 were monitored using open-path tunable diode lasers, sonic anemometers, and two emission models.
 The mean annual daily emissions at the WI storage basins (30 µg m−2 s−1 ) was nearly equal to that at
 the IN lagoon (27 µg m−2 s−1 ). The mean annual daily ammonia (NH3 ) emissions on a per animal
 basis were greater at the WI basins (33 g NH3 hd−1 d−1 ; 26 g NH3 AU−1 d−1 ) (hd = animal; AU = 500
 kg animal mass) than at the IN lagoon (9 g NH3 hd−1 d−1 ; 7 g NH3 AU−1 d−1 ). Emissions from both
 storage systems were highest in the summer, lowest in the winter, and similar during the spring
 and fall. Emissions were strongly correlated with air temperature and weakly correlated with wind
 conditions. Greater emissions at the WI basins appeared to be related primarily to the characteristics
 of the stored manure.

 Keywords: ammonia; dairy; manure; emissions; waste; Lagrangian Stochastic; radial plume mapping

1. Introduction
      While nitrogen is critical to life, excess nitrogen (N) in the environment has a wide range of
negative impacts including the degradation of air, soil, and water resources. Emission inventories
for the United States estimate that the agricultural production sector of the economy contributes the
largest portion of the total NH3 emissions, with livestock production being the dominant source of
NH3 within this sector [1]. Ammonia emissions from livestock production result from the incomplete
utilization of feedstock N in livestock growth and sustenance. Between 50% and 80% of N intake is
excreted in manure (urine and feces) [2,3].
      Dairy and cattle production accounts for about 40% of the national NH3 emission inventory [3].
Across the United States, a wide range of production management systems are used in dairies.
Housing facilities at eastern United States dairies include tie-stall, free-stall, and bedded pack barns [4].
Manure, composed of both urine and feces, and bedding is stored either combined as a slurry (urine
and feces) or separated into liquid (less than 5% dry matter (DM)) and solid components. Liquid
waste storage remains are considered relatively well-mixed in lagoons compared to slurry storage
(7–12% DM) [4]. Ammonia emissions from the liquid storage result from rapidly hydrolyzed urea in the
liquid and more slowly mineralized organic N. Emissions from the slurry storage have a significantly
higher mineralization component than liquid storage due to the much greater DM. Differences in
manure storage practices can be expected to influence the timing and magnitude of NH3 emissions
over the course of days and weeks [5].

Atmosphere 2020, 11, 1108; doi:10.3390/atmos11101108                         www.mdpi.com/journal/atmosphere
Atmosphere 2020, 11, 1108 2 of 16
The complexity of dairy operations and the wide range of climates in which dairies are located
have resulted in a wide range of different management schemes across the US. National inventories of
and regulatory constraints on dairy and cattle NH3 emissions require well-documented measurements
on as many management systems as possible. There have been several long-term studies of NH3
emissions from manure storage systems of dairies in the arid western US [6–9], but relatively few in
the eastern US [4,10]. Although emission models to evaluate different manure management systems
are available [4], the validation of these models is challenging due to a limited number of long-term
near-continuous NH3 emission measurements. Ammonia emissions from two Wisconsin free-stall
dairies with slurry storage had NH3 emissions averaging 54 g hd−1 d−1 (hd = animal head) during
the summer and 24 g hd−1 d−1 in the fall [10]. Slurry storage at a dairy in Canada yielded emissions
ranging from 8 µg m−2 s−1 (6 g hd−1 d−1 ) during the winter to 48 µg m−2 s−1 (39 g hd−1 d−1 ) during the
spring [5]. For regulatory and inventory purposes, it is desirable to limit the necessary classification of
manure storages in NH3 emission estimates. The National Air Emissions Monitoring Study (NAEMS)
of emissions from dairy operations, including these two dairies, was conducted to increase the available
emission measurements for such regulatory and inventory efforts [11]. It is hypothesized that although
the timing of emissions varies between anaerobic lagoon and slurry storage, the seasonal and annual
emissions will be similar (null hypothesis). Here, we compare the NH3 emissions over a year from two
free-stall dairies in similar eastern US climates using differing manure storage systems: an anaerobic
lagoon storing liquid manure and pits storing slurry. Both dairies were measured as part of the NAEMS.
2. Experiments
Ammonia emissions from waste storage facilities on two free-stall dairies in the Midwest: two
waste storage basins in Wisconsin (WI) and an anaerobic waste lagoon in Indiana (IN). Because the
waste handling of each dairy operation varies, emissions were estimated in terms of the surface area
of the storage facility, the number of cows producing manure for each storage (head = hd), and the
number of animal units (1 AU = 500 kg) producing manure for each storage area.
The WI free-stall dairy consisted of five barns for lactating Holstein cows, a special needs barn,
a feed storage area, and a milking parlor [12,13]. Ammonia emissions were measured from the
northernmost and middle clay-lined storage basins (combined volume of 16,980 m3 and surface area of
7091 m2 ) that received wastewater from the flush of two of the barns, the holding area, and the milking
parlor. The northernmost basin received liquid waste from two barns after solids separation when the
separator was functioning and received both solids and liquids when the separator failed (Figure 1a).
The middle basin received flushed waste from the holding area and milking parlor without solids
separation. The third (southernmost) basin filled when the other two basins exceeded capacity and
rarely had any manure in it. The 3.3 m deep basin had a sludge depth estimated at 0.3 m. Liquid
manure was removed from the basins approximately every 12 weeks with the solids removed twice
a year. Assuming manure deposition was uniform throughout the day, a 24 h day time-weighted
cow population loading the basins consisted of the time for all lactating cows (1506 hd) to be milked
(three times a day for 30 min each) and the time that cows in two barns (496 hd) were present in those
barns. The time-weighted population loaded the basins was 559 lactating cows [13]. Given the average
mass of a cow, the equivalent animal unit was 710 AU.
The IN free-stall dairy consisted of three barns for lactating Holstein cows, a feed storage area,
a special needs barn, and a milking parlor [13,14]. The 4.8 m deep clay-lined waste lagoon had a
maximum volume of 48,212 m3 and a surface area of 9884 m2 (Figure 1b). The anaerobic lagoon
received wastewater (flush) from the holding area and milking parlor. All solid waste from the holding
area and milking parlor was transferred into a settling pit draining into the anaerobic lagoon (a weir
limiting the solids transferred into the lagoon). The solids from this pit were removed every four to
five weeks. All liquid waste was transferred by pipes to the northeast corner of the lagoon. Liquid
was removed from the lagoon every 7 to 14 days except when the fields were frozen. The dairy
was completed in 2002 and had not had any sludge removed from the lagoon through the time ofAtmosphere 2020, 11, 1108 3 of 16
Atmosphere 2020, 11, x FOR PEER REVIEW 3 of 16
measurements. The facility had an average population of 2580 lactating cows (3509 AU) over the study
measurements. The facility had an average population of 2580 lactating cows (3509 AU) over the
period [14]. The
study period mean
[14]. The cow
meanmass
cowwas
mass636 kg.636 kg.
was
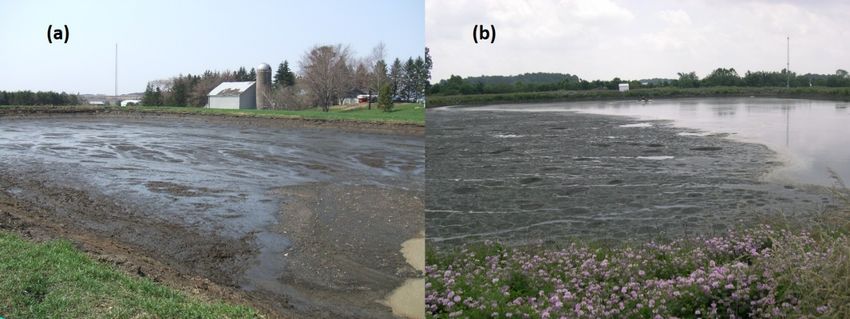
Figure 1.
Figure 1. Manure storage facilities.
Manure storage facilities. The
The northern
northern Wisconsin
Wisconsin (WI)
(WI) basin in spring
basin in spring 2008
2008 with
with aa visually
visually
estimated 85% crust on the surface (a) and the the Indiana
Indiana (IN)
(IN) anaerobic
anaerobic lagoon in spring
spring 2009 with
with
visually estimated 60% scum and foam on the surface
visually estimated 60% scum and foam on the surface (b). (b).
Meteorological measurements of barometric pressure (278, Setra, Inc., Boxborough, MA, USA),
air temperature and relative humidity (HMP45C, Vaisala, Vaisala, Inc.,
Inc., Helsinki,
Helsinki, Finland),
Finland), and solar radiation
(210, LiCOR,
LiCOR, Inc., Lincoln, NE, USA) were made on a mast located on the berm 5 m west and 30 m
north
north from
fromthethesouthwest
southwestberm berm corner
corner at the IN IN
at the dairy andand
dairy between the northernmost
between the northernmost and middle
and middlebasin
in the in
basin berm
the center 20 m east
berm center 20 m of east
the northwest corner corner
of the northwest of the middle basin atbasin
of the middle the WI at dairy.
the WIThe lagoon
dairy. The
conditions were characterized by measurements of pH (CSIM11,
lagoon conditions were characterized by measurements of pH (CSIM11, Innovative Sensors, Inc,Innovative Sensors, Inc, Campbell
Scientific,
CampbellLogan, UT, USA.),
Scientific, Logan,oxidation
UT, USA.), reduction potential
oxidation (CSIM11-ORP,
reduction potentialInnovative
(CSIM11-ORP, Sensors,Innovative
Inc.), and
temperature
Sensors, Inc.), (107-L,
and Campbell
temperature Scientific,
(107-L,Logan,
CampbellUT, USA) at a 0.3Logan,
Scientific, m depth.UT,Meteorological
USA) at a 0.3and m lagoon
depth.
characterization
Meteorological and measurements were collected
lagoon characterization by a data logger
measurements were (Model CR1000,
collected by a Campbell
data logger Scientific,
(Model
Logan,
CR1000,UT, USA) and
Campbell telemetered
Scientific, Logan,to UT,theUSA)
on-siteandinstrumentation
telemetered to the trailer.
on-siteLagoon characterization
instrumentation trailer.
sensors
Lagoonwere removed from
characterization the lagoons
sensors werewhen freezing
removed from conditions
the lagoonswerewhen
expected. Sinceconditions
freezing the temperature were
of the lagoon
expected. andthe
Since basins was not measured
temperature of the lagoon throughout
and basins the study
was notperiod, air temperature
measured throughout was theused
studyas
aperiod,
surrogate. All gas concentrations
air temperature was used aswere correctedAll
a surrogate. to 20gas◦ C and a barometric
concentrations werepressure
corrected of to
101.3
20 °CkPa.and
Manure pressure
a barometric storage systems
of 101.3 were
kPa. visually assessed for surface condition (including if frozen and
whatManure
fractionstorage
of surface was were
systems covered with scum,
visually assessed foam, or crust)
for surface by walking
condition aroundif the
(including storage
frozen and
during each visit
what fraction by the was
of surface fieldcovered
personnel with(Table
scum, S1; Figure
foam, 1). Thebymeasurement
or crust) walking around of emissions
the storage required
during
the
eachmeasurement of gas
visit by the field concentration
personnel (Tableand S1; wind.
FigureThe path-integrated
1). The measurement concentration
of emissions(PIC) requiredof NH the3
was measuredofusing tunable diodeand laser spectrometers (TDLAS; GasFinder2 ® , Boreal Laser, Ltd.,
measurement gas concentration wind. The path-integrated concentration (PIC) of NH3 was
measured using
Edmonton, tunableTwo
AB, Canada). diode laser spectrometers
open-path, monostatic TDLAS (TDLAS; GasFinder2
instruments were®,mounted
Boreal Laser,
on oppositeLtd.,
corners
Edmonton, of each monitored
AB, Canada). Twolagoon or basin
open-path, [12,14]. Each
monostatic TDLAS instrument
instrumentsscanned
werefive retroreflectors
mounted on opposite on
corners
each of each
of two monitored
adjacent sides oflagoon
the lagoon or basin [12,14].
or basin, threeEach instrument
optical paths (OPs)scanned
along five retroreflectors
the berm at 1 m above on
each of level
ground two adjacent
(agl), and sides
twoofOPs thedefined
lagoon by or basin,
the scanner three at optical paths
1 m agl and(OPs) along the on
retroreflectors berm at 1 at
towers m
7above
m and ground levelConcentrations
15 m agl. (agl), and two OPs weredefined
calculatedby the forscanner
a givenatpath1 miagl andi /L
as PIC retroreflectors
i where L is the on towers
length
at 7OP.
of m and
The 15 m agl.
mean windConcentrations were calculated
speeds and turbulence for awere
statistics givenobtained
path i asfrom
PICi/L3D i where
sonic L is the length
anemometers
of OP. The
(Model mean
81000, RMwindYoung speeds and turbulence
Inc., Traverse City, MI, statistics were obtained
USA) mounted at 2.5 from
m agl3D on sonic anemometers
the meteorological
(Model
mast and81000, RM at
recorded Young
5 minInc., Traverse
intervals. To beCity, MI, USA)a mounted
considered valid 5 min at period,
2.5 m agl on the
at least meteorological
90% (4320) of the
mast and4800
possible recorded at 5 min
16 Hz values hadintervals. To beand
to be present considered
the sonicatemperature
valid 5 minvariance
period, at (a least
general90% (4320) of
measure
the possible
sensor 4800 16 had
performance) Hz tovalues
be lesshad thanto 2.5
be K 2
present and the
. The valid sonic
5 min temperature
statistics were then variance
averaged (a general
to 1/2 h
measure of
intervals. Nosensor performance)
coordinate rotations werehad to be on
made lessthe than
sonic2.5anemometer
K2. The valid 5 min statistics
measurements as thewere
flow then
was
averaged
likely to ½ by
influenced h theintervals. No coordinate
height changes in the croprotations
and lagoon were made
liquid surfaceon atthe
the INsonic anemometer
dairy and height
measurements
changes as the
with wind flow was
direction duelikely influenced
to buildings, by the
trees, height changes
a downward slopeintothe
thecrop
westand lagoon
of the berm, liquid
and
surface at the IN dairy and height changes with wind direction due to buildings, trees, a downward
slope to the west of the berm, and varying heights of the liquid surface in the basins at the WI dairy.Atmosphere 2020, 11, 1108 4 of 16
varying heights of the liquid surface in the basins at the WI dairy. Variations in surface roughness with
wind direction were evaluated using the turbulence characteristics derived from the sonic anemometer.
Emissions were estimated using two models: a backward Lagrangian Stochastic (bLS) model
(WindTrax; Thunder Beach Scientific, Nanaimo, BC, Canada, http://www.thunderbeachscientific.com)
and a vertical radial plume measurement (VRPM) emission model. The bLS model [15] quantifies
the ratio between the difference between the downwind and upwind (background) concentrations
(Ci − CBG ) and the average surface flux density across the source area (Fc,0 ) with the assumption
that the ratio (Ci − CBG )/Fc,0 is only a function of flow characteristics. To determine the relationship
between C and Fc,0, the model simulates the flight path of air parcels backwards from the line sample
until each parcel intersects the ground (a “touchdown”). Our application of the bLS model had more
concentration measurements than source emissions to be estimated, so the emission rate (F) of the one
source and CBG for the interval of measurement was derived from a set of concentration measurements
by simultaneous solution of equations for each line measurement using a standard Singular Value
Decomposition algorithm. Emissions were excluded from analysis if: (1) u* was less than 0.15 m
s−1 , (2) the Monin–Obukhov length |L| was less than 2 m, (3) the fraction of touchdowns within the
source area was less than 0.2, or (4) CBG was greater than 0.15 µmol mol−1 . The bLS model’s emission
minimum detection limit was estimated from the calculated emissions when each storage facility was
frozen. The bLS model had a theoretical random error of 22% [16] and a tracer-estimated error between
5% and 36% [17]. A comparison between the bLS model and an integrated horizontal flux model at
these locations resulted in an emission underestimation of 6% by the bLS model [18]. The bLS error
assumed for this study was 20%.
The VRPM emission model, an integrated horizontal flux method, calculates the emission
from a defined source utilizing a measured wind speed profile and measured path-integrated gas
concentrations [18]. The method utilized all five OPs along each side of the manure storage area
and assumed a bivariate Gaussian function to describe the distribution of mass across the vertical
plane [19]. Emission estimates were excluded using a number of quality assurance indicators designed
to assure the measurement plane contained at least 70% of the plume [19]. These indicators included:
(1) a Concordance Correlation Factor (CCF) less than 0.8, (2) a plume position correction factor (A)
less than 0.9, and (3) a topmost PIC more than 90% of the midlevel PIC. CCF is equal to rA where A
is a correction factor for the shift in the plume mass location relative to the measured PIC and equal
to CCF/r (r is the Pearson correlation coefficient between CCF and A). Prior studies evaluating the
accuracy of the VRPM method using five OPs and relatively stringent quality assurance criteria ranged
from underestimates of 21% +/− 14% [20], 6% [19], and 19% +/− 33% [21] to overestimates of 10%
+/− 16% [22] and 46% +/− 26% [23]. Grant et al. concluded that the mismatch of a relatively slow
response NH3 -measuring TDLAS and faster response sonic anemometers resulted in the overestimation
of emissions [18] comparable to the 5% to 20% estimated by Denmead [24].
The bLS and VRPM emission estimates were considered to be independent measurements of the
emissions during any given 1/2 h averaging period. Since the estimated errors for the bLS emission
model and the VRPM emission model were comparable at approximately 20%, emissions determined
using the two methods were considered comparable but differing in a specific situation due to the
characteristics of local turbulence [18]. A site-specific comparison of the emissions estimated using the
two methods provided a means of estimating the influence of site-specific turbulence [18] (Table S2).
Although it is unknown whether the bLS or VRPM emission model is more accurate, we adjusted
the bLS emission estimates to VRPM-equivalent emissions according to the intercomparison of the
two methods at the two dairies (Table S2). All bLS emission estimates were combined with the VRPM
emission estimates (if present) to determine the best estimate of the daily and seasonal emissions.
A fetch-to-height ratio criterion of 100:1 defined valid upwind turbulent conditions for emissions
calculation. There were no upwind obstructions at the IN dairy lagoon that limited the calculation
of emissions based on wind direction [13]. The farm buildings and trees to the north and east of the
basins at the WI basin limited the valid emissions to wind directions from 180◦ to 360◦ [12]. After theAtmosphere 2020, 11, 1108 5 of 16
exclusion of wind directions previously stated, the surface roughness (represented by the calculated
zo ) at the IN basins and WI lagoon was nearly identical (0.12 m ± 0.167 m (mean ± SD) at WI and
0.13 m ± 0.177 m at IN).
The NH3 emissions were assumed to be stationary and resulting primarily from dissolved NH3
in relatively dilute water [25]. The combined temperature influence on daily emissions associated
with the biological production of NH4 + , the dissociation of NH4 + to NH3 , and the solubility of NH3
concentrations were evaluated for all days on which the storage surface was not frozen using an
exponential van’t Hoff function often used to describe the temperature influence on the air: the liquid
diffusion process of a gas:
1 1
FNH3 (Tair ) = α e−β( Tair − 298.15 ) (1)
where α represents the source strength (units of mass per m2 , hd, or AU per unit time), β represents
the temperature influence on the emission (set to 4100 [26]), and the mean air temperature (Tair ) is in K.
Since lagoon temperature was measured for only a relatively small portion of the measurement, air
temperature was used as a proxy of the air–liquid interface temperature. The use of air temperature
as a proxy for near-surface liquid temperatures was used in describing NH3 emissions for hog
operations [27].
Comparisons between seasons at a given dairy or between storages at the two dairies require
consideration of the environmental differences between the dairies. The temperature influence on
emissions was minimized by normalizing the measured emissions (QNH3 ) to those predicted at 25 ◦ C
(Equation (1)) according to:
QNH3 (25,U) = QNH3 (Tair ,U) FNH3 (25 ◦ C)/FNH3 (Tair ) (2)
where U is the mean measured wind speed. Transport of the gas into the air over the storage facility
requires turbulent or molecular mixing of the air directly at the surface to the air overlying the
storage facility.
To minimize the influence of differences in site-specific turbulent mixing on the measured
NH3 emissions, the temperature-normalized NH3 emissions QNH3 (25, U) (Equation (2)) were linearly
regressed on U as a measure of the atmospheric mixing. A normalized emission minimizing the
influence of both temperature (Tair = 25 ◦ C) and wind conditions (U = 2 ms−1 ) was defined as:
QNH3 (25,2) = QNH3 (25, U) [γ(2) + η]/[γ (U)+ η] (3)
where coefficients γ and η are determined by linear regression of U on QNH3 (25,U) [27].
The relative emission error was estimated assuming independence of the errors associated with
the bLS emission model, the measurement error of each gas analyzer, and, where appropriate, the
error associated with estimating the delta concentration across the lagoon/basins. Estimates of daily
emissions were based on days for which at least 50% of the hourly measurements were valid within a
24 h day [26]. Emission errors were estimated by dividing the relative error by the square root of the
minimum number of hourly values needed to estimate a daily emission rate. The minimum of 50% of
possible half-hourly emission estimates provided an estimated daily emission error of less than 20%.
Mean seasonal emissions were estimated from the mean daily emissions during the season. Annual
emission estimates were determined by summing the mean seasonal emissions. The representativeness
of the seasonal mean daily emissions was assessed by comparing the mean annual emission to the
mean daily emissions regardless of season (statistically the total mean).
A number of manure handling and bedding changes, reported by the producers, occurred at
the two dairies over the study period (Tables S1 and S2). Since these activities were discrete events,
the impacts of these changes on NH3 emissions were explored. Since the various events occurred
during different times of the year, the potential impacts of the events were evaluated relative to changes
in QNH3 (25,2) (Equation (3)). It was assumed that the surface of the manure storage was frozenAtmosphere 2020, 11, 1108 6 of 16
throughout the time period between two site visits if it was observed to be frozen each visit (Tables S1
and S2). Likewise, it was assumed that the storage was crusted throughout the time period between
two site visits if it was observed to be crusted each visit (Table S1). Assessments of the association
of these changes in operation and manure storage surface conditions were made using an unpaired
Student’s t-test with α = 0.05.
The fraction of N intake lost as NH3 from the manure storage facilities was assessed. The IN
producer supplied the herd composition of dry, fresh, early, and late lactating herd fractions. The WI
producer supplied a herd composition of dry and lactating cows. It was assumed that the lactating
cows were evenly distributed between fresh (first two to four weeks after calving), early (four to
fourteen weeks after calving to peak lactation), and late (after peak lactation) lactating cows. Actual
feed rations were not reported by the producer. Nutritional requirements of the herds at the WI and
IN dairy were estimated assuming a nominal feed ration and consumption resulting in a feed dry
matter intake (DMI) of 0.05 kg kg–1 d–1 for fresh cows, 0.04 kg kg–1 d–1 for all other lactating cows, and
0.02 kg kg−1 d−1 for dry cows and feed crude protein (CP) of 9.9% (nonlactating cows), 12.4% (fresh),
16.7% (early), and 14.1% (late) cows [28]. The N content of CP was assumed to be 16%. Since the
diet was assumed, an error bound in the percentage of N intake in the measured NH3 emissions was
approximated by increasing the assumed DMI by 0.01 kg/kg for early cows (within the normal range
of possible diets of the high-yielding cows).
3. Results and Discussion
Half-hourly emission measurements were made nearly continuously from fall 2008 through
summer 2009 at the IN dairy (Table S3), and over a series of two- to three-week periods from summer
2007 through to spring 2009 at the WI dairy (Table S4), resulting in a substantial overlap in the
measurement periods. Over the course of the measurement periods (Table 1), the mean daily air
temperature at the IN dairy varied from −14.2 ◦ C to 27.1 ◦ C, while that at the WI dairy varied from
−21.2 ◦ C to 22.7 ◦ C. The temperatures at both dairies were generally within the normal climatological
range for their location [12]. While the mean wind speed at each dairy was the same (2.6 m s−1 ),
wind speeds had a wider range at the IN dairy (0 m s−1 to 12.7 m s−1 ) than the WI dairy (0.2 m s−1 to
7.8 m s−1 ) (Table 1).
Table 1. Seasonal weather conditions during the 2007–2009 study.
Indiana Wisconsin
Air Temperature (◦ C) Wind Speed (ms−1 ) Air Temperature (◦ C) Wind Speed (ms−1 )
Maximum Minimum Mean Mean Maximum Minimum Mean Mean
Spring 27.9 −6.1 9.7 3.1 23.9 −21.8 4.0 3.2
Summer 33.0 7.8 20.8 1.7 33.4 7.4 20.6 2.1
Fall 29.9 −9.0 10.2 2.3 22.5 −15.1 3.2 3.0
Winter 17.3 −29.2 −4.6 3.3 5.8 −26.8 −11.4 2.8
Annual 33.0 −29.2 8.9 2.6 33.4 −26.8 7.9 2.7
The appearance of the lagoon or basins was recorded on almost every site visit. The IN lagoon
generally had less than 10% crust on the surface, while the WI basins typically had crusting or scum
on the entire surface (Table S1). During the winter, the lagoon and basins were generally frozen and
snow-covered (Table S1). The air temperature at the WI dairy averaged –16 ◦ C (+/− 6 ◦ C) during
periods with an observed frozen surface. The air temperature at the IN dairy averaged −3 ◦ C (+/− 7 ◦ C)
during periods with an observed frozen surface.
Measurements were made on a total of 337 days at the IN dairy (14,525 half-hour measurement
periods) distributed fairly evenly across seasons (Table 2). Twenty percent of the measurements
were excluded from the bLS estimation due to failing the atmospheric turbulence and stability
criteria. All excluded VRPM measurements were due to at least one missing downwind measurement.
Quality assurance criteria reduced the number of half-hourly emission estimates by 18% with 8150 bLSAtmosphere 2020, 11, 1108 7 of 16
estimates of emissions and 3696 VRPM estimates of emissions with the fewest valid emission estimates
during the winter (Table 2). Measurements were made on a total of 176 days at the WI dairy
(7855 half-hour measurement periods) distributed fairly evenly across seasons (Table 2). Twenty
percent of the measurements were excluded from the bLS estimation due to failing the atmospheric
turbulence and stability criteria and 27% due to excluded wind directions. Sixty-one percent of the
excluded VRPM measurements were due to at least one missing downwind measurement and eight
percent due to excluded wind directions (many of the periods with missing downwind measurement
periods also were when the winds were from an excluded direction). Quality assurance reduced the
number of half-hourly emission estimates by 62% with 2644 bLS estimates and 357 VRPM measurements.
There were a total of 3001 valid half-hourly emission measurements including both bLS and VRPM
estimates Atmosphere
with half as11,many
2020, valid
x FOR PEER emission estimates during the winter than during the
REVIEW other three
7 of 16
seasons (Table 2).
percent due to excluded wind directions (many of the periods with missing downwind measurement
periods also were when the winds were from an excluded direction). Quality assurance reduced the
Table 2. Emission measurements during the 2007–2009 study.
number of half-hourly emission estimates by 62% with 2644 bLS estimates and 357 VRPM
measurements. There were aIndiana
total of 3001 valid half-hourly emission measurements including both
Wisconsin
bLS and VRPM estimatesMeasurements
with half as many valid emission estimates during theMeasurements
winter than during
the other three seasons (Table 2).
1/2
Valid Day
h Field Valid 1/2 h Emissions Valid Day Emissions 1/2 h Field Valid 1/2 h Emissions
Emissions
Table 2. Emission measurements during the 2007–2009 study.
Spring 3712 3668 77 1971 783 12
Summer 3690 2991 Indiana 59 2557 Wisconsin 837 7
Fall 3217 2820 Measurements 58 1689 Measurements936 15
Winter 3906 ½ h Field Valid2367 1638 Valid ½ h
52 Emissions ½ h Field
½ h Emissions Valid Day
Valid Day
445 3
Annual 14,525 11,846 246 7855 Emissions Emissions
3001 37
Spring 3712 3668 77 1971 783 12
Summer 3690 2991 59 2557 837 7
Fall 3217 2820 58 1689 936 15
3.1. Daily Emissions
Winter 3906 2367 52 1638 445 3
Annual 14,525 11,846 246 7855 3001 37
A total of 37 daily emission estimates were determined for the WI basins (Table 2), including
36 bLS estimates
3.1. Dailyand 1 VRPM estimate. A total of 246 daily emission estimates were determined at
Emissions
the WI lagoonA(Table 2):daily
total of 37 174emission
bLS estimates
estimates and
were 72 daily VRPM
determined for the WI estimates.
basins (Table Most WI basin
2), including 36 emission
estimates were for emissions
bLS estimates and 1 VRPM during theAspring
estimate. total of and fall emission
246 daily (Table 2). The IN
estimates werelagoon emission
determined at the estimates
were nearlyWIevenly
lagoon distributed
(Table 2): 174 throughout
bLS estimates the
andyear72 daily VRPM
(Table 2). estimates. Most WI basin emission
estimates were for emissions during the 1spring and fall (Table 2). The IN lagoon emission estimates
The range of measured daily minimum /2 h NH3 concentration (Cmin ) and the mean daily calculated
were nearly evenly distributed throughout the year (Table 2).
CBG at the WI basins were
The range of much
measuredgreater
dailythan that at½the
minimum h NH IN3 lagoon (Figure
concentration 2).) Greater
(Cmin variability
and the mean daily in the WI
CBG and Ccalculated
min (FigureC BG 2)
at was
the WIlikely due
basins wereto the
much closer
greater proximity
than that at of
thethe
IN WI dairy
lagoon barns
(Figure 2). to the measured
Greater
variability
storage facilities in thebarn
(closest WI C14BG and
m toCmin
the(Figure
east at2)the
wasWIlikely dueand
dairy to the closer
245 m to proximity
the N atofthe the IN
WI dairy)
dairy resulting
barns to the measured storage facilities (closest barn 14 m to the east at the WI dairy and 245 m to the
in the greater influence of the barns on the Cmin and CBG at the WI basins regardless of wind direction.
N at the IN dairy) resulting in the greater influence of the barns on the Cmin –1and CBG at the WI basins
The median C min when
regardless of wind thedirection.
surfaceThe was not frozen
median Cmin when wasthe 33.9
surface µmol
was notmolfrozen(26was m−3
µg33.9 ) at mol
µmol the–1IN lagoon
−1 −3
and 16.1 µmol
(26 µgmol
m ) at (12
−3 the IN m ) and
µglagoon at the
16.1WI basins.
µmol mol (12
−1 The m ) at theCWI
µg median
−3 whenThe
minbasins. themedian
surface Cminwaswhenfrozen was
11.8 µmol mol −1 (9 µg
the surface −3 ) atwas
wasmfrozen the11.8 µmol mol
IN lagoon −1 (9 µg m−3) at the IN−1
and 37.7 µmol mol lagoon (29 µgandm37.7−3 ) µmol
at themolWI −1 (29 µg
basins with the
m−3) at the WI basins with the relatively high median Cmin at the WI basins was likely due to the
relatively high median Cmin at the WI basins was likely due to the proximity of the barns.
proximity of the barns.
Figure 2. Minimum
Figure 2. Minimum measured
measured (Cmin(C) min
and ) and background NH
background NH 3 concentration (CBG). The distribution of
3 concentration (CBG ). The distribution of
daily Cmin (a) and daily mean CBG derived from the backward Lagrangian Stochastic (bLS) emission
daily Cmin (a) and daily mean CBG derived from the backward Lagrangian Stochastic (bLS) emission
model (b) is indicated for the IN (black) and WI (white) dairies.
model (b) is indicated for the IN (black) and WI (white) dairies.
Estimates of the minimum detection limit (MDL) of the bLS and VRPM emission methods were
based on median concentration values rather than mean concentrations to minimize the influence of
the non-normal concentration distributions (Figure 2). The MDL for the bLS emission method was
estimated based on calculated emissions when the storage surfaces were frozen (Table S1). TheAtmosphere 2020, 11, 1108 8 of 16
Estimates of the minimum detection limit (MDL) of the bLS and VRPM emission methods were
based on median concentration values rather than mean concentrations to minimize the influence of
the non-normal concentration distributions (Figure 2). The MDL for the bLS emission method was
estimated based on calculated emissions when the storage surfaces were frozen (Table S1). The median
daily mean CBG (bLS-derived) was slightly higher at IN (0.047 µmol mol−1 ; 36 µg m−3 ) than at WI
Atmosphere 2020, 11, x FOR PEER REVIEW 8 of 16
(0.040 µmol mol−1 ; 30 µg m−3 ). The corresponding median daily NH3 emission determined by the bLS
model was 10.4
median dailyµg m−2CsBG
mean
−1 for the WI basins and 15.3 µg m−2 s−1 for the IN lagoon.
(bLS-derived) was slightly higher at IN (0.047 µmol mol−1; 36 µgThe m−3)MDL
than atfor the
VRPM WImethod was mol
(0.040 µmol estimated
−1; 30 µgassuming a constant profile
m ). The corresponding
−3 medianof the
daily Cmin
NH(which would
3 emission occur when
determined by the there
was nobLSemission
model was from
10.4theµgsurface)
m−2 s−1 forwhen
the WI thebasins
surface
andwas
15.3 frozen.
µg m−2 sThis
−1 for corresponded
the IN lagoon. Theto aMDL
VRPM forMDL
theµg
of 10.3 m−2 method
VRPM s−1 for was
the WI estimated
basinsassuming
and 15.6aµg m−2 sprofile
constant −1 for theof the
INClagoon.
min (which would
The mean occur
MDL when for the
there was no emission from the surface) when the surface was frozen.
combined VPM- and bLS-determined daily emissions was 10 and 13 µg m s for the WI basins and This corresponded
−2 −1 to a VRPM
the INMDL of 10.3
lagoon, µg m−2 s−1 for the WI basins and 15.6 µg m−2 s−1 for the IN lagoon. The mean MDL for the
respectively.
combined VPM- and bLS-determined daily emissions was 10 and 13 µg m−2 s−1 for the WI basins and
Daily NH3 emissions in terms of unit exchange surface area at the two dairies were similar
the IN lagoon, respectively.
(Figure 3b). Emissions during the summer may have been higher at the WI basins than the IN lagoon,
Daily NH3 emissions in terms of unit exchange surface area at the two dairies were similar
although this
(Figure 3b).isEmissions
inconclusive duringduethetosummer
the limited number
may have been of valid
higher at measurement
the WI basins than daystheatINthe WI dairy.
lagoon,
Dailyalthough
mean emissions were positively
this is inconclusive due to the correlated with CofBGvalid
limited number at the WI manure
measurement storage
days at the facility
WI dairy. (linear
regression R2 of 0.21)(Figure
Daily mean emissions were 3a).positively
Daily mean emissions
correlated with were
CBG atnot
the correlated
WI manurewith CBGfacility
storage at the (linear
IN manure
storage facilityR(linear
regression regression R2 < mean
2 of 0.21)(Figure 3a). Daily
0.01).emissions
The relationships between
were not correlated CBG
with CBGand
at theemissions
IN manureat the
storage facility (linear regression R 2 < 0.01). The relationships between CBG and emissions at the two
two manure storage facilities imply that the emissions are not an artifact of the calculation method
(highmanure storage facilities
CBG corresponding toimply that the emissions
low emissions) but areare not an of
a result artifact
changingof the source
calculation method (high
conditions. Since the
CBG corresponding to low emissions) but are a result of changing source conditions. Since the herd
herd size and hence manure production and manure storage inputs are relatively constant from day to
size and hence manure production and manure storage inputs are relatively constant from day to
day, the wide range of emissions for a given period of time indicates that the environmental conditions
day, the wide range of emissions for a given period of time indicates that the environmental
strongly influenced the mean daily emissions.
conditions strongly influenced the mean daily emissions.
Figure 3. Annual variationin
in mean
mean daily
dailyemissions andand
mean CBG. CDaily mean CBG associated with
Figure 3. Annual variation emissions mean BG . Daily mean CBG associated
emissions (a) and mean emissions (b) and for the IN dairy lagoon (filled circles) and WI basins (open
with emissions (a) and mean emissions (b) and for the IN dairy lagoon (filled circles) and WI basins
circles). Hatched regions represent the +/− median CBG during frozen conditions (a) and emission
(open circles). Hatched regions represent the +/− median CBG during frozen conditions (a) and emission
minimum detection limit (MDL) (b).
minimum detection limit (MDL) (b).
3.1.1. Temperature Influence
Air temperature, used as a proxy for the surface manure and lagoon temperature, was clearly
related to the daily NH3 emissions at both the WI and IN dairy manure storage facility (Figure 4). The
exponential diffusion function of temperature (Equation (1)) accounted for 58% (adjusted R2 = 0.58)
of the variability in NH3 emissions at the WI basins and 41% (adjusted R2 = 0.41) of the variability inAtmosphere 2020, 11, x FOR PEER REVIEW 9 of 16
NH3 emissions at the IN lagoon. The emission response to temperature at the IN lagoon agreed with
Atmosphere 2020, 11, 1108 9 of 16
most prior studies [5,29]. Based on the temperature response, the surface crusting of the WI nonfrozen
slurry storage did not appear to restrict emissions in a similar manner as that found for a heavily
3.1.1. crust untreated
Temperature raw manure storage [5]. The fraction of explained variability in emissions at these
Influence
two dairies was similar to that reported for anaerobic lagoons at OK hog operations [27].
Air temperature, used as a proxy for the surface manure and lagoon temperature, was clearly
The source strength (α) in Equation (1) represents the ability of NH3 at the storage surface to
related to the daily NH3 emissions at both the WI and IN dairy manure storage facility (Figure 4).
diffuse into the air. The source strength was significantly greater (95% confidence limit) for the WI
The exponential diffusion−2 function of temperature (Equation (1)) accounted for 58% (adjusted R−22 =−1 0.58)
storage (79.2 µg m s , standard error 4.7 µg m s ) than for the IN2 storage (53.9 µg m s , standard
−1 −2 −1
of theerror
variability
1.5 µginmNH
−2 s−13).emissions
Remembering at thethat
WI thebasins
WI and
dairy 41% (adjusted
manure R =included
storage 0.41) of both
the variability in
stall and milking
NH3 emissions at the IN lagoon. The emission response to temperature at the IN lagoon agreed with
area manure, while the IN dairy manure storage included only waste from the milking area, the
most prior studies
emissions [5,29].
need to beBased on the to
referenced temperature
the manure response,
productionthe surface crusting herd.
of the lactating of theThe
WI nonfrozen
source strength
slurry storage did not appear to restrict emissions in a similar manner as that found for a heavily
(α) in terms of AU was 13.1 g AU−1 d−1 for the IN storage and 68.3 g AU−1 d−1 for the WI storage. The
crust untreated
higher α atraw
themanure
WI basins storage [5]. The
compared to fraction of explained
the IN lagoon variability
indicated higher in emissions
loading at WI
at the these two This
basins.
dairies was
will besimilar to that
discussed reported for anaerobic lagoons at OK hog operations [27].
later.
FigureFigure 4. Influence
4. Influence of airoftemperature
air temperature on daily
on daily NH3NH 3 emissions.
emissions. TheThe influence
influence of air
of air temperature on
temperature
on dailydaily emissions
emissions at at
thethe
ININ (filled
(filled circles)
circles) and
and WIWI (opencircles)
(open circles)isisindicated.
indicated.The
Thebest
bestregression
regression fit of
the form
fit of the formofofEquation
Equation(1)(1)forfor
thethe
ININ dairy
dairy (solid
(solid line)line)
andand WI dairy
WI dairy (dashed
(dashed line) line)
for a for a given
given
temperature.
temperature. Three Three outliers
outliers were excluded
were excluded from INfrom IN lagoon
lagoon emissionemission
analysis:analysis: one negative
one negative and twoand two
outlyingoutlying high-emission
high-emission measurements
measurements (Figure(Figure
3). 3).
The source
Diffusionstrength
across(α) theinlagoon
Equation (1) represents
or basin exchangethe ability
surface of NH3on
depends at both
the storage
the NHsurface to
3 concentration
diffuse into theand
gradient air.the
Theresistance
source strength was significantly
to transport. Since Cmin and greater
CBG at(95% confidence
the two storagelimit) for were
facilities the WI mostly
storage
similar µg m−22),
(79.2 (Figure s−1the
, standard
unmeasured errorNH 4.73 µg m−2 s−1 ) than
concentration for the
gradient IN surface
from storage to (53.9 −2 s−1 ,
µg mlikely
air was higher
standard error 1.5 µg m −2 s−1 ). Remembering that the WI dairy manure storage included both stall
at the WI basins holding slurry than the IN lagoon holding largely liquid manure [30]. Manure
and milking
surface area
NH3manure,
dependswhile on thethe available
IN dairy manure
NH4+, the storage included
solution only waste
temperature, andfrom
pH.the milking
While the NH4+
area, the emissions need
concentration to bemeasured,
was not referencedpH to the
andmanure production
temperature were of the lactating
measured (0.3 herd. The source
m depth). Based on a
strength (α) in terms of AU was 13.1 g AU −1 d−1 for the g AU−1 d−1
compilation of studies, it was likely that the NH4+ ofIN thestorage
WI storageand 68.3
pit slurry was for the
much WI than
higher
storage.
thatThe higher
at the α at thethe
IN lagoon; WIcompilation
basins compared to the
indicated IN lagoon
a mean NH4+indicated
-N of 1.12higher
kg m−3loading at the
for slurry, WIkg m−3
0.75
basins. This will be discussed later.
for milking center manure and wastewater, and 0.38 kg m for lagoon surface water [30]. The
−3
Diffusion
equilibrium across the lagoon
between NH4+ and or basin
NH3 at exchange surface depends
a given temperature on both
is evident bythethe NH 3 concentration
solution’s pH. Although
gradient
onlyand the resistance
measured to transport.
for limited periods Since
of time, Cmin and
the CBG at theintwo
differences pHstorage
at 0.3 m facilities
in the WIwere mostly
basins and IN
similar (Figure
lagoon 2), the unmeasured
(summer pH averagedNH concentration
7.23 in the IN lagoon gradient
and 6.6from
in thesurface to airwhile
WI basin was likely
fall pHhigher at 8.3
averaged
the WIinbasins
the INholding
lagoon slurry
and 7.1than n thetheWI INbasin)
lagoon holding
would only largely
explainliquid manure
a change [30].NH
in the Manure
4+-NH3surface
equilibrium
NH3 depends on the + NH4 +facilities
of less than 2%.available
Therefore, NHthe4 , the solution in
differences temperature,
the surfaceandNHpH. While the
3 between storage concentration
were likely
was not measured,
primarily pH and
a result of the temperature
differences were in themeasured (0.3 mofdepth).
characteristics Basedheld
the manure on aincompilation
the storage offacility.
studies, +
Theit high
was likely
CBG atthat
the the
WI NH 4 of
basins the WI storage
compared pit lagoon
to the IN slurry was
andmuch higher correlation
the positive than that atbetween
the IN CBG
lagoon; the compilation indicated a mean NH + −3 for slurry, 0.75 kg m−3 for milking
and emission (previously discussed) 4 -N
would of 1.12 the
support kg mhypothesis of higher surface NH3 at the WI
centerbasins
manure and wastewater, and 0.38 kgAs −3 for lagoon surface water [30]. The equilibrium between
mpreviously
compared to the IN lagoon. stated, the mixing of the solution in the storage to
NH4 +the
andsurface
NH3 atofathe given temperature
storage (and thus is evident
maintainingby thehigh
solution’s
NH4+ and pH.NH Although only measured
3 concentrations at the for
surface)
limited periods of time, the differences in pH at 0.3 m in the WI basins and IN lagoon (summer pHAtmosphere 2020, 11, 1108 10 of 16
averaged 7.2 in the IN lagoon and 6.6 in the WI basin while fall pH averaged 8.3 in the IN lagoon
and 7.1 n the WI basin) would only explain a change in the NH4 + -NH3 equilibrium of less than 2%.
Therefore, the differences in the surface NH3 between storage facilities were likely primarily a result
of the differences in the characteristics of the manure held in the storage facility. The high CBG at
the WI basins compared to the IN lagoon and the positive correlation between CBG and emission
(previously discussed) would support the hypothesis of higher surface NH3 at the WI basins compared
to the IN 2020,
Atmosphere lagoon.
11, x As
FORpreviously
PEER REVIEW stated, the mixing of the solution in the storage to the surface 10 ofofthe
16
+
storage (and thus maintaining high NH4 and NH3 concentrations at the surface) would be expected
to be more
would efficient to
be expected forbe
the liquid
more solution
efficient forof the
the IN lagoon
liquid than
solution of the
the slurry found
IN lagoon in the
than the WI basins
slurry found[4].
Consequently, the greater source strength of the WI basins over the IN lagoon did not
in the WI basins [4]. Consequently, the greater source strength of the WI basins over the IN lagoon appear to be
associated
did withto
not appear mixing efficiency.
be associated with mixing efficiency.
3.1.2. Wind
3.1.2. Wind Influence
Influence
Gas transport
Gas transport intointo the
the atmosphere
atmosphere acrossacross the
the exchange
exchange surface
surface is
is controlled
controlled partially
partially by
by the
the
diffusion rate
diffusion ratethrough
througha laminar
a laminar layer of air
layer of near the surface
air near and partially
the surface by the diffusion
and partially rate through
by the diffusion rate
a turbulent layer of air above the laminar layer. In general, wind shear at
through a turbulent layer of air above the laminar layer. In general, wind shear at the surfacethe surface promotes the
emission of
promotes theNH 3 from the
emission of NHstorage surface through turbulent diffusion of the gases released from
3 from the storage surface through turbulent diffusion of the gases
solution at the liquid surface [31] or
released from solution at the liquid surface diffusion of or
[31] thediffusion
gas through crust
of the gas or pore spaces.
through crust or pore spaces.
A very weak linear relationship between
A very weak linear relationship between U and QNH3 U and Q (25 U) occurred at the IN lagoon (R2 = 0.002;
NH3(25,,U) occurred at the IN lagoon (R2 = 0.002;
Figure 5).
Figure A weak
5). A weak linear
linear relationship
relationship between
betweenU UandandQQNH3 (25 U) occurred at the WI basins (R2 = 0.06;
NH3(25,,U) occurred at the WI basins (R2 = 0.06;
Figure 5).
Figure The higher
5). The higher correlation
correlation of of UU to
to the
the QQNH3 (25, U)at
NH3(25,U)
atthe
theWIWIbasins
basins than
than the
the IN
IN lagoon
lagoon suggests
suggests
that the greater source strength of the WI basins may partially be a result of greater
that the greater source strength of the WI basins may partially be a result of greater mixing in the mixing in the air
air
over the
over the WI
WI basins
basins than
than the
the IN
IN lagoon.
lagoon.
Figure 5. Influence
Influence of wind speed on temperature-normalized
temperature-normalized emissions. Daily Daily mean
mean wind speed
related to the temperature-normalized (to 25 ◦°C) C) daily emissions are indicated for the WI dairy basins
(open circles) and IN dairy lagoon (closed circles). Linear
Linear regression
regression fits for the WI (dashed line) and
IN (solid line)
line) are
areindicated.
indicated.One
Oneoutlier
outlierhigh
highemission
emissionvalue
value
forfor
thethe
ININ lagoon
lagoon waswas excluded
excluded from
from the
the figure
figure but but
not not excluded
excluded fromfrom the analysis.
the analysis.
3.1.3. Influence
3.1.3. Influence of
of Operational
Operational Activities
Activities
The settling
The settling pit
pitatatthe
thenorth
northendendofof
thethe
ININ dairy
dairy lagoon
lagoon waswas cleaned
cleaned on aon a regular
regular basisbasis
with with
nine
cleaning events during measurements. Of the nine cleaning events during measurements, onlyonly
nine cleaning events during measurements. Of the nine cleaning events during measurements, six
six occurred
occurred underunder
above above freezing
freezing conditions
conditions andthree
and only onlyofthree
theseofhad
these had emission
emission estimatesestimates for
for all three
all three
days. days.
Since Since the
the settling settling
pit was pit the
outside waslagoon
outside the lagoon
emission emission domain,
measurement measurement domain,
the cleaning the
events
cleaninghave
should events should have
a negligible effecta on
negligible
lagoon effect on lagoon
emissions. emissions.
The mean Thedaily
QNH3(25,2) meanemissions
QNH3 (25,2)
thedaily
day
before, day of, and day after cleaning events were 55 µg m−2 s−1 ± 13 µg m−2 s−1, 59 µg m−2 s−1 ± 13 µg
m−2 s−1, and 56 µg m−2 s−1 ± 4 µg m−2 s−1, respectively. As might be expected due to the low sample size,
there was no significant difference in emissions between the day before and the day of cleaning (n =
5 unpaired t of −0.09, critical t for two-tailed α = 0.05 of 2.57) or between the day of and the day after
cleaning (n = 4, unpaired t of −0.15, critical t for two-tailed α = 0.05 of 2.78). The lack of influence ofAtmosphere 2020, 11, 1108 11 of 16
emissions the day before, day of, and day after cleaning events were 55 µg m−2 s−1 ± 13 µg m−2 s−1 ,
59 µg m−2 s−1 ± 13 µg m−2 s−1 , and 56 µg m−2 s−1 ± 4 µg m−2 s−1 , respectively. As might be expected
due to the low sample size, there was no significant difference in emissions between the day before and
the day of cleaning (n = 5 unpaired t of −0.09, critical t for two-tailed α = 0.05 of 2.57) or between the
day of and the day after cleaning (n = 4, unpaired t of −0.15, critical t for two-tailed α = 0.05 of 2.78).
The lack of influence of manure removal on NH3 emissions was consistent with prior studies [32].
The liquid/solid separator for the WI dairy was also outside the basin emission measurement
domain but influenced the composition of the material in the basins. The separator removed bedding
and solids that had been washed from the milking area, holding area, and barns. As previously
stated, the equipment frequently failed, resulting in only 12 days of valid measurements when the
separator was operating and 25 days when it was not operating. Since the separator commonly
failed in the winter when the surface was frozen (Tables S2 and S4), there were only 19 valid
measurement days when it was not operating. The mean QNH3 (25,2) daily emissions with solids
separation (80 µg m−2 s−1 ± 27 µg m−2 s−1 ) was not significantly different (unpaired t of 0.11, critical t for
two-tailed α = 0.05 of 2.05) from that when there was no solids separation (83 µg m−2 s−1 ± 32 µg m−2 s−1 ).
Crusting, commonly resulting from the lack of solids separation, has been shown to affect NH3 emissions
(but not with statistical significance) [5]. At this dairy, the separation was never sufficient to result in
no crust on the storage surface. Consequently, it is not surprising that separation had no statistically
different NH3 emissions.
The cow bedding material changed a few times at the WI dairy and included shavings, sand,
recycled sand, and a mix of sand and recycled sand (Table S4). These changes could potentially change
the emissions of the basins. The mean QNH3 (25,2) daily emissions were not significantly different
(unpaired t of 0.11, critical t for two-tailed α = 0.05 of 2.05) between when the bedding comprised wood
shavings (12 days, 80 µg m−2 s−1 ± 27 µg m−2 s−1 ) or sand (19 days, 83 µg m−2 s−1 ± 32 µg m−2 s−1 ).
While prior studies indicate the change in bedding may [33] or may not [34] result in a change in NH3
emissions in the first several days, these studies focused on the effect of bedding while in use (and its
ability to keep urine and feces separated). Once the bedding is mixed into the waste stream, it is no
longer able to separate liquid and solid components of the waste and would likely have no effect on
the NH3 emissions of the stored waste as observed.
3.2. Seasonal and Annual Emissions
The estimated annual NH3 area-based emission at the WI basin at 30 µg m−2 s−1 ± 15.2 µg m−2 s−1
was only 11% greater than that at the IN lagoon of 27 µg m−2 s−1 ± 14.6 µg m−2 s−1 (Table 3).
These emissions are comparable to reported cattle slurry emissions [5]. These values are similar to the
baseline emissions extracted from a large number of cattle and dairy studies of lagoon emissions (33 g
m−2 s−1 ) but less than that for the noncrusted slurry (53 µg m−2 s−1 ) [32]. Representativeness of the
measurements in estimating the mean annual daily emissions were assessed by comparing the total
unclassified mean daily emissions to the mean seasonally classified daily emissions (Table 3). The total
valid daily measurements differed from the seasonally classified mean annual emissions by 17% at the
WI dairy and by 3% at the IN dairy: the error in mean annual emissions for the WI dairy is likely much
greater than that for the IN dairy.
Daily emissions at both the IN and WI dairies were highest in the summer, lowest in winter, and
similar during spring and fall (Table 3). Although the summer mean daily emissions were significantly
different (Student’ t-test, α = 0.05) between the 59 µg m−2 s−1 at the WI basins and 38 µg m−2 s−1 at the
IN lagoon (Table 3), the relatively few daily measurements (seven) at the WI basins suggest that this
difference was not based on a representative sample (Table 2). However, the WI emissions during the
summer were similar to baseline emissions extracted from a large number of cattle and dairy studies
of noncrusted slurry emissions (53 g m−2 s−1 ) [32]. The mean summer emissions at the IN lagoon
(well-represented by the 59 days of measurements) were lower than those measured over a summer at
a free-stall dairy lagoon in Alberta, Canada (59 µg m−2 s−1 ) [35].You can also read