Entrepreneurship and Regional Windfall Gains: Evidence from the Spanish Christmas Lottery
←
→
Page content transcription
If your browser does not render page correctly, please read the page content below
Entrepreneurship and Regional Windfall Gains:
          Evidence from the Spanish Christmas Lottery∗
        Vicente J. Bermejo†              Miguel A. Ferreira‡              Daniel Wolfenzon§
                                         Rafael Zambrana¶
                                          March 14, 2021

                                             ABSTRACT
       We exploit regional windfall gains arising from the Spanish Christmas Lottery to
       estimate the effect of transitory shocks to local income on entrepreneurial activity. We
       find higher firm creation in winning provinces. The entrepreneurial response is more
       pronounced in recessionary periods, and in regions with poorer access to finance and
       lower economic development. We show that firms created in winning provinces are
       larger, more profitable, and are likely to survive longer. When looking at the
       characteristics of the individuals who become entrepreneurs, we find a stronger
       response by older individuals and women. Our results suggest that place-based money
       transfers have long lasting effects on the structure of the corporate sector, and that
       such effect depends on the characteristics of the local population as well as on
       economic and financial regional development.

       JEL classification: D14, L26
       Keywords:     Entrepreneurship, Firm Creation,             Disposable Income,       Regional
       Development, Place-based Policy, Business Cycle

   ∗
      We thank Shai Bernstein, Diana Bonfim, Laura Crespo, Joan Farre-Mensa, Xavier Freixas, Sergio Garcia,
Pedro Gete, Jessica Jeffers, Gustavo Manso, William Mullins, Jose-Luis Peydro, Rafael Repullo, Martin
Schmalz, Felipe Silva, Lea Stern, and Su Wang; participants at the Annual Conference in Financial Economic
Research-IDC Herzliya, Corporate Finance Webinar, Econometric Society European Winter Meeting,
European Finance Association Annual Meeting, Financial Intermediation Research Society Conference,
HEC Paris Workshop on Entrepreneurship, Mitsui Symposium on Comparative Corporate Governance and
Globalization, Northern Finance Association Conference, Simposio de la Asociacion Espanola de Economia
(SAEe), and Spanish Finance Forum; and seminar participants at CEMFI, ESADE Business School, London
Business School, Nova School of Business and Economics, Pompeu Fabra University, University of Alicante,
University of Vienna, and University of Zurich for helpful comments. Vicente J. Bermejo acknowledges
financial support from Banc Sabadell and the Spanish Ministry of Science, Innovation and Universities under
PGC2018-099700-A-100. Miguel Ferreira acknowledges financial support from the Fundação para a Ciência e
a Tecnologia.
    †
      ESADE Business School, Ramon Llull University. Email: vicente.bermejo@esade.edu.
    ‡
      Nova School of Business and Economics, CEPR, ECGI. Email: miguel.ferreira@novasbe.pt.
    §
      Columbia University, NBER. Email: dw2382@gsb.columbia.edu.
   ¶
      University of Notre Dame. Email: rzambra2@nd.edu.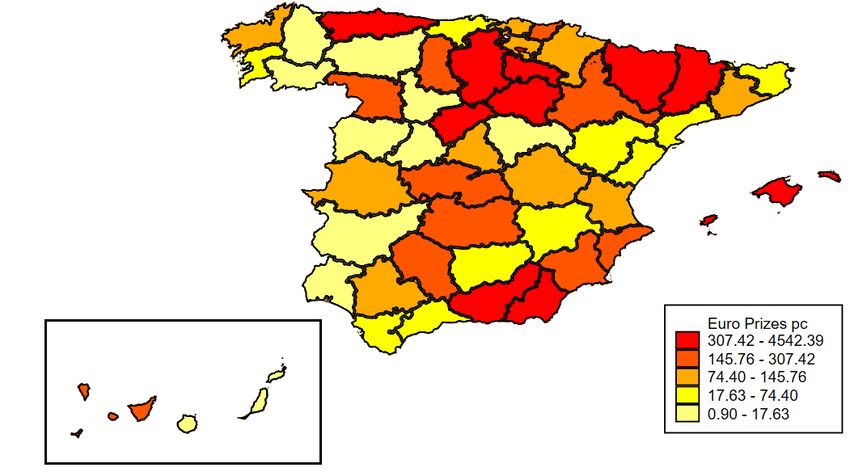
I        Introduction

Place-based economic development policies that target monetary transfers toward geographic
areas, rather than toward particular individuals, are gaining popularity as an effective tool
to foster regional economic development. While the immediate goal of these policies is to
increase aggregate demand, the transitory income shocks generated by such policies can also
affect other economics variables. A growing body of research analyzes the impact of these
policies on consumption, employment, and productivity.1 Yet there is limited evidence on the
aggregate benefits of these policies in terms of increased entrepreneurial activity.
        This paper aims to close the gap in the literature by examining the impact of transitory
increases in disposable income on entrepreneurship. Firm creation is a fundamental force
for economic prosperity and job creation (Ayyagari, Demirguc-Kunt, and Maksimovic, 2011;
Haltiwanger, Jarmin, and Miranda, 2013). The development of new firms generates benefits
for innovation, competition, employment, and growth. We study whether transitory increases
in disposable income spur entrepreneurship, the heterogeneous effects over the business cycle
and across regions, and whether these effects are long lasting.
        Place-based policies that increase local disposable income have often been evaluated by
governments, however targeted regions are usually endogenously selected, making it difficult
to isolate the causal effect of such policies.2 In this paper, we focus on exogenous transitory
shocks to local income across regions and over time arising from direct monetary prizes paid
by the largest lottery in the world, the Spanish Christmas Lottery.
        Several features of this lottery make it suitable for this study. First, the lottery is played
every year regardless of economic conditions, making it a better framework to study the
effect of transitory income shocks than policy changes (such as monetary transfers) that are
    1
      There is an emergent literature that use survey data or stimulus payments to study the effect of monetary
transfers, or other transitory shocks to income, on consumption, employment, food security, education, and
self-reported health (e.g., Chodorow-Reich et al. (2012); Parker et al. (2013); Haushofer and Shapiro (2016);
Hausman (2016); Christelis et al. (2019); Drescher, Fessler, and Lindner (2020)). More specifically, Busso,
Gregory, and Kline (2013); Kline and Moretti (2014) focus on place-based policies and the impact of these
local programs on regional employment, productivity and wages.
    2
      See Baum-Snow and Ferreira (2015) for a complete discussion on identification strategies used to uncover
causal effects in urban and regional economics research.

                                                      1
infrequent and enacted as a function of actual or expected economic conditions. Second, the
lottery prize has an economically significant impact. The winning province (the province that
receives the maximum prize per capita each year) gets an average monetary shock equivalent
to 5.65% of its gross domestic product (GDP). Third, the lottery prize is distributed among
several thousand families sharing the same ticket number rather than awarding one large
prize to a few individuals. Hence, the income shock is closer to that generated by typical
policy mechanisms.3 Fourth, lottery winners are geographically concentrated. Most prizes are
collected in the province where tickets are sold. We estimate that each euro of lottery prize
leads to an increase in province household disposable income of 83 cents. This concentration
generates significant variation in prizes across provinces. Finally, lottery players are likely
to be ordinary citizens, because the lottery is a social event –about 75% of the population
participates. This mitigates concerns that the effect we measure is driven by the behavior of
gamblers, which might differ from that of an average individual.
The key assumption in our empirical strategy is that the winning province is randomly
assigned conditional on expenditures on lottery tickets by province. It is important to
condition on lottery expenditures as, unconditionally, the probability of winning could be
correlated with entrepreneurship. This correlation could arise if the conditions that prompt
individuals to buy lottery tickets are the same as those that encourage entrepreneurship. In
that case, more entrepreneurial provinces would buy more tickets, and thus would be more
likely to win. Indeed, we show that the probability of winning is a function of observables,
such as provincial inflation, unemployment, or GDP per capita. After we control for lottery
expenditure, however, no macroeconomic variable has any explanatory power to predict the
winning province. Thus, after controlling for lottery expenditure, the lottery setting
provides random exogenous variation in regional disposable income.
We show that the lottery prizes have a significant effect on entrepreneurial activity. The
number of new firms increases significantly in winning provinces while there is no significant
3
On average, there are between 1,600 and 16,000 holders of the winning number. This number is a lower
bound of the number of people receiving lottery prizes in a province because, according to survey data, 87%
of the people participate through a syndicate. Moreover, they share their ticket price with relatives (64%),
friends (33%), or co-workers (28%).
2effect on the exit rate of businesses. We also analyze how lottery prizes affect the dynamics of
firm creation over time. The rate of firm creation is similar in both winning and non-winning
provinces in the years before the lottery, mitigating concerns of preexisting differential trends.
After the lottery, the rate of firm creation increases significantly more in winning provinces
than in non-winning provinces. This differential effect disappears three years after award of
the lottery prizes.
To generalize our results beyond the lottery setting, we estimate the effect of disposable
income on entrepreneurship. We address the endogeneity of disposable income by
instrumenting it using the size of the lottery prize (per capita) in each province. Our first
stage confirms that most prizes are collected by households in the province where the tickets
are sold. The second-stage regression indicates that a e1,000 increase in local disposable
income per capita increases the rate of firm creation by 0.3%. This estimate implies that an
increase of one standard deviation in disposable income per capita (e2,680) increases firm
entry by 0.78% (192 firms). Given that the median number of firms created in a province is
1,058, the increase in entrepreneurial activity represents about 18% of the firm creation in a
year.
Next, we study the heterogeneous effects across regions and over the business cycle. We
find that the reaction to income shocks is larger in recessionary periods. This result is
robust to using Organisation for Economic Co-operation and Development (OECD)
recession measures, national GDP growth, and business and consumer confidence indicators.
Prior studies find that entrepreneurial activity varies systematically across regions (Carlton,
1983). The heterogeneity of Spanish provinces gives us an ideal laboratory to examine the
effect of disposable income on entrepreneurship across different levels of financial and
economic. We measure financial development by splitting provinces according to the amount
of bank loans per capita, the number of branches per capita, and the number of branches
per square meter in each province. We measure economic development by splitting
provinces according to their employment rate, population density, and firm agglomeration.
We find that the effect is larger in provinces with poorer access to credit and lower levels of
3economic development. However, we find that higher levels of education contribute to a
higher effect of the lottery prizes on firm creation.
We also compare the response to the shock across industries. The effect on firm creation
is positive and significant for businesses operating in industries that depend heavily on local
demand (i.e., non-tradable industries) as well as for firms that do not depend on such local
demand (tradable and manufacturing industries). The extent of the effect of the lottery on
firm creation is also similar for both groups.
Firm creation spans a wide range of economic activities from small business ownership
to high growth venture capital backed entrepreneurs. Using data on self-employment and
individual characteristics of the entrepreneurs, we show that our main results are robust to
using self-employment as an alternative measure of entrepreneurship. This response is stronger
among older individuals, women, and entrepreneurs that run a single business. These results
highlight how the characteristics of the local population can have a significant impact on the
entrepreneurial responsiveness of the economy.
Lastly, using firm-level data from the Amadeus and Sabi databases, we investigate whether
these transitory income shocks have a long lasting effect. Unlike in other countries, these data
sets allow us to cover detailed firm-level characteristics and financial information on over half
a million Spanish private companies created during our sample period. We find that firms
created as a response to the lottery shock survive longer. Importantly, these firms are also of
higher quality. They are significantly larger (in terms of assets and number of employees), pay
higher aggregate wages, and exhibit better financial performance. These results are consistent
with Sedláček and Sterk (2017), who find that firm quality and growth are influenced by
economic conditions at the time of entry.
Our results make two novel contributions to the existing literature on entrepreneurship:
(i) we provide causal evidence and quantify the effect of transitory income shocks on
entrepreneurial activity over the business cycle and across regions with different levels of
financial and economic development, and (ii) we document that the quality of the marginal
entrant is high, supporting the premise behind place-based monetary transfers that promote
4regional economic development.
There is a large literature analyzing the channels through which different economic factors
may affect entrepreneurship. These include studies that focus on the relation between the
propensity to start a business and shocks to unemployment insurance (Hombert et al., 2020),
to housing collateral (Adelino, Schoar, and Severino, 2015; Schmalz, Sraer, and Thesmar,
2017), and to personal wealth (Evans and Leighton, 1989a; Evans and Jovanovic, 1989; Holtz-
Eakin, Joulfaian, and Rosen, 1994; Hurst and Lusardi, 2004). In our setting many of these
different channels may be at play, in addition to other potential channels (e.g. increase in local
demand). Thus, our setting allows us to study and quantify the overall impact of transitory
shocks to local income on entrepreneurial activity.
Holtz-Eakin, Joulfaian, and Rosen (1994) find that firms started due to a large
inheritance are more likely to survive, a finding they interpret as evidence of credit
constraints. On the other hand, Andersen and Nielsen (2012) use Danish data to show that
businesses started following a large inheritance exhibit lower performance. While these
papers focus on analyzing individuals’ reactions, we study the aggregate response of a
region. Angelucci and De Giorgi (2009) show that money transfers affect local economies at
large, and not only awarded individuals. Thus, we contribute to this literature by using
exogenous variation in regional income, which allows us to estimate the overall effect of a
transitory income shock on entrepreneurship at the aggregate level.
Finally, we contribute to a growing literature that uses lottery data as an exogenous
(unearned) income shock in order to study a number of individual decisions. This literature
focuses on the effects of lottery prizes on labor supply (Imbens, Rubin, and Sacerdote, 2001;
Cesarini et al., 2017); individual bankruptcy (Hankins, Hoekstra, and Skiba, 2011);
consumption (Kuhn et al., 2011); and political election outcomes (Bagues and Esteve-Volart,
2016). One caveat related to the lottery setting is that the results may not be representative
of the response to other forms of unearned income shocks since lottery participants are
typically different (e.g., less risk averse) than the average individual. However, two key
aspects of the Spanish Christmas Lottery differentiate it from other lotteries – about 75% of
5the Spanish population participates and it produces an income shock to several thousand
households in the same geographic area. Thus, this lottery provides a unique setting to
study how direct money transfers to individuals in a region affect entrepreneurship.
The remainder of the paper is structured as follows: in Section II, we describe the
background information on the Spanish Christmas Lottery and provide a description of the
data. Section III discusses our empirical strategy and presents causal evidence on the effect
of disposable income on entrepreneurship. In Section IV, we examine whether the effect of
the lottery prize on entrepreneurship is heterogeneous over the business cycle and across
provinces with different levels of financial and economic development. Section V explores
the long term effects on the structure of the corporate sector. Finally, in Section VI, we
provide concluding remarks.
II Empirical Setting and Data
A Christmas Lottery
The Spanish Christmas Lottery (Loterı́a del Gordo) is a national lottery game that has been
held since 1812. The lottery takes place every year on December 22 and is the biggest
lottery worldwide. Compared with the more than 500 other lotteries held every year in Spain,
the Christmas Lottery represents one-fifth of total lottery sales. About 75% of the Spanish
population participates and around 70% of the participants play no other lottery. The amount
of money spent is similar across individuals; 70% of individuals spend less than e60, and only
about 8.5% spend more than e150.
The tickets have five-digit numbers. There were 66,000 numbers played until 2004, 85,000
between 2005 and 2010, and 100,000 since 2011. Each number is typically sold by one lottery
outlet, and the numbers allocated to each outlet are randomly assigned. Each number is
divided into 160 series, and each of these series is in turn divided into 10 fractions. These
1,600 fractions are the official tickets sold in regulated lottery outlets at a cost of e20 each. It
is very usual that official tickets are further split into shares. Unregulated associations divide
6the e20 tickets further into e5 and e2 shares and resell them to the public or members of
these associations. Thus, depending on the number of shares sold, there could be between
1,600 and 16,000 holders for each number.
The money allocated for prizes is 70% of the money collected. The remaining 30% is
distributed as commissions for sales outlets, for internal revenue, and to cover administrative
costs. Holders of the first prize get e20,000 per euro played; holders of the second prize get
e6,250 per euro and holders of the third prize get e2,500.4
B Data
We obtain data on expenditures and monetary prizes of the Christmas Lottery from Sociedad
Estatal Loterias y Apuestas del Estado. Our sample covers the period from 1994 through
2016. For each of the 50 provinces in Spain, we observe the total number of tickets sold,
lottery expenditures, and the amount awarded to tickets sold in the province. We only have
information on the top three prizes but they account for about three-quarters of the total
prizes. Our information is on the prizes received by tickets sold in the province, and not on
prizes received by province residents. However, using National Accounts statistics, we show
that most prizes are collected in the province where the tickets are sold.
We obtain information on macroeconomic variables at the province level for the period
1994-2016. The data on disposable income, gross domestic product (GDP), consumer price
index (CPI), unemployment, and population are from INE (Instituto Nacional de
Estadistica).5 Data on house prices are from several sources.6
We collect data aggregated at the province level on total number of firms and firm creation,
from the Spanish Central Mercantile Register. In particular, this data comes from the Spanish
Central Directory of Enterprises (Directorio Central de Empresas, DIRCE) it is compiled by
4
Prizes were e10,000, e4,800, and e2,400 per euro played between 1986 and 2004, and e15,000, e5,000,
and e2,500 between 2005 and 2011. All lottery prizes were tax-exempt until 2013, and a 20% tax was
imposed for prizes larger than e2,500 since 2013. See Bagues and Esteve-Volart (2016) for more details about
the Christmas Lottery data and players’ characteristics.
5
Data on disposable income is available for the period 1995-2010.
6
ST Sociedad de Tasación (the largest independent Real Estate Valuation firms in Spain), and Idealista
and Fotocasa (the two largest real estate web portals in Spain).
7the Spanish National Statistics Office (Instituto Nacional de Estadistica, INE), and does
not provide firm-level data. DIRCE is the first official database on individual firms for the
Spanish economy, it contains information since 1995 on the entire population of firms in Spain.
In addition, we obtain data on self-employed individuals and their characteristics from the
Ministry of Labor and Social Security.
We also include information provided by Infolaso on province surface size, and education
from INE. Data on confidence indexes for consumers and businesses is from the OECD.
We also use OECD based recession indicators downloaded from the FRED (Federal Reserve
Economic data) database.
Finally, we obtain firm-level data from the Amadeus and Sabi databases. Amadeus is a
commercial pan-European database provided by Bureau van Dijk. For Spain, Amadeus covers
financial information on over 2.5 million public and private companies. The database includes
detailed firm-level characteristics and financial data. Amadeus also provides information on
year of incorporation, industry (three-digit NACE code—the European standard of industry
classification), and the zip code of firms’ headquarters. We also use the Sabi database, an
enhanced version of Amadeus for Spain. Sabi is useful because it covers a larger fraction of
new and small firms across all industries, and provides information not only on active firms
but also on firms that have ceased operations.
C Summary Statistics
Table 1 presents summary statistics for the lottery, macroeconomic and entrepreneurship
variables at the province level. Panel A summarizes the lottery expenditure, number of
winning tickets, and lottery prizes (top three) by province. The average yearly expenditure
per capita in a province is e58, representing about 0.28% of the provincial GDP. The average
lottery prize is e21 per capita or about 0.18% of the provincial GDP.
Panel B of Table 1 presents summary statistics for the province with the maximum prize
per capita in each year (winning province). Winning provinces spend e79 per capita on
lottery tickets on average, which not surprisingly is above the average of e58 for all provinces.
8The average lottery prize per capita is e760, which represents 5.65% of the provincial GDP.
The number of official tickets awarded in winning provinces is about 1,530, which represents
approximately one for every 550 people. Because the e20 tickets are usually split into smaller
shares of e5 and e2, and most individuals tend to share tickets with relatives and friends,
this figure represents a lower bound for the number of people receiving lottery prizes in a
region.
Panel C presents macroeconomic characteristics of the provinces. The average province
has GDP per capita of about e20,000, disposable income per capita close to e13,500, a
2.4% inflation rate, a 17% unemployment rate, and 870,000 people. Average total firms per
province are close to 25,000, and average new firms are 2,137.
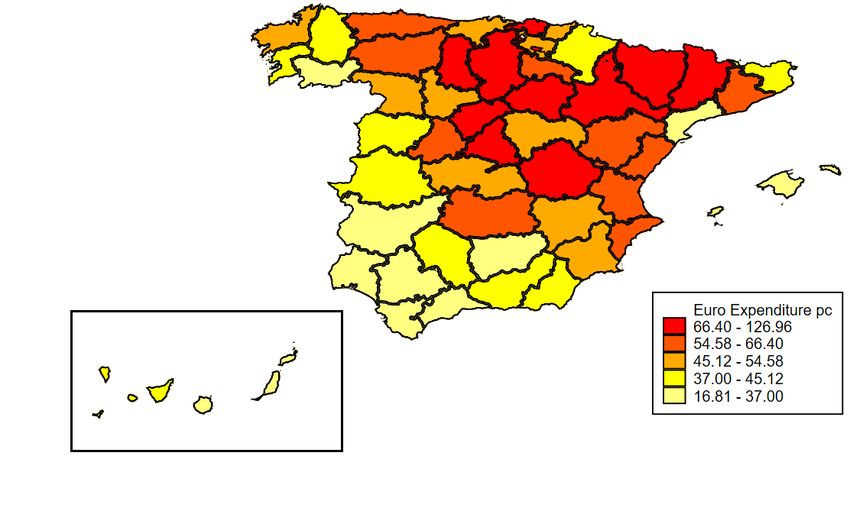
Figure 1 shows the average lottery expenditure per capita (Panel A) and average prize
per capita (Panel B) by province during our sample period. There is a large variation across
provinces both in terms of where the lottery was awarded and how much was the total prize
per capita. Our empirical setting exploits this variation.
Table IA.1 in the Appendix reports summary statistics for the characteristics of new
firms for their first five years. This include assets, number of employees, wages and financial
performance (return on assets). The average new firm has e294,200 in assets, between two
and three employees, e35,800 in average total wages, and a ROA of -10%.
III Effect of Lottery on Entrepreneurship
We use exogenous variation in disposable income arising from lottery prizes to estimate the
effect of disposable income on entrepreneurial activity. First, we discuss our empirical strategy
and analyze the validity of our instrument. We then present the estimates of reduced-form
regressions and those of instrumental variables regressions of the effect of disposable income
on entrepreneurship.
9A Empirical Strategy
In this section we discuss the validity of our instrument, and in particular, we focus on the
exclusion restriction. We present evidence suggesting that, after controlling for lottery
expenditures, the lottery provides exogenous variation in disposable income. While the
winning number is randomly chosen, the number of tickets bought in each province is not.
Moreover, the decision to buy lottery tickets might be influenced by local economic
conditions. This would be a concern if the conditions that lead people to buy lottery tickets
are the same as those that encourage entrepreneurship.
Table 2 shows this is indeed the case. We estimate OLS regressions of the lottery prize
per capita on several macroeconomic variables. We show that the inflation rate, the
unemployment rate and the GDP per capita have predictive power when we do not include
the lottery expenditure in the regression. This is because in provinces with higher inflation,
lower unemployment or higher GDP per capita (provinces with better economic conditions),
residents buy more lottery tickets. While we can control for these 3 variables, the concern is
that other variables could also be correlated with the probability of winning through the
number of tickets bought.
Yet, since every ticket has the same probability of winning, when we condition on the
lottery expenditure in a province, the winning province should be as good as randomly
assigned. Indeed, when we control for lottery expenditure, the inflation, the unemployment
and the GDP per capita ares no longer significant in columns (2), (4) and (6). Columns (7)
and (8) show that no other macroeconomic variable has any power predicting the winning
province when we control for total expenditures in the lottery at the province level. We
conclude that the lottery prize seems to provide truly exogenous variation in disposable
income after controlling for total lottery expenditure.
10B Baseline Estimates
We examine the effect of the random transitory income shock generated by the lottery on
entrepreneurship. Our baseline specification employs a difference-in-differences estimator that
exploits heterogeneity in lottery prizes per capita and compares firm creation across provinces.
Given the large heterogeneity among Spanish provinces, we include province fixed effects to
control for unobserved time-invariant province heterogeneity. Thus, effectively, the estimator
is driven solely by within-province variation.
The province-level (reduced-form) regression we estimate is as follows:
Yj,t = βLottery P rizej,t−1 + θLottery Expenditure pcj,t−1
+ γZj,t−1 + ωt + δj + εj,t (1)
where Yj,t is the F irm Entry (number of new firms in year t divided by number of established
firms in year t − 1) in province j; Lottery P rizej,t−1 is the lottery prizes per capita in
province j in year t − 1,; and Lottery Expenditure pcj,t−1 is the lottery expenditure per
capita (in thousands of euros) in province j in year t−1. The coefficient of interest β measures
the average difference in the entry rate between winning and non-winning provinces. Zj,t−1
includes the inflation rate (Inf lation Rate), the unemployment rate (U nemployment Rate),
the logarithm of the population (P opulation), the logarithm of GDP per capita (GDP pc), the
logarithm of housing prices (Housing P rice), and the bank loans per capita (Bank Loans)
in province j in year t − 1. ωt is a time fixed effect. δj is a province fixed effect. Standard
errors are clustered at the province level.
Table 3 shows the results for the entry rate. We find a positive and significant effect of the
lottery prize on the entry rate in winning provinces. The regression in column (1) controls
for several macroeconomic variables, and includes province and time fixed effects. Results
are robust to different specifications, including the inclusion of the lottery expenditure in
column (2) and the number of awarded tickets in column (4). The estimate in column (3)
indicates that the entry rate increases by about 0.23% for every e1,000 of lottery prizes per
11capita. Given that the average entry rate is about 8.7% over the sample period, the effect
of the lottery prize represents about 2.7% of the average. In column (5), results are also
robust when we drop from the sample Madrid and Lleida, which are provinces with special
characteristics.7
Table 4 shows the dynamic effect of lottery prizes on firm creation. We use the specification
in equation (1) with three lags and three leads of the F irm Entry variable. There is a
significant increase in the number of new firms created in the two years after the lottery
awards in winning provinces. Moreover, we find that treatment and control groups follow
parallel trends before lottery prize awards, mitigating concerns about preexisting differential
trends.
Because factors that influence exits out of self-employment may be quite different from
the determinants of entry, Table IA.2 in the Appendix replicates the structure of Table 3, but
analyzing whether the lottery awards affect the decision to close existing firms. We estimate
equation (1) using the firm exit rate at the provincial level as the dependent variable. We
could expect an increase of firm exit due to higher competition, and a reduction of exits due
to an increase in local demand. Results are inconclusive since most of the specifications are
not significant or weakly significant. This indicates that no effect seems to be dominating.
C Effect of Disposable Income on Entrepreneurship
The reduced-form estimates so far show that lottery prizes have a positive and significant
effect on entrepreneurial activity. While the results are interesting in their own right, they
cannot be generalized beyond the Spanish lottery setup. To provide a more general result,
we estimate the effect of disposable income on firm creation.
Clearly, an ordinary least squares (OLS) regression of disposable income on
entrepreneurial activity would deliver biased estimates, as many unobservable variables
7
Madrid is the capital and largest city in Spain, and exhibits unique features such as high lottery
expenditure and economic activity. The province of Lleida includes the small village of Sort, which has a
strong Christmas Lottery tradition and receives buyers from all over the country for superstitious reasons
(sort is the Catalan word for “luck”).
12could drive both income and entrepreneurship at the provincial level. Instead, we estimate
instrumental variables (IV) models using lottery prizes as an instrument for disposable
income.
Table 5 shows our results for our instrumental variables model. For purposes of
comparison, column (1) presents an OLS regression of the entry rate on disposable income
per capita (without instrumenting disposable income with the lottery prize). We find that
the Disposable Income pc coefficient is positive and significant. This estimate indicates that
a e1,000 increase in disposable income per capita increases firm entry by 0.34%. In the
first-stage regression, we predict disposable income per capita (in thousands of euros) in
each province using the lottery prize per capita (Lottery P rize pc). Column (2) indicates
that disposable income per capita increases by 83 cents for every euro of lottery prize. That
is, almost every euro of the prize is received by an individual on the province in which the
tickets are sold. The F -statistic of this first-stage regression is 166, well above the
conventional threshold for weak instruments (Stock and Yogo, 2005).
Next, we turn to the effect of disposable income on entrepreneurial activity. In the second-
stage regression, the dependent variable is the entry rate. Column (3) shows the second-stage
results when disposable income per capita is instrumented with the lottery prize per capita.
We find that a e1,000 increase in disposable income per capita increases the entry rate
by 0.29%.8 This implies that an increase of one standard deviation in disposable income per
capita (e2,680) increases yearly firm entry by 0.78% (0.29×2.68). This represents an increase
of 192 firms (0.78 × 24, 647), which is about 18% of the median number of new firms created
in a province (192 ÷ 1054).
8
The estimate in column (3) is lower than the OLS estimate in column (2). The OLS estimate overestimates
the average effect as omitted variables such as macroeconomic conditions tend to affect firm creation and
income in the same direction.
13IV Heterogeneous Responses
Different regional and economic development may affect the effectiveness of place-based
policies targeting monetary transfers. In this section we examine the heterogeneous effect of
the lottery prize on entrepreneurship over the business cycle and across provinces with
different levels of financial and economic development.
A The Business Cycle
We analyze whether the effect of the lottery prizes on entrepreneurship depends on the phase
of the business cycle. To do this, we classify each year into recession or expansion according
to the OECD based recession indicators. These indicators are monthly and at the national
level. In columns (1) and (2) of Table 6 we split our sample according to whether a year has
at least one month classified as recession, and in columns (3) and (4) we split our sample
according to whether a given year has more than 6 months classified as recessions. Columns
(1), (2), (3) and (4) show that the effect of the lottery on entrepreneurship is significantly
larger in recessionary periods.
Alternatively, column (5) and (6) show that the effect of the lottery prize is more
pronounced in periods with below the median GDP growth. Similarly, in columns (7), (8),
(9) and (10) we find that the effect is stronger in periods where the business confidence
index and the consumer confidence index are below the median of our sample period.9
All these results show that the effect of the income shock on entrepreneurship is more
pronounced in declining periods of the business cycle. Thus, our findings suggest that nascent
entrepreneurs are more likely to react to an increase in local income by setting up new ventures
during recessions, periods when there is less competition although investment opportunities
are rare.
9
Table IA.4 in the Appendix provides the yearly classification of all our business cycle indicators.
14B Province Heterogeneity
In searching for a theoretical framework to provide a lens through which spatial variation of
entrepreneurship could best be interpreted and explained, scholars have gravitated towards
models highlighting the extent to which entrepreneurial opportunities prevail or are impeded
within a spatial context. This has generated an exhaustive literature linking region-specific
characteristics that either promote or impede entrepreneurial opportunities to various
measures of regional entrepreneurship. We analyze whether the impact of the income shock
on entrepreneurship is heterogeneous across provinces with different characteristics.
We first analyze the financial development of the regions. We split the provinces every year
by the median value of bank loans per capita, number of branches per capita and branches per
square meter as a measure of local access to credit.10 In Table 7 we find that the estimates
of the Lottery P rize coefficient are significantly higher in the samples with below-median
values for the number of banks loans per capita, branches per capita and branches per square
meter. These results indicate that the effect of the lottery prize on entrepreneurship is more
pronounced in provinces with poorer access to credit. These results are consistent with the
interpretation that financial constraints play an important role in shaping the effect of the
lottery prize on entrepreneurship.
A set of interrelated conditions is likely to hinder entrepreneurship in disadvantaged
areas. These obstacles influence both the extent and form of entrepreneurial activity. They
also affect the likelihood that new firms, once established, will survive. Impediments to
entrepreneurship in deprived communities are seen to include low development, low
education, or poor urbanization economies. While these obstacles are not exclusive to
deprived localities, their prevalence, the likelihood that they will operate simultaneously,
and their severity are often greater in poorer communities. Therefore, we would expect
individuals in less developed regions to have a larger entrepreneurial response when there is
an improvement in their local economic conditions.
Inspired by the theories of new economic geography, population density is a key factor
10
Data on loans and bank branches are from the Bank of Spain.
15in explaining entrepreneurship. These agglomeration effects, including spillovers and demand
effects, may favor entrepreneurial activity. Indeed, spillover effects may appear through pooled
labor markets, non-pecuniary transactions or information spillovers. But beyond a threshold,
diseconomies of agglomeration such as competition may occur. Urbanization economies are
more general spillovers favored by the proximity of other firms or households. Armington and
Acs (2002) show that population density is positively related to new firm formation in the
US. Spain is known to be a country exhibiting both highly urbanized and rural regions.
Human capital is another important firm creation determinant, and its effect on
entrepreneurial activity is not clear. On the one hand, a high regional educational level
should stimulate start-up activity as high skilled individuals may be better at discovering
and exploiting entrepreneurial opportunities. Doms, Lewis, and Robb (2010) find a positive
link between regional labor force education and firm entry and post-entry growth. Moreover,
Gennaioli et al. (2013) show that human capital is a key factor for entrepreneurial
development. But, on the other hand, the high graduates can prefer to choose a paid work
as they face little risk of unemployment and high-income levels. These findings are
consistent with various theories that argue that entrepreneurship requires certain level of
education and managerial skills (Evans and Leighton, 1989a) and with evidence that shows
that firm creation as a response to an increase in local demand is driven mainly by young
and skilled individuals (Bernstein et al., 2018).
In Table 8 we analyze several indicators on the economic development of the Spanish
regions. In particular, we split the provinces every year by the median value of the
employment rate, population density, firm agglomeration and education. We find that the
effect of the lottery on entrepreneurship is more pronounced in provinces with lower
employment rate, lower population density and lower firm agglomeration. This indicates
that firm creation increases more following income shocks in provinces with lower economic
development. However, in columns (7) and (8) we find that the effect is stronger in regions
with higher education.11 Our results confirm that despite the effect is stronger in lower
11
The data for education is only available up to 2010. To have the same sample period in Table 8 and given
the persistence of education, we repeat the values of 2010 for the period 2011-2016. Results are qualitatively
16economically developed regions, education needs to be high for the effect to be significant.
C Entrepreneur Characteristics
First, we extend our analysis to examine the creation of businesses by self-employed
individuals. These individuals rarely incorporate their business and hence their
entrepreneurial activity is not captured by our measure of new firms. For this reason, using
these alternative data serves as an independent test of our main result.
We estimate the regression in equation (1) using as the dependent variable the growth
rate of the number of self-employed individuals (net entry rate) between year t and year t − 1.
Table 9 presents the results. In column (1) we find that the income shock has a positive and
significant effect on self-employment in winning provinces compared to non-winning provinces.
We also examine the characteristics of the individuals who become entrepreneurs when
local disposable income increases due to prizes of the Spanish Christmas Lottery. These
results inform us about which individuals are more likely to react to a transitory income
shock by creating a new business. Rosenthal and Strange (2012) show that several forces such
as networks and domestic burdens make gender to be a differential aspect in the development
of entrepreneurship. We find a stronger entrepreneurial reaction by females to the lottery
awards. Moreover, we confirm prior results by Evans and Leighton (1989b) and find older
individuals to be conducive to higher entry. Finally, we also find a stronger reaction by
individuals who hold a single job and are thus full-time employed at newly created firms.
D Results by Industry
In this subsection, we analyze which types of firms are created as a response to the lottery
prizes. In particular we group firms into non-tradable, tradable, and construction industries
at the four-digit NAICS level. This classification is obtained from Mian and Sufi (2014). We
use this classification to shed some light on the role that local demand has on the relation we
observe between lottery awards and firm creation.
similar if we use the sample up to 2010.
17In Table 10 we estimate the same model as in column (3) of Table 3 but, in each column,
we restrict the sample to specific industries. These analyses are done using the SABI sample
(which provides individual firm information and industry codes), since the DIRCE sample
does not provide industry information and is aggregated at the province level. In column
(1) we show that our baseline estimates using the SABI sample are of similar magnitude to
those in Table 3. In column (2) we find that, when we exclude non-tradable and construction
industries from our sample, the effect of the lottery on the entry rate is slightly reduced to 0.19,
but it remains positive and significant. In column (3) we focus on the construction and the
non-tradable industries, and column (4) shows that the effect remains positive and significant
at 0.23 in tradable industries. More specifically, in column (5) we focus on manufacturing
industries and find that the impact of the lottery on firm creation is positive and significant
at 0.33.
This analysis is also informative of the channels that may explain the effect of the lottery
on entrepreneurship (e.g., Adelino, Schoar, and Severino (2015)). Our estimates for the
Lottery P rize coefficient are of similar size for different industries. If the effect of the
lottery on entrepreneurship were driven largely by a local demand shock, we would expect
the Lottery P rize coefficient to be significantly lower when we exclude industries that rely
more on local demand, such as non-tradables and construction. Yet, we do not find this to
be the case. Indeed, our results are significant when we limit our analysis to tradables and
manufacturing, the industries that are less likely to be affected by local demand. This
comparison suggests that our results are not solely driven by the demand channel.12
In Table IA.3 in the Appendix we use the alternative data set on self-employed individuals
explained in Section IV.C. We confirm a positive effect of the lottery on individuals working
in the services sector. Moreover, we also find a significant and positive effect on self-employed
individuals operating in the manufacturing sector, consistent with our results not being solely
driven by an increase in the local demand.
12
The results in Table IA.5 in the Appendix are inconsistent with the hypothesis that lottery prizes
significantly increase local demand and in turn, reduce firm exit. Even when we focus on industries that
depend more heavily on local demand (non-tradable), we do not find that the lottery prizes reduce firm exit.
18V Firm Outcomes and Survival
In this section, we study whether a local transitory shock to income may have long term
effects on the regional structure of the corporate sector. We analyze the effect of the lottery
income shock on the outcomes of newly created firms, conditional on entry. We study firm
survival and several new firm’s outcomes during their first five years of life. First, we estimate
the following regression of outcomes of firms created in year t:
Yi,s,j,t+n = βn Lottery P rizej,t−1 + θn Lottery Expenditure pcj,t−1
+ γn Zj,t−1 + δsj + ηst + εi,j,t+n (2)
where Yi,s,j,t+n is the logarithm of assets, logarithm of number of employees, logarithm of
wages, and a performance ratio (as proxied by the return on assets) of firm i, in sector s,
located in province j, in year t + n.
Lottery P rizej,t−1 is the lottery prizes per capita in the province of incorporation of the
firm j in year t − 1. All the other variables in equation (2) are defined as in equation (1).
We include province-sector δsj and year-sector ηs t fixed effects, which controls for unobserved
province-sector and year-sector heterogeneity.
Table 11 presents the estimates at firm creation (year 1), and two (year 2), three (year 3),
four (year 4) and five (year 5) years after firm creation. Conditional on entry, we find positive
and significant effects of the lottery prize on the size of new firms, as proxied by assets and the
number of employees. Using the estimates of firms during the first three years of life, we show
that firms created in provinces awarded with the lottery have about 13% more of assets and
create about 5% more employment. As the annual average firms created during our sample
is 2,137 per province, and each firm generates on average five employees, the average jobs
created by new firms each year in each province is about 10,685.
On the other hand, the average number of firms created in awarded provinces is 2,209
(2, 137 + 0.29 × 24, 647). Because jobs generated by new firms in awarded provinces is about
5% higher, the average jobs generated by these firms is 12,075 (2, 209 × 5 × 1.05). This is
191,390 more jobs than the average jobs created by new firms. We conclude that lottery awards
increase employment of young firms by 13% (12, 075 ÷ 10, 685).
We also find that the lottery prize has a positive and significant effect on the wages and
performance of new firms, which can be observed at creation and up to five years after creation.
We conclude that new firms created as a response to the lottery prize are larger at creation,
and remain larger and perform better in the long run. These results are consistent with
Sedláček and Sterk (2017), who find that firm quality and growth are influenced by economic
conditions at the time of entry.
We next examine the effect of the lottery prize on the probability that a newly created
firm survives for at least a given number of years. We estimate the regression in equation (2)
where the dependent variable is a dummy variable that takes a value of one if the firm survives
at least one (1year), three (3years), five (5years), eight (8years) or ten years (10years) after
firm creation (t). We estimate a linear probability model at the firm level.
Table 12 presents the estimates. We find that firms created in winning provinces versus
non-winning provinces have a significantly higher probability of surviving for at least three,
five and eight years. The estimates show that a firm created in a winning province has
a probability of surviving for five years 0.8% higher than in a non-winning province. We
conclude that firms created due to the income shock are of better quality, as they are more
likely to survive longer. In sum, our findings in this section suggest that a transitory shock
to income can have long lasting effects on the structure of the corporate sector.
Adelino, Ma, and Robinson (2017) show that new firms are the main driver of job
creation following changes in investment opportunities driven by local demand (i.e.,
non-tradable sector), and Decker, McCollum, and Upton (2017) find that start-ups are
responsible for most job creation in response to economic expansions due to shale oil and
gas discoveries. Additionally, Chodorow-Reich et al. (2012); Busso, Gregory, and Kline
(2013); Kline and Moretti (2014) find a positive effect of monetary transfers and place-based
policies on local consumption, employment, and productivity. We provide additional
evidence that an increase in transitory local income have a positive impact on job creation,
20wages, and productivity of young firms.
VI Conclusion
Entrepreneurship is a key driver of economic growth and job creation. We study how
exogenous shocks to transitory income affect entrepreneurship. In particular, we take
advantage of a natural experiment – the Spanish Christmas Lottery – to identify the causal
effect of disposable income on entrepreneurship. We show that winning provinces experience
a positive differential effect on firm creation relative to non-winning provinces. We find no
clear significant effects on firm exit.
We show the lottery prize effect is stronger in recessionary periods and in provinces with
poorer access to credit and lower economic conditions. Moreover, we analyze the
characteristics of nascent entrepreneurs and find that women, older individuals and those
that have a single business significantly react more to the lottery awards. Our results also
hold when we exclude industries that are most likely to be affected by local demand shocks
and when we restrict the sample to manufacturing industries. In addition, we provide
evidence that the effect of this transitory shock to income has long term effects, since we
find that firms created are of better quality. Conditional on entry, firms created in winning
provinces are larger; they exhibit better financial performance, and they are more likely to
survive longer.
This study sheds light on the potential impact of place-based economic development
policies that target monetary transfers toward geographic areas. Our findings suggest that
recessionary periods, and less financially and economically developed areas might benefit the
most from such policies. We also show that firms created as a result of an increase in local
income are of better quality, confirming the long lasting benefits of such policies.
21References
Adelino, M., S. Ma, and D. Robinson. 2017. Firm age, investment opportunities, and job
creation. Journal of Finance 72:999–1038.
Adelino, M., A. Schoar, and F. Severino. 2015. House prices, collateral, and self-employment.
Journal of Financial Economics 117:288–306.
Andersen, S., and K. M. Nielsen. 2012. Ability or finances as constraints on entrepreneurship?
evidence from survival rates in a natural experiment. The Review of Financial Studies
25:3684–710.
Angelucci, M., and G. De Giorgi. 2009. Indirect effects of an aid program: how do cash
transfers affect ineligibles’ consumption? American Economic Review 99:486–508.
Armington, C., and Z. J. Acs. 2002. The determinants of regional variation in new firm
formation. Regional Studies 36:33–45.
Ayyagari, M., A. Demirguc-Kunt, and V. Maksimovic. 2011. Small vs. young firms across the
world: Contribution to employment, job creation, and growth. Policy Research Working
Paper Series 5631,, The World Bank.
Bagues, M., and B. Esteve-Volart. 2016. Politicians’ luck of the draw: Evidence from the
Spanish Christmas lottery. Journal of Political Economy 124:1269–94.
Baum-Snow, N., and F. Ferreira. 2015. Causal inference in urban and regional economics. In
Handbook of regional and urban economics, vol. 5, 3–68. Elsevier.
Bernstein, S., E. Colonnelli, D. Malacrino, and T. McQuade. 2018. Who creates new firms
when local opportunities arise? Working paper,, Stanford University.
Busso, M., J. Gregory, and P. Kline. 2013. Assessing the incidence and efficiency of a
prominent place based policy. American Economic Review 103:897–947.
22Carlton, D. 1983. The location and employment choices of new firms: An econometric model
with discrete and continuous endogenous variables. Review of Economics and Statistics
65:440–9.
Cesarini, D., E. Lindqvist, M. Notowidigdo, and R. Ostling. 2017. The effect of wealth
on individual and household labor supply: Evidence from Swedish lotteries. American
Economic Review 107:3917–46.
Chodorow-Reich, G., L. Feiveson, Z. Liscow, and W. G. Woolston. 2012. Does state fiscal
relief during recessions increase employment? evidence from the american recovery and
reinvestment act. American Economic Journal: Economic Policy 4:118–45.
Christelis, D., D. Georgarakos, T. Jappelli, L. Pistaferri, and M. Van Rooij. 2019. Asymmetric
consumption effects of transitory income shocks. The Economic Journal 129:2322–41.
Decker, R., M. McCollum, and G. Upton. 2017. Firm dynamics and local economic shocks:
Evidence from the shale oil and gas boom. Working paper,, Federal Reserve Board.
Doms, M., E. Lewis, and A. Robb. 2010. Local labor force education, new business
characteristics, and firm performance. Journal of Urban Economics 67:61–77.
Drescher, K., P. Fessler, and P. Lindner. 2020. Helicopter money in europe: New evidence
on the marginal propensity to consume across european households. Economics Letters
195:109416–.
Evans, D., and B. Jovanovic. 1989. An estimated model of entrepreneurial choice under
liquidity constraints. Journal of Political Economy 97:808–27.
Evans, D., and L. Leighton. 1989a. Some empirical aspects of entrepreneurship. American
Economic Review 79:519–35.
Evans, D. S., and L. S. Leighton. 1989b. Some empirical aspects of entrepreneurship. The
American Economic Review 79:519–35. ISSN 00028282.
23Gennaioli, N., R. La Porta, F. Lopez-de Silanes, and A. Shleifer. 2013. Human capital and
regional development. The Quarterly Journal of Economics 128:105–64.
Haltiwanger, J., R. Jarmin, and J. Miranda. 2013. Who creates jobs? Small versus large
versus young. Review of Economics and Statistics 95:347–61.
Hankins, S., M. Hoekstra, and P. Skiba. 2011. The ticket to Easy Street? The financial
consequences of winning the lottery. Review of Economics and Statistics 93:961–9.
Haushofer, J., and J. Shapiro. 2016. The short-term impact of unconditional cash transfers
to the poor: experimental evidence from kenya. The Quarterly Journal of Economics
131:1973–2042.
Hausman, J. K. 2016. Fiscal policy and economic recovery: The case of the 1936 veterans’
bonus. American Economic Review 106:1100–43.
Holtz-Eakin, D., D. Joulfaian, and H. Rosen. 1994. Sticking it out: Entrepreneurial survival
and liquidity constraints. Journal of Political Economy 102:53–75.
Hombert, J., A. Schoar, D. Sraer, and D. Thesmar. 2020. Can unemployment insurance spur
entrepreneurial activity? evidence from france. The Journal of Finance 75:1247–85.
Hurst, E., and A. Lusardi. 2004. Liquidity constraints, household wealth, and
entrepreneurship. Journal of Political Economy 112:319–47.
Imbens, G., D. Rubin, and B. Sacerdote. 2001. Estimating the effect of unearned income
on labor earnings, savings, and consumption: Evidence from a survey of lottery players.
American Economic Review 91:778–94.
Kline, P., and E. Moretti. 2014. Local economic development, agglomeration economies, and
the big push: 100 years of evidence from the tennessee valley authority. The Quarterly
journal of economics 129:275–331.
24Kuhn, P., P. Kooreman, A. Soetevent, and A. Kapteyn. 2011. The effects of lottery prizes
on winners and their neighbors: Evidence from the Dutch postcode lottery. American
Economic Review 101:2226–47.
Mian, A., and A. Sufi. 2014. What explains the 2007–2009 drop in employment? Econometrica
82:2197–223.
Parker, J. A., N. S. Souleles, D. S. Johnson, and R. McClelland. 2013. Consumer spending
and the economic stimulus payments of 2008. American Economic Review 103:2530–53.
Rosenthal, S. S., and W. C. Strange. 2012. Female entrepreneurship, agglomeration, and a
new spatial mismatch. Review of Economics and Statistics 94:764–88.
Schmalz, M., D. Sraer, and D. Thesmar. 2017. Housing collateral and entrepreneurship.
Journal of Finance 72:99–132.
Sedláček, P., and V. Sterk. 2017. The growth potential of startups over the business cycle.
American Economic Review 107:3182–210.
Stock, J., and M. Yogo. 2005. Testing for weak instruments in linear IV regression. In
A. DWK, ed., Identification and Inference for Econometric Models. New York: Cambridge
University Press.
25Table 1: Summary Statistics at the Province Level
This table reports mean, standard deviation, 25th-percentile, median, 75th-percentile and number of
observations for each variable. Our unit of analysis is province and year. Panel A shows the lottery variables
in all provinces. Panel B shows the lottery variables for the province with the maximum prize per capita in
each year. Panel C shows macroeconomic variables. All monetary variables are in constant 2010 euros. The
sample covers the period 1994-2016.
Mean Standard 25th Median 75th Observations
Deviation Percentile Percentile
Panel A: Lottery Variables in All Provinces
Expenditure pc (EURs) 58.48 28.38 41.64 53.78 69.01 1150
Prizes pc (EURs) 21.32 189.74 0.00 0.00 0.87 1150
Number winning tickets 93.49 354.73 0.00 0.00 10.00 1150
Expenditure per GDP (%) 0.28 0.12 0.20 0.27 0.34 1150
Prizes per GDP (%) 0.18 1.42 0.00 0.00 0.01 1150
Panel B: Lottery Variables in Province with Maximum Prize per capita
Expenditure pc (EURs) 78.58 41.01 47.10 63.33 94.72 23
Prizes pc (EURs) 760.41 1117.30 143.97 354.40 655.06 23
Number winning tickets 1531.74 843.33 1170.00 1457.00 1841.00 23
Expenditure per GDP (%) 0.33 0.16 0.22 0.31 0.40 23
Prizes per GDP (%) 5.65 8.04 1.11 2.05 5.90 23
Panel C: Macroeconomic Variables
Inflation Rate (%) 2.44 1.62 1.64 2.82 3.56 1150
Unemployment Rate (%) 16.63 8.05 10.19 15.53 21.78 1150
Population (000s) 870.98 1060.95 348.27 578.14 983.13 1150
GDP pc (EUR 000s) 20.04 4.83 16.54 19.17 23.38 1150
Housing Price (EUR/m2) 1249.59 579.58 794.24 1181.58 1551.12 1150
Bank Loans pc (EUR 000s) 19.80 10.57 11.59 18.09 25.83 1150
Disposable Income pc (EUR 000s) 13.46 2.68 11.55 12.98 15.31 850
Total Firms 24647.09 41301.71 7068.00 13306.50 24771.00 1150
Firms Created 2136.66 3691.64 505.00 1054.00 2018.00 1150
26You can also read