INDIVIDUAL EQUITY AND SOCIAL ADEQUACY IN THE U.S. SOCIAL SECURITY SYSTEM - ACTUARY.ORG
←
→
Page content transcription
If your browser does not render page correctly, please read the page content below
MARCH 2021

             INDIVIDUAL EQUITY AND SOCIAL ADEQUACY IN
             THE U.S. SOCIAL SECURITY SYSTEM
             American Academy of Actuaries

                                             ACTUARY.ORG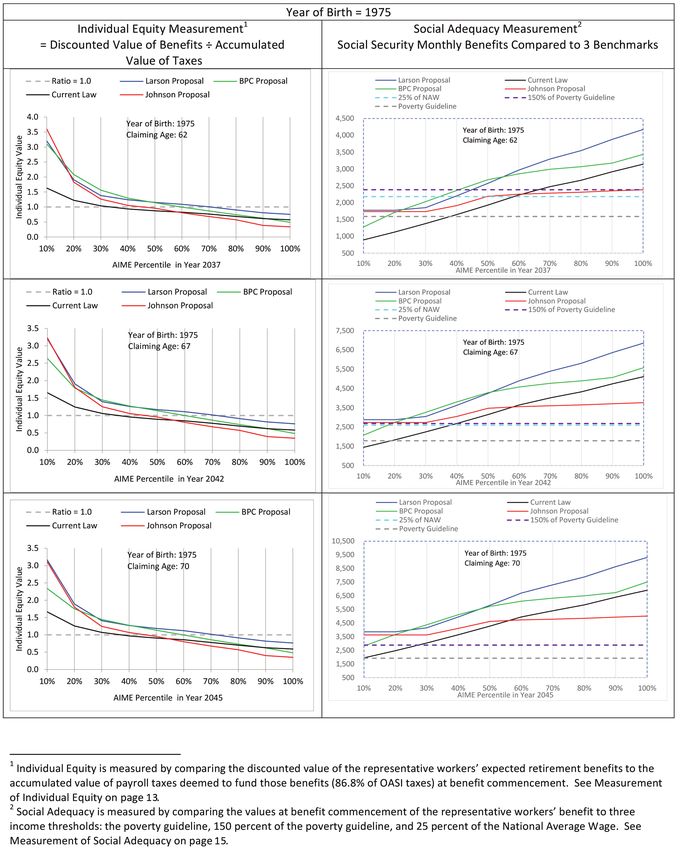
Contents
Introduction and Purpose of this Project                                            1
The Principles of Individual Equity and Social Adequacy                             3
Criteria for Selecting Proposals                                                    4
Methodology and Assumptions                                                         5
Measurement of Individual Equity and Social Adequacy                              12
The Proposals                                                                     17
Description of the Graphs                                                         24
Results Illustrated in the Graphs                                                 25
Conclusion                                                                        30
Appendix 1                                                                         31
Appendix 2                                                                        32
Graphs                                                                            33

Members of the Social Security Committee, which drafted this monograph, include Amy Kemp, MAAA, ASA, EA—Chairperson; Janet Barr, MAAA, ASA;
Katie Brown, MAAA, FCA, EA; Gordon Enderle, MAAA, FSA; Margot Kaplan, MAAA, ASA, FCA; Eric Klieber, MAAA, FSA; Alexander Landsman, MAAA, FSA, EA;
Leslie Lohmann, MAAA, FSA, FCA, FCIA, EA; Gerard Mingione, MAAA, FSA, EA; and Brian Murphy, MAAA, FSA, FCA, EA.

The committee extends special thanks to former committee members John Nylander, MAAA, FSA and Jeffery Rykhus, MAAA, FSA.

The American Academy of Actuaries is a 19,500-member professional
association whose mission is to serve the public and the U.S. actuarial
profession. For more than 50 years, the Academy has assisted public
policy makers on all levels by providing leadership, objective expertise,
and actuarial advice on risk and financial security issues. The Academy
also sets qualification, practice, and professionalism standards for                         AMERICAN ACADEMY OF ACTUARIES
actuaries in the United States.                                                     1850 M STREET NW, SUITE 300, WASHINGTON, D.C. 20036
                                                                                             202-223-8196 | WWW.ACTUARY.ORG

                                                                                        © 2021 American Academy of Actuaries. All rights reserved.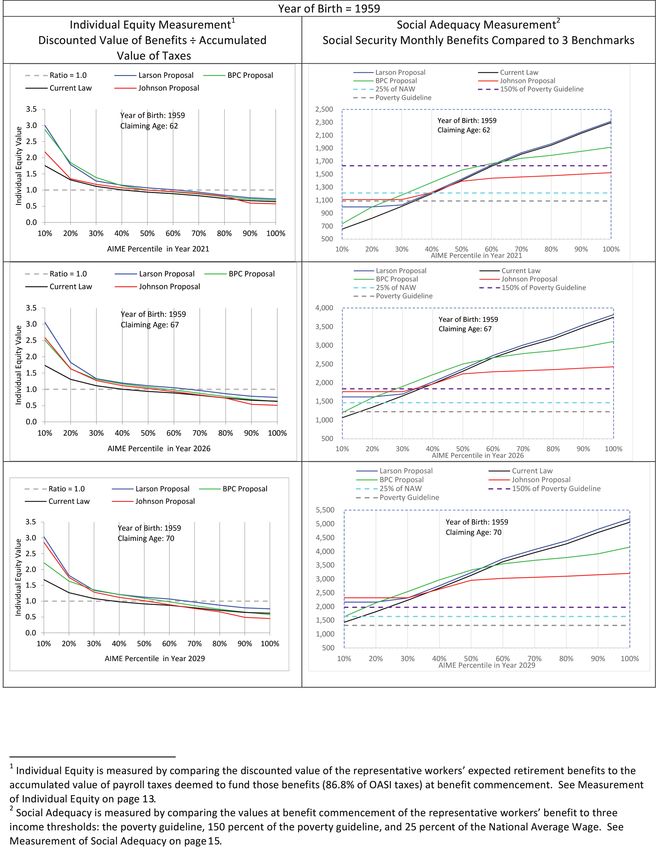
Introduction and Purpose of this Project
The Old-Age, Survivors and Disability Insurance (OASDI) system, commonly known as Social Security,
is a social insurance program funded by a tax on the earnings of covered workers split equally
between employers and employees (with the self-employed paying both the employer and employee
portions). Social Security provides monthly income to retired and disabled workers and eligible
family members and survivors. Social Security taxes and benefits are described below in detail.

                     From its inception, Social Security has included elements of individual equity and social
                     adequacy. In this context, individual equity refers to the degree to which covered workers’
                     benefits vary in proportion to differences in workers’ contributions, which are in turn
                     based on workers’ earnings histories. Social adequacy refers to the degree to which benefits
                     of covered workers and eligible family members meet their deemed financial needs—
                     beneficiaries defined in the law do not need to demonstrate financial need to receive their
                     full scheduled benefits. These dual principles provide the foundation on which the program
                     has been built. The basis upon which these principles are established is explored in greater
                     depth below.

Overview of Social Security’s Financial Status
                     Each year, the Social Security trustees publish a report showing the estimated financial
                     status of the system over the next 75 years. The Social Security system comprises separate
                     programs for Old-Age and Survivors Insurance (OASI) benefits and for Disability Insurance
                     (DI) benefits, and the trustees’ annual report includes results for each separately and for
                     both combined. According to the 2020 Trustees Report, current trust fund balances plus
                     projected income for both the OASI and DI programs individually and, hence, for the
                     combined program, will fall short of projected expenses over the 75-year valuation
                     period, using the trustees’ intermediate assumptions. (See the Academy’s issue brief
                     An Actuarial Perspective on the 2020 Social Security Trustees Report, May 2020.) The OASI
                     Trust Fund accounts for more than 97% of this long-term deficit. This monograph focuses
                     on the benefits paid from the OASI Trust Fund, which includes all benefits except those
                     paid to disabled workers and their dependents. The OASI Trust Fund reserves are currently
                     projected to be drawn down to zero in 2034; from that point, income from the OASI portion
                     of the Social Security payroll tax and other sources will be sufficient to pay 76% of scheduled
                     OASI benefits, declining to 71% by 2094, the last year of the valuation period. Remedying
                     this actuarial imbalance will require increasing the combined employer and employee OASI
                     payroll tax, reducing promised benefits, or some combination of tax increases and benefit
                     reductions.

INDIVIDUAL EQUITY AND SOCIAL ADEQUACY IN THE U.S. SOCIAL SECURITY SYSTEM                                            1
Office of the Chief Actuary Analysis of Reform Proposals
Some members of Congress, government commissions, and public policy think tanks have
put forward a wide variety of proposals to bring the system back into actuarial balance. The
Office of the Chief Actuary of the Social Security Administration (OCACT) has provided
actuarial analyses of many of these proposals showing the estimated effect on the financial
status of the program, levels of future benefits and taxes, and implications for the federal
budget. These analyses are provided in letters to the originators of the proposals, which
can be found on the OCACT website. Each letter includes a summary of the provisions
included in the proposal; a detailed explanation of how the provisions were interpreted for
purposes of the analysis; graphs showing the long-range financial effects of the proposal;
tables showing these financial effects in greater detail, including a breakdown of the effects
of the individual provisions; and tables showing the effect of the proposal on the benefits
of hypothetical workers at different current ages and with different earnings patterns at
retirement at age 65 and at 10-year age intervals thereafter. The OCACT letters provide
objective and comprehensive analyses of major Social Security reform proposals. Members
of Congress and their staffs use these studies to develop formal legislative proposals or
further develop proposals based on prior legislation.
Purpose of this Project
Given the complexity of the Social Security program and the technical nature of the OCACT
analyses under which members of Congress formulate legislation, it can be difficult for the
public to make informed judgments on these proposals. The Social Security Committee of
the American Academy of Actuaries (the Committee) has written this monograph in an
effort to provide the public and public policymakers with an analysis in graphical form of a
sample of proposals incorporating commonly discussed reform provisions, with particular
emphasis on how each proposal would affect the balance between individual equity and
social adequacy compared to the current benefit and tax schedule. The Committee hopes
that this analysis will provide useful information on the merits of the proposals.
2 INDIVIDUAL EQUITY AND SOCIAL ADEQUACY IN THE U.S. SOCIAL SECURITY SYSTEMThe Principles of Individual Equity and Social Adequacy
Individual Equity
Three features of Social Security incorporate the principle of individual equity:
• Benefits are paid regardless of need.
• Payroll tax rates are a flat percentage of income up to a maximum annual amount
($137,700 for 2020), so that workers of all income levels pay the same rate.
• Benefits are determined by a formula that provides higher amounts for workers who
have contributed more to the system.
These three features are sometimes characterized by the terms “universality” and “earned
right.” Universality means that the system covers nearly all workers, across the entire
earnings spectrum and everyone contributes toward those benefits at the same rate. The fact
that even the very wealthy receive Social Security helps prevent benefits to the less well off
from being stigmatized as welfare payments. Earned right means that a worker’s entitlement
to a Social Security benefit derives from the worker’s employment and from the payroll taxes
paid on earnings rather than from financial need. Together, the concepts of universality and
an earned right to a benefit distinguish the program from needs-based programs such as
Medicaid and SNAP (Supplemental Nutrition Assistance Program, formerly known as Food
Stamps), thereby contributing to more widespread and enduring public support for Social
Security.
Social Adequacy
Social Security adheres to the principle of social adequacy in the following ways:
• The program replaces a portion of a worker’s income from employment when the
worker either retires due to age or is deemed unable to work due to a qualified disability.
• The program pays benefits to others previously dependent on the worker’s employment
income, such as the worker’s spouse and, in some circumstances, children and parents,
both while the worker is still living and after the worker has died, provided the
beneficiary is not eligible for higher benefits based on his or her own earnings histories.
• The program replaces a higher portion of pre-retirement income for lower-income
workers and their dependents than for higher-income workers and their dependents.
• The program provides a minimum benefit for certain workers whose benefits under the
regular formula are deemed inadequate; although the minimum seldom applies.
These social adequacy features further the essential goal of providing a floor of protection for
covered workers and their eligible family members against the contingencies of old age and
premature death and disability.
INDIVIDUAL EQUITY AND SOCIAL ADEQUACY IN THE U.S. SOCIAL SECURITY SYSTEM 3The Trade-off between Individual Equity and Social Adequacy
Individual equity and social adequacy are both essential to the success of Social Security,
by sustaining public support for the system, and by ensuring that the system achieves
its purpose of providing a floor level of income for covered workers and eligible family
members. All the features of the system, including those described above and others less
important, factor into a trade-off between the principles of individual equity and social
adequacy. That balance has changed as the system has evolved. For example, spouse,
survivor, and disability benefits, as well as benefits for non-spouse family members, were
added and expanded at various times over Social Security’s history. The last amendment to
the Social Security Act that resulted in a material benefit change was adopted in 1983. There
are no theoretically correct levels of individual equity and social adequacy in the U.S. Social
Security system. The current mix is the product of many legislative compromises, which are
incorporated into the current version of the Social Security Act.
Criteria for Selecting Proposals
The Committee applied three criteria when choosing which proposals to include in the
project:
• The Committee chose only proposals under which program income is projected
to be sufficient to cover expenses during the 75-year valuation period and beyond.
Some proposals include changes that only extend the projected trust fund depletion
date without removing the entire long-term deficit, with the expectation that further
changes will be adopted well before the new depletion date. When the program has a
long-term deficit, benefits in excess of the level supportable by projected income must
be funded by some combination of larger tax increases or greater benefit cuts in the
future. Put another way, maintaining a long-term deficit acts as a subsidy that allows
for higher current benefit payments, making a proposal look more favorable than it
actually is. Variations in the degree of subsidy from one proposal to the next would
make the proposals difficult to compare, hindering the Committee’s ability to provide a
meaningful analysis.
4 INDIVIDUAL EQUITY AND SOCIAL ADEQUACY IN THE U.S. SOCIAL SECURITY SYSTEM• The Committee chose only proposals that preserve the current defined benefit structure
of the program. This criterion removed from consideration proposals that divert
a portion of payroll tax revenue to individual accounts, and proposals that fund a
portion of the program by taxing non-wage income or drawing on general revenue.
The former would tip a balance toward individual equity, because individual accounts
represent individual equity in its purist form; while the latter would tip a balance away
from individual equity, by weakening the perception of benefits as an earned right and
strengthening the perception of benefits as a transfer of wealth from high- to low-
income workers.
• The Committee chose three ideologically distinct proposals:
∙ Bipartisan Policy Center Commission on Retirement Security and Personal
Savings, October 2016.
∙ Former U.S. Rep. Sam Johnson (then-chair of the House Social Security
Subcommittee), H. R. 6489, December 2016.
∙ U.S. Rep. John Larson (current chair of House Social Security Subcommittee), and
U.S. Sens. Richard Blumenthal and Chris Van Hollen, January 2019.
Methodology and Assumptions
The Model
This analysis uses a simplified model for calculating Social Security benefits and
contributions for a sample of workers in various age and earnings history groups developed
by the Committee. Much of what follows describes how the model simplifies, and in some
cases ignores, certain features of the program. Nevertheless, the Committee has checked
its results against output from the far more sophisticated model developed and used by
OCACT and found close agreement with comparable results.
INDIVIDUAL EQUITY AND SOCIAL ADEQUACY IN THE U.S. SOCIAL SECURITY SYSTEM 5Selection of Representative Workers
The workers covered by Social Security belong to families that vary in size and in the
number of family members in the labor force. Workers have a wide range of earnings
histories. They have different current ages, they retire at different ages, and they receive
benefits after retirement for different lengths of time. Some die or become disabled before
retirement. There is no typical worker, and no small sample of representative workers can
encompass all possible circumstances. Nevertheless, changes to Social Security usually affect
broad categories of workers similarly. Thus, it is possible to illustrate the effects of changes
to the system with a manageable sample of representative workers. The sample we selected
for modeling includes workers born in 1959, 1975, and 1995 with benefit commencement
at ages 62, 67, and 70. Their ages in 2020 are 61, 45, and 25, thus showing the impact of the
various proposals on three generations of workers. We intentionally avoided using year of
birth 1960 due to an anomaly arising from the COVID-19 pandemic, which is expected
to cause the national average wage to decrease in 2020, the base year for wage indexing for
those born in 1960. (Wage indexing is described below in the section describing the average
indexed monthly earnings [AIME].)
A worker’s current age and retirement age are both important factors in determining the
worker’s benefit amount for the following reasons:
• Non-disabled workers may begin receiving benefits as early as age 62. The full formula
benefit is paid to workers who begin receiving benefits at the normal retirement age
(NRA), which is scheduled to increase to age 67 for workers born in 1960 or later.
Benefits are reduced by 5/9 percent per month for the first 36 months and 5/12 percent
per month for each additional month (up to 24) that the benefit commencement age
precedes the NRA. Benefits are increased by 2/3 percent per month up to age 70 for
each month the benefit commencement age is delayed beyond the NRA (maximum 36
months). Therefore, benefits commencing at age 62 would be reduced 30 percent, and
benefits commencing at age 70 would be increased 24 percent, compared to the benefit
amount commencing at age 67, the NRA.
• Many proposals would phase in changes over time, so that the changes would have a
lesser effect on older workers who will retire in the near future than on younger workers
who will not retire until the changes are fully phased in.
• Under the current program with no changes, OCACT projects (under the intermediate
assumptions) that OASI Trust Fund reserves will be depleted in 2034, at which time
benefits would have to be reduced by 24 percent to bring Trust Fund expenses into line
with income. This benefit reduction would also have a greater effect on younger workers.
6 INDIVIDUAL EQUITY AND SOCIAL ADEQUACY IN THE U.S. SOCIAL SECURITY SYSTEM• Most parameters for calculating initial benefits at retirement are adjusted over time by
changes in the national average wage, which reflects both increases in the cost of living,
as measured by the Consumer Price Index (CPI), and increases in real wages over and
above increases in the CPI during a worker’s career. After commencement, benefits
are adjusted to reflect only increases in the cost of living, and do not reflect any further
increases in real wages. Increases in the national average wage historically have exceeded
increases in the cost of living and are projected to continue doing so in the future (after
the effects on wages of the COVID-19 pandemic have worn off).
Transition from Current Law to Proposals
The impact of proposed program changes can be illustrated either by using the actual
history of the OASI tax and benefit structure and the transition provisions specified in
each proposal or by assuming the current OASI tax and benefit structure and the ultimate
provisions in each proposal have always been in effect. The latter course simplifies the
analysis because it eliminates a worker’s current age as a factor. However, the following
considerations argue against this approach. Current program income does not cover
expenses, and the program is projected to pay full benefits until 2034 only because
significant trust fund reserves were accumulated during the period from 1983 through
2008 when income exceeded expenses. If the current tax and benefit structure had always
been in effect, the system would already be unable to pay all the scheduled benefits. Even
proposals that eliminate the long-term deficit rely on the trust fund accumulation to pay
a portion of future benefits and would be otherwise non-viable. Further, illustrating the
effects of changes on workers in the real world rather than in a hypothetical world that
may never actually come to pass is of more utility for the reader. For this reason, the model
incorporates actual program history and each proposal’s transition provisions.
Using this historical approach, a problem arises because the proposals were made at different
times in the past. Had the proposals been adopted when made, some provisions would
have already become effective. Simply delaying these changes to the present would reduce
their effect, so that a proposal that provided long-term solvency when first proposed may
no longer achieve this goal. To solve this problem, for each proposal, benefits and revenues
from the year the proposal was made to the present are modified to take into account any
changes that would have occurred had the proposal been adopted in the year it was first
proposed. Appendix 1 includes an example that illustrates the transition method.
INDIVIDUAL EQUITY AND SOCIAL ADEQUACY IN THE U.S. SOCIAL SECURITY SYSTEM 7Components of the Benefit Formula: AIME and Primary Insurance Amount (PIA)
The most important determinant of a worker’s benefit is the worker’s Average Indexed
Monthly Earnings, or AIME. The AIME is based on the average of the worker’s indexed
annual earnings for the 35 highest indexed earning years. Earnings in years before age 60
are indexed to age 60 by multiplying by the ratio of the national average wage in the year the
worker attains age 60 over the average national wage in the year earned. There is no indexing
after age 60. This average using annual earnings is converted to a monthly amount by
dividing by 12. The AIME is then input into the formula that determines a worker’s Primary
Insurance Amount, or PIA, the monthly amount paid to the worker, excluding dependents,
if the worker retires at the NRA, with no adjustment for early or late retirement.
Because the PIA formula is skewed to provide higher benefits relative to the AIME for
lower-paid workers than for higher-paid workers, the illustrations show benefits for workers
across the entire spectrum of possible AIMEs. As described in more detail below, the model
calculates benefits using 10 representative AIMEs, one for each of the 10 deciles of workers
grouped by AIME. OCACT provided the 10 AIMEs based on all workers retiring in 2014.
The model recalculates these 10 AIMEs for each calendar year after 2014 based on the
assumption that they increase from year to year at the same rate as the maximum AIME—
that is, they remain a constant percentage of the maximum AIME.
Earnings History Assumption
Many different earnings histories can produce the same AIME, because AIME is an
average. The model assumes that workers’ earnings increase year by year at the same rate
as the national average wage, the index used to adjust earnings for calculating the AIME.
Under this assumption, the adjusted monthly earnings are constant up to age 60, because
the adjustment exactly offsets decreases in unadjusted earnings going back in time from
age 60. However, the taxes paid on the worker’s earnings are based on unadjusted earnings
and, therefore, decrease going back in time. If a worker’s earnings, and hence taxes, are
more concentrated earlier in the worker’s career than under the assumption, the actual
accumulated value of the taxes will be higher than under the assumption, because interest
on the higher earlier taxes will accumulate over a longer period than interest on the later
lower taxes. Conversely, if a worker’s earnings are more concentrated later in the worker’s
career, the actual accumulated value of the taxes will be lower than under the assumption.
Given the impossibility of illustrating the broad range of possible earnings histories, this
assumption was chosen as closely representing the highest proportion of workers.
8 INDIVIDUAL EQUITY AND SOCIAL ADEQUACY IN THE U.S. SOCIAL SECURITY SYSTEMOnly Old Age Worker Benefits Included
As previously noted, the Social Security program covers several categories of beneficiaries:
workers retired due to age (including disabled workers who have reached the NRA),
disabled workers under the NRA, spouses and other eligible dependents of living workers
receiving benefits, and spouses and other eligible dependents of deceased workers. To
simplify the illustrations, the model only includes benefits paid to workers retired due to age.
Because all benefits are calculated using the same formula, the results would be similar for
the other beneficiary categories.
No tax or other income to the OASI Trust Fund is explicitly allocated to fund retired worker
benefits separate from spouse and survivor benefits. According to OCACT data, retired
worker benefits comprise about 82% of the benefits paid from the OASI Trust Fund in
2020 with the remaining benefits paid to spouses, children and survivors.1 This percentage
has been increasing in recent years as more married couples receive two retired worker
benefits based on each spouse’s own work history, and fewer receive retired worker and
spouse benefits based on just one spouse’s work history. This trend is expected to continue.
Over the 75-year valuation period, retired worker benefits are expected to approach 90%
of all OASI benefits on a present value basis. No one percentage can apply to all possible
retirement years. In our illustrations, measurements of individual equity assume 86.8% of
the OASI taxes paid by and on behalf of the workers fund retired worker benefits. This figure
represents the average over the 75-year valuation period in the 2019 Trustees Report.
These illustrations assume full-career workers who survive to retirement age. In particular,
workers who die prior to retirement age and disabled workers who transition to old-age
benefits are excluded from the model.
Exclusion of Supplemental Security Income
The Supplemental Security Income (SSI) program, which is funded by general revenues
rather than the dedicated payroll taxes, provides additional income for persons who are
age 65 or over, disabled or blind and who meet eligibility requirements based on income
and resources. The maximum resources allowed to qualify for an SSI benefit have not been
updated since 1989: $2,000 for a single person or $3,000 for a couple, excluding a primary
residence, an automobile valued up to $4,500, household goods valued up to $2,000 and a
life insurance policy with a face value not exceeding $1,500. As a result of these limits on
resources and limits on income that vary by state, only about 2% of recent non-disabled
retired workers and their dependents qualify for SSI benefits. (The percentage is much
higher for those disabled or blind.) The model does not include SSI benefits.
1 See here.
INDIVIDUAL EQUITY AND SOCIAL ADEQUACY IN THE U.S. SOCIAL SECURITY SYSTEM 9Exclusion of Income Tax on Social Security Benefits
In addition to the payroll tax, Social Security receives income from regular income taxes
paid by beneficiaries attributable to their Social Security benefits. Currently, single taxpayers
with incomes up to $25,000 and married taxpayers with incomes up to $32,000 pay no
income tax on Social Security benefits. Higher-income taxpayers pay taxes on a portion
of their Social Security benefits that increases with income, up to a maximum portion of
85%. The Social Security trust funds receive income tax revenue on the first 50% of Social
Security benefits, and Medicare’s Hospital Insurance Trust Fund receives the remainder.
The thresholds are not indexed for inflation, so that the portion of Social Security benefits
subject to income taxation increases over time. This tax on Social Security benefits
comprised less than 4% of OASI income in 2019 and, although this percentage is expected
to increase somewhat as the portion of earnings in excess of the income thresholds increases,
the tax on benefits will remain a small part of system income. All three of the proposals
illustrated make changes to these income tax provisions. However, given the complexities
in modeling this tax and its small impact on program finances, the Committee elected not
to include revenue from taxation of Social Security benefits in the model. OCACT’s more
comprehensive analysis referred to below also excludes this feature for similar reasons.
Allocation of Proposed Payroll Tax Increases
Two of the proposals in this study include an increase in the combined OASI and DI payroll
tax rate, but do not state how the increase is allocated between the OASI and DI trust funds.
Due to a change in the assumed disability incidence rates in the 2019 and 2020 reports, the
tax rate increase as a percent of covered earnings necessary to bring the DI program into
actuarial balance decreased from 0.12% in 2019 to 0.07% in 2020. The tax rate increase
necessary to bring the OASI program into actuarial balance increased from 2.67% in 2019
to 3.14% in 2020. The OASI program now accounts for more than 97% of the combined
program’s long-term deficit. On this basis, for the purpose of these illustrations the model
assumes Congress would allocate any increase in the tax rate entirely to the OASI program.
10 INDIVIDUAL EQUITY AND SOCIAL ADEQUACY IN THE U.S. SOCIAL SECURITY SYSTEMAssumptions Used in the Model
The model must to some extent depend on assumptions about future economic and
demographic trends, because the future cannot be known with any certainty. (See the
Academy’s issue brief Assumptions Used to Evaluate Social Security’s Financial Condition.)
The Committee has chosen to use the intermediate assumptions from the most recently
available Social Security Trustees Report. The Committee will update the model annually to
reflect the most recent Trustees Report available. Because assumptions in the 2020 Trustees
Report do not take into account any possible effects of the COVID-19 pandemic, neither
does our model at this time.
The trustees report includes projections using the intermediate assumptions as well as
separate sets of high-cost and low-cost assumptions. The Congressional Budget Office
(CBO) publishes its own Social Security projections using a different set of assumptions.
Although the Committee has selected the trustees’ intermediate assumptions as the basis for
this model, sensitivity testing has shown that using other assumptions within the reasonable
range does not significantly change the results of the illustrations. The principal assumptions
used for these illustrations include:
• The annual rate of increase in the national average wage, used to project workers’ future
earnings and benefit formula parameters;
• The annual rate of increase in the cost of living, used to project post-retirement benefit
increases;
• The rate of return on trust fund assets, used to accumulate payroll taxes before
retirement and to discount benefit payments after retirement; and
• Worker mortality, used to discount future benefit payments after retirement. Our
illustrations use male mortality; however, we also performed our analysis using female
mortality to ensure there is no material difference.
Appendix 2 provides additional details about these assumptions. Some provisions included
in the proposals require additional assumptions. Where this is the case, these additional
assumptions are included in the descriptions of the proposals.
INDIVIDUAL EQUITY AND SOCIAL ADEQUACY IN THE U.S. SOCIAL SECURITY SYSTEM 11Measurement of Individual Equity and Social Adequacy
As described above, Social Security taxes and benefits are features of the program that
strike a certain balance between the principles of individual equity and social adequacy.
The Committee’s analysis measures how each of the proposed system changes would affect
individual equity and social adequacy.
Background on Measurement of Individual Equity
As described above, individual equity in the context of Social Security refers to the
relationship between a worker’s benefit and the contributions made into the system on the
worker’s behalf. Thus, measuring individual equity involves assessing the degree to which
the benefits of a representative worker are based on his or her contributions. To better
understand this concept, it is helpful to examine individual equity in the context of other
common financial arrangements.
When an individual investor opens an account at a financial institution, whether specifically
to save for retirement or for some other purpose, deposits to the account plus investment
returns, positive or negative, less expenses belong exclusively to the investor. This is an
example of perfect equity, because the benefits paid stem directly from the contributions. At
the other end of the spectrum, in a needs-based public safety-net program such as Medicaid
or SNAP, the taxpayers funding the program may receive no direct benefits, and the benefit
recipients may pay no taxes which support the programs; the program’s funding and benefit
payments are entirely independent of each other. Thus, there is no equity.
Insurance arrangements fall between these two extremes. While such arrangements may
include an investment element, their primary purpose is to mitigate financial risk. There
are two types of insurance arrangement, private market insurance and social insurance.
Absent regulatory prescription or prohibitions, private market insurance policies generally
are structured so that policy holders assumed to have a similar level of risk pay similar
premiums. For instance, older people generally pay more for the same amount of life
insurance because they are at greater risk of dying, and people living in areas prone to
flood or wildfire generally pay more for homeowners insurance. In these cases, there is
equity within classes of policy holders with similar levels of risk, but not at the level of
the individual policyholder. The degree of individual equity is less than for an investment
account, but still sufficient that people are willing to purchase insurance in an open market.
12 INDIVIDUAL EQUITY AND SOCIAL ADEQUACY IN THE U.S. SOCIAL SECURITY SYSTEMSocial insurance programs such as Social Security do not have separate classes of
participants, and in this respect provide a lesser degree of individual equity than private
insurance. For this reason, participation in such programs must be mandatory for those
eligible. Two key features of Social Security affect the degree of individual equity compared
with typical private market insurance policies:
• The premium—that is, the tax rate—is the same for all workers and is not adjusted for
an assumed level of risk.
• Benefits, while payable to all participants, are based in part on need and are therefore
not directly proportional to funding on an individual basis, although the dollar amount
of benefits does reflect to an extent the dollar amount of taxes paid—more taxes paid
generally results in greater benefits at retirement.
The model does not measure the equity effects of the first difference, although it is well
known that characteristics such as sex, marital status, race, educational attainment, and
income level contribute to an individual’s level of risk. The model focuses instead on the
effect on individual equity due to the graduated benefit formula, under which lower-wage
workers receive proportionately higher benefits relative to the taxes paid on their behalf than
higher-wage workers.
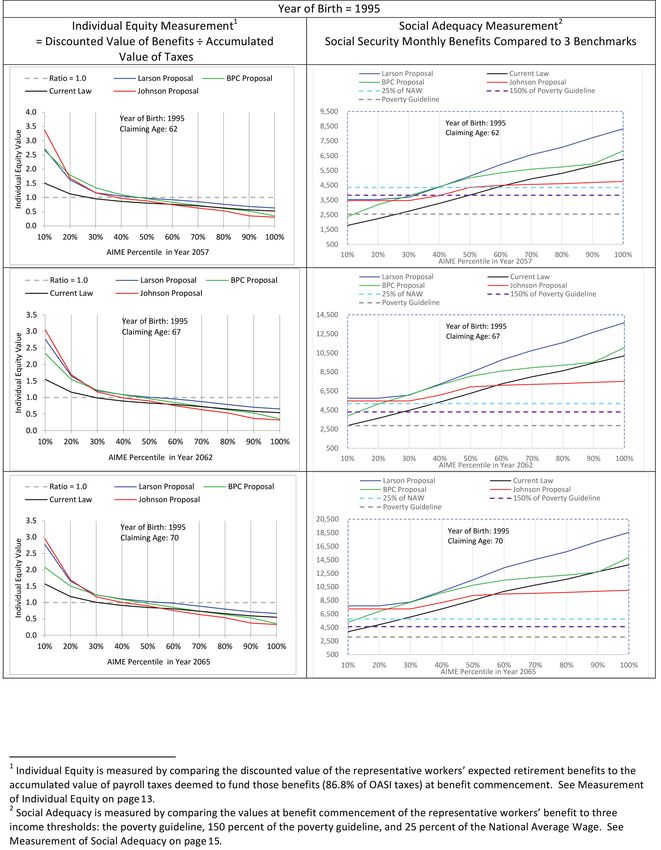
Measurement of Individual Equity
For this purpose, the effect on individual equity is measured by comparing the discounted
value of representative workers’ expected retirement benefit payments to the accumulated
value of payroll taxes at benefit commencement (including payroll taxes paid by both
employers and workers, but only the portion assumed to provide for retirement benefits),
in both cases using the assumed interest rate. The ratios thus calculated provide a common
scale for making relative comparisons among representative workers and various system
designs. A ratio of one does not necessarily mean “perfect equity.” This is because, in
addition to its savings element, Social Security includes an insurance element whose value
is difficult to measure and differs for workers in different circumstances. Since the payroll
tax rate is uniform across the earnings spectrum but benefits are higher relative to earnings
for lower paid workers than for higher paid workers, the ratios for lower-income AIMEs are
greater than those for higher income AIMEs.
INDIVIDUAL EQUITY AND SOCIAL ADEQUACY IN THE U.S. SOCIAL SECURITY SYSTEM 13As noted above, this analysis includes only old age benefits paid to workers and excludes
spouse and survivor benefits. For consistency, the analysis includes 86.8% of the OASI
payroll tax, the projected average portion assumed to fund retired worker benefits. The
analysis takes the perspective of a worker at the time benefits commence, looking back at the
payroll taxes paid on the worker’s behalf and forward at the benefits expected to be received.
In reality, payroll taxes paid into the OASI Trust Fund are not allocated separately between
worker benefits and spouse and survivor benefits. Further, under the program’s modified
pay-as-you-go financing model, most payroll taxes paid on a worker’s behalf financed prior
years’ benefits for other retirees, and most Social Security benefits a retiree receives will
be financed by future years’ payroll taxes paid on behalf of other workers. Nevertheless,
the comparison of past payroll taxes paid on a worker’s behalf to expected future benefits
for the worker—across the income spectrum—provides a useful measure of the degree to
which Social Security incorporates the principle of individual equity. A similar analysis
applied to the other types of benefits under the program would yield similar results. A more
comprehensive analysis by the OCACT can be found here.
The graph for each proposal compares the ratio of the discounted value of expected
retirement benefit payments to the accumulated value of assumed retirement payroll taxes at
benefit commencement across the range of AIMEs under the current and proposed tax and
benefit schedules. The graphs illustrate how each proposal would affect individual equity
under the system. The model assumes uniform mortality across the earnings and benefit
spectrum. In reality, mortality rates are higher and life expectancy lower for retired low-
wage workers than for retired high-wage workers, as shown in analysis by OCACT. If this
effect were taken into account, the ratios would be lower than shown in the graphs at the low
end of the earnings scale and higher than shown in the graphs at the high end, but the effect
would be small.
Background on Measurement of Social Adequacy
The social adequacy of retirement income provided by Social Security can be measured in
two ways: by the comparing Social Security income to pre-retirement income (a relative
measure), or by comparing Social Security income to a fixed threshold (an absolute
measure).
14 INDIVIDUAL EQUITY AND SOCIAL ADEQUACY IN THE U.S. SOCIAL SECURITY SYSTEMReplacement ratio refers to a worker’s initial retirement benefit divided by some
measure of pre-retirement income. The denominator is usually total income in the
year immediately preceding retirement or an average over a small number of years
preceding retirement. In the case of Social Security, the AIME, a measure of income
over a worker’s entire career, is often used for the denominator. A replacement ratio
is a relative measure of income adequacy, in that the level of retirement income
deemed adequate depends on the level of pre-retirement income. However, the
essential goal of the Social Security system—providing a floor of protection for
covered workers and eligible family members—is independent of a worker’s pre-
retirement income. Although a worker may desire to maintain his or her pre-
retirement standard of living into retirement, this is beyond the essential goal of the
system.
In order for a replacement ratio to be meaningful, it must include all sources of
both pre-retirement and post-retirement income. Lower-income workers receive
a higher proportion of their pre-retirement income from covered earnings and a
higher proportion of their post-retirement income from Social Security compared
to higher-income workers. Thus, using the AIME in the denominator and the
Social Security benefit in the numerator of a replacement ratio calculation provides
a more useful measure of income adequacy for lower-income workers than for
higher-income workers, who usually have additional sources of both pre- and
post-retirement income. For these reasons, the Committee has determined that
comparing benefits to fixed-dollar thresholds provides a better measure of income
adequacy than the replacement ratio.
Measurement of Social Adequacy
The graphs compare benefits to three commonly used thresholds: the poverty
guidelines for a one-person household for the 48 contiguous states and the
District of Columbia published by the U.S. Department of Health and Human
Services (HHS); 150% of this threshold; and 25% of the national average wage. The
poverty guidelines, though widely publicized and used for determining eligibility
requirements for some need-based benefit programs, have many deficiencies that
are widely recognized. The guidelines were originally defined in 1963 as three times
the cost of a minimum food diet in that year, on the assumption that food represents
a third of the cost of a minimum standard of living. Since 1963, the guidelines have
been updated only by applying annual increases in the Consumer Price Index (CPI).
Thus, the guidelines do not take into account changes since 1963 in the relative
INDIVIDUAL EQUITY AND SOCIAL ADEQUACY IN THE U.S. SOCIAL SECURITY SYSTEM 15contributions of the various categories of goods and services to a minimum standard of
living or in their relative costs. Also, the guidelines do not take into account geographical
variations in the cost of living. In 2020, the annual poverty guideline for single persons was
$12,760.2
Despite the known deficiencies in the poverty guidelines as a measure of income adequacy,
there is no generally recognized alternate measure that can apply across the wide variety of
individual circumstances of retired workers. The 150% threshold, $19,140 in 2020, provides
a more conservative comparison and might be relevant to a broader range of individual
circumstances of retired workers.
The national average wage for 2020 used in the illustrations in this monograph is $55,642,
and 25% of this amount is $13,910, about 9% above the poverty guideline for single
persons. As noted above, wages are projected to grow more rapidly than the cost of living;
this means the national average wage increases over time relative to the poverty guidelines,
which are adjusted by the CPI. The excess of wage growth over the CPI provides a gradual
improvement in the standard of living for workers, but this improvement is not reflected in
the poverty guidelines. The 25% of national average wage threshold gives a rough indication
of how the poverty guidelines would need to change to incorporate improvements in
workers’ living standards.
No single number can define social adequacy for Social Security beneficiaries in all possible
circumstances. Therefore, receiving a Social Security benefit greater than one of the three
poverty thresholds used in the graphs is not a guarantee a beneficiary does not experience
poverty. The three thresholds, while based on widely used measures of poverty, should be
viewed as providing points of comparison only.
2 See "HHS Poverty Guidelines for 2021."
16 INDIVIDUAL EQUITY AND SOCIAL ADEQUACY IN THE U.S. SOCIAL SECURITY SYSTEMThe Proposals
As noted, the Committee chose three proposals representative of the spectrum of political
thought for this analysis, from the Bipartisan Policy Center, former Rep. Johnson, and
Rep. Larson. The following summarizes and explains the important points of these three
proposals:
Bipartisan Policy Center
The Bipartisan Policy Center (BPC) is a Washington think tank whose purpose is to develop
solutions to the problems facing the nation that combine ideas from both the major political
parties. The Center established a Commission on Retirement Security and Personal Savings
which, in June 2016, issued a report titled Securing Our Financial Future. The report makes
recommendations in six policy areas, including strengthening Social Security’s finances and
modernizing the program. Provisions specific to Social Security include:
1. Making the benefit formula more progressive. The monthly benefit formula for 2020
under current law is 90% of the AIME up to $960, 32% of the AIME from $960 to
$5,785, and 15% of the AIME in excess of $5,785. The dollar thresholds where the
formula percentages change, called bend points, increase each year according to the
national average wage index. The BPC proposal would raise the first bend point by
about 28% and create a new second bend point (with the current second bend point
becoming the third) at about 63% of the way from this new first bend point to the third.
The formula percentages would be 95% up to the first bend point, 32% from the first to
the second, 15% from the second to the third, and 5% above the third. Thus, if the BPC
proposal was adopted in 2017 the bend points for 2020 would be as follows: 95% of the
AIME up to $1,244; 32% of the AIME from $1,244 to $4,101; 15% of the AIME from
$4,101 to $5,583; and 5% of the AIME in excess of $5,785. This new formula would be
phased in over 10 years beginning for workers attaining age 62 in 2022.
2. Applying the benefit formula annually. The BPC proposal would eliminate the AIME
and, instead, apply the benefit formula separately to earnings in each year, adjusted
according to the national average wage index to age 60 as described above, and totaling
the amounts so calculated, thus eliminating the 35-year average.
INDIVIDUAL EQUITY AND SOCIAL ADEQUACY IN THE U.S. SOCIAL SECURITY SYSTEM 173. Providing a minimum benefit for workers earning low wages who have attained the NRA.
The minimum benefit is in the form of an addition to the formula benefit described
above. The additional benefit for 2020 used in our illustrations is equal to a base
amount, $726 (assuming an unmarried beneficiary), reduced by 70 cents for each dollar
of benefit derived from the formula described above. The minimum applies to the
benefit payable and is not reduced or increased for benefit commencement ages that
are different from the NRA. Workers with low Social Security benefits but significant
income from other sources would repay all or part of this additional benefit through the
income tax system.
4. Increasing the normal retirement age. The BPC proposal would increase the NRA by one
month every two years starting in 2022 until the NRA reaches 69 for those attaining
age 62 in 2070. This rate of increase approximates the expected rate of increase in life
expectancy for the covered population. The proposal would leave the early retirement
age unchanged.
5. Adopting the “chained CPI.” The benefit amounts of all beneficiaries and of workers
beginning at age 62 are adjusted annually according to the consumer price index (CPI)
calculated by the Bureau of Labor Statistics (BLS). Since August 2002, BLS has also
published a “chained CPI,” which is intended to better take into account consumers’
tendency to change their buying habits when the prices of some goods increase more
rapidly than others. Neither the current nor the chained CPI takes into account
the particular buying patterns of the elderly, who comprise most Social Security
beneficiaries. The BPC proposal changes the index for the annual benefit adjustment to
the chained CPI.
6. Limiting the spouse benefit. Currently, the spouse of a worker beneficiary can receive a
benefit based on one-half of the worker’s PIA if this is larger than the benefit based on
the spouse’s own work history. The BPC proposal would limit this benefit starting in
2022 to the amount based on one-half the PIA of a hypothetical worker whose career
earnings are at the 75th percentile of all workers in 2022. This amount would be indexed
thereafter to the CPI. The benefits of widows and widowers would not be affected.
7. Changing survivor benefits. Currently, a worker’s widow or widower can receive a benefit
based on the worker’s full PIA if this is larger than the benefit based on the spouse’s
own work history. The BPC proposal would reduce this to a benefit based on 75% of the
worker’s PIA but allow the spouse to receive the full benefit based on the spouse’s own
work history in addition.
18 INDIVIDUAL EQUITY AND SOCIAL ADEQUACY IN THE U.S. SOCIAL SECURITY SYSTEM8. Increasing the taxable wage base. The taxable wage base is the maximum amount of
earnings subject to the Social Security payroll tax and the maximum amount taken
into account in the benefit formula. The wage base was originally set so that covered
earnings represented 90 percent of all earnings. Over the years, increases in the disparity
of earnings have caused this percentage to slip, and on several occasions, most recently
in 1977, the wage base has been increased by legislation to restore the 90% coverage
ratio. The ratio has slipped to about 84% and is projected to fall further. The BPC
proposal includes a series of four specified increases in the taxable wage base which
would increase the amount from $127,200 in 2017, to $203,700 in 2021, followed
each year thereafter by increases according to the national average wage index plus 0.5
percentage points.
9. Increasing the payroll tax rate. Currently, employers and employees pay into the Social
Security trust funds a combined 12.4% of earnings up to the taxable wage base. The
BPC proposal would increase this percent by 0.1 percentage points each year from 2017
through 2026, until the rate reaches 13.4%, an 8% increase.
10. Increasing income taxes on benefits for high-income beneficiaries. The BPC proposal
would eliminate the 15% exclusion starting in 2022 for single taxpayers with incomes
over $250,000 and married taxpayers with incomes over $500,000. Both these
thresholds would increase according to the national average wage index. All of the
additional revenue would go toward funding Social Security.
Assumptions Specific to the BPC Proposal
• Because the illustrations assume workers’ wages will increase at the same rate as the
national average wage (NAW), applying the benefit formula annually does not change
the result, so the illustrations don’t show any impact from this provision.
• The model assumes that the chained CPI will be 0.3 percent less than the CPI
intermediate assumption, the same assumption used by OCACT for valuing this
provision change.
• The model assumes that the payroll tax increase is allocated entirely to the OASI Trust
Fund and is not split between the OASI and DI trust funds.
INDIVIDUAL EQUITY AND SOCIAL ADEQUACY IN THE U.S. SOCIAL SECURITY SYSTEM 19Former Representative Sam Johnson Proposal (114th Congress, H. R. 6489,
Social Security Reform Act of 2016)
Congressman Johnson’s December 8, 2016, proposal includes changes to the benefit formula,
cost of living adjustment, and NRA, which together provide net benefit increases to roughly
40% of workers at the low end of the income spectrum and net benefit decreases to roughly
50% of workers at the high end of the spectrum. The proposal would achieve long-term
solvency with no increase in revenue. Unless otherwise noted, the changes are phased in
10% per year from 2023 to 2032. Provisions include:
1. Making the benefit formula more progressive. The Johnson proposal defines three new
bend points that replace the current two, set at 25%, 100%, and 125% of the national
average wage two years before initial benefit eligibility. The formula percentages would
be 95% up to the first bend point, 27.5% from the first to the second, 5% from the
second to the third, and 2% above the third. This formula provides a significant benefit
increase for the lowest-paid workers, but a significant benefit reduction for those at the
high end of the earnings spectrum.
2. Applying the new benefit formula annually. This change is the same as that described
above in the BPC proposal.
3. Increasing the NRA. The Johnson proposal would increase the NRA by three months
every year beginning in 2023, until it reaches age 69 in 2030.
4. Eliminating the cost-of-living adjustment (COLA) for high-income beneficiaries and
adopting the chained CPI for other beneficiaries. The Johnson proposal would eliminate
the COLA beginning in 2018 for beneficiaries in pay status whose modified adjusted
gross income (MAGI) exceeds $85,000 if single and $170,000 if married, both
thresholds adjusted thereafter according to the national average wage index. COLAs
from age 62 to the start of benefit payments would not be affected. For all beneficiaries,
the COLA, when applicable, would be calculated using the chained CPI described above.
5. Limiting the spouse benefit. The Johnson proposal would limit this benefit to the amount
based on one-half the PIA of a hypothetical worker of the same age, but whose earnings
equaled the national average wage in all years. Unlike the similar provision in the
BPC proposal, the initial spouse benefit would continue to be adjusted by the national
average wage index. The benefits of widows and widowers would not be affected.
20 INDIVIDUAL EQUITY AND SOCIAL ADEQUACY IN THE U.S. SOCIAL SECURITY SYSTEM6. Providing a minimum benefit for low-wage workers. The minimum benefit would be a
percentage of the national average wage two years before initial benefit eligibility. The
percentage would be based on a worker’s years of work, defined as years the worker
earned an amount at least equal to $10,875 in 2017, adjusted thereafter according to the
national average wage index. The percentage would be 0% for 10 or fewer years of work,
increasing 3% per year to 15% for 15 years, then increasing 1% per year to 19% for 19
years, jumping to 25% for 20 years, and then increasing ⅔ percent per year to 35% for 35
or more years.
7. Eliminating the personal income tax on benefits. Beginning in 2045 until 2053, the
thresholds for taxation of benefits would be increased by $7,500 per year for single
beneficiaries and $15,000 per year for married beneficiaries, and then in 2054 the tax
would be eliminated altogether. This change would not affect taxes directed to the
Medicare Trust Fund.
8. Providing a benefit increase to beneficiaries 20 years after initial eligibility for low-income
workers. The increase is limited to workers whose modified adjusted gross income is
below $25,000 if single and $50,000 if married in 2023, adjusted thereafter according
to the chained CPI. The amount of the increase is a percentage of the PIA at initial
benefit eligibility of a hypothetical worker of the same age whose earnings equaled
the national average wage in all years. For this purpose, initial eligibility is age 62 for
non-disabled workers and the age at benefit commencement for disabled workers. The
percentage is 1% in the 20th year of eligibility, increasing 1% per year to 5% in the 24th
year and thereafter. For workers born before 1957, these percentages are multiplied by
the number of years the chained CPI has been applied to the worker’s benefit divided
by 24. For this purpose, the hypothetical worker’s PIA is adjusted by the same early or
late retirement factor applied to the worker’s PIA and by all COLAs since initial benefit
eligibility.
INDIVIDUAL EQUITY AND SOCIAL ADEQUACY IN THE U.S. SOCIAL SECURITY SYSTEM 21Assumptions Specific to the Johnson Proposal
• Because the illustrations assume workers’ wages will increase at the same rate as
the NAW, applying the benefit formula annually does not change the result, so the
illustrations don’t show any impact from this provision.
• The model assumes that the chained CPI will be 0.3 percent less than the CPI
intermediate assumption, the same assumption used by OCACT for valuing this
provision change.
• The model assumes that retirees whose AIMEs are at the 80th percentile or higher have
MAGIs which exceed the threshold for not receiving post-retirement COLAs.
• The model assumes that only retirees whose AIMEs are at the 10th percentile or lower
qualify as low-income beneficiaries for receiving the benefit increase after 20 years.
Representative John Larson, et al., (116th Congress, H.R. 860, Social Security 2100 Act)
Congressman Larson’s proposal contains no benefit reductions and includes four modest
benefit enhancements. Solvency is achieved entirely through revenue increases. Provisions
include:
1. Increasing the benefit. The Larson proposal includes an increase in the PIA formula
percentage applied to the portion of the AIME up to the first bend point from 90% to
93%. This benefit increase would become effective in 2020 and apply to both current
and future beneficiaries.
2. Adopting the CPI-E. The Consumer Price Index for the Elderly (CPI-E), also calculated
by the BLS, measures increases in prices weighted according to the buying patterns of
households in which either the head of household or that person’s spouse is age 62 or
over.
3. Providing a minimum benefit for low-wage workers. Effective in 2020, the minimum
monthly benefit for workers with at least 30 years (120 quarters) of covered employment
would be set at one-twelfth of 125% of the annual poverty guideline for single persons
in 2019, increasing each year thereafter according to the national average wage index.
The amount would be reduced proportionately for workers with at least 10 but fewer
than 30 years of covered employment. (Quarters of coverage are calculated by dividing
a worker’s annual wage by a dollar amount and rounding down to the next lower integer,
with a maximum of four quarters of coverage in any year. This dollar amount, the
amount of earnings needed to earn one quarter of coverage, is indexed to the national
average wage, and was $1,410 in 2020.)
22 INDIVIDUAL EQUITY AND SOCIAL ADEQUACY IN THE U.S. SOCIAL SECURITY SYSTEM4. Increasing the income thresholds for taxation of Social Security benefits. As noted above,
these thresholds are currently $25,000 for single taxpayers and $32,000 for married
taxpayers. The Larson proposal would raise these thresholds in 2020 to $50,000 and
$100,000, respectively, so that fewer beneficiaries would pay income tax on their Social
Security benefits. The new thresholds would not be indexed for inflation.
5. Introducing a new payroll tax for high-wage workers. The Larson proposal would apply
the payroll tax rate to earnings in excess of $400,000 beginning in 2020. The $400,000
threshold would not be adjusted for inflation, so that ultimately the current maximum
taxable wage base, adjusted for inflation, would exceed this threshold and all income
would be taxed equally. Earnings above the current wage base subject to taxation would
be used to calculate a second AIME, and a worker’s benefit would increase by 2% of this
second AIME. Because of this low percent, nearly all of the additional revenue from this
new payroll tax would go toward funding benefits under the current formula.
6. Increasing the payroll tax rate. The Larson proposal would increase the combined
employer/employee tax rate, currently 12.4%, by 0.1 percentage point each year (an
annual increase of 0.05 percentage point each for employer and employee) from 2020
through 2043, until the rate reaches 14.8%.
Assumptions Specific to the Larson Proposal
• The model assumes that CPI-E index will be 0.2% greater than the than the CPI
intermediate assumption, the same assumption used by OCACT for valuing this
provision change.
• For calculating the minimum benefit, the proposal uses the annual poverty guidelines
for 2019 for a one-person household published by the US Department of Health and
Human Services (HHS). The model assumes the level for the 48 contiguous states and
the District of Columbia, which was $12,490 in 2019.
INDIVIDUAL EQUITY AND SOCIAL ADEQUACY IN THE U.S. SOCIAL SECURITY SYSTEM 23You can also read