KBC Group Company presentation - 3Q 2018 - KBC Bank

Page created by Patrick Aguilar
 
CONTINUE READING
KBC Group Company presentation - 3Q 2018 - KBC Bank
KBC Group
 Company presentation
 3Q 2018

More information: www.kbc.com

KBC Group - Investor Relations Office – E-mail:   investor.relations@kbc.com

                                                                               1
KBC Group Company presentation - 3Q 2018 - KBC Bank
Important information for investors
▪ This presentation is provided for information purposes only. It does not constitute an offer to sell or the solicitation to buy any
  security issued by the KBC Group.

▪ KBC believes that this presentation is reliable, although some information is condensed and therefore incomplete. KBC cannot be
  held liable for any loss or damage resulting from the use of the information.
▪ This presentation contains non-IFRS information and forward-looking statements with respect to the strategy, earnings and capital
  trends of KBC, involving numerous assumptions and uncertainties. There is a risk that these statements may not be fulfilled and
  that future developments differ materially. Moreover, KBC does not undertake any obligation to update the presentation in line
  with new developments.

▪ By reading this presentation, each investor is deemed to represent that it possesses sufficient expertise to understand the risks
  involved.

                                                                2
KBC Group Company presentation - 3Q 2018 - KBC Bank
3Q 2018 key takeaways
               3Q18 financial performance
❖ Commercial bank-insurance franchises in core
  markets performed well
                                                                                                           9M18
❖ Customer loans and customer deposits                                         ➢    ROE 17%*
  increased in most of our core countries                                      ➢    Cost-income ratio 57% (excl. specfic items)
❖ Good net interest income and net interest                                    ➢    Combined ratio 88%
  margin                                                                       ➢    Credit cost ratio -0.07%
❖ Lower net fee and commission income                              Excellent   ➢    Common equity ratio 16.0% (B3, DC, fully loaded)
                                                                   net         ➢    Leverage ratio 6.1% (fully loaded)
❖ Higher net gains from financial instruments at
                                                                   result of   ➢    NSFR 134% & LCR 138%
  fair value and net other income
                                                                                           855              Net result
❖ Excellent sales of non-life insurance and lower                  701m
                                                                                                    691                           692     701
  sales of life insurance y-o-y                                    EUR in        630
                                                                                                                         556
❖ Costs up, partly due to one-offs                                 3Q18
                                                                                                              399

❖ Net impairment releases on loans
                                                                                1Q17      2Q17      3Q17     4Q17        1Q18    2Q18     3Q18
❖ Solid solvency and liquidity                                                 * when evenly spreading the bank tax throughout the year

❖ An interim dividend of 1 EUR per share (as
  advance payment on the total 2018 dividend)
  will be paid on 16 November 2018
Comparisons against the previous quarter unless otherwise stated
                                                                        3
KBC Group Company presentation - 3Q 2018 - KBC Bank
Overview of building blocks of the 3Q18 net result
                                                                                                                                  Bringing
                                                                                                                                  CCR to
                                                                                                                                  -0.07%
                                                                      1.888
                                                                                       -26
                                                        147
                                        182

                         424                                                                         -956
         1.136
                                                                                                                                       2
                                                                                                                      2
                                                                                                                                             -211

                                                                                                                                                       701

          NII            NFCI        Technical        Other  Total Income Bank tax                Opex excl. Impairments            Other    Taxes   3Q18 net
                                     Insurance      Income**                                       bank tax                                           result
                                      Result*
Q-o-Q      +2%            -3%            -4%           +24%            +1%                           +1%                                               +1%

Y-o-Y      +2%            -2%            -9%           +32%            +2%                           +7%                                               +6%
***

        * Earned premiums – technical charges + ceded reinsurance
        ** Dividend income + net result from FIFV + net realised result from debt instruments FV through OCI + net other income
        *** Y-o-Y comparison based on pro forma 3Q17 numbers

                                                                                          4
KBC Group Company presentation - 3Q 2018 - KBC Bank
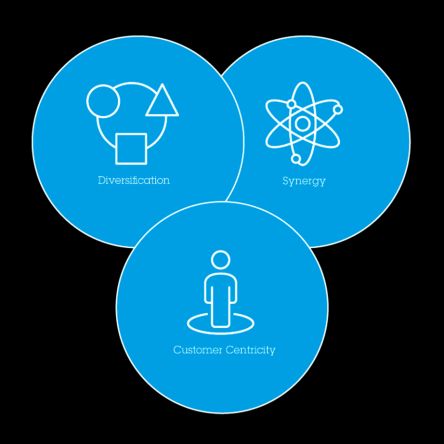
Main exceptional items

                                                                                3Q18                    2Q18                     3Q17
        Opex – Expenses for early retirement                                          -4m EUR
BE BU

        Opex - Facility expenses                                                                              +1m EUR
        Technical charges non-life: release of provisions                                                                          +26m EUR
        Technical charges life: release of provisions                                                                              +23m EUR
                       Total Exceptional Items BE BU                       -4m EUR                  +1m EUR                 +49m EUR
CZ BU

        Opex – Restructuring costs                                                      -5m EUR

                       Total Exceptional Items CZ BU                       -5m EUR

                                                                                                                                       -54m EUR
IM BU

        IRL – NOI - Provisions related to the tracker mortgage review
        IRL – Opex - Costs related to sale of part of legacy loan portf.               -3m EUR

                       Total Exceptional Items IM BU                       -3m EUR                                          -54m EUR

        NOI – Settlement of legacy legal file                                          +5m EUR                 -38m EUR
        Opex – Expenses for early retirement                                           -2m EUR
GC

                       Total Exceptional Items GC                          +3m EUR                  -38m EUR

            Total Exceptional Items (pre-tax)                              -9m EUR                -37m EUR                -5m EUR

           Total Exceptional Items (post-tax)                              -7m5 EUR               -37m EUR                -15m EUR
KBC Group Company presentation - 3Q 2018 - KBC Bank
Contents

 1    3Q 2018 performance of KBC Group

 2    3Q 2018 performance of business units

 3    Strong solvency and solid liquidity

 4    Looking forward

Annex 1: Company profile
Annex 2: Other items

                                            6
KBC Group Company presentation - 3Q 2018 - KBC Bank
KBC Group

Section 1

3Q 2018 performance of KBC Group

               7
Net result at KBC Group
                                                                                               CONTRIBUTION OF BANKING ACTIVITIES
                                                                                                   TO KBC GROUP NET RESULT*
                                                                                                  750

                                                                                                                                                          603
                                                                                                              575                                574
                                                                                        526
                                                                                                                                       461
                         NET RESULT AT KBC GROUP*
                                                                                                                           330
                         855
                                                                                        1Q17      2Q17       3Q17          4Q17       1Q18      2Q18      3Q18
                                 691                   692     701
                630
                                               556
                                                                                               CONTRIBUTION OF INSURANCE ACTIVITIES
                                        399                                                         TO KBC GROUP NET RESULT*
                                                                                                              137                                155
               1Q17     2Q17     3Q17   4Q17   1Q18   2Q18    3Q18
                                                                                        111       113
                                                                                                               96                                 74      107
                                                                                                                            78         102
                                                                                                   64
                                                                                         78                                 27         42                  73

                                                                                                                                                 113
                                                                                                   82          93           84         75
                                                                                         61                                                                61

                                                                                        -29                                            -15       -32      -27
* Difference between net result at KBC Group and the sum of the banking and insurance             -33         -52          -34
 contribution is accounted for by the holding-company/group items
                                                                                        1Q17      2Q17       3Q17          4Q17       1Q18      2Q18      3Q18

                                                                                                         Non-Life result          Non-technical & taxes

              Amounts in m EUR                                                      8
                                                                                                         Life result
Good net interest income and net interest margin
                      NII (pro forma for 2017*)          Amounts in m EUR

        1,081    1,094    1,114   1,137   1,125   1,117
                                                            1,136
                                                            2 17                                          ▪ Net interest income (1,136m EUR)
         143 3
              28
                  142
                       21 144 22 135 47 128 27 124 19 128                                                    • Up by 2% both q-o-q and y-o-y. Note that NII banking
                       3        2       3       0       1
                                                                                                               increased by 2% q-o-q and by 5% y-o-y
                                                                                                             • The q-o-q increase was driven primarily by:
         907       928         946        952        970        972        989                                 o additional positive impact of both short- & long-term
                                                                                                                  interest rate increases in the Czech Republic
                                                                                                               o continued good loan volume growth
        1Q17       2Q17       3Q17       4Q17       1Q18       2Q18       3Q18                                 o lower funding costs
          NII - netted positive impact of ALM FX swaps**          NII - Insurance
                                                                                                               partly offset by:
          NII - Holding-company/group                             NII - Banking
                                                                                                               o lower netted positive impact of ALM FX swaps
               NIM (pro forma for 2017***)                                                                     o lower reinvestment yields in our eurozone core countries
                                                    2.01%      2.00%      1.98%
                                                                                                               o pressure on commercial loan margins in most core
                  1.96%      1.96%       1.97%
       1.93%                                                                                                      countries

                                                                                                          ▪ Net interest margin (1.98%)
                                                                                                             • Down by 2 bps q-o-q
                                                                                                             • Up by 2 bps y-o-y thanks to lower funding costs (due mainly to
                                                                                                               the call of the CoCo) and the positive impact of repo rate hikes
        1Q17       2Q17       3Q17       4Q17       1Q18       2Q18       3Q18
                                                                                                               in the Czech Republic
   * 2017 pro forma figures for NII as the impact of ALM FX derivatives was ‘netted’ in NII as of 2018
   ** From all ALM FX swap desks
   *** NIM is calculated excluding the dealing room and the net positive impact of ALM FX swaps & repos

     VOLUME TREND                     Total loans**                   o/w retail mortgages                Customer deposits***              AuM                  Life reserves
     Volume                                147bn                                  61bn                           194bn                     214bn                      29bn
     Growth q-o-q*                           +1%                                  +1%                             0%                          0%                       0%
     Growth y-o-y                            +5%                                  +3%                             +3%                         0%                       -1%
* Non-annualised ** Loans to customers, excluding reverse repos (and bonds). Note that part of the Irish portfolio for which a sales agreement has been signed, is still included in 3Q18
*** Customer deposits, including debt certificates but excluding repos. Customer deposit volumes
                                                                                            9    excluding debt certificates & repos stable q-o-q and +6% y-o-y
Lower net fee and commission income
                   F&C (pro forma for 2017*)                     Amounts in m EUR
                                                                                              ▪ Net fee and commission income (424m EUR)
   463        454                    456        450
                                                                                                • Down by 3% q-o-q and by 2% y-o-y
                          433                              438        424
                                                                                                • Q-o-q decrease was the result chiefly of:
   208        213         213        229        215        223        219
                                                                                                  o lower securities-related fees (holiday season)
                                                                                                  o lower entry fees from mutual funds (holiday season led to
                                                                                                     less gross inflows)
   323        314                    301        299
                                                                                                  o lower management fees from mutual funds and unit-linked
                          295                              281        275
                                                                                                     life insurance products
                                                                                                  o higher commissions paid on insurance sales, mainly non-life
                                                                      -70
    -69        -73        -74        -75        -64        -66                                    o lower fees from credit files & bank guarantees
  1Q17        2Q17       3Q17       4Q17       1Q18       2Q18       3Q18                         partly offset by:
                                                                                                  o higher fees from payment services (holiday season)
    Distribution       Banking services         Asset management services
                                                                                                  o higher network income
* 2017 pro forma figures as the network income shifted from FIFV to net F&C as of 2018
                                                                                                • Y-o-y decrease was mainly the result of:
                                                                                                  o lower entry and management fees from mutual funds &
                                                                 Amounts in bn EUR
                                                                                                     unit-linked life insurance products,
                                                                                                  o lower fees from credit files & bank guarantees
                                  AuM*
                                                                                                  partly offset by:
   214        213        215        217        213         214        214                         o higher fees from payment services
                                                                                                  o higher securities-related fees
                                                                                                  o higher network income

                                                                                              ▪ Assets under management (214bn EUR)
                                                                                                • Stabilised q-o-q and y-o-y as small net outflows were offset by
  1Q17       2Q17       3Q17       4Q17        1Q18       2Q18       3Q18
                                                                                                  a positive price effect
                                                                                                • The mutual fund business has seen net outflows, mainly in
* Note that 2017 AuM figures were restated due to a roughly -2bn EUR adjustment in                investment advice
Institutional Mandates

                                                                                         10
Insurance premium income up y-o-y
                   and excellent combined ratio

               PREMIUM INCOME (GROSS EARNED PREMIUMS)                                                  ▪ Insurance premium income (gross earned
                                                           794
                                                                                                         premiums) at 696m EUR
                   672            636      660
                                                                       714    707          696           • Non-life premium income (403m) increased by 7%
                                                           410                                             y-o-y
                                                                       336    315          293
                                           282
                   312            267                                                                    • Life premium income (293m) down by 7% q-o-q
                                                                                                           and up by 4% y-o-y
                   360            369      378             384         378    392          403

                   1Q17          2Q17      3Q17           4Q17         1Q18   2Q18         3Q18

                               Life premium income           Non-Life premium income

                                                                                                       ▪ The non-life combined ratio at 9M18
                               COMBINED RATIO (NON-LIFE)                                                 amounted to 88%. 3Q18 was impacted by 2
                               90%
                                         84%        88%          83%    88%     88%                      large fire claims in Belgium, while technical
                    79%
                                                                                                         charges were low in 2Q18. Remember that
                                                                                                         3Q17 benefited from a one-off release of
                                                                                                         provisions in Belgium (positive effect of 26m
                                                                                                         EUR). Excluding this one-off release in 3Q17,
                                                                                                         the combined ratio amounted to 86% at 9M17
                          1Q                   1H                  9M                 FY

                                         2017             2018

                                                                                                  11
Amounts in m EUR
Non-life sales up y-o-y, life sales down y-o-y

                   NON-LIFE SALES (GROSS WRITTEN PREMIUM)                                    ▪ Sales of non-life insurance products
                   468                                    492                                  • Up by 8% y-o-y thanks to a good commercial
                                                                                                 performance in all major product lines in our core
                                                                      382        378
                            358        349        342                                            markets and tariff increases

                   1Q17    2Q17       3Q17       4Q17     1Q18       2Q18        3Q18

                                                                                             ▪ Sales of life insurance products
                                                                                               • Decreased by 10% q-o-q and by 5% y-o-y
                                             LIFE SALES                                        • The q-o-q decrease was primarily due to lower sales of
                                                  588                                            guaranteed interest products in Belgium
                                                          498
                   474
                            415                                       426                      • The y-o-y decrease was driven entirely by lower sales of
                                       405                                       383
                                                  318                                            unit-linked products in Belgium
                   267                                    279
                            222        218                            261        230           • Sales of unit-linked products accounted for 40% of total
                                                                                                 life insurance sales
                                                  270     219
                   207      193        187                            165        153

                   1Q17    2Q17       3Q17       4Q17     1Q18       2Q18        3Q18

                          Guaranteed interest products    Unit-linked products

                                                                                        12
Amounts in m EUR
Higher FV gains and other net income
                             FV GAINS (pro forma for 2017*)                                              ▪ The higher q-o-q figures for net gains from
                                 180                                                                       financial instruments at fair value were
                     130
                                                                                                           attributable mainly to:
                                  86                    118
                                             94                      96                                    • a positive change in ALM derivatives
                                                                                            79
                     110                                 94
                                                                                54                         • a positive change in market, credit and funding value
                                  73         71                     73          35          66                adjustments (mainly as a result of changes in the
                         1                         11          7        4       33
                                                                                                              underlying market value of the derivatives portfolio
                    19            21         12          17        19                      2 11
                                                                                -14                           and decreased credit spreads)
                     1Q17       2Q17        3Q17        4Q17       1Q18        2Q18       3Q18             partly offset by:
             Other FV gains                 Net result on equity instruments (overlay insurance)           • lower net result on equity instruments (insurance)
             M2M ALM derivatives                                                                           • lower dealing room income, mainly in Belgium and
                                                                                                              the Czech Republic
         *   2017 pro forma figures as:
             1) the impact of the FX derivatives was ‘netted’ in NII as of 2018
             2) the shift from realised gains on AFS shares and impairments on AFS shares to FIFV
               due to IFRS 9 (overlay approach for insurance)
                                                                                                         ▪ Other net income amounted to 56m EUR, more
                                                                                                           or less in line with the normal run rate of around
                                        OTHER NET INCOME                                                   50m EUR. Note that 2Q18 was negatively
                      77                                                                                   impacted by the settlement of a legacy legal file
                                                                     71
                                                                                                           in the Group Centre (-38m EUR), while 3Q17
                                                                                            56
                                  47                                                                       was negatively impacted by an additional
                                                                                23
                                                                                                           provision of 54m EUR related to an industry
                                              4
                                                                                                           wide review of the tracker rate mortgage
                                                                                                           products originated in Ireland before 2009
                                                         -14
                     1Q17       2Q17        3Q17        4Q17       1Q18        2Q18       3Q18

                                                                                                    13
Amounts in m EUR
Operating expenses up, partly due to one-offs
                                   OPERATING EXPENSES                                                    ▪ Cost/income ratio (banking) adjusted for specific
                                                                                                           items* at 58% in 3Q18 and 57% YTD
                                                         1,291
                    1,229
                                                                                                           • Operating expenses excluding bank tax went up by 1%
                     361
                                               1,021      371         966           981                      q-o-q primarily as a result of:
                            910       914        41                                 26
                            19        18
                                                                      24                                     o higher staff expenses (mainly due to wage
                                                                                                                inflation), except for Belgium
                                                                                                             o higher ICT and marketing expenses
                                               980                                  956
                     868    891       896                 920         942                                    o 14m EUR one-off costs:
                                                                                                                o 6m EUR expenses for early retirement in Belgium
                                                                                                                o 5m EUR restructuring charges in CZ
                    1Q17    2Q17     3Q17      4Q17      1Q18         2Q18         3Q18                         o 3m EUR costs related to the sale of part of the
                                                                                                                   legacy loan portfolio in Ireland
                                    Bank tax     Operating expenses
                                                                                                             partly offset by:
                                                                                                             o lower facilities expenses
                                                                                                           • Operating expenses without bank tax increased by 7%
         EXPECTED BANK TAX SPREAD IN 2018                                                                    y-o-y in 3Q18
                   TOTAL             Upfront                          Spread out over the year             • Excluding the consolidation impact of UBB/Interlease,
                                                                                                             bank tax, FX effect and one-off costs, operating
                   3Q18     1Q18      2Q18       3Q18        1Q18            2Q18         3Q18   4Q18e       expenses in 9M18 rose by roughly 3% y-o-y
    BE BU            0      273         -4           0           0            0            0       0

    CZ BU            0       29         1            0           0            0            0       0       • Pursuant to IFRIC 21, certain levies (such as
                                                                                                             contributions to the European Single Resolution Fund)
    Hungary         21       26         0            0           19           22           21     22         have to be recognised in advance, and this adversely
                             3          0            0           4            4            4       4
                                                                                                             impacted the results for 1Q18. The YTD increase can
    Slovakia         4
                                                                                                             mainly be explained by the consolidation of UBB
    Bulgaria         0       14         1            0           0            0            0       0       • Total bank taxes (including ESRF contribution) are
    Ireland          1       3          0            0           1            0            1      14         expected to increase from 439m EUR in FY17 to 462m
                                                                                                             EUR in FY18
    GC               0       0          0            0           0            0            0       0

    TOTAL           26      347         -2           0           24           26           26     40
                                                                                                   14
Amounts in m EUR                                                                                           *   See glossary (slide 79) for the exact definition
Overview of bank taxes*                                                                                                                                    Bank taxes of 269m EUR YTD.
                                                                                                                                                                      On a pro rata basis, bank taxes
                                                                                                                                                                      represented 10.7% of 9M18
                              KBC GROUP                                 Bank taxes of 421m EUR YTD.                                   BELGIUM BU                      opex at the Belgium BU
      361                                     371                       On a pro rata basis, bank taxes          278                                  273
                                                                        represented 10.9% of 9M18                 53                                   58
      83                                      98
                                                                        opex at KBC Group**

                                                                                                                 225                                  215
      278                                     273
                                      41
               19            18         0             24        26                                                                             0                        0
                                     41                  2                                                                -4 -2                               -7 3
               20                                     22
                     -1                                                                                                    -6        -7                        -4
     1Q17     2Q17      3Q17      4Q17      1Q18      2Q18      3Q18                                            1Q17     2Q17       3Q17      4Q17    1Q18   2Q18      3Q18
                     European Single Resolution Fund contribution                                                                 ESRF contribution     Common bank taxes
                     Common bank taxes
                                                                                                                                                                       Bank taxes of 122m EUR YTD.
                                                                                                                                                                       On a pro rata basis, bank
                                                                       Bank taxes of 30m EUR YTD.                                                                      taxes represented 18.1% of
                      CZECH REPUBLIC BU                                On a pro rata basis, bank                 INTERNATIONAL MARKETS BU                              9M18 opex at the IM BU
                                                                       taxes represented 4.2% of
                                               29                      9M18 opex at the CZ BU                                                          70
      26
                                                                                                                  57                                   18
                                                                                                                  11
                                                                                                                                               41
                                               22
      20
                                                                                                                           25        25                        27      26
                                                                                                                           1                           52
                                                                                                                  46
                                                                                                                           24                                  28
       6        1            0         0       6       1           0
                                                                                                                                                               -1
     1Q17     2Q17         3Q17      4Q17     1Q18   2Q18      3Q18
                                                                                                                1Q17     2Q17       3Q17     4Q17     1Q18    2Q18    3Q18

                                                                                                                                  ESRF contribution     Common bank taxes
                          ESRF contribution    Common bank taxes

* This refers solely to the bank taxes recognised in opex, and as such it does not take account of income tax expenses, non-recoverable VAT, etc.
** The C/I ratio adjusted for specific items of 57% in 9M18 amounts to roughly 50% excluding these bank taxes
                                                                                              15
Net impairment releases, excellent credit cost ratio and
improved impaired loans ratio
                       ASSET IMPAIRMENT
                           31      2                                                 ▪ Very low asset impairments
                           10
  8                               29                                                    • This was attributable mainly to:
                           21                             20
 7 1          5                               6                      6                    o net loan loss impairment releases in Ireland of 15m EUR
                                                                    -8
                                                         -21        -2
             -76
                                  -27
                                             -63                                             (compared with 39m in 2Q18)
                                                          -1                              o also small net loan loss impairment reversals in Slovakia,
                                             -56                                             Hungary, Bulgaria and Group Centre
             -71                                                                          partly offset by:
1Q17        2Q17       3Q17      4Q17       1Q18         2Q18      3Q18                   o loan loss impairments of only 3m EUR in Belgium
  Other impairments      Impairments on financial assets at AC* and FVOCI                 o loan loss impairments of 12m EUR in the Czech Republic due
      * AC = Amortised Cost. Under IAS 39, impairments on L&R
                                                                                             to 1 large corporate file
                      CREDIT COST RATIO
 0.42%
                                                                                        • Impairment of 6m on ‘other’, of which 4m EUR in the Czech
                                                                                          Republic mostly resulting from a review of residual values of
                   0.23%                                                                  financial car leases under short-term contracts
                                 0.09%

                                               -0.06%           -0.07%               ▪ The credit cost ratio amounted to -0.07% in 9M18 due to
  FY14             FY15          FY16             FY17          9M18                   low gross impairments and several releases
                   IMPAIRED LOANS RATIO
6.8%        6.9%          6.6%
                                 6.0%       5.9%
                                                         5.5%      5.5%
                                                                                     ▪ The impaired loans ratio stabilised at 5.5%*, 3.2% of
                                                                                       which over 90 days past due
3.6%        3.9%          3.7%   3.4%       3.5%                   3.2%
                                                         3.2%

1Q17        2Q17       3Q17      4Q17       1Q18         2Q18      3Q18
                                                                                 * Excluding the part of the Irish portfolio for which a sales agreement has
                                                                            16
         Impaired loans ratio     of which over 90 days past due                   been signed, the impaired loans ratio would amount to 4.5% in 3Q18
KBC Group

Section 2

3Q 2018 performance of business units

                17
Business profile

                                       BELGIUM    CZECH                                                 GROUP
                                                             SLOVAKIA    HUNGARY   BULGARIA   IRELAND
                                                 REPUBLIC                                               CENTRE

3Q18 NET RESULT (in million euros)       409m      168m          27m       51m        31m       32m     -17m

ALLOCATED CAPITAL (in billion euros)     6.6bn     1.7bn         0.6bn     0.7bn      0.4bn    0.6bn    0.3bn

LOANS (in billion euros)                 99bn      23bn          7bn       4bn        3bn       11bn

DEPOSITS (in billion euros)              132bn     32bn          6bn       7bn        4bn        5bn

BRANCHES (end 9M18)                      627       265           122       206        224        18

Clients (end 9M18)                       3.5m      3.7m          0.6m      1.6m       1.2m      0.3m

                                                            18
Belgium BU (1): net result of 409m EUR

                                    NET RESULT                                                          Net result at the Belgium Business Unit amounted
                   483
                                                                                                        to 409m EUR
                             455
                                                            437                                             • The quarter under review was characterised by good
                                                                      409                                     net interest income, lower net fee and commission
                                        336                                                                   income, lower dividend income, stable trading and fair
         301                                                                                                  value income, lower other net income, an excellent
                                                  243                                                         combined ratio, lower sales of life insurance products,
                                                                                                              lower operating expenses and lower impairment
                                                                                                              charges q-o-q
                                                                                                            • Customer deposits excluding debt certificates and
                                                                                                              repos rose by 7% y-o-y, while customer loans increased
                                                                                                              by 6% y-o-y
        1Q17      2Q17       3Q17      4Q17      1Q18      2Q18      3Q18

      Amounts in m EUR

  VOLUME TREND                     Total loans**             o/w retail mortgages               Customer deposits***                     AuM                   Life reserves
  Volume                               99bn                            35bn                               132bn                         200bn                     27bn
  Growth q-o-q*                        +1%                              0%                                 +1%                            0%                       0%
  Growth y-o-y                         +6%                              +2%                                +2%                            0%                       -1%
* Non-annualised ** Loans to customers, excluding reverse repos (and bonds)
*** Customer deposits, including debt certificates but excluding repos. Customer deposit volumes excluding debt certificates & repos -1% q-o-q and +7% y-o-y

                                                                                           19
Belgium BU (2): good NII and lower NIM
                                                                                 Amounts in m EUR
                             NII (pro forma for 2017*)
               681         677                  677
                                                                                                            ▪ Net interest income (637m EUR)
                                      664                  649         642        637
               28          19         20        39         19           11         8                          • Fell by 1% q-o-q due mainly to:
                           129
               130                    132       123        117         113        116                           o the lower netted positive impact of FX swaps
                                                                                                                o lower reinvestment yields
                                                                                                                o pressure on commercial margins
                                                                                                                partly offset by:
               523         529        512       515        513         518        513
                                                                                                                o good loan volume growth
                                                                                                                o higher NII insurance

              1Q17        2Q17        3Q17     4Q17        1Q18       2Q18        3Q18                        • Down by 4% y-o-y, driven primarily by:
    NII - netted positive impact of ALM FX swaps**      NII - contribution of banking                           o lower netted positive impact of FX swaps
    NII - contribution of insurance                                                                             o lower reinvestment yields
                                                                                                                o pressure on commercial loan margins
* 2017 pro forma figures for NII as the impact of ALM FX derivatives was ‘netted’ in NII as of 2018
** From all ALM FX swap desks                                                                                   partly offset by:
*** NIM is calculated excluding the dealing room and the net positive impact of ALM FX swaps & repos            o lower funding costs on term deposits
                                                                                                                o good loan volume growth
                          NIM (pro forma for 2017***)                                                           Note that NII banking stabilised y-o-y
             1.78%       1.79%                 1.73%      1.73%
                                      1.72%                          1.72%       1.69%

                                                                                                            ▪ Net interest margin (1.69%)
                                                                                                              • Fell by 3 bps both q-o-q and y-o-y due mainly to the negative
                                                                                                                impact of lower reinvestment yields and pressure on commercial
                                                                                                                loan margins

              1Q17        2Q17        3Q17     4Q17        1Q18       2Q18        3Q18

                                                                                                       20
Credit margins in Belgium
                PRODUCT SPREAD ON CUSTOMER LOAN BOOK, OUTSTANDING
1.3
1.2
1.1
1.0
0.9
0.8
0.7
0.6
0.5
0.4
0.3
0.2
0.1
0.0
   1Q11 2Q11 3Q11 4Q11 1Q12 2Q12 3Q12 4Q12 1Q13 2Q13 3Q13 4Q13 1Q14 2Q14 3Q14 4Q14 1Q15 2Q15 3Q15 4Q15 1Q16 2Q16 3Q16 4Q16 1Q17 2Q17 3Q17 4Q17 1Q18 2Q18 3Q18

                                                                      Customer loans

                               PRODUCT SPREAD ON NEW PRODUCTION
1.8
1.6
1.4
1.2
1.0
0.8
0.6
0.4
0.2

  1Q11 2Q11 3Q11 4Q11 1Q12 2Q12 3Q12 4Q12 1Q13 2Q13 3Q13 4Q13 1Q14 2Q14 3Q14 4Q14 1Q15 2Q15 3Q15 4Q15 1Q16 2Q16 3Q16 4Q16 1Q17 2Q17 3Q17 4Q17 1Q18 2Q18 3Q18

                                                 SME and corporate loans                       Mortgage loans
                                                                               21
Belgium BU (3): lower net F&C income
                                                                   Amounts in m EUR
                  F&C (pro forma for 2017*)
                                                                                               ▪ Net fee and commission income (289m EUR)
     356
               339
     10
                9          307
                                      321        318        302          289                     • Net F&C income decreased by 4% q-o-q due mainly to:
                                       8
                            7                     9          9            9                        o lower securities-related fees (holiday season)
                                                                                                   o lower entry fees from mutual funds (holiday season
                                                                                                     led to less gross inflows)
     391        376        352        368        356
                                                                                                   o lower management fees from mutual funds and unit-
                                                            345          333
                                                                                                     linked life insurance products
                                                                                                   partly offset by:
                                                                                                   o higher fees from payment services (holiday season)
     -45        -45        -52        -55         -47        -53         -53
    1Q17       2Q17       3Q17       4Q17       1Q18       2Q18         3Q18                     • Fell by 6% y-o-y driven chiefly by lower entry and
       F&C - network income                   F&C - contribution of banking
                                                                                                   management fees from mutual funds & unit-linked life
       F&C - contribution of insurance
                                                                                                   insurance products and lower fees from credit files &
                                                                                                   bank guarantees partly offset by higher fees from
 * 2017 pro forma figures as the network income shifted from FIFV to net F&C as of 2018            payment services, higher securities-related fees and
                                                                                                   higher network income
                                    AuM*                           Amounts in bn EUR

    200        198        200        202         199        200         200

                                                                                               ▪ Assets under management (200bn EUR)
                                                                                                 • Stabilised q-o-q and y-o-y as small net outflows were
                                                                                                   offset by a positive price effect

   1Q17       2Q17       3Q17       4Q17        1Q18       2Q18        3Q18

* Also note that 2017 AuM figures were reduced due to a roughly 2bn EUR adjustment
in Institutional Mandates
                                                                                          22
Belgium BU (4): higher y-o-y non-life sales,
excellent combined ratio

                                                                                     ▪ Sales of non-life insurance products
 NON-LIFE SALES (GROSS WRITTEN PREMIUM)                                                • Increased by 5% y-o-y
  323                                              329
                                                                                       • Premium growth in all classes
               256                                         262
                      241                                                252
                                      228

 1Q17       2Q17      3Q17            4Q17         1Q18    2Q18          3Q18
Amounts in m EUR

              COMBINED RATIO (NON-LIFE)                                              ▪ Combined ratio amounted to 87% in 9M18
                                                                                       (86% in FY17). 3Q18 was impacted by 2 large fire
             93%
                     81%
                                87%                  87%      86%                      claims, while technical charges were low in 2Q18.
                                             80%
  77%
                                                                                       Remember that 3Q17 benefited from a one-off
                                                                                       release of provisions (positive effect of 26m EUR).
                                                                                       Excluding this one-off release in 3Q17, the
                                                                                       combined ratio amounted to 83% at 9M17

        1Q                 1H                  9M                   FY

                           2017         2018
                                                                                23
Belgium BU (5): lower life sales, good cross-selling ratios
                                  LIFE SALES                                             ▪ Sales of life insurance products
                                       460
                                                                                           • Fell by 15% q-o-q driven by both lower sales of
                                               404
                                                                                             guaranteed interest products and unit-linked products
       396
                 340                                      333
                                                                                           • Decreased by 8% y-o-y driven entirely by lower sales
                            306
                                       290                            282
                                                                                             of unit-linked products
       241                                     250                                         • As a result, guaranteed interest products and unit-
                 197
                            193                           233                                linked products accounted for 71% and 29%,
                                                                      201
                                                                                             respectively, of life insurance sales in 3Q18
       155                             170     154
                 143        113                           101          81                ▪ Life technical charges: note that 3Q17 benefited
      1Q17      2Q17       3Q17       4Q17     1Q18      2Q18         3Q18                 from a release of life-related provisions (positive
                                                                                           effect of 23m EUR)
               Guaranteed interest products    Unit-linked products
     Amounts in m EUR

        MORTGAGE-RELATED CROSS-SELLING RATIOS
90
85                                                                               84.5%
                                                                                         ▪ Mortgage-related cross-selling ratios
80                                                                               80.0%     • 84.5% for property insurance
75                                                                                         • 80.0% for life insurance
70
65
60   63.7%
                                   Property insurance           Life insurance
55
50
45   49.5%
40

                                                                                   24
Belgium BU (6): stable FV gains and lower other net income
                           FV GAINS (pro forma for 2017*)                                               ▪ The stable q-o-q figures for net gains from
                   110
                                                                                                          financial instruments at fair value were
                    61         74                                                                         primarily due to a positive change in ALM
                               23                     51                      54         53               derivatives and a positive change in market,
                                           36                     34
                                                                             7
                                                                               14
                                                                                         33
                                                                                                          credit and funding value adjustments (mainly
                    29         30                     36
                                           10
                                           14
                                                                  17
                                                                             33
                                                                                                          as a result of changes in the underlying
                                                                                         18
                    20         21          12
                                                     -2
                                                        17
                                                                 -2
                                                                      19
                                                                                          2               market value of the derivative portfolio and
                   1Q17       2Q17       3Q17        4Q17        1Q18       2Q18        3Q18              decreased credit spreads), offset entirely by
                                                                                                          lower net result on equity instruments and
             Other FV gains                Net result on equity instruments (overlay insurance)
             M2M ALM derivatives
                                                                                                          lower dealing room result

        *   2017 pro forma figures as:
            1) the impact of the FX derivatives was ‘netted’ in NII as of 2018
            2) the shift from realised gains on AFS shares and impairments on AFS shares to FIFV
              due to IFRS 9 (overlay approach for insurance)

                                      OTHER NET INCOME
                                                                  59
                                           51
                                                                                                        ▪ Other net income amounted to 44m EUR in
                                                                              49
                    46
                               40
                                                                                         44               3Q18 (roughly in line with the normal run
                                                      38
                                                                                                          rate)

                   1Q17       2Q17       3Q17        4Q17        1Q18       2Q18        3Q18

                                                                                                   25
Amounts in m EUR
Belgium BU (7): lower opex and impairments, good credit
cost ratio

                   OPERATING EXPENSES                                                  ▪ Operating expenses: flat q-o-q and +8% y-o-y
   822                                       822
                                                                                         • Operating expenses without bank tax fell by 1% q-o-q due
                                                                                           mainly to lower staff, facilities and professional fee
                                                                                           expenses, partly offset by higher marketing & ICT expenses
   278                                       273
             544
                                  566                   562
                                                                    559
                                                                                           and 4m EUR expenses for early retirement
                       520         0
                                                                                         • Operating expenses without bank tax increased by 6% y-o-y
                                                                                           as lower facilities and staff expenses were more than offset
                                                                                           by higher ICT, professional fee & marketing expenses and
   544       550       527        566        549        566                                4m EUR expenses for early retirement
                                                                                         • Cost/income ratio: 51% in 3Q18 and 59% YTD, distorted by
                                                                                           the bank taxes. Adjusted for specific items, the C/I ratio
             -6        -7                                -4
                                                                                           amounted to 58% in 3Q18 and 57% YTD (53% in FY17)
  1Q17      2Q17      3Q17       4Q17       1Q18       2Q18         3Q18
                    Bank tax       Operating expenses

                   ASSET IMPAIRMENT
   60
                                                                                       ▪ Loan loss impairments decreased to 3m EUR in 3Q18
                                                                                         (compared with 26m EUR in 2Q18) as 2Q18 was
                                                                                         impacted by some corporate files. Credit cost ratio
                        34
                                                                                         amounted to 6 bps in 9M18 (9 bps in FY17)
                                   24                   26

                                             13
                                                                                       ▪ Impaired loans ratio stabilised at 2.4%, 1.3% of which
                                                                                         over 90 days past due
                                             14                         41
                                                                    3
                                              -1
              -2
  1Q17      2Q17     3Q17        4Q17      1Q18       2Q18       3Q18
      Other impairments        Impairments on financial assets at AC* and FVOCI
          * AC = Amortised Cost. Under IAS 39, impairments on L&R
Amounts in m EUR                                                                  26
Net result at the Belgium BU

                                                                                 CONTRIBUTION OF BANKING ACTIVITIES TO
                                                                                    NET RESULT OF THE BELGIUM BU*
                                                                                          385
                                                                                                    336                                       325
                                                                                                                                    302
                                                                                                                271
         NET RESULT AT THE BELGIUM BU*                                          208
                                                                                                                         165
            483
                    455                         437
                                                         409
                             336
  301                                                                           1Q17     2Q17       3Q17      4Q17      1Q18       2Q18       3Q18
                                       243

                                                                                 CONTRIBUTION OF INSURANCE ACTIVITIES TO
                                                                                     NET RESULT OF THE BELGIUM BU*
                                                                                                    119                             135
 1Q17      2Q17    3Q17      4Q17     1Q18     2Q18     3Q18
                                                                                 93       98                                        58
                                                                                                     79                                        84
                                                                                          48                    65        78
                                                                                 64                              9        20                   55
                                                                                                                                    101
                                                                                          70         80         74        63
                                                                                 50                                                            48
                                                                                                                -19       -5                  -19
                                                                                -21       -20                                       -24
                                                                                                    -40

* Difference between net profit at the Belgium Business Unit and the sum of     1Q17     2Q17       3Q17      4Q17      1Q18       2Q18       3Q18
  the banking and insurance contribution is accounted for by the rounding up
                                                                                  Non-Life result     Life result     Non-technical & taxes
  or down of figures

Amounts in m EUR                                                           27
Czech Republic BU
                                    NET RESULT                      Amounts in m EUR
          181       183
                              170                   171
                                                                                                          Net result of 168m EUR in 3Q18
                                        167                             168
                                                             145
                                                                                                          ▪ +16% q-o-q excluding FX effect due mainly to higher net
                                                                                                            interest income and higher net results from financial
                                                                                                            instruments at fair value
                                                                                                          ▪ Customer deposits (including debt certificates, but
                                                                                                            excluding repos) rose by 8% y-o-y, while customer loans
         1Q17      2Q17      3Q17      4Q17         1Q18    2Q18        3Q18
                                                                                                            increased by 4% y-o-y

                                    NII & NIM                       Amounts in m EUR                      Highlights

                                       234          248     241
                                                                        263
                                                                                                          ▪ Net interest income
         216        220      218
        2.93%      2.91%    2.84%     2.95%     3.02%       2.97%      3.04%                                  • +9% q-o-q and +19% y-o-y excl. FX effects
                                                                                                              • Q-o-q increase: primarily due to short & long term increasing
                                                                                                                interest rates and growth in loan and deposit volume, despite
                                                                                                                pressure on commercial margins
                                                                                                              • Net interest margin at 3.04%: +7 bps q-o-q and +20 bps y-o-y
        1Q17       2Q17     3Q17       4Q17         1Q18    2Q18        3Q18
                                      NIM             NII

  VOLUME TREND                       Total loans **               o/w retail mortgages                     Customer                        AuM                Life reserves
  excluding FX effect                                                                                     deposits***
  Volume                                     23bn                             11bn                             32bn                        9.7bn                 1.3bn
  Growth q-o-q*                               +1%                              +2%                              +3%                         +1%                   +2%
  Growth y-o-y                                +4%                              +8%                              +8%                         +5%                   +8%
* Non-annualised   ** Loans to customers, excluding reverse repos (and bonds)        *** Customer deposits, including debt certificates but excluding repos
                                                                                                  28
Czech Republic BU
                                                                                                     ▪ Net F&C income
                                F&C (pro forma for 2017*)                                              • -3% q-o-q and +13% y-o-y on a pro forma basis excl. FX effects
                                                                             Amounts in m EUR          • Q-o-q decrease driven by lower fees from payment services,
                                               64
                                                            67
                                                                        64
                                                                                                         lower securities-related fees and lower fees from credit files &
                                                                                     62
            56            56                               10           8
                                                                                                         bank guarantees partly offset by higher network income
                                    53         10                                   10
             9             9
                                    10
                                                                                                       • Y-o-y increase due chiefly to slightly higher management fees,
                                                                                                         higher securities-related fees and less fees paid to the Czech
                                                                                                         Post
                                               53          57           56          52
            47            47        43
                                                                                                     ▪ Assets under management
                                                                                                       • 9.7bn EUR
         1Q17            2Q17      3Q17       4Q17         1Q18        2Q18         3Q18               • +1% q-o-q due to net inflows (+0.8%) & positive price effect
                                                                                                         (+0.6%)
                       F&C - network income         F&C - banking & insurance
                                                                                                       • +5% y-o-y, due to net inflows (+6%) & negative price effect (-1%)
*   2017 pro forma figures as the network income shifted from FIFV to net F&C as of 2018
                                                                                                     ▪ Trading and fair value income
                                                                                                       • 12m EUR higher q-o-q net results from financial instruments at
                                                                                                         fair value (to 20m EUR) due mainly to a higher q-o-q change in
                                                                                                         market, credit & funding value adjustments as well as in ALM
                                CROSS-SELLING RATIOS                                                     derivatives, partly offset by lower dealing room result
      Mortg. & prop.                Mortg. & life risk            Cons.fin. & life risk
                                                                                                     ▪ Insurance
                                                                                                       • Insurance premium income (gross earned premium): 128m EUR
                                                                                                         o Non-life premium income (65m EUR) +14% y-o-y excluding FX
      65%        61%     59%
                                              48%    48%
                                                                      63%     57%    55%                    effect, due to growth in all products
                                      47%
                                                                                                         o Life premium income (63m EUR) +10% q-o-q and -9% y-o-y,
      2016       2017 9M18           2016     2017 9M18              2016     2017 9M18
                                                                                                            excluding FX effect. Q-o-q increase mainly in unit-linked single
                                                                                                            premiums
                                                                                                       • Good combined ratio of 96% in 9M18 (97% in FY17). Technical
                                                                                                         charges in 3Q18 were in line with 2Q18, despite the fact that
                                                                                                         3Q18 was impacted by a few large fire claims
                                                                                                29
Czech Republic BU
                                                                                          ▪ Operating expenses
                  OPERATING EXPENSES                          Amounts in m EUR
                                                                                            • 180m EUR; +5% q-o-q and +16% y-o-y, excluding FX effect
                                   177       189                                              and bank tax
                                                       173          180
165                                 0
            151       153                    29         1                                   • Q-o-q increase excluding FX effect and bank tax was due
26           1         0                                                                      mainly to higher staff expenses (wage inflation), higher ICT
                                                                                              & marketing expenses and 5m EUR one-off restructuring
                                                                                              costs, partly offset by lower facilities expenses and lower
                                   176                 172                                    professional fees
           150        152                    160
139
                                                                                            • Y-o-y increase excluding FX effect and bank tax was due
                                                                                              primarily to higher staff expenses, higher support to the
                                                                                              Czech Post (which is compensated by lower paid fee), 5m
1Q17       2Q17      3Q17         4Q17      1Q18      2Q18         3Q18                       EUR one-off restructuring costs, higher marketing
                                                                                              expenses and higher professional fees
                  Bank tax          Operating expenses
                                                                                            • Cost/income ratio at 46% in 3Q18 and 47% YTD. Adjusted
                                                                                              for specific items, C/I ratio amounted to roughly 48% in
                                                                                              3Q18 and 46% YTD (43% in FY17)
                   ASSET IMPAIRMENT                           Amounts in m EUR

                                                                                          ▪ Loan loss and other impairment
                                                                     16
                                    11                   9           4
                                                                                            • Loan loss impairments of 12m EUR due to 1 large
            11                                                                                corporate file. Credit cost ratio amounted to 0.04% in
             3                                7                                               9M18
                                    13                   13          12
             7
                          3                   6                                                             2014     2015     2016     2017    9M18
                              2
                      1                       1                                                    CCR     0.18%    0.18%    0.11%    0.02%    0.04%
                                    -2                   -4
 -1
1Q17       2Q17      3Q17          4Q17      1Q18      2Q18         3Q18
                                                                                            • Impaired loans ratio amounted to 2.3%, 1.4% of which >90
                                                                                              days past due
       Other impairments          Impairments on financial assets at AC* and FVOCI
          * AC = Amortised Cost. Under IAS 39, impairments on L&R                           • Impairment of 4m EUR on ‘other’ mainly as the result of a
                                                                                              review of residual values of financial car leases under
                                                                                              short-term contracts
                                                                                     30
International Markets BU
                                                                 Amounts in m EUR
                     177             NET RESULT
                      5                                         163                                              Net result of 141m EUR
                                                                 26        141
                                                      137
                                                                                                                 ▪ Slovakia 27m EUR, Hungary 51m EUR, Ireland 32m EUR
          114                                         21                    31
           4
                     99
                                                                 55
                                                                                                                   and Bulgaria 31m EUR
                                                                            32
                                78         74         57
          67
                                22            18
                     47
                                          3                      62         51                                   Highlights (q-o-q results)
                                                      34
          20                    40         39                                                                    ▪ Higher net interest income. NIM 2.79% in 3Q18 (-2 bps q-o-q
                     25                                                     27
          22
                              -1
                                  16       16         23         19                                                and -4 bps y-o-y)
         1Q17       2Q17      3Q17       4Q17         1Q18      2Q18      3Q18                                   ▪ Higher net fee and commission income (in SK)
                     Bulgaria      Ireland          Hungary       Slovakia                                       ▪ Stable result from financial instruments at fair value
                                                                                                                 ▪ An excellent combined ratio of 88% YTD
                                                                                                                 ▪ Higher life insurance sales (in HU)
                                                                                                                 ▪ Higher costs
                                                                                                                 ▪ Lower net impairment releases (especially IRL)

  VOLUME TREND                           Total loans **               o/w retail mortgages                  Customer deposits***                              AuM     Life reserves
  Excluding FX effect
  Volume                                           25bn                           15bn                                  22bn                                  4.3bn      0.7bn
  Growth q-o-q*                                    +1%                            +1%                                    -2%                                   0%         +2%
  Growth y-o-y                                     +4%                            +4%                                    +3%                              -28%****        +4%
*    Non-annualised **       Loans to customers, excluding reverse repos (and bonds) *** Customer deposits, including debt certificates but excluding repos
**** The decrease can partly be explained by the divestment of KBC TFI in Poland in December 2017 (-0.93bn AuM in 4Q17)
                                                                                                     31
International Markets BU - Slovakia

                            NET RESULT                       Amounts in m EUR

                   25
                                                                   27                Net result of 27m EUR
                                               23
          22
                                                        19
                            16       16                                              Highlights (q-o-q results)
                                                                                     ▪ Higher net interest income due mainly to volume growth. NIM
                                                                                       stabilised q-o-q
                                                                                     ▪ Higher net fee & commission income due mainly to higher fees
                                                                                       from payment services, higher entry fees and higher network
                                                                                       income
         1Q17     2Q17     3Q17     4Q17      1Q18     2Q18       3Q18               ▪ Higher result from financial instruments at fair value
                                                                                     ▪ Lower net other income
                                                                                     ▪ Excellent combined ratio (85% in 9M18); roughly stable
                                                                                       Technical insurance result in life
                                                                                     ▪ Stable operating expenses, despite high wage pressure
                                                                                     ▪ Net impairment releases (mainly in leasing and corporates);
                                                                                       credit cost ratio of -0.01% in 9M18
 VOLUME TREND              Total          o/w retail           Customer
                         loans **         mortgages           deposits***
 Volume                    7bn               3bn                  6bn                Volume trend
                                                                                     ▪ Total customer loans rose by 2% q-o-q and by 8% y-o-y, among
 Growth q-o-q*             +2%               +2%                  +2%
                                                                                       other things due to the continuously increasing mortgage
 Growth y-o-y              +8%              +12%                 +11%                  portfolio and corporate portfolio
                                                                                     ▪ Total customer deposits increased by 2% q-o-q and by 11%
* Non-annualised ** Loans to customers, excluding reverse repos (and bonds)            y-o-y (both due mainly to retail)
*** Customer deposits, including debt certificates but excluding repos

                                                                                32
International Markets BU - Hungary
                                                                                   Net result of 51m EUR
                           NET RESULT                  Amounts in m EUR

                                                        62

                                                                  51
                                                                                   Highlights (q-o-q results)
                  47                                                               ▪ Higher net interest income excluding FX effect (despite margin
                           40        39
                                             34
                                                                                     pressure)
                                                                                   ▪ Higher net fee and commission income excluding FX effect due
          20                                                                         mainly to higher fees from payment transactions
                                                                                   ▪ Lower net results from financial instruments due mainly to
                                                                                     lower M2M ALM derivatives and dealing room result (as a result
                                                                                     of low market and FX volatility)
        1Q17     2Q17     3Q17     4Q17     1Q18       2Q18      3Q18
                                                                                   ▪ Lower net other income as 2Q18 benefited from a 5m gain on
                                                                                     the sale of retail government bonds
                                                                                   ▪ Good non-life commercial performance y-o-y in all major
                                                                                     product lines and growing average tariff in motor retail;
                                                                                     excellent combined ratio (90% in 9M18); higher sales of life
                                                                                     insurance products q-o-q
                                                                                   ▪ Higher operating expenses excluding FX effect
  VOLUME TREND              Total         o/w retail           Customer
                                                                                   ▪ Net impairment releases on loans (in retail). Credit cost ratio of
  Excl. FX effect         loans **        mortgages           deposits***
                                                                                     -0.21% in 9M18. Impairment of 1m EUR on ‘other’, mainly on a
  Volume                    4bn              2bn                 7bn                 legacy property file
  Growth q-o-q*             +3%              +2%                 -1%
  Growth y-o-y             +10%              +4%                 +5%               Volume trend
                                                                                   ▪ Total customer loans rose by 3% q-o-q and by 10% y-o-y, the
* Non-annualised ** Loans to customers, excluding reverse repos (and bonds)          latter due mainly to corporates and SMEs
*** Customer deposits, including debt certificates but excluding repos
                                                                                   ▪ Total customer deposits -1% q-o-q (due mainly to corporates)
                                                                              33     and +5% y-o-y (due mainly to retail)
International Markets BU - Ireland
                                                                                            Net result of 32m EUR

                     99        NET RESULT                    Amounts in m EUR
                                                                                            Highlights (q-o-q results)
                                                                                            ▪ Higher net interest income due mainly to lower funding costs
           67                                                                                 (despite margin pressure)
                                                  57        55                              ▪ Higher expenses excluding bank tax, due mainly to higher staff,
                                                                                              professional fee expenses and 3m EUR one-off costs related to
                                                                     32
                                                                                              the sale of part of the legacy loan portfolio in Ireland
                                                                                            ▪ Lower net impairment releases (-15m EUR in 3Q18, -38m EUR
                                        3                                                     in 2Q18). Releases in 3Q18 were driven by an increase in the
                              -1                                                              9-month average House Price Index, an improved portfolio
          1Q17      2Q17     3Q17      4Q17      1Q18      2Q18     3Q18                      performance and lower provisions on existing non-performing
                                                                                              loans (improved macro-economic conditions and provision
                                                                                              releases following deleveraging for corporates). Credit cost
                                                                                              ratio of -1.03% in 9M18
                                                                                            ▪ Looking forward, we are maintaining our impairment guidance
                                                                                              for Ireland, namely a net release in a range of 100m-150m EUR
                                                                                              for FY18
  VOLUME TREND               Total            o/w retail           Customer
                           loans **           mortgages           deposits***               Volume trend
                                                                                            ▪ Total customer loans stabilised q-o-q and fell by 1% y-o-y. The
  Volume                     11bn               10bn                 5bn
                                                                                              y-o-y decrease resulted from further deleveraging of the
  Growth q-o-q*               0%                 0%                  -8%                      corporate loan portfolio
  Growth y-o-y                -1%                +1%                 -5%                    ▪ Retail mortgages: new business (written from 1 Jan 2014) +6%
                                                                                              q-o-q and +35% y-o-y, while legacy -1% q-o-q and -7% y-o-y
* Non-annualised                                                                            ▪ Total customer deposits -8% q-o-q and -5% y-o-y as expensive
** Loans to customers, excluding reverse repos (and bonds). Note that the Irish
    portfolio for which a sales agreement has been signed, is still included in 3Q18
                                                                                              corporate deposits were deliberately replaced by intragroup
*** Customer deposits, including debt certificates but excluding repos                        funding
                                                                                       34
International Markets BU - Bulgaria
                                                                                             Net result of 31m EUR
                                  NET RESULT                         Amounts in m EUR
                                                                                 31          Highlights (q-o-q results)
                                                                   26                        ▪ Banking (CIBank & UBB/Interlease): higher net result
                                  22                    21                                     ▪ Higher net interest income (despite margin pressure)
                                             18                                                ▪ Lower net fee and commission income due mainly to higher
                                                                                                  insurance distribution expenses (due to higher sales), partly
                                                                                                  offset by higher asset management fees
             4          5                                                                      ▪ Stable net results from financial instruments
                                                                                               ▪ Stable operating expenses as higher staff expenses were
           1Q17       2Q17       3Q17       4Q17       1Q18       2Q18       3Q18                 offset by lower ICT expenses and no additional bank tax
                                                                                               ▪ Net impairments releases on loans. Credit ratio of -0.57% in
                                                                                                  9M18. Impairment of 1m EUR on ‘other’, mainly on a legacy
                                                                                                  property file
                                                                                             ▪ Insurance (DZI): higher net result
                                                                                               ▪ Strong non-life commercial performance y-o-y in motor retail
                                                                                                  (both strong volume growth and growing average tariff);
  VOLUME TREND                   Total             o/w retail             Customer                excellent combined ratio at 87% in 9M18
  Excl. FX effect              loans **            mortgages             deposits***           ▪ Stable life insurance sales
  Volume                          3bn                  1bn                       4bn
  Growth q-o-q*                   +1%                  0%                        0%          Volume trend:
  Growth y-o-y                    +4%                 +3%                        0%          ▪ Total customer loans +1% q-o-q and +4% y-o-y, the latter
                                                                                               partially due to the increasing mortgage portfolio
*    Non-annualised ** Loans to customers, excluding reverse repos (and bonds)               ▪ Total loans: new business +2% q-o-q and +8% y-o-y, while legacy
*** Customer deposits, including debt certificates but excluding repos
                                                                                               -4% q-o-q and -24% y-o-y
                                                                                             ▪ Total customer deposits stabilised both q-o-q and y-o-y
                                                                                        35
Group Centre

                                      NET RESULT           Amounts in m EUR               Net result of -17m EUR
         33                                                                               The net result for the Group Centre comprises the results
                    12                                                                    coming from activities and/or decisions specifically made
                                                     5
                                                                                          for group purposes (see table below for components)
                                -12                                   -17

                                                                                          Highlights (q-o-q results)
                                                            -53
                                                                                          Q-o-q improvement was attributable mainly to:
                                             -179                                         ▪ the positive impact from the settlement of a legacy legal file in
        1Q17       2Q17       3Q17           4Q17   1Q18   2Q18      3Q18
                                                                                            3Q18 (+5m EUR in other net income) versus the negative impact
                                                                                            from the settlement of an legacy legal file in 2Q18 (-38m in other
                                                                                            net income)

BREAKDOWN OF NET RESULT AT GROUP CENTRE                                       1Q17        2Q17         3Q17        4Q17        1Q18        2Q18        3Q18
Group item (ongoing business)                                                  -50            0         -31        -157          -17         -63         -27
  Operating expenses of group activities                                       -14          -14         -20         -25          -17         -15         -18
  Capital and treasury management                                              -18           17           5          -5           -4           8           4
    o/w net subordinated debt cost                                              -9            -9          -9         -13          -6          -3          -3
  Holding of participations                                                     -9          -13         -13          18           1           3           -4
    o/w net funding cost of participations                                      -2            0           0           -1          -1          -2          -4
  Group Re                                                                       5            6           5          10           7            6           3
  Other                                                                        -14            5          -9        -154          -3          -64         -13
Ongoing results of divestments and companies in run-down                        83           11          19         -22          23           10          10
Total                                                                          33           12          -12        -179           5         -53         -17
        Amounts in m EUR                                                             36
Overview of contribution of business units to 9M18 result
                                                                                                                                   Amounts in m EUR
                                                             NET PROFIT – KBC GROUP
                                                                                           9M18 ROAC: 24%
                                                                 2,639                  2,575
                                                                          2,427
                                                                                        462
                                                                 863                               1,948
                                                                          685
                                                         1,762
                                                         473
                                                                                        2,113
                                                                 1,776    1,742
                                                         1,289

                                                         2014    2015     2016          2017       9M18

                                                                         4Q        9M

        NET PROFIT – BELGIUM                             NET PROFIT – CZECH REPUBLIC                             NET PROFIT – INTERNATIONAL MARKETS
                                        9M18 ROAC: 22%                                          9M18 ROAC: 38%                                 9M18 ROAC: 27%
1,516     1,564                     1,575                                                702
                       1,432
                                    335                                    596          168
          348                                                     542                                                                          444    440
414                                                       528                                                                       428
                       439                  1,089                         131                       484                                        74
                                                          121     119
                                                                                                                                    139
                                                                                                                            245
          1,216                     1,240                                               534                                 61
1,102                  993                                                465                                                                  370
                                                          408     423                                                               289
                                                                                                                            184
                                                                                                                      -7
2014      2015         2016         2017    9M18         2014    2015     2016          2017       9M18
                                                                                                                     -175
                  4Q           9M                                        4Q        9M
                                                                                                                     -182
                                                                                                                     2014   2015   2016      2017     9M18

                                                                                                                                   4Q     9M

                                                                              37
Balance sheet:
                     Loans and deposits continue to grow in most core countries
                                                                                                                                                                   12%
                                                                                                                                                                              11%
                                                                                                                              BE                      8%

                                                                                                                  6%
                                                                                                                               2%         2%

        Y-O-Y ORGANIC* VOLUME GROWTH                                                                        Loans**          Retail   Deposits***   Loans**       Retail Deposits***
                                                                                                                            mortgages                            mortgages

                                                                                                            CR                  8%         8%
                5%
                                                                                                                   4%                                      4%
                                                                                                                                                                         3%

                                         3%                       3%                                                                                                                0%
                                                                                                              Loans**          Retail Deposits***      Loans**        Retail  Deposits***
                       4%                                                                                                     mortgages                           mortgages****

                                                                                                                   10%
            Loans**                 Retail                Deposits***
                                   mortgages                                                                                               5%
                                                                                                                                 4%
                                                                                                                                                                         1%

                                                                                                                                                           -1%
                                                                                                                  Loans**      Retail Deposits***
                                                                                                                                                                                    -5%
*       Volume growth excluding FX effects and divestments/acquisitions                                                       mortgages
**      Loans to customers, excluding reverse repos (and bonds)                                                                                        Loans**         Retail  Deposits***
***     Customer deposits, including debt certificates but excluding repos                                                                                        mortgages*****
****    Retail mortgages in Bulgaria: new business (written from 1 Jan 2014) +8% y-o-y, while legacy -24% y-o-y          38
*****   Retail mortgages in Ireland: new business (written from 1 Jan 2014) +35% y-o-y, while legacy -7% y-o-y
KBC Group

Section 3

Strong solvency and
solid liquidity

                39
Strong capital position
Fully loaded Basel 3 CET1 ratio at KBC Group (Danish Compromise)                                      ▪ The common equity ratio* increased from
                                                                                                        15.8% at the end of 1H18 to 16.0% at the end
  15.7% 15.7% 15.9% 16.3% 15.9% 15.8% 16.0%
                                                                                                        of 9M18 based on the Danish Compromise.
                                                               14.0% ‘Own Capital Target’               This clearly exceeds the minimum capital
                                                                                                        requirements** set by the competent
                                                              10.6% fully loaded regulatory minimum
                                                                                                        supervisors of 9.875% phased-in for 2018 and
                                                                                                        10.6% fully loaded and our ‘Own Capital
                                                                                                        Target’ of 14.0%

                                                                                                        *  Note that 1 January 2018, there is no longer a difference between
   1Q17   1H17    9M17      FY17    1Q18     1H18     9M18                                                 fully loaded and phased-in
                                                                                                        ** Excludes a pillar 2 guidance (P2G) of 1.0% CET1

Fully loaded Basel 3 total capital ratio (Danish Compromise)
                               20.8%            20.9%
              19.7%                             2.3% T2
                               2.4% T2
              2.3% T2
                              2.6% AT1         2.6% AT1
             1.5% AT1
                                                                                                      ▪ The fully loaded total capital ratio amounted
                                                                                                        to 20.9% at the end of 9M18

            15.9% CET1       15.8% CET1       16.0%CET1

             1Q18 total       1H18 total      9M18 total
            capital ratio    capital ratio    capital ratio                               40
Fully loaded Basel 3 leverage ratio and Solvency II ratio
           Fully loaded Basel 3 leverage ratio at KBC Group                                                  Fully loaded Basel 3 leverage ratio at KBC Bank
                                             6.1%                6.0%      6.1%
              5.7%       5.7%      5.8%                5.7%
                                                                                                                                               5.0%                5.1%      5.2%
                                                                                                                4.8%      4.7%       4.7%                4.7%

               1Q17      1H17     9M17       FY17      1Q18      1H18      9M18                                 1Q17       1H17     9M17       FY17      1Q18      1H18      9M18

                                   Solvency II ratio

                                                                         2Q18            9M18                   ▪ The decrease (-3%-point) in the Solvency II ratio
                                                                                                                  was mainly the result of an increase in spreads and
Solvency II ratio*                                                       219%            216%                     net purchases in the equity portfolio

    * On 19 April 2017, the NBB retroactively relaxed the strict cap on the loss-absorbing capacity of deferred taxes in the calculation of the required capital. Belgian insurance
    companies are now allowed to apply a higher adjustment for deferred taxes, in line with general European standards, if they pass the recoverability test. This is the case for KBC
                                                                                                 41
Strong and growing customer funding base
▪ KBC Bank continues to have a strong retail/mid-cap deposit base in its core markets – resulting in a stable funding mix
  with a significant portion of the funding attracted from core customer segments & markets
▪ Customer funding further increased in 9M18 (versus FY17). The elevated amount in short-term wholesale funding is
  mainly on the back of short-term arbitrage opportunities
                                                                                                                                        Funding from customers (m EUR)
                                                                                                                                                                     155.774   163.513
                                                                                                                                       133.766   139.560   143.690
                                                                                                         129.555   131.914   132.862

                                                                                       10%    12%
   3%              6%               3%     2%       4%           5%              8%
                           0%                             2%              2%           7%
   9%                              10%                                                        7%
                   8%                               8%           8%              8%
   7%                                                                                  9%     9%
                   9%               8%              9%           8%              8%
   9%                               2%                                                        7%         FY11      FY12      FY13       FY14     FY15      FY16      FY17      9M18
                   3%                               3%           3%                    10%
   3%                                                                            8%

                                                                                                                                       0% 7%

                                                                                                                             21%
                                   75%
                                                                                                       72%
   69%             73%                             73%          73%                    70%    72%
                                                                                 69%                 customer
                                                                                                      driven

                                                                                                                                                             73%

                                                                                 -1%          -6%
                                                                                       -6%
  FY11            FY12            FY13             FY14         FY15            FY16   FY17   9M18                                  Retail and SME
                                                                                                                                    Mid-cap
        Net unsecured interbank funding                    Total equity
                                                                                                                                    Debt issues in retail network
        Net secured funding                                Certificates of deposit
                                                                                                                                    Government and PSE
        Debt issues placed with institutional investors    Funding from customers

                                                                                        42
Liquidity ratios remain very solid
  Short term unsecured funding KBC Bank vs liquid assets as of end June 2018 (*)
                                 (bn EUR)
  486%
                                65,39
                                                  57,79                58,83
             56,23                                                                          56,85
                                                            387%                                         ▪ KBC maintains a solid liquidity position, given that:
                                                                                                           • Available liquid assets remained very high at more than
                                                                                   316%                      3 times the amount of the net short-term wholesale
                                         309%
                      288%
                                                                                                             funding
                        22,70                                                                              • Funding from non-wholesale markets is stable funding
                                          18,71                                     18,01                    from core-customer segments in core markets
                                                             15,19
    11,56

        3Q17                 4Q17              1Q18                  2Q18               3Q18
            Net Short Term Funding         Available Liquid Assets             Liquid Assets Coverage

* Graph is based on Note 18 of KBC’s quarterly report, except for the ‘available liquid assets’ and
   ‘liquid assets coverage’, which are based on the KBC Group Treasury Management Report

               Ratios                   FY17                9M18                  Regulatory             ▪ NSFR at 134% and LCR at 138% by the end of 9M18
                                                                                 requirement               • Both ratios were well above the regulatory requirement of
               NSFR*                    134%                134%                     ≥100%                   at least 100%

                LCR**                   139%                138%                     ≥100%

   *  Net Stable Funding Ratio (NSFR) is based on KBC’s interpretation of the proposed CRR
      amendment
   ** Liquidity Coverage Ratio (LCR) is based on the Delegated Act requirements. From EOY2017
      onwards, KBC discloses 12 months average LCR in accordance to EBA guidelines on LCR
      disclosure

                                                                                                    43
KBC Group

Section 4

Looking forward

                  44
Looking forward

           ➢ European economic conditions remain attractive, although we believe that the growth peak
             is behind us. Persistently decreasing unemployment rates, with even growing labour
             shortages in some European economies, combined with gradually rising wage inflation will
Economic     continue to support private consumption. Moreover, also investments will remain an
outlook      important growth driver. The main elements that could impede European economic
             sentiment and growth remain the risk of further economic de-globalisation, including an
             escalation of trade conflicts, the Brexit and political turmoil in Italy

           ➢ Solid returns for all Business Units
           ➢ Loan impairments for Ireland towards a release in 100m-150m EUR range for FY18
           ➢ Impact of the reform of the Belgian corporate income tax regime: recurring positive P&L
Group        impact as of 2018 onwards and one-off negative impact in 4Q17 will be fully recuperated in
guidance     roughly 3 years’ time
           ➢ B4 impact for KBC Group estimated at roughly 8bn EUR higher RWA on fully loaded basis at
             year-end 2017, corresponding with 9% RWA inflation and -1.3% points impact on CET1 ratio

           ➢ Next to the Belgium and Czech Republic Business Units, the International Markets Business
             Unit has become a strong net result contributor, thanks to:
Business       ➢ Ireland: re-positioning as a core country with a sustainable profit contribution
units          ➢ Bulgaria: merger of CIBank into UBB. The new group UBB has become the largest
                   bank-insurance group in Bulgaria with a substantial increase in profit contribution
               ➢ Sustainable profit contribution of Hungary and Slovakia

                                           45
KBC Group

Annex 1

Company profile

                  46
KBC Group in a nutshell (1)

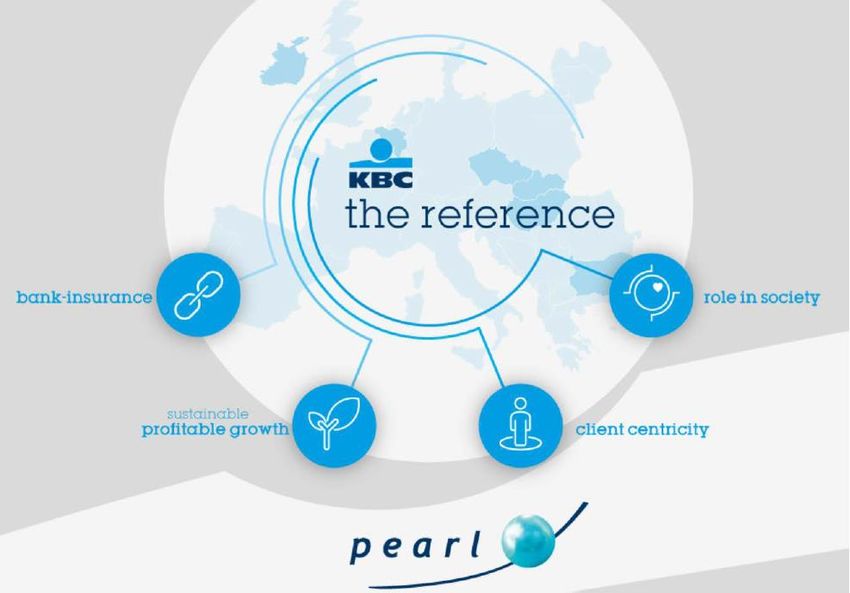
✓ We want to be among Europe’s best performing financial institutions! By achieving this,
   KBC wants to become the reference in bank-insurance in its core markets
   •     We are a leading European financial group with a focus on providing bank-insurance products and services to
         retail, SME and mid-cap clients, in our core countries: Belgium, Czech Republic, Slovakia, Hungary, Bulgaria and
         Ireland.

✓ Diversified and strong business performance
  … geographically
       • Mature markets (BE, CZ, IRL) versus developing markets (SK, HU, BG)
       • Economies of BE & 4 CEE-countries highly oriented towards Germany, while IRL is more oriented to the UK & US
       • Robust market position in all key markets & strong trends in loan and deposit growth

  … and from a business point of view
       • An integrated bank-insurer
       • Strongly developed & tailored AM business
       • Strong value creator with good operational
         results through the cycle                         Diversification  Synergy
       • Unique selling proposition: in-depth
         knowledge of local markets and profound
         relationships with clients
       • Integrated model creates cost synergies and results Customer Centricity
         in a complementary & optimised product offering
       • Broadening ‘one-stop shop’ offering to our clients 47
KBC Group in a nutshell (2)

✓ High profitability
                                                                                                                               CET1 generation
     C/I ratio                         Combined ratio      Net result                               ROE                     before any deployment
                                                                                                                        296 bps     277 bps   279 bps
                                                                EUR
            55%                           88%                  2575m         EUR                    17%
                          57%                   88%                         1948m                             17%
                                                                                                                            2015     2016      2017
     FY17
            9M18

✓ Solid capital position…                                                                           ✓ … and robust liquidity positions
  Fully loaded Basel 3 CET1 ratio of KBC Group (Danish Compromise)
   15.7%      15.7%    15.9%     16.3%    15.9%   15.8%    16.0%                                              NSFR                 LCR
                                                                       14.0% ‘Own Capital Target’

                                                                       10.6% regulatory minimum                                     139%
                                                                                                              134%
                                                                                                                     134%                     138%

    1Q17           1H17         9M17     FY17   1Q18    1H18    9M18                                   FY17
                                                                                                              9M18

                                                                       48
KBC Group in a nutshell (3)

✓ We aim to be one of the better capitalised financial institutions in Europe
  • Every year, we assess the CET1 ratios of a peer
                                                                  Flexible buffer for M&A   2.0%
    group of European banks active in the retail, SME
    and corporate client segments. We position
    ourselves on the fully loaded median CET1 ratio of
    the peer group (14% at end of 2017)                                                                ‘Reference Capital
                                                                     Own capital target                     Position’
  • We want to keep a flexible buffer of up to 2% CET1
                                                                            =               14.0%           = 16.0%
    for potential add-on M&A in our core markets                      Median CET1
  • This buffer comes on top of our ‘Own Capital                       Peers (FL)
    Target’ and together they form the ‘Reference
    Capital Position’
  • Any M&A opportunity will be assessed subject to
    very strict financial and strategic criteria
                                                                                            2017

✓ Capital distribution to shareholders
  •   Payout ratio policy (i.e. dividend + AT1 coupon) of at least 50% of consolidated profit
  •   Interim dividend of 1 EUR per share in November of each accounting year as an advance on the total dividend
  •   On top of the payout ratio of 50% of consolidated profit, each year, the Board of Directors will take a decision,
      at its discretion, on the distribution of the capital above the ‘Reference Capital Position‘

                                                            49
Well-defined core markets: access to ‘new growth’ in Europe

                                                                                                           Market share
                                                                                                            (end ’17)             BE         CZ       SK        HU         BG     IRL
                                                                                                                                 20%        20%
                                                                                                          Loans and deposits                           11%       11%        10%    8%*
                                   3.5m clients                3.7m clients
                                   627 branches                265 branches                                                      33%
                                   99bn EUR loans              23bn EUR loans                                                               22%                  13%       13%
                                                                                                          Investment funds                             7%
                                   132bn EUR dep.              32bn EUR dep.
           IRELAND
                                                                                          0.6m clients
                                                                                                                                                                           21%
                                                                                          122 branches    Life insurance         14%         8%        4%         3%
                                                                                          7bn EUR loans
                                   BELGIUM
                                                                                          6bn EUR dep.
                                                                                                                                 9%                                        11%
                                                                                                          Non-life insurance                 7%                   7%
                                                                    CZECH REP                                                                          3%
  0.3m clients                                                              SLOVAKIA
  18 branches
  11bn EUR loans                                                             HUNGARY                         Real GDP
  5bn EUR dep.                                                                                                growth             BE          CZ        SK       HU         BG     IRL
                                                    1.6m clients                                                               64%
                                                    206 branches
                                                                                                          % of Assets                      20%
                                                    4bn EUR loans                                                                                     3%         3%         2%     4%
                                                    7bn EUR dep.
                                                                                                                                                                                  7.0%
                                                                                          BULGARIA                                        3.0%       3.6%       4.2%       3.5%
                                                                                                          2018e                1.5%

                                                                         1.2m clients                                                     2.7%       3.7%       3.4%       3.4%   3.5%
                                                                                                                               1.4%
                                                                         224 branches                     2019e
                                                                         3bn EUR loans
                        Internat
Belgium      Czech
                        ional                                            4bn EUR dep.                                                                3.5%      2.6%        3.3%   3.0%
             Republic                                                                                                                     2.3%
Business
             Business
                        Markets                                                                                                1.2%
Unit                    Business
             Unit                                                                                         2020e
                        Unit

                                                                                                                                      GDP growth: KBC data, November ‘18
                                                                                     50
                                                                                                                                      * Retail segment
Business profile

               BREAKDOWN OF ALLOCATED CAPITAL BY BUSINESS UNIT AS AT 30 SEPTEMBER 2018

                                                                        Czech Republic
                                                                  16%

                               Belgium 61%

                                                                   21%
                                                                          International Markets

                                                             2%
                                                              Group Centre

▪ KBC is a leading player (retail and SME bank-insurance, private banking, commercial and local investment
  banking) in Belgium, the Czech Republic and its 4 core countries in the International Markets Business Unit

                                                        51
Shareholder structure

                                      SHAREHOLDER STRUCTURE AT END 9M18

                                                           Other core
                                              MRBB
                                                         7.4%
                                       Cera      11.5%
                                              2.7%

                            KBC Ancora 18.6%

                                                                 59.8%
                                                                         Free float

▪ Roughly 40% of KBC shares are owned by a syndicate of core shareholders, providing continuity to pursue long-term
  strategic goals. Committed shareholders include the Cera/KBC Ancora Group (co-operative investment company),
  the Belgian farmers’ association (MRBB) and a group of industrialist families
▪ The free float is held mainly by a large variety of international institutional investors

                                                           52
KBC Group going forward:
Aiming to be among the best performing financial institutions in Europe

                                            ▪   KBC wants to be among Europe’s best
                                                performing financial institutions. This will
                                                be achieved by:
                                                -   Strengthening our bank-insurance
                                                    business model for retail, SME and mid-
                                                    cap clients in our core markets, in a
                                                    highly cost-efficient way
                                                -   Focusing on sustainable and profitable
                                                    growth within the framework of solid risk,
                                                    capital and liquidity management

                                                -   Creating superior client satisfaction via a
                                                    seamless, multi-channel, client-centric
                                                    distribution approach
                                            ▪   By achieving this, KBC wants to become
                                                the reference in bank-insurance in its
                                                core markets

                                  53
KBC Group going forward:
 The bank-insurance business model, different countries, different
 stages of implementation

    Level 4: Integrated distribution and operation
Acting as a single operational company: bank and insurance operations           Belgium
working under unified governance and achieving commercial and non-
                          commercial synergies

              Level 3: Integrated distribution
       Acting as a single commercial company: bank and insurance
                                                                          Target for Central
       operations working under unified governance and achieving               Europe
                           commercial synergies

               Level 2: Exclusive distribution                          KBC targets to reach at
          Bank branches selling insurance products from intra-
                                                                        least level 3 in every
                     group insurance company as                         country, adapted to the
                   additional source of fee income
                                                                        local market structure and
                                                                        KBC’s market position in
                    Level 1: Non-exclusive
                         distribution
                                                                        banking and insurance
                    Bank branches selling insurance
                   products of third party insurers as
                    additional source of fee income

                                                                 54
More of the same…                     but differently…

•   Integrated distribution model     •   Client-centricity will be further      •   Investment in our digital
    according to a real-time              fine-tuned into ‘think client, but         presence (e.g., social media) to
    omni-channel approach                 design for a digital world’                enhance client relationships and
    remains key but client                                                           anticipate their needs
    interaction will change over      •   Digitalisation end-to-end, front-
    time. Technological                   and back-end, is the main lever:       •   Easy-to-access and convenient-
    development will be the                 • All processes digital                  to-use set-up for our clients
    driving force                           • Execution is the
                                                 differentiator                  •   Clients will drive the pace of
•   Human interface will still play                                                  action and change
    a crucial role                    •   Further increase efficiency and
                                          effectiveness of data management       •   Further development of a fast,
                                                                                     simple and agile organisation
•   Simplification is a               •   Set up an open architecture IT             structure
    prerequisite:                         package as core banking system for
      • In the way we operate             our International Markets Unit         •   Different speed and maturity in
      • Is a continuous effort                                                       different entities/core markets
      • Is part of our DNA            •   Improve the applications we offer
                                          our clients (one-stop-shop offering)   •   Adaptation to a more open
                                          via co-creation/partnerships with          architecture (with easy plug in
                                          Fintechs and other value chain             and out) to be future-proof and
                                          players                                    to create synergy for all

                                                            55
KBC the reference…
Group financial guidance (Investor Visit 2017)

         Guidance
         CAGR total income (‘16-’20)*                                        ≥ 2.25%   by 2020
         C/I ratio banking excluding bank tax                                ≤ 47%     by 2020
         C/I ratio banking including bank tax                                ≤ 54%     by 2020
         Combined ratio                                                      ≤ 94%     by 2020
         Dividend payout ratio                                               ≥ 50%     as of now

           * Excluding marked-to-market valuations of ALM derivatives

           Regulatory requirements
           Common equity ratio* excluding P2G                            ≥ 10.6%       by 2019
           Common equity ratio* including P2G                            ≥ 11.6%       by 2019
           MREL ratio                                                    ≥ 25.9%       by May ‘19
           NSFR                                                          ≥ 100%        as of now
           LCR                                                           ≥ 100%        as of now
 * Fully loaded, Danish Compromise. P2G = Pillar 2 guidance.

                                                                        56
KBC the reference…
   Group non-financial guidance (Investor Visit 2017)

Non-financial guidance:                                                           Non-financial guidance:
CAGR Bank-Insurance clients                                                       CAGR Bank-Insurance stable clients
(1 bank product + 1 insurance product)                                            (3 bk + 3 ins products in Belgium;
                                                                                   2 bk + 2 ins products in CEE)
BE BU         > 2%     by 2020                                                    BE BU                    > 2%    by 2020

CR BU         > 15%    by 2020                                                    CR BU                    > 15%   by 2020

IM BU         > 10%    by 2020                                                    IM BU                    > 15%   by 2020

                             Non-financial guidance:
                             % Inbound contacts via omni-channel and
                             digital channel*
                             KBC Group**                  > 80%          by 2020

                         •  Clients interacting with KBC through at least one of the non-physical
                            channels (digital or through a remote advisory centre), possibly in addition
                            to contact through physical branches. This means that clients solely
                            interacting with KBC through physical branches (or ATMs) are excluded
                         ** Bulgaria & PSB out of scope for Group target

                                                                   57
Digital Investments 2017-2020
                                  Cashflow 2017-2020 = 1.5bn EUR                                                                    Operating Expenses 2017-2020 = 1bn EUR

 Regulatory driven                                                               Organic growth
developments (IFRS                                                               or operational
                                                                                                                                                                        48              55
 9, CRS(*), MIFID,                 Regulatory                                      efficiencies                               43                   44
       etc.)                          20%                      Strategic
                                                                                                                                                   78                   83              90
                                                                Growth                                                        94
                                                                 36%

                            Strategic Transformation                                                                          112                 125                  127              128
                                      44%

                                                                                                                            2017                  2018                2019              2020
                              Omni-channel                                                                            Strategic Grow                  Strategic Transform                Regulatory
                            and core-banking
                                 system

    (*) The Common Reporting Standard (CRS) refers to a systematic and periodic exchange of information at international level aimed at preventing tax evasion. Information on the
    taxpayer in the country where the revenue was taken is exchanged with the country where the taxpayer has to pay tax. It concerns an exchange of information between as many as 53
    OECD countries in the first year (2017). By 2018, another 34 countries will join.
                                                                                                        58
Digital sales are increasing (examples: Belgium BU)
# of files                                                        # of files
 35.000                                                            3.000
30.000                                                             2.500
25.000
                                                                   2.000
20.000
                                                                   1.500
15.000
                                                                   1.000
10.000
  5.000                                                              500

       0                                                                0
             Q1   Q2          Q3       Q4        Q1   Q2     Q3                Q1   Q2          Q3           Q4         Q1   Q2     Q3
                       2017                           2018                               2017                                2018

                               Consumer loans                                                        Travel insurance

# of files                                                        # of files
 12.000                                                            60.000

10.000                                                             50.000

  8.000                                                            40.000

  6.000                                                            30.000

  4.000                                                            20.000

  2.000                                                            10.000

       0                                                                   0
             Q1   Q2          Q3       Q4        Q1   Q2     Q3                Q1   Q2          Q3            Q4        Q1    Q2    Q3
                       2017                           2018                               2017                                2018

                               Pension savings                                                       Current accounts

                                                                   59
You can also read