2021 EU-WIDE STRESS TEST - RESULTS 30 July 2021 - European Banking Authority
←
→
Page content transcription
If your browser does not render page correctly, please read the page content below

2021 EU-WIDE STRESS TEST
RESULTS

30 July 2021

2021 EU‐WIDE STRESS TEST – RESULTS

Contents
List of figures, tables and boxes                                   3
1.    Executive Summary                                             9
2.    Key aspects of the 2021 EU-wide stress test                  12
2.1    General aspects                                             12
2.2    COVID-19 support measures in the 2021 EU-wide stress test   13
3.    Impact of the stress test on capital ratios                  17
3.1    Impact on CET1 capital ratios                               17
3.2    Impact on leverage ratio                                    23
4.    Main drivers of the impact                                   24
4.1    Impact on profitability                                     25
       4.1.1     Net Interest Income                               27

       4.1.2     Credit risk losses                                31

       4.1.3     Market risk losses, including CCR and CVA         39

       4.1.4     Conduct risk and other operational risk           43

       4.1.5     Non-interest income and expenses                  45

4.2    Impact on risk exposure amount                              48
5.    Capital measures between January 2021 and March 2021         50
6.    Conclusions                                                  51
7.    Annex I: Capital ratios for individual banks                 52

                                                                    2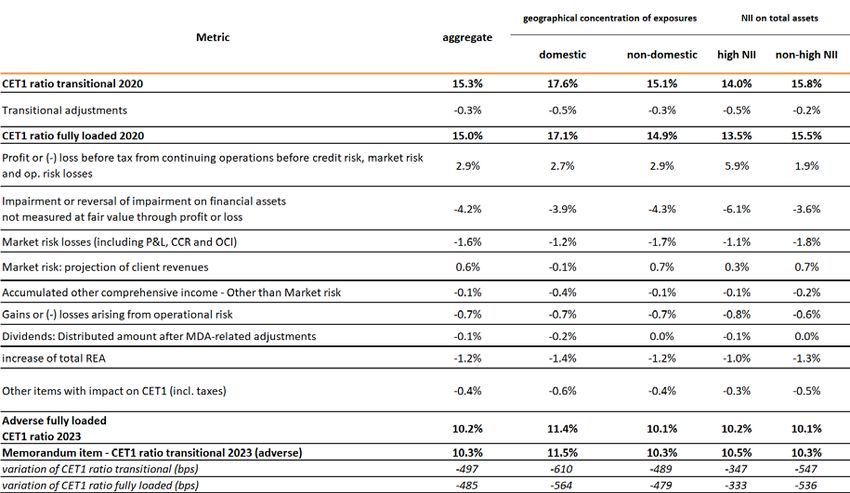
2021 EU‐WIDE STRESS TEST – RESULTS

List of figures, tables and boxes
Table 1: Summary of the key metrics and results of the exercise ................................................... 10

Box 1: COVID-19 supporting measures in the stress test exercise .................................................. 14

Table 2: Exposures under moratoria and under PGS: descriptive statistics (year 2020, actual data,
% of exposures) ................................................................................................................................ 15

Figure 1: Exposures under moratoria (in aggregate and non -expired) (1) and under PGS (2): (year
2020, % of total exposures, per country of the bank, sorted by % on total exposures).................. 16

Table 3: Exposures under moratoria and under PGS: analysis per cluster (year 2020, % of
exposures per cluster) ...................................................................................................................... 16

Figure 2: Evolution of transitional CET1 capital ratio (%) (1) and change from 2020 (bps) (2) ....... 18

Figure 3: Evolution of fully loaded CET1 capital ratio (%) (1) and change from 2020 (bps) (2) ....... 18

Figure 4: Impact on CET1 capital ratio (depletion) from 2020 to 2023 under the adverse scenario
by cluster of banks (bps) .................................................................................................................. 19

Figure 5: Comparison of aggregate transitional and fully loaded CET1 capital ratio by jurisdiction
in alphabetical order (%) .................................................................................................................. 20

Figure 6: CET1 capital ratio by bank in alphabetical order at the starting point and as of end-2023
under the adverse scenario (%) ....................................................................................................... 21

Figure 7: Impact on CET1 capital ratio from 2020 to 2023 under the adverse scenario by bank, in
alphabetical order (bps) ................................................................................................................... 22

Figure 8: Evolution of transitional aggregate leverage ratio (%) (1) and its dispersion – 5th and
95th percentiles, interquartile range and median in 2020 and in the adverse scenario (%) (2) ..... 23

Figure 9: Contribution of main drivers to the change in CET1 capital ratio from 2020 to 2023 in the
adverse scenario (waterfall) ............................................................................................................. 24

Table 4: Contribution of main drivers to the change in CET1 capital ratio from 2020 to 2023 in the
adverse scenario (waterfall) per cluster of banks ............................................................................ 25

Table 5: Evolution of EU aggregate profit and loss account (selected items) in the adverse scenario
(EUR bn) ........................................................................................................................................... 26

Figure 10: Cumulative CET1 ratio impact of the main sources of income over 2020-23 adverse,
compared to the hypothetical unstressed contribution (% of REA) ................................................ 27

Figure 11: Evolution of aggregate NII (EUR bn) ............................................................................... 28

Figure 12: Cumulative contribution of the NII generated by each balance sheet item to capital, in
percentage points of REA ................................................................................................................. 29

                                                                                                                                                     3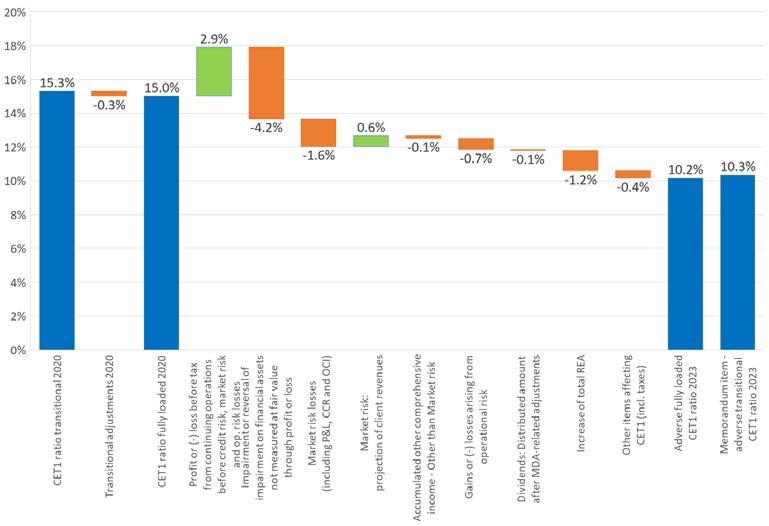
2021 EU‐WIDE STRESS TEST – RESULTS

Figure 13: Contribution of NII to CET1 capital ratio under adverse scenario, 5th and 95th
percentiles, interquartile range and median in 2020 and in the adverse scenario (%) (1) Dispersion
of the contribution to CET1 capital ratio of cumulative net interest income as of end 2023 under
the adverse scenario by banks in the sample (2) ............................................................................. 30

Figure 14: Contribution to capital of cumulative interest income from NPEs as of end 2023 under
the adverse scenario and proportion of Stage 3 exposures over total............................................ 31

Figure 15: Evolution of absolute credit losses (EUR bn) ................................................................. 32

Figure 16: Share of total credit risk exposures (1) share of 2021-2023 cumulative credit risk losses
(2) and cumulative credit losses as a percentage of 2020 exposures (3) in the adverse scenario for
selected countries of the counterparty (%) ..................................................................................... 33

Figure 17: Contribution to cumulative 2023 credit losses in the adverse scenario – by regulatory
exposure class (%) – Total (1), IRB (2), STA (3) ................................................................................. 33

Figure 18: Cumulative credit losses as a percentage of 2020 exposure in the adverse scenario by
regulatory exposure class: IRB (1) and STA (2) (%) .......................................................................... 34

Table 6: Decay rate (cumulative increase of S3 / performing asset at the beginning of the period) –
Total (1), clusters of banks based on exposures towards “affected sectors” (2) (%, adverse
scenario) ........................................................................................................................................... 34

Figure 19: Share of exposures per stage (%) (1) and coverage ratio per stage (2) – Evolution over
the projection horizon in the adverse scenario ............................................................................... 35

Figure 20: Coverage of stage 3 exposures as a percentage of end 2023 adverse scenario – Total,
for selected countries of the counterparty (1) and by regulatory exposure class: IRB (2) STA(3) (%)
.......................................................................................................................................................... 36

Figure 21: NPL calendar: defaulted exposure subject to calendar provisioning (% on total
exposures) (1) and impact on CET1 (bps) (2) – Evolution over the projection horizon in the adverse
scenario ............................................................................................................................................ 36

Box 2: COVID-19 supporting measures: evolution over the projection horizon and impact on CET1
capital ratio. ..................................................................................................................................... 37

Figure 22: Composition per stages of exposure under moratoria (1) and under PGS (2) (% on total
exposures under moratoria or under PGS) ...................................................................................... 37

Figure 23: Exposures under moratoria, projected losses: breakdown per stages (% coverage, (lhs)
and impact on CET 1 (bps) (rhs) ....................................................................................................... 38

Figure 24: a) Contribution of different market risk components to market risk losses under the
adverse scenario in 2021 (bps) (1) and distribution among the sample (10th, 25th, 50th, 75th , 90th
percentiles) of the 3-year cumulative market risk impact in the adverse scenario (bps) (2) ......... 40

Figure 25: Impact in CET1 capital ratio in the 2021 adverse scenario of the model uncertainty and
liquidity shock by instrument type and by bank (bps) ..................................................................... 41

Figure 26: Evolution of market risk P&L impact (bps) ...................................................................... 42

                                                                                                                                                           4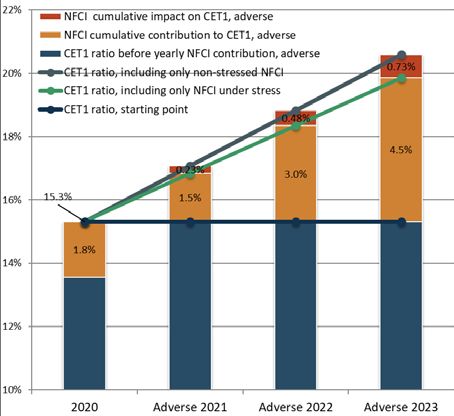
2021 EU‐WIDE STRESS TEST – RESULTS

Box 3: Sovereign exposure ............................................................................................................... 42

Figure 27: Evolution of operational risk losses (EUR bn) (1) and contribution of conduct risk and
other operational risk to cumulative losses in the adverse scenario (%) (2) ................................... 43

Box 4: Comparison between the projected material conduct risk losses and the floor for material
conduct risk losses in the adverse scenario ..................................................................................... 44

Figure 28: Comparison between the projected material conduct risk losses and the floor for
material conduct risk losses under the adverse scenario (EUR bn and bps) ................................... 44

Figure 29: Evolution of NFCI and dividend income (EUR bn) (1), and cumulative impact to CET1
capital ratio of NFCI (2) .................................................................................................................... 45

Box 5: One-off adjustments ............................................................................................................. 46

Figure 30: Evolution of administrative expenses, other operating expenses, other provisions and
depreciation (EUR bn) ...................................................................................................................... 47

Box 6: Maximum Distributable Amount .......................................................................................... 47

Figure 31: Evolution of REA by risk type under the adverse scenario (2020 actual = 100) ............. 48

Figure 32: Evolution of REA for credit risk, per asset class, under the adverse scenario (2020 actual
= 100)................................................................................................................................................ 49

Figure 33: Capital measures taken by the banks during the first quarter of 2021 (EUR bn) ......... 50

Table 7: Transitional CET1 capital ratios (%) and deltas to starting point (bps) .............................. 52

Table 8: Fully loaded CET1 capital ratios (%) and deltas to starting point (bps) .............................. 55

Table 9: Transitional leverage ratios (%) and deltas to starting point (bps) .................................... 58

Table 10: Fully loaded leverage ratio (%) and deltas to starting point (bps) ................................... 61

                                                                                                                                                       5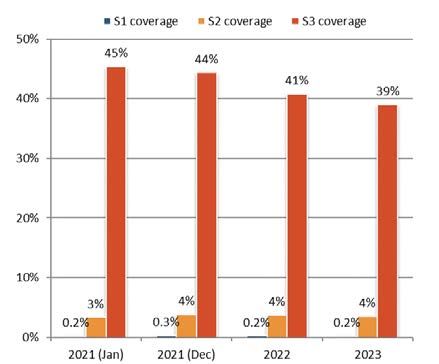
2021 EU‐WIDE STRESS TEST – RESULTS

Abbreviations
 AVA          Additional Valuation Adjustment

 bn           Billion

 bps          Basis points

 CAs          Competent authorities

 CCR          Counterparty credit risk

 CET1         Common equity tier 1

 CRD          Capital requirements directive

 CRR          Capital requirements regulation

 CVA          Credit valuation adjustment

 ECB          European Central Bank

 ECL          Expected credit losses

 EA           Euro Area

 EEA          European Economic Area

 EIR          Effective interest rate

 ESRB         European Systemic Risk Board

 EU           European Union

 FVPL         Fair value through profit and loss

 FVOCI        Fair value through other comprehensive income

 FX           Foreign Exchange

 GDP          Gross domestic product

 HfT          Held with a trading intent

 IFRS 9       International Financial Reporting Standard 9— Financial Instruments

 IRB          Internal ratings-based approach

 L2           Level 2

 L3           Level 3

 LGD          Loss Given Default

 MDA          Maximum distributable amount

                                                                                    6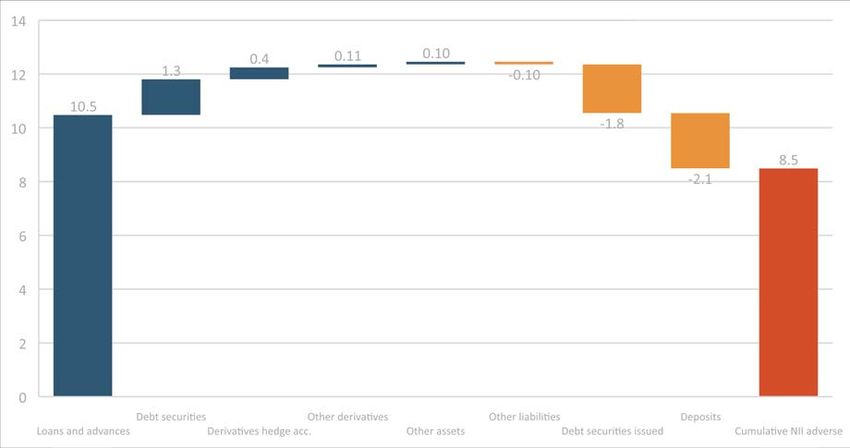
2021 EU‐WIDE STRESS TEST – RESULTS

 N/A          Not applicable

 NFCI         Net fees and commissions income

 NII          Net interest income

 NPEs         Non-performing exposures

 NPLs         Non-performing loans

 NTI          Net trading income

 OCI          Other comprehensive income

 OCR          Overall Capital Requirement

 P2R          Pillar 2 Requirement

 PD           Probability of default

 PGS          Public Guarantee Scheme

 P&L          Profit and loss

 pp           Percentage points

 REA          Risk exposure amount

 SREP         Supervisory review and evaluation process

 SSM          Single Supervisory Mechanism

 STA          Standardised approach

 TSCR         Total SREP Capital Requirement

                                                          7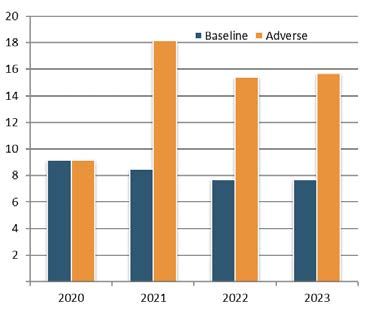
2021 EU‐WIDE STRESS TEST – RESULTS

Disclaimer
This report is provided for analytical and transparency purposes only. The only official results are
those stated in the original PDF files published by the European Banking Authority (EBA), which
were submitted and confirmed by the competent authorities. The cut-off date for the data shown
in this report is 22 July 2021 – 09:00 CET.

                                                                                                  8
2021 EU‐WIDE STRESS TEST – RESULTS
1. Executive Summary
The EU-wide stress test exercise provides supervisors, banks and other market participants with a
common analytical framework to consistently compare and assess the resilience of EU banks to
adverse market developments and shocks. The current exercise was initially planned for 2020 and
launched in January 2020; however, due the COVID-19 outbreak and its global spread since
February, in March 2020 the EBA decided to postpone the EU-wide stress test to 2021 to allow
banks to prioritise operational continuity 1 . The exercise is designed to inform the Supervisory
Review and Evaluation Process (SREP) carried out by Competent Authorities (CAs) and allows to
test the resilience of the EU banking sector amid COVID-19. The EU-wide stress test is a constrained
bottom-up exercise based on a common methodology and relevant scenarios, and a set of
templates that capture starting point data and stress test results.
The common macroeconomic baseline and adverse scenarios used in the exercise cover a three-
year horizon taking the end-2020 data as the starting point. Scenario variables include the evolution
of real gross domestic product (GDP), inflation, unemployment rates, real estate prices, stock
prices, exchange rates and interest rates. The baseline scenario for EU countries is based on the
December 2020 projections from the national central banks and envisages that the GDP in the EU
will increase in the three-year horizon (3.9%, 4.2% and 2.3% as of 2021, 2022 and 2023
respectively). The adverse scenario sets out paths for key economic and financial variables in a
hypothetical adverse situation triggered by the materialisation of risks to which the EU banking
system is exposed. This adverse macro-financial scenario was designed by the Task Force on Stress
Testing of the European Systemic Risk Board (ESRB) in close collaboration with the European
Central Bank (ECB) and draws upon a prolonged COVID-19 scenario in a “lower for longer” interest
rate environment. The adverse scenario envisages that real GDP in the EU will further decline (-
1.5%, -1.9% and –0.2% as of 2021, 2022 and 2023 respectively) with a cumulative deviation of real
GDP growth from its baseline level of -12.9% (-8.3% in the 2018 stress test exercise). Such decrease
in real GDP following the unprecedented decline in 2020 reflects a very severe scenario.
The scenario is hypothetical and not designed to capture every possible confluence of events.
However, it can help provide an understanding of the impact on the EU banking system if a severe
economic downturn materialises. Since the common EU scenario may have different effects in
different countries, banks’ results should be read in conjunction with the relevant scenario.
One of the main features of the 2021 exercise is the collection of data on the support measures
deployed in response to the COVID-19 pandemic, along with the implementation of specific
1
In 2020, following the postponement of the EU-wide stress test exercise, the EBA has released two Transparency
exercises, one in late Spring and one in late Autumn, to inform the public on the conditions of the EU banking sector at
the start of the COVID-19 crisis and the impact of the crisis in the first half of 2020, without any additional reporting
burden for banks. In addition, in May 2020 the EBA published a Thematic Note (EBA Rep/2020/17) analysing the
preliminary effects of COVID-19 pandemic on the EU banking sector, including a sensitivity analysis on parts of banks’
credit and market risk portfolios.
92021 EU‐WIDE STRESS TEST – RESULTS
methodological choices on these measures (e.g. the assumption of expiration of EBA-compliant
moratoria at the end of 2020).
The current exercise includes a sample of 50 banks, covering 70% of total banking assets across 15
countries of the European Union (EU) and European Economic Area (EEA) at the highest level of
consolidation 2 . Granular data on a bank-by-bank level are disclosed to contribute to market
discipline and serves as a benchmarking tool. Despite the unprecedented shock of 2020, the starting
point of the 2021 EU-wide stress test, in terms of the CET1 capital ratio (15.3%, transitional), is
notably above the value reported at the beginning of the previous exercise (14.4%, transitional
restated) 3; this data reflects a continuous and significant strengthening of the capital position by
EU banks. At the end of the stress test horizon, the transitional CET1 capital ratio drops to a level
of 10.3%, with a depletion of 497 bps, higher than in 2018 (410 bps) 4 and consistent with the
increased severity of the adverse scenario. On a fully loaded basis, the starting point CET1 capital
ratio is 15.0% and the capital depletion is 485 bps (10.2% CET1 capital ratio on a fully loaded basis
at the end of 2023). The dispersion in the capital depletion is higher compared to the previous stress
test, ranging from a minimum decrease of 80 bps transitional (80 bps fully loaded) to a maximum
decrease of 1179 bps (996 bps fully loaded) 5.
For the 38 banks under the ECB-SSM banking supervision, the CET1 capital ratio at the starting point
is 15.0% transitional (14.7% fully loaded) and reaches a level of 9.9% (9.7% fully loaded) at the end
of 2023.
The aggregate leverage ratio decreases from 5.7% to 4.4% on a transitional basis, and from 5.6% to
4.3% on a fully loaded basis.
Table 1: Summary of the key metrics and results of the exercise
Metric Starting 2020 Adverse 2023 Delta adverse 2023 - 2020
Transitional CET1 capital ratio 15.3% 10.3% -497 bps
Fully loaded CET1 capital ratio 15.0% 10.2% -485 bps
Transitional leverage ratio 5.7% 4.4% -130 bps
Fully loaded leverage ratio 5.6% 4.3% -124 bps
2
Figures in the report are rounded to the nearest basis point or to the nearest unit. Due to rounding effect, the sum of
some data does not necessarily add up to the total.
3
The CET1 capital ratio at the starting point is higher in current exercise than in 2018 EU-wide stress test. This is still the
case if we consider only those banks that are common to the two exercises .
4
The aggregate impact of the adverse scenario is measured as the difference between the starting CET1 capital ratio and
the CET1 capital ratio projected at the end of the stressed period. The comparison of the effects of the stress test with
the 2018 exercise is only for information purposes; differences in the sample of banks in the two exercises and in the
scenarios may partially explain the differences.
5
In the 2018 EU-wide stress test capital depletion ranged between 52 bps and 778 bps on a transitional basis (30 bps and
769 bps fully loaded).
102021 EU‐WIDE STRESS TEST – RESULTS
Metric Starting 2020 Adverse 2023 Delta adverse 2023 - 2020
Transitional CET1 capital 1,115 bn 843 bn -273 bn
Transitional total REA 7,284 bn 8,149 bn 866 bn
Fully loaded CET1 capital 1,093 bn 828 bn -265 bn
Fully loaded total REA 7,279 bn 8,148 bn 868 bn
The stress test impact is mostly driven by credit risk losses of 308bn EUR, which have an impact of
-423 bps on the CET1 capital ratio. Market risk losses, including counterparty credit risk (CCR),
amount to 74bn EUR, and operational risk losses to 49bn EUR, driving an impact on capital of -
102 bps 6 and -68 bps respectively. While net interest income (NII) and net fees and commissions
income (NFCI) remain positive, the cumulative decrease of these two sources of income as of end-
2023 leads to a lower capital formation of 176 bps and 73 bps, compared to the hypothetical
contribution of constant starting point values. 7 Distribution restrictions, following the breach of
the trigger of the combined buffer requirement in any of the three years of the scenario, have been
applied by 22 banks. Following the maximum distributable amount (MDA) adjustments, these
banks decrease their distributions by 18.8bn EUR, with a positive impact on capital of 26 bps.
At the end of the stress test horizon, under the baseline scenario, all banks have a CET1 capital ratio
in excess to the overall capital requirement (OCR) (with reference to the portion to be held with
CET1), with a median excess capital of 704 bps; 90% of the sample (45 banks) has an excess capital
above 391 bps. Under the adverse scenario, in 2023 the median excess capital is 528 bps with
respect to the relevant total SREP capital requirement (TSCR); 90% of the banks of the sample is
above 219 bps; and two banks are below the TSCR 8. As part of the SREP, supervisors will consider
the impact of the stress test, together with the managerial decisions and capital actions, to assess
banks’ capital position and decide on the potential need to set a Pillar 2 capital guidance.
This report provides an overview of the key aggregate results and a description of the main drivers
of the capital impact. Annex I includes a bank-by-bank summary of the results. The methodology
and scenarios were published in January 2021 and can be consulted separately on the EBA website. 9
6
According to the methodology, market risk losses are fully recognised in the first year of the stress test horizon (i.e. in
2021). In addition, the market risk methodology allows for income recovery generated by client revenues in the 3 years
of the adverse scenario (see section 4.1.3 of the report). Without the positive contribution of client revenues, which
mitigates the impact of the losses registered in the first year, the market risk impact would be 163 bps.
7
Keeping the unstressed starting point values constant over the three-year horizon of the stress test.
8
If total capital is considered, under the baseline scenario, in 2023 the median excess capital with respect to OCR is
675 bps; 90% of the sample (45 banks) has an excess capital above 351 bps; one bank is below OCR. Under the adverse
scenario, in 2023 the median excess capital is 473 bps with respect to TSCR; 90% of the banks of the sample is above
119 bps; and two banks are below the TSCR.
9
https://www.eba.europa.eu/eba-launches-2021-eu-wide-stress-test-exercise
112021 EU‐WIDE STRESS TEST – RESULTS
2. Key aspects of the 2021 EU-wide
stress test
2.1 General aspects
The EU wide stress test is a solvency stress test conducted at the highest level of consolidation to
assess banks’ resilience to a common adverse macroeconomic scenario and its impact on their
capital position, over a three-year horizon. It has been conducted on a sample of 50 banks from 15
EU and EEA countries, including 38 banks from euro area countries and 12 banks from Denmark,
Hungary, Norway, Poland and Sweden. The exercise is not designed as a pass-fail test but as a
supervisory tool and an input for the Pillar 2 assessment of banks.
The EBA stress test exercise involves different institutions. The EBA initiates and coordinates the
exercise and defines the common methodology and templates for the collection and dissemination
of data. The baseline macro-financial scenario for EU countries is based on the December 2020
projections from the national central banks. The adverse scenario sets out paths for key economic
and financial variables in a hypothetical adverse situation triggered by the materialisation of risks
to which the EU banking system is exposed. The adverse macro-financial scenario is designed by
the ESRB’s Task Force on Stress Testing in close collaboration with the ECB. Competent authorities
and – for the Single Supervisory Mechanism (SSM) – the ECB in collaboration with national CAs are
responsible for quality assuring the data provided by banks and their projections. Once the exercise
is completed, the EBA is responsible for communicating the results at bank-specific and aggregate
level.
The methodology has remained broadly similar to the one envisaged for the postponed 2020 stress
test exercise. However, the support measures deployed in response to the COVID-19 pandemic
have required some refinements to the treatment of COVID-19 EBA-compliant moratoria and
COVID-19 public sector guarantees (see box 1). Furthermore, the 2021 methodology reflects the
amendments to the capital requirements regulation that were published in June 2020 (the ‘CRR
Quick Fix’). Differently from 2020, for some major P&L items (i.e. administrative expenses and net
fees and commissions income) specific changes have been introduced to recognise FX variations,
to reduce the asymmetry in the FX treatment that was previously embedded in the methodology 10.
The EU-wide stress test is a constrained bottom-up exercise. Hence, banks provide the data and
apply their own models to project the results, under the assumption of a static balance sheet 11.
However, banks are required to adjust their results based on the definitions, constraints, caps and
floors defined in the methodology. This is necessary to ensure a minimum degree of conservatism,
10
In the 2020 methodology, net interest income was already subject to FX variations.
11
The static balance sheet assumption requires that assets and liabilities that mature within the time horizon of the
exercise are replaced with similar financial instruments as at the start of the exercise; no capital measures or managerial
decisions completed after 31 December 2020 are considered.
122021 EU‐WIDE STRESS TEST – RESULTS
consistency and comparability of the projections as well as a level playing field. In addition, CAs
carry out an extensive quality assurance process for ensuring the reliability and robustness of the
results.
Dissemination of data is also part of the stress test exercise. The exercise fosters market discipline
through the publication of extensive and detailed bank-by-bank actual and projected data, which
is crucial particularly at times of increased uncertainty. In line with what was planned for the
postponed 2020 exercise, in the 2021 EU-wide stress test the transparency templates provide
information on Pillar 2 Requirements (P2R) for each bank at the starting point.
The adverse macroeconomic scenario, on which the exercise is based, assumes a general adverse
macroeconomic downturn over a three-year horizon which draws upon a prolonged COVID-19 state
in a “lower for longer” interest rate environment. The scenario is hypothetical and not designed to
capture every possible confluence of events. However, it can help provide an understanding of the
impact on the EU banking system if a severe economic downturn materialises, regardless of the
specific triggering shock.
The results of the exercise are an input to the SREP. Supervisors should consider the individual
results, together with managerial decisions and capital actions put forward by banks that may
mitigate the impact of the stress, to understand their resilience and capital position and assess the
potential need to set a Pillar 2 capital guidance. Supervisors may also consider the impact of the
static balance sheet assumption – as well as other methodological aspects – in evaluating the
results of the stress test during the SREP.
2.2 COVID-19 support measures in the 2021 EU-wide stress test
The COVID-19 pandemic originated an unprecedented shock to the EU economies. In response to
the challenges posed by the pandemic, public authorities adopted extraordinary fiscal and
monetary policies to support the real economy and ensure that the banking sector could keep
financing households and corporates. In several countries, moratoria on payments were granted
by banks to borrowers; in addition, public guarantees schemes (PGS) were introduced, especially
to secure the flow of credit to the non-financial sector. Furthermore, regulators and supervisors
adopted relief measures to mitigate the impact of the pandemic. The EBA, in order to alleviate the
operational burden for banks derived from the COVID-19 outbreak, postponed its 2020 EU-wide
stress test, provided some leeway to banks concerning the submission of supervisory reporting data
and took several other actions. 12 Among these actions, the EBA published the Guidelines on
legislative and non-legislative moratoria on loan repayments (EBA/GL/2020/02, amended in June
and December 2020) 13, which clarified that generalised payment delays due to public or industry-
12
For a list of actions taken by the EBA, see https://www.eba.europa.eu/coronavirus. For a more comprehensive review
of the measures adopted to counter the effects of COVID-19 pandemic, see also the Risk Assessment Report published
by the EBA in December 2020. For the first evidence on the use of moratoria and public guarantees in the EU banking
sector, see the Thematic Note (EBA Rep/2020/31)
13
The Guidelines have been published at the following link: Guidelines on legislative and non-legislative moratoria on
loan repayments applied in the light of the COVID-19 crisis | European Banking Authority (europa.eu).
132021 EU‐WIDE STRESS TEST – RESULTS
wide moratoria (“EBA-compliant moratoria”) do not lead to an automatic classification of
exposures as defaulted, forborne or unlikely to pay. Box 1 describes how COVID-19 relief measures
are considered in the stress test methodology, focusing mainly on moratoria, which can affect loan
creditworthiness, classification and provisioning, and PGS, which may significantly reduce banks’
risk exposure amount (REA) and expected credit losses for the guaranteed loans.
Box 1: COVID-19 supporting measures in the stress test exercise
The government support measures put in place to mitigate the impact of COVID-19 created
significant challenges to stress test models for loan loss projections. The stress test scenario takes
into account the existing COVID-19 support measures and the extent to which they mitigate the
macroeconomic situation. However, to level the playing field, assumptions are needed for the
consideration of these support measures during the projected horizon of the stress test.
Therefore, in the stress test scenarios and in line with the “no policy change” convention, these
measures are considered not to be prolonged beyond their expiration date.
Two support measures used by several EU countries are explicitly addressed in the stress test
methodology: EBA-compliant moratoria and PGS.
EBA-compliant moratoria
Given the short-term nature of EBA-compliant moratoria, these measures should not be
considered in the projection to avoid prolonging the mitigating effect throughout the stress test
horizon. According to this methodological option, banks are asked to assume that, for the
purpose of calculating impairments and REA during the stress test horizon, all EBA-compliant
moratoria are no longer in place from 1 January 2021 onwards. Based on this assumption, for the
starting point of the exercise, banks have reassessed the distribution of exposures across IFRS 9
stages. Since the values of the starting point parameters (e.g. probability of default) shall be
suitable for the projection, these parameters need to be adjusted by banks to remove the effect
of moratoria too.
Public guarantee schemes
Public guarantees put in place to mitigate the impact of COVID-19 have typically a longer duration
than moratoria. The treatment put forward in the methodology for these guaranteed loans
considers that most of them will be in place during the stress test horizon. In line with the static
balance sheet assumption, banks are asked to replace guaranteed loans that mature during the
stress test horizon by similar loans covered by the guarantee.
At the end of 2020, the amount of exposures that have been subject to EBA-compliant moratoria
(henceforth ‘moratoria’) accounted for 4.2% of total exposures of the banks in the sample, of which
1.4% was not expired. Positions classified in stage 2 at the end of 2020 were about 24% of exposures
under moratoria. Given that PGS were granted mainly to newly originated loans, the percentage of
exposures under the PGS is much lower in aggregate (1.6% of total exposures). In line with the goal
142021 EU‐WIDE STRESS TEST – RESULTS
of this relief measure to secure credit flow to the non-financial sector, a great part of the exposures
under PGS is related to corporates.
Table 2: Exposures under moratoria and under PGS: descriptive statistics (year 2020, actual data, %
of exposures) 14
Metric 2020
Exposures under moratoria (% of total exposures) 4.2%
of which expired 2.8%
of which non-expired 1.4%
Breakdown of exposures under moratoria
of which expired 65.9%
of which non-expired 34.1%
of which retail 58.5%
of which corporates 31.4%
of which Stage 2 24.3%
of which Stage 3 3.1%
Newly originated loans and advances subject to COVID-19 PGS (% of total exposures) 1.6%
Breakdown of exposures under PGS
of which retail 31.8%
of which corporates 65.6%
of which Stage 2 12.1%
of which Stage 3 1.1%
The following charts show the dispersion, per country, of the incidence of exposures under
moratoria or PGS. Most of the countries with exposures under moratoria above the median have a
greater portion of exposures under moratoria classified as stage 3. Conversely, most of the
countries with PGS above the median have a lower portion of exposures under PGS classified as
stage 3 15.
14
Data refers to staging as of 31 December 2020. Restatements related to the assumed expiration of moratoria (see Box
1) are reported in section 4.1.2. When not differently stated, data refers to the sum of expired and non-expired moratoria
to give a comprehensive picture of the impact of EBA-compliant moratoria. Non-expired moratoria refer to EBA-compliant
moratoria which had not expired on 31 December 2020 but for which banks had to assume such expiration for the stress
test. Exposures under moratoria (or under PGS) as a percentage of total exposures are the portion of total exposures to
which moratoria (or a PGS) measures have been granted. The “breakdown” sections of the table report a breakdown of
the total exposures under moratoria (or PGS). The definition of asset classes (e.g. retail exposures) is in line with COREP
definition.
15
The median is computed on the distribution of the ratio of exposures under moratoria (or PGS) on total exposures.
152021 EU‐WIDE STRESS TEST – RESULTS
Figure 1: Exposures under moratoria (in aggregate and non -expired) (1) and under PGS (2): (year
2020, % of total exposures, per country of the bank, sorted by % on total exposures) 16
Banks with higher exposure towards sectors highly affected by the pandemic 17 show a higher
portion of exposures under moratoria.
Table 3: Exposures under moratoria and under PGS: analysis per cluster (year 2020, % of exposures
per cluster) 18
Metric 2020
Exposures under moratoria
banks with high exposures towards the most affected sectors 7.1%
other banks in terms of "most affected sectors" 3.5%
Newly originated loans and advances subject to COVID-19 PGS – Exposures
banks with high exposures towards the most affected sectors 2.6%
other banks in terms of "most affected sectors" 1.3%
16
The chart on the left-hand side reports the exposures under moratoria (total and “of which: non-expired”), for every
country, as a ratio of total exposures of the specific country. The chart on the right-hand side reports exposures under
PGS, for every country, as a ratio of total exposures of the specific country.
17
The list of the most affected sectors is based on the EBA report on the “First evidence on the use of moratoria and
public guarantees in the EU banking sector” (thematic note EBA/Rep/2020/31) published in November 2020 and updated
on the basis of the World economic outlook of the IMF (April 2021); the list takes into account also the sectors most
severely affected by the containment measures mentioned in the scenario designed for the stress test (e.g. travel, air
transport, accommodation services, food, and film and media). The final list includes accommodation and food services;
arts, entertainment, and other service activities; wholesale and retail trade; and transportation. “Most exposed” banks
are banks belonging to the fourth quartile of the distribution of the following indicator: total exposures towards most
affected sectors on total exposures. The exposure of each bank to affected sectors was based on the data by NACE sector
available in FINREP, with reference date 31 December 2020. Data was available for 49 banks of the sample (out of 50).
18
Total exposures and exposures under moratoria or PGS include also households. In line with the methodology,
exposures are broken down between the stress test asset classes of corporates and retail (including retail SME).
162021 EU‐WIDE STRESS TEST – RESULTS
3. Impact of the stress test on capital
ratios
3.1 Impact on CET1 capital ratios
The banks included in the 2021 stress test sample reported a 15.3% weighted average transitional
CET1 capital ratio as of December 2020. The aggregate capital ratio at the starting point is above
the aggregate ratio reported by banks at the beginning of previous EU-wide stress test exercises,
an evolution that reflects a continuous and significant strengthening of the capital position by the
major EU banks.
Over the stress test horizon, in the adverse scenario the weighted average CET1 capital ratio moves
from 15.3% transitional (15.0% fully loaded) as of end of 2020, to 10.3% (10.2% fully loaded) at the
end of 2023. Therefore, under the adverse scenario the aggregate transitional CET1 capital ratio
decreases by 497 bps over the three-year period of the exercise (485 bps on a fully loaded basis)
(see Figure 2 and Figure 3). As a deviation to the baseline scenario, the CET1 capital ratio in the
adverse scenario is 548 bps lower than in the baseline scenario (563 bps lower for fully loaded).
172021 EU‐WIDE STRESS TEST – RESULTS
Figure 2: Evolution of transitional CET1 capital ratio (%) (1) and change from 2020 (bps) (2)
Figure 3: Evolution of fully loaded CET1 capital ratio (%) (1) and change from 2020 (bps) (2)
The breakdown of the aggregate results by clusters of banks shows that capital depletion is lower
for banks with high NII 19 and for banks less concentrated on domestic markets 20 (see Figure 4). The
analysis based on a dimensional factor shows no relevant difference between capital depletion of
largest banks (fourth quartile in terms of total assets) and other banks.
19
Banks included in the fourth quartile of the distribution of the indicator NII on total assets, as of 31 December 2020.
20
The subsample of banks concentrated on domestic markets includes banks belonging to the fourth quartile of the
distribution of the following indicator: exposures granted to borrowers located in the same country of the bank on total
exposures, as of 31 December 2020.
182021 EU‐WIDE STRESS TEST – RESULTS
Figure 4: Impact on CET1 capital ratio (depletion) from 2020 to 2023 under the adverse scenario by
cluster of banks (bps)
Figure 5 compares the aggregate CET1 capital ratio as of end-2023 to the 2020 starting point (both
on transitional and fully loaded basis), by jurisdiction.
192021 EU‐WIDE STRESS TEST – RESULTS
Figure 5: Comparison of aggregate transitional and fully loaded CET1 capital ratio by jurisdiction
in alphabetical order (%)
A bank-specific analysis is reported in Figure 6, based on actual data as of 2020 and projections
under the adverse scenario as of end 2023 21. Annex I includes the transitional and fully loaded CET1
capital ratios projected by banks for each year of the adverse scenario. At the starting point, all
banks report minimum transitional levels of capital above Pillar 1 capital requirements, with a CET1
capital ratio above 4.5%, a Tier 1 capital ratio above 6% and total capital above 8%. At the end of
the stress test horizon, under the baseline scenario, all banks have a CET1 capital ratio in excess to
the relevant part of OCR 22, with a median excess capital of 704 bps; 90% of the sample (45 banks)
has an excess capital above 391 bps. Under the adverse scenario, in 2023 the median excess capital
is 528 bps with respect to the relevant TSCR 23; 90% of the banks of the sample is above 219 bps;
two banks are below the TSCR. 24
21
When comparing the bank-by-bank fully loaded and transitional results, the impact with and without transitional
arrangements differs across banks. Some banks report a lower fully loaded impact generally due to the phase-in by the
end of 2023 of CRR transitional adjustments that were in force at the beginning of the exercise.
22
In accordance with the EBA SREP Guidelines currently in force and the consultation paper (Draft Guidelines), when
determining the size of P2G, competent authorities should ensure that it is set at a level appropriate to cover at least the
anticipated maximum stress impact, which should be calculated based on the changes in the common equity tier 1 (CET1)
ratio. Furthermore, competent authorities should assess as appropriate the quantitative outcomes of stress tests with
regard to the adequacy and quality of the institution's own funds and determine whether the quantity and quality of own
funds are sufficient to cover applicable capital requirements, and in particular: (a) OCR including its combined buffer
requirements under the baseline scenario over a forward looking time horizon of at least two years; (b) TSCR under the
adverse scenarios over a forward looking time horizon of at least two years.
23
OCR and TSCR levels for years included in the stress test horizon are the ones in force as of end 2020. All comparisons
are made with reference to the portion of OCR and TSCR to be held with CET1. For total capital, see footnote 8.
24
In line with paragraph 11 of the EBA methodological note, banks included in the exercise that are under or near the
completion of a restructuring have been subject to the same methodology, including the static balance sheet assumption,
as other banks in the sample. This in turn limits the extent to which restructuring measures can be reflected in the result,
e.g. regarding expected future restructuring benefits.
202021 EU‐WIDE STRESS TEST – RESULTS
Figure 6: CET1 capital ratio by bank in alphabetical order at the starting point and as of end-2023
under the adverse scenario (%)
212021 EU‐WIDE STRESS TEST – RESULTS
Figure 7 represents the bank-specific impact of the adverse scenario on their capital ratio. In
particular, banks project a negative impact that ranges, on a transitional basis, from 80 bps to
1179 bps (80 bps to 996 bps on a fully loaded basis).
Figure 7: Impact on CET1 capital ratio from 2020 to 2023 under the adverse scenario by bank, in
alphabetical order (bps)
222021 EU‐WIDE STRESS TEST – RESULTS
3.2 Impact on leverage ratio
The weighted average leverage ratio drops by 130 bps (124 bps fully loaded), from 5.7% (5.6% fully
loaded) in 2020 to 4.4% (4.3% fully loaded) in 2023 under the adverse scenario (see Figure 8). The
drop is solely explained by the decrease in Tier 1 capital as the leverage exposure (i.e. the
denominator of the ratio) remains constant according to the methodological static balance sheet
assumption. Figure 8 includes the evolution of the transitional leverage ratio over the adverse time
horizon on an aggregate level for the entire sample, and the dispersion across banks. Under the
adverse scenario, four banks report a ratio below 3% for every year of the stress test horizon .
Figure 8: Evolution of transitional aggregate leverage ratio (%) (1) and its dispersion – 5th and
95th percentiles, interquartile range and median in 2020 and in the adverse scenario (%) (2)
232021 EU‐WIDE STRESS TEST – RESULTS
4. Main drivers of the impact
Figure 9 25 shows the contribution of different profit and loss (P&L) and balance sheet items to the
change in the aggregate CET1 capital ratio between 2020 and 2023 under the adverse scenario.
Credit risk losses 26 are the main contributor to the stress impact and detract 423 bps from the CET1
capital ratio as of end-2023. Other relevant direct drivers of banks’ capital depletion are market risk
and operational risk losses. The impact of market risk on CET1 capital ratio is equal to -102 bps on
a 3-year cumulative basis; following the methodology, market risk losses (recognised in the first
year of the stress test horizon, i.e. in 2021) lead to an impact of -163 bps, however the positive
contribution of client revenues in the three years of the adverse scenario compensates part of the
2021 losses (see section 4.1.3). In addition, operational risk losses drive banks’ CET1 capital ratio
further down by 68 bps. Banks’ capital ratios are impacted not only by the capital depletion, on the
numerator side, but also by the increase of the REA, with an aggregate impact of -121 bps on CET1
capital ratio 27.
Figure 9: Contribution of main drivers to the change in CET1 capital ratio from 2020 to 2023 in the
adverse scenario (waterfall)
Market risk impact
25
Contributions to the CET1 capital ratio are measured against the aggregate actual total REA as of the 2020. Impacts of
single drivers are reported gross of taxes – taxes included in ‘other items affecting CET1 (incl. taxes)’. Fair value through
other comprehensive income (FVOCI) exposures are subject to the market risk methodology.
26
Impairment or reversal of impairment on financial assets not measured at fair value through profit or loss.
27
In comparison with 2018, although the sample of banks and the scenario are different, the contribution of the item
“profit or loss before tax from continuing operations before credit risk, market risk and operational risk losses” is lower
(in 2018 it was 3.9%). Most of the reduction is related to NII (see section 4.1.1).
242021 EU‐WIDE STRESS TEST – RESULTS
As reported in section 3.1 (Figure 4), the breakdown of the aggregate results by clusters of banks
shows that capital depletion is lower for banks with high NII 28 and for banks less concentrated on
domestic markets 29 . The analysis of the main drivers of capital depletion helps to see that the
cluster of banks less concentrated on domestic markets and of banks with high NII have a higher
contribution of P&L items (especially NII 30), that covers the higher credit risk losses (Table 4).
Table 4: Contribution of main drivers to the change in CET1 capital ratio from 2020 to 2023 in the
adverse scenario (waterfall) per cluster of banks
4.1 Impact on profitability
Table 5 shows the evolution of the main P&L components in each year of the adverse scenario and
the absolute cumulative contribution to profitability and CET1 capital over the time horizon of the
exercise. At the starting point, banks had a profit of 33bn EUR; at the end of the adverse scenario,
the aggregate cumulative loss, net of taxes, reaches 140bn EUR (of which 127bn EUR in the first
year of the adverse scenario). Credit risk cumulative impairments are the main driver of these losses
(308bn EUR).
28
Banks included in the fourth quartile of the distribution of the indicator NII on total assets, as of 31 December 2020.
29
The subsample of banks concentrated on domestic markets includes banks belonging to the fourth quartile of the
distribution of the following indicator: exposures granted to borrowers located in the same country of the bank on total
exposures, as of 31 December 2020.
30
The contribution of NII (divided by REA) is 8.50% for “non-domestic” banks and 7.80% for domestic ones.
252021 EU‐WIDE STRESS TEST – RESULTS
Table 5: Evolution of EU aggregate profit and loss account (selected items) in the adverse
scenario (EUR bn) 31
The main sources of income are NII and NFCI, which under the adverse scenario decrease by 23%
and 14%, respectively, as of end 2023.
Figure 10 shows, under the adverse scenario, the cumulative contribution to capital of the banks’
main sources of income reported in Table 5 (NII, NFCI, dividend income and net trading income
(NTI)) as of end-2023, compared to their hypothetical unstressed contribution (i.e. keeping
constant the income recognised in 2020 over the three years of the stress test). The impact under
the adverse scenario is -176 bps on NII, -4 bps on dividend income, -73 bps on NFCI and -100 bps
on NTI. This means that the aggregate contribution to CET1 capital ratio of these four sources of
income would have been 353 bps higher without the stress implied by the adverse scenario.
31
Only the main items are included so that sub-items do not necessarily add up to the total.
262021 EU‐WIDE STRESS TEST – RESULTS
Figure 10: Cumulative CET1 ratio impact of the main sources of income over 2020-23 adverse,
compared to the hypothetical unstressed contribution (% of REA) 32
4.1.1 Net Interest Income
The NII methodology prescribes asymmetric pass-through constraints for the effective interest rate
(EIR) of repriced (or replaced) instruments, including a floor for the margin of interest-bearing
liabilities based on the maximum of a sovereign spread shock or an idiosyncratic shock, and a cap
for the margin of interest-earning assets based on the evolution of the sovereign spread of the
country of the exposure. Other constraints refer to the treatment of sight deposits, which have to
be repriced immediately following a common definition for fixed rate sight deposits and for floating
sight rate deposits. Finally, the methodology prescribes a cap applicable to the EIR of net NPEs and
a cap to the overall volume of NII under the adverse scenario.
Aggregate NII falls by 56bn EUR as of 2023 in the adverse scenario compared to the starting point,
a 23% drop from 248bn EUR to 192bn EUR (see Figure 11). This decrease is driven by several
components. Among the factors, declining interest income is explained by the negative projections
32
Only main items of P&L are included. In the first bar the cumulative unstressed contribution is reported (actual data,
constant over the three-year horizon, on total REA); in the third bar the cumulative stressed contribution is reported (sum
of projections reported over the stress test horizon, on total REA).
272021 EU‐WIDE STRESS TEST – RESULTS
of the long-term interest rates for more than half of the jurisdictions of the sample, in the worst
year of the adverse scenario compared to the starting point (in the previous stress test, all
jurisdictions presented positive projections that explained the increases in both interest income
and expenses). This is however partially offset by the decline of interest expense. The EIR on the
assets decreases by 24 bps in the adverse scenario (from 73 bps in 2020 to 49 bps in 2023), while
the EIR on the liabilities decreases by 19 bps (from 48 bps in 2020 to 29 bps in 2023). Therefore,
the difference between the EIR on the assets and the cost of funding decreases from the initial
25 bps to 20 bps at the end-2023.
Figure 11: Evolution of aggregate NII (EUR bn)
250
200
150
100
50
0
2020 2021 2022 2023
Baseline Adverse
While NII has a positive contribution to capital in each year of the adverse scenario, it decreases
significantly relative to the starting point, i.e. its contribution to capital formation is lower than it
would have been assuming a constant (unstressed) NII. In particular, the cumulative NII after caps
over 3 years is 128bn EUR lower than it would have been holding the starting value constant, which
is equivalent to a 176 bps lower contribution to the CET1 capital ratio at the end of 2023 (Figure
10). Overall, the contribution of the cumulative NII to capital over the stress test horizon is 8.5%,
which is mainly explained by the contribution to capital of the interest income generated by loans
and advances (10.5%), see Figure 12.
282021 EU‐WIDE STRESS TEST – RESULTS
Figure 12: Cumulative contribution of the NII generated by each balance sheet item to capital, in
percentage points of REA
The positive contribution to capital of NII varies significantly across banks, being 8.5% on average
but ranging from 3.3% to 15.6% of additional capital at the end of the adverse scenario (see Figure
13). This dispersion is not only driven by the evolution of interest rates and sovereign spreads across
countries, but also by the level of effective interest rate of the banks at the starting point and by
their business models. Data also shows dispersion in the contribution to capital of NII among banks
in the same country.
292021 EU‐WIDE STRESS TEST – RESULTS
Figure 13: Contribution of NII to CET1 capital ratio under adverse scenario, 5th and 95th
percentiles, interquartile range and median in 2020 and in the adverse scenario (%) (1)
Dispersion of the contribution to CET1 capital ratio of cumulative net interest income as of end
2023 under the adverse scenario by banks in the sample (2)
0% 5% 10% 15% 20%
The contribution of the cumulative interest income recognised for the stock of NPEs over the three
years of the adverse scenario to capital is 0.5% on weighted average, with a large dispersion among
banks (ranging from 0% to 1.4%). As it can be observed in Figure 14, although there is a strong
correlation between the cumulative interest income and the share of Stage 3 exposures over total
exposures, not all the banks that are in the highest quartile of cumulative interest income obtained
from NPE are in the highest quartile of the share of Stage 3 exposures.
302021 EU‐WIDE STRESS TEST – RESULTS
Figure 14: Contribution to capital of cumulative interest income from NPEs as of end 2023 under
the adverse scenario and proportion of Stage 3 exposures over total
7.0%
6.0%
5.0%
Stage 3 exposures (%)
R² = 0.4102
4.0%
3.0%
2.0%
1.0%
0.0%
0.0% 0.2% 0.4% 0.6% 0.8% 1.0% 1.2% 1.4% 1.6%
Cumulative interest income from net NPE, in pp of REA
Finally, the combined application of the methodological caps on EIR of net non-performing
exposures (NPEs) and on total volume of NII, drives the NII down by 1bn EUR as of end 2023, and
the cumulative decrease in the aggregate NII over the stress time horizon down by 3bn EUR, i.e.
4 bps of lower contribution to capital at the end of 2023.
4.1.2 Credit risk losses
Credit risk losses 33 over the three years of the adverse scenario amount to 308bn EUR, (see Figure
15) leading to a -423 bps impact on the CET1 capital ratio. The largest impact is in the first year of
the scenario, mainly due to the perfect foresight methodological assumption and to the lifetime
expected credit losses (ECL) approach for stage 2 and stage 3 exposures.
33
Credit risk losses are booked in the P&L account in the following item: “impairment or reversal of impairment on
financial assets not measured at fair value through profit or loss”.
312021 EU‐WIDE STRESS TEST – RESULTS
Figure 15: Evolution of absolute credit losses (EUR bn)
Exposures towards counterparties in France, Italy, Germany, US, Spain and the Netherlands are
those contributing the most to credit losses in absolute terms (see Figure 16 (2)). In relative terms,
as a percentage of total exposures at the starting point, the exposures towards counterparties
located in the US, Italy and Spain show the highest ratio of projected impairments (above 2%) over
the three years of the adverse scenario. Considering all the countries reported in the stress test
data, the exposures towards counterparties located in Brazil, Peru, Mexico, Colombia and Albania
show a ratio above 6%. 34
34
The indicator is based on the breakdown of data by country of the borrowers. For every country, it is computed as the
additional provisioning reported during the stress test projection (adverse scenario), as a percentage of initial exposures.
The distribution of new provisioning by country of counterparty reflects not only the volume of the exposures towards
counterparties in those countries, but also the severity of the scenario in the country as well as the distribution of
exposures across asset classes.
32You can also read