Non-Destructive Electrochemical Testing for Stainless-Steel Components with Complex Geometry Using Innovative Gel Electrolytes - MDPI

Page created by Beatrice Rojas
 
CONTINUE READING
Non-Destructive Electrochemical Testing for Stainless-Steel Components with Complex Geometry Using Innovative Gel Electrolytes - MDPI
metals
Article
Non-Destructive Electrochemical Testing for
Stainless-Steel Components with Complex Geometry
Using Innovative Gel Electrolytes
Gleidys Monrrabal 1 , Blanca Ramírez-Barat 2       ID
                                                        , Asunción Bautista 1, *   ID
                                                                                        , Francisco Velasco 1   ID

and Emilio Cano 2 ID
 1   Materials Science and Engineering Department—IAAB, University Carlos III of Madrid, Leganés,
     28911 Madrid, Spain; gmonraba@ing.uc3m.es (G.M.); fvelasco@ing.uc3m.es (F.V.)
 2   Department of Surface Engineering, Corrosion and Durability,
     National Center of Metallurgical Research (CENIM-CSIC), 28040 Madrid, Spain;
     blanca.ramirez@csic.es (B.R.-B.); ecano@cenim.csic.es (E.C.)
 *   Correspondence: mbautist@ing.uc3m.es; Tel.: +34-916-249-914
                                                                                                           
 Received: 6 June 2018; Accepted: 25 June 2018; Published: 29 June 2018                                    

 Abstract: Corrosion can be a problem for stainless steels in chloride-containing or other aggressive
 environments, especially when they are formed as components with complex shapes. Monitoring the
 corrosion performance of the stainless steels during their in-service life is not always an easy task.
 Traditional electrochemical cells can be difficult to adapt to complex surfaces, and undesired crevices
 or liquid electrolyte leaks can occur. In the presented work, the possible use of non-destructive
 techniques with innovative gel electrolytes was investigated using portable cells. The electrolytes
 were based on agar (used as a gelling agent with ionic conductivity), glycerol (a plasticizer that
 improves adaptability to complex surfaces), and NaCl or KClO4 salts (which improve the conductivity
 and control the aggression of the tests). X-ray photoelectron spectroscopy (XPS) and Mott–Schottky
 analysis were carried out to obtain information about the influence of the electrolyte on the passive
 layer. The oxygen concentration and conductivity in the gels with various glycerol contents were
 compared to those in liquid electrolytes. Electrochemical impedance spectroscopy (EIS) measurements
 were carried out in liquids and gels. The performance of the gel cell on a stainless-steel component
 with a weld and complex shape was checked. The variation in the sensitivity of gels with and without
 chlorides to identify corrosion-susceptible regions was tested.

 Keywords: stainless steel; corrosion monitoring; agar gel; welding; crevice corrosion; passive films;
 EIS; XPS; Mott–Schottky

1. Introduction
      The corrosion resistance of stainless steels is already the subject of many studies. Their durability
is related to a very thin and protective passive film formed on the metal, which comprises a mixture of
iron and chromium oxides [1,2]. Their good corrosion resistance, combined with their good mechanical
properties over an extremely wide range of temperatures [3], as well as their oxidation resistance
at very high temperatures [4], and their ease of maintenance and low life-cycle cost make stainless
steels one of the most widely used materials. Hence, stainless steels are often used for very diverse
applications, resulting in the possible exposure to aggressive conditions that can compromise their
durability. As a result, these materials can suffer problems such as localized attack, showing pitting [5],
stress corrosion cracking [6], or crevice corrosion [7], sometimes in an unexpected way. In the often
corrosion-prone occluded regions of complex-shaped components, the detection of the attack can be
difficult [8], and the evaluation of its intensity becomes especially complex.

Metals 2018, 8, 500; doi:10.3390/met8070500                                             www.mdpi.com/journal/metals
Non-Destructive Electrochemical Testing for Stainless-Steel Components with Complex Geometry Using Innovative Gel Electrolytes - MDPI
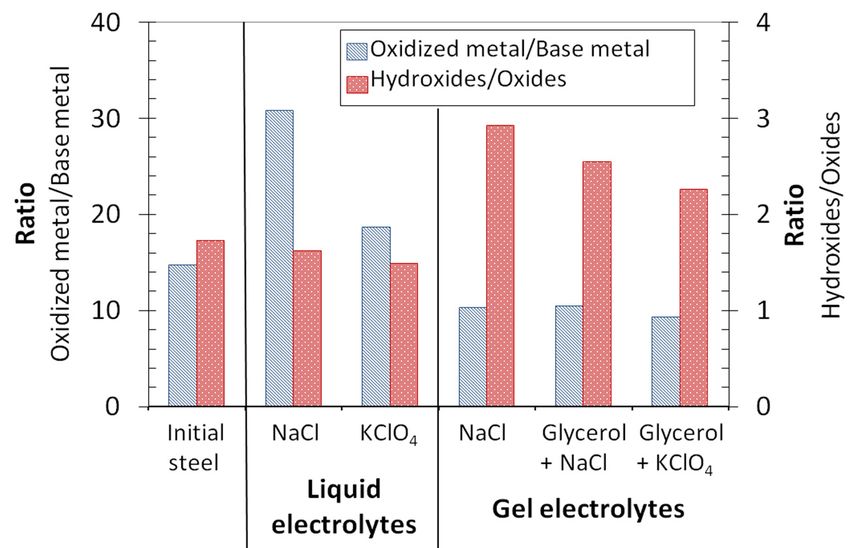
Metals 2018, 8, 500                                                                                      2 of 16

      Local changes in the initial microstructure of the stainless steels and strain concentrations induced
during the forming process [1,9], or the treatment of the surface [10], caused by the thermo-mechanical
assembly of the components [11] or generated during service exposure [12], can decrease the passive
film’s stability. Chromium carbide grain boundary precipitation (associated with sensitizing), as well as
other undesired phase precipitation, can also be a problem for welded stainless-steel components [11,13].
The influence of improperly removed welding oxides is another problem that often appears and which
cannot be ignored [14]. In conclusion, the initial corrosion performance of a stainless steel with a given
composition can be locally modified by the forming, assembly, or working conditions, and it is necessary to
optimize methods that are able to easily provide information on the possible changes in corrosion behavior.
      Non-destructive electrochemical techniques can be used for the evaluation of corrosion resistance
without affecting the natural development of the process. Electrochemical impedance spectroscopy
(EIS) [15], electrochemical noise [16], transient analysis [17], and polarization resistance (Rp )
measurements [18] are examples of well-known non-destructive electrochemical methods commonly
used for laboratory studies.
      There are also experimental studies about the use of non-destructive electrochemical techniques
outside of the laboratory, in areas such as the calculation of corrosion rates of steel embedded in
concrete structures [19]. However, obtaining information about the corrosion rate of stainless-steel
components assembled into industrial machinery or exposed to the atmosphere is often not a simple
task. The electrochemical testing of the non-flat, complex surfaces that real components frequently
exhibit is difficult to achieve without their modification. Defining the surface under study is the main
issue. Successfully fixing a conventional electrochemical cell over a region of the component can also
be difficult. Leakage problems involving the electrolyte or generation of undesired crevices with the
chosen fixing strategy are very likely to occur.
      In recent years, the design of polymer electrolytes with electrochemical characteristics comparable to
those of liquid ones became a very challenging endeavor for materials scientists [20] due to their interesting
properties. Acceptable conductivity, good electrode–electrolyte contact, simple preparation, and good
mechanical properties are some of their most attractive characteristics. Use of semi-solid rather than liquid
electrolytes in fields such as energy storage in supercapacitors [21,22] and rechargeable lithium ion batteries
is considered to be of great interest.
      For corrosion studies, a semi-solid agar medium was used to replicate soil conditions for microbial-
influenced attack of underground pipelines [23,24]. In the field of cultural heritage, a gel electrolyte was
proposed to perform corrosion studies on metallic artefacts of archeological and historical interest [25,26].
The authors designed a portable cell based on the use of agar as a gelling agent [27]. Successful results were
obtained for in situ EIS measurements on stainless-steel and bronze sculptures using this electrolyte [27].
Further recent research succeeded in improving the mechanical properties and adaptability of agar-based
gel electrolytes by adding glycerol (which acts as a plasticizer) [28]. The first positive results regarding the
usefulness of this cell for carrying out anodic polarization curves on stainless steels in chloride media were
already reported [28].
      Aiming to contribute to the corrosion monitoring of stainless-steel components with difficult
angles and complex geometry, the presented work explored the viability of agar-glycerol electrolytes
for carrying out non-destructive electrochemical measurements. Formulations with various salts and
amounts of glycerol were considered to check the effect of the electrolyte composition. The performance
of the portable cells was tested with measurements in samples in which using cells with liquid
electrolytes for monitoring could be quite problematic.
Non-Destructive Electrochemical Testing for Stainless-Steel Components with Complex Geometry Using Innovative Gel Electrolytes - MDPI
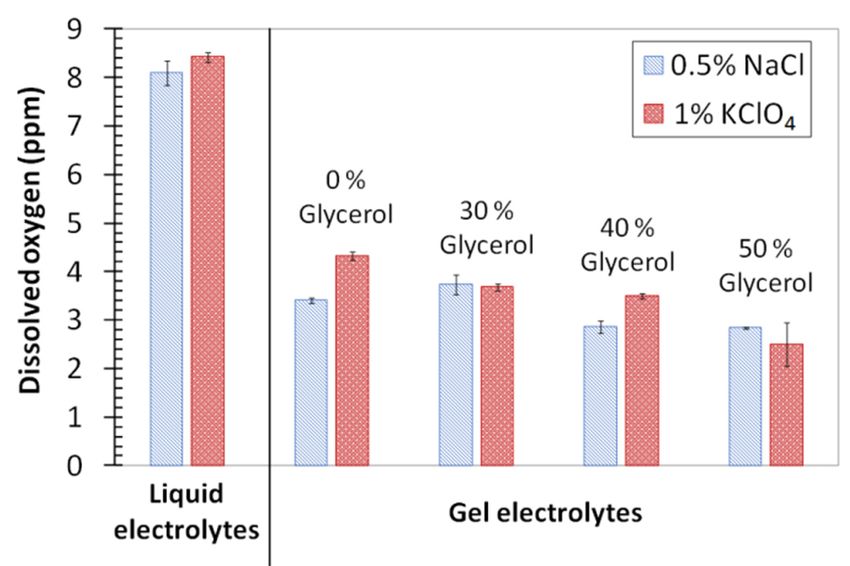
Metals 2018, 8, 500                                                                                                                        3 of 16

2. Experiments

2.1. Materials
      Technical CULTIMED agar, a 1.5% strength gel (with Nikan method) with 700–1100 g/cm3
density, wasMetalsused
                   2018, 8,to   manufacture
                            x FOR  PEER REVIEW the electrolyte. Glycerol, NaCl, and KClO4 (all 99%                                 3 ofpurity)
                                                                                                                                        17     were
used. All chemical reagents were purchased from Panreac (San Fernando de Henares, Spain).
            2. Experiments
      Compositions          of the gel electrolytes for the electrochemical studies were chosen with 0.5% (w/w)
agar and 2.1.glycerol
                 Materials  percentages          of 30%, 40%, and 50% (w/w). Previous research [28] showed that
gels with plasticizer         concentrations lower than 30% are unable to adapt to complex surfaces without
                  Technical CULTIMED agar, a 1.5% strength gel (with Nikan method) with 700–1100 g/cm3
cracking, while
            density, gels
                       waswithused plasticizer
                                     to manufacture  concentrations
                                                           the electrolyte.higher      than
                                                                               Glycerol,  NaCl,50% andhave
                                                                                                        KClOproblems        curingwere
                                                                                                              4 (all 99% purity)     in short times.
            used.0.5%
Additionally,      All chemical
                           NaCl or    reagents
                                         1% KClO were 4purchased
                                                           (w/w) were from Panreac
                                                                              added (San      Fernando
                                                                                        in order          de Henares,
                                                                                                      to increase      theSpain).
                                                                                                                            ionic conductivity of
the electrolyte.Compositions
                     NaCl is commonly  of the gel electrolytes for the electrochemical studies were chosen with 0.5%
                                                     employed as a depassivating agent, and the selected concentration
            (w/w) agar and glycerol percentages of 30%, 40%, and 50% (w/w). Previous research [28] showed that
gave the electrolyte        an   adequate       corrosivity      for performing the corrosion studies [28]. On the other hand,
            gels with plasticizer concentrations lower than 30% are unable to adapt to complex surfaces without
KClO4 is acracking,
               non-corrosive           salt  that    increases
                         while gels with plasticizer concentrations the conductivity
                                                                                 higher thanof  50%the   media.
                                                                                                      have  problems It was
                                                                                                                         curingalso  used in other
                                                                                                                                in short
            times.   Additionally,       0.5%    NaCl    or   1%  KClO       (w/w)  were   added     in  order
studies with agar-based electrolytes [29]. These reagents were dissolved in distilled water and heated up to
                                                                          4                                     to  increase   the  ionic
            conductivity of the electrolyte. NaCl is commonly employed as a depassivating agent, and the
90 ◦ C under    magnetic stirring conditions. The mixtures were continuously stirred for 10 min, and then,
            selected concentration gave the electrolyte an adequate corrosivity for performing the corrosion
they were studies
            allowed      to On
                      [28].   curethefor  1 h hand,
                                        other  in a controlled
                                                        KClO4 is a environment,
                                                                     non-corrosive salt   where     the temperature
                                                                                             that increases                 and relative
                                                                                                              the conductivity     of the humidity
conditionsmedia.
              were Itkept                ◦ C and 80%, respectively. More information about the gel manufacturing
                         was at     20used
                                 also         in other studies with agar-based electrolytes [29]. These reagents were
process can dissolved
               be found  in distilled    water and
                               in a previous           heated up to[28].
                                                   publication         90 °CLiquid
                                                                               under magnetic
                                                                                        solutions  stirring
                                                                                                       withconditions.
                                                                                                              0.5% (w/w)   The mixtures
                                                                                                                               NaCl or 1% (w/w)
            were continuously stirred for 10 min, and then, they were allowed to cure for 1 h in a controlled
KClO4 were also used as a reference.
            environment, where the temperature and relative humidity conditions were kept at 20 °C and 80%,
      Two-millimeter-thick               AISI 304 stainless-steel
            respectively. More information                                     sheets were
                                                        about the gel manufacturing              employed
                                                                                              process            for electrochemical
                                                                                                        can be found      in a previous     studies
on the influence        of   glycerol      concentration           and     type    of salt  on    the   measurements.
            publication [28]. Liquid solutions with 0.5% (w/w) NaCl or 1% (w/w) KClO4 were also used as a                       The    composition
(w/w) of thereference.
                 stainless steel was 18.66% Cr, 8.06% Ni, 1.82% Mn, 0.30% Si, 0.24% Cu, 1.9% Mo, 0.005% S,
                  Two-millimeter-thick AISI 304 stainless-steel sheets were employed for electrochemical studies
0.048% N, 0.043%         C, and Fe for the balance. The surface of the AISI 304 stainless steel was ground up
            on the influence of glycerol concentration and type of salt on the measurements. The composition
to 600# using
            (w/w)SiC     paper
                    of the          before
                            stainless          the18.66%
                                        steel was    measurements.
                                                              Cr, 8.06% Ni, 1.82% Mn, 0.30% Si, 0.24% Cu, 1.9% Mo, 0.005% S,
      In addition
            0.048% N,  to0.043%
                            the studies
                                    C, and Feon  forflat
                                                      the stainless-steel
                                                           balance. The surface   surfaces,
                                                                                    of the AISI the
                                                                                                  304performance
                                                                                                       stainless steel wasof ground
                                                                                                                              the electrolyte
                                                                                                                                       up       was
also checkedto 600#
                  in using     SiC paper before
                      a component           of anthe      measurements.
                                                       AISI    304 stainless-steel tank from a truck which was used for the
transportationIn of  addition to the studies on flat stainless-steel surfaces, the performance of the electrolyte was
                         alimentary fats and other products for years (Figure 1). The sample was chosen
            also checked in a component of an AISI 304 stainless-steel tank from a truck which was used for the
because ittransportation
             offered regions            with complex
                                of alimentary      fats and geometry,
                                                               other products  a weld,     and(Figure
                                                                                   for years      small1).pits
                                                                                                             Theand
                                                                                                                  sample cracks   in some regions
                                                                                                                             was chosen
generatedbecause
              duringit offered
                          its in-service        life;  therefore,      it  presented      diverse      factors   that
                                    regions with complex geometry, a weld, and small pits and cracks in some regions     would     be predicted to
            generated     during    its in-service   life;  therefore,  it  presented  diverse
affect its electrochemical behavior and that were not easy to monitor. The five different regionsfactors  that would     be predicted   to  studied
            affect its electrochemical behavior and that were not easy to monitor. The five different regions
in this section were (a) the outer surface at a distance from the weld where no corrosion damage could
            studied in this section were (a) the outer surface at a distance from the weld where no corrosion
be detected     (Figure
            damage     could  1a);   (b) the (Figure
                                be detected     inner surface         atinner
                                                           1a); (b) the     a distance
                                                                                 surface atfrom     the weld
                                                                                              a distance          where
                                                                                                           from the     weldfew
                                                                                                                              wherevery
                                                                                                                                     few small pits
could be detected
            very small (Figure
                           pits could1b);     (c) the (Figure
                                         be detected     heat-affected
                                                                  1b); (c) thezone     (HAZ)zone
                                                                                 heat-affected    of the    innerofsurface,
                                                                                                        (HAZ)                    where small pits
                                                                                                                      the inner surface,
            where small pits caused
and cracks—probably                and cracks—probably
                                              by residualcaused   stressesby residual
                                                                                from thestresses  from thehad
                                                                                              welding        welding
                                                                                                                  made  hadthem
                                                                                                                             made them
                                                                                                                                    progress from
            progress from small pits—could be observed (Figure 1b); (d) the weld at the outer surface (Figure
small pits—could be observed (Figure 1b); (d) the weld at the outer surface (Figure 1a); and (e) the
            1a); and (e) the crevice formed between the welded parts, where oxides could be observed at its
crevice formed
            bottombetween
                      (Figure 1a).the welded parts, where oxides could be observed at its bottom (Figure 1a).

       Figure 1. Welded part from a stainless-steel tank studied with the portable gel cell: (a) portable gel cell
       and outer surface of the tank; (b) inner surface of the tank, where small cracks and pits had appeared
       during its in-service life.
Non-Destructive Electrochemical Testing for Stainless-Steel Components with Complex Geometry Using Innovative Gel Electrolytes - MDPI
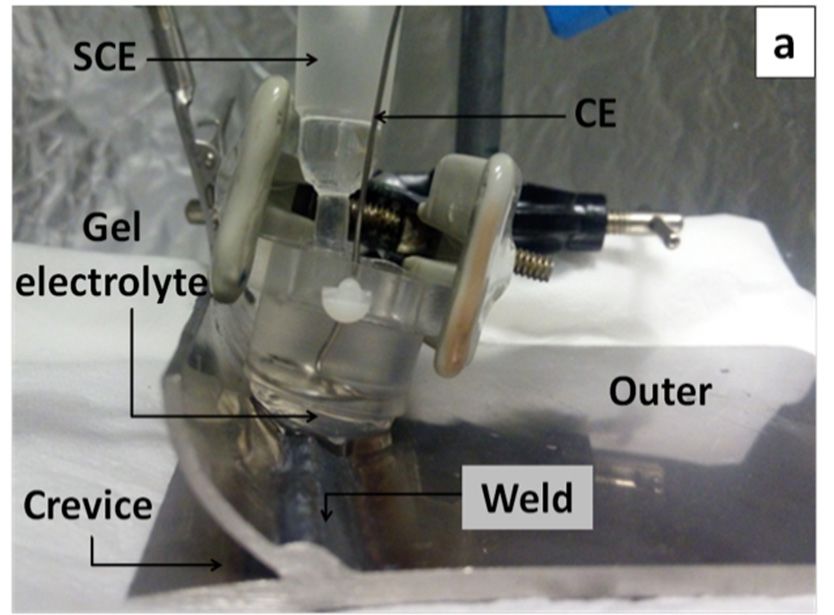
Metals 2018, 8, 500                                                                                 4 of 16

2.2. Methods
      The amount of oxygen present in the studied electrolytes was determined by employing an
Orion® Model 97-08 Dissolved Oxygen electrode (Thermo Orion Europe, Witchford, UK). It consisted
of two polarized silver electrodes, one acting as a cathode and the other as an anode. The electrodes
were immersed in a solution with chlorides, and were separated from the media by a gas-permeable
membrane. The oxygen of the media diffused through the membrane and was reduced in the cathode,
generating a current proportional to its concentration. The dissolved oxygen electrode was initially
immersed in the hot liquid agar/glycerol mixtures with salts, and the gels were allowed to cure with
the electrode embedded in them. The measurements of O2 solubility in the liquid electrolytes were
performed without previous heating to reproduce the usual testing procedure. Three measurements
were performed in each studied electrolyte.
      Ionic conductivity of the eight gels (with the various chosen compositions) was determined at
room temperature from impedance measurements carried out at high frequencies. The conductivity
of the liquid electrolytes was measured using a conductivimeter (Crison Instruments, Alella, Spain),
to help the inference in the results of the geometry of the big cell used to carry out the measurements
in liquid electrolytes.
      X-ray photoelectron spectroscopy (XPS) spectra were recorded using a Fisons MT500 spectrometer
(Fison Instruments, East Grinstead, UK) fitted with a hemispherical electron analyzer (CLAM2) and a
non-monochromatic Mg Kα X-ray source operating at 300 W (1253.6 eV). The samples were fixed on
small flat discs supported on an XYZ manipulator placed in the analysis chamber. Residual pressure
in this ion-pumped analysis chamber was maintained below 10−9 Torr during the data acquisition.
The spectra were recorded at take-off angles of 90◦ and a pass energy of 20 eV, which is typical
of high-resolution conditions. High resolution spectra were acquired for Cr 2p, Fe 2p, and O 1s
photoemission regions. The acquisition area during the measurements was approximately 1 mm2 .
Six representative electrolyte compositions were chosen in order to study, with XPS, their possible
influence on the passive layer formed on the ground surfaces of the stainless steel. After exposures of
1 h to gel electrolytes made either of 0.5% agar or of 0.5% agar + 50% glycerol, and of either 0.5% NaCl
or 1% KClO4 , the surfaces of the sheets were studied. The surface of the stainless steel before and after
1 h of exposure to liquid electrolytes with 0.5% NaCl or 1% KClO4 was also analyzed for comparison.
The binding energies of the obtained spectra were calibrated with reference to the main peak of the C 1s
spectrum, at 285 eV. The Peakfit software (SeaSolve Software, Framingham, MA, USA) was employed
to analyze the data. The fitting of peaks and their deconvolution in the components corresponding to
the various chemical environments of the elements were carried out using Gauss–Lorentz functions,
after the subtraction of a Shirley background.
      The cell used for electrochemical measurements was based on a traditional three-electrode
cell, but specially designed to be portable (Figure 1a). The cell was a modified version of the one
proposed by Cano et al. [25]. This cell consisted of a two-piece methacrylate cylinder/cylindrical mold,
with a reference electrode, and a counter-electrode (CE) fixed by a nylon screw. The gel electrolyte was
cured inside the lowest part of the cell. The lowest part of the mold was removed to leave an exposed
gel cylinder, which was placed onto the working electrode. During the measurements, the gel was
determined as having a working area of approximately 2 cm2 on the component to be studied, for all
the studied regions but the crevice. Inside the crevice, the lateral surfaces of the gel cylinder also wet
the metal, and the measured surface was recalculated. A conventional cell with an exposed area of
0.50 cm2 of the working electrode was used for the measurements in liquid electrolyte. The reference
electrode was always a saturated calomel electrode (SCE), and the CE was a stainless-steel coiled wire.
      The open-circuit potential (OCP) was monitored for 45 min before the Mott–Schottky curves and
the EIS measurements were carried out on the flat stainless-steel samples. On the other hand, as these
measurements allowed checking that the OCP stabilization of the stainless steel in the gel was very
fast, and with the aim of designing a faster monitoring procedure for the sample in Figure 1, the OCP
was stabilized for 20 min before performing the electrochemical measurements.
Non-Destructive Electrochemical Testing for Stainless-Steel Components with Complex Geometry Using Innovative Gel Electrolytes - MDPI
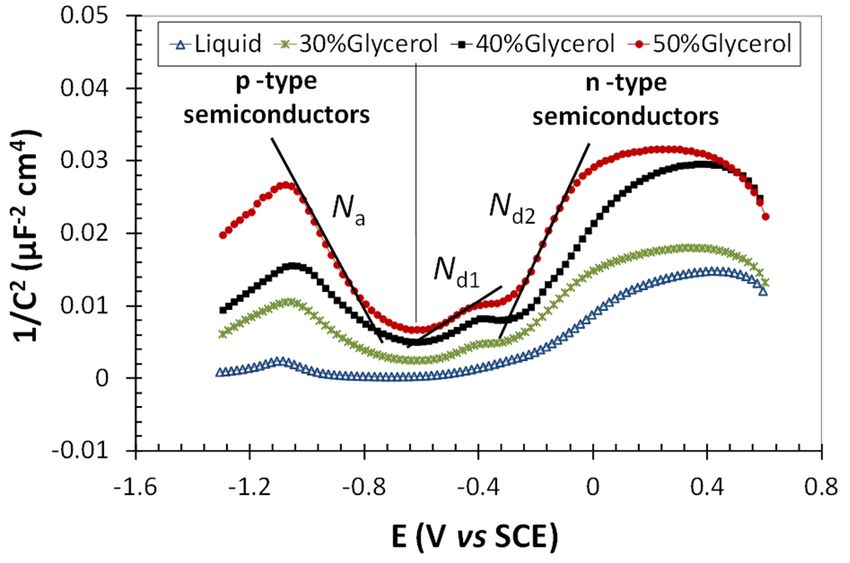
Metals 2018, 8, 500                                                                                  5 of 16

     The semiconductive properties of the passive film were determined by employing the Mott–
Schottky approach. Non-corrosive electrolytes with KClO4 and various glycerol contents on the flat
ground stainless-steel surfaces were used. The Mott–Schottky plots were obtained upon sweeping the
potential from 0.6 V to −1.3 V vs. the SCE, at a frequency of 1 kHz. These studies must be carried out
in an electrolyte where no corrosion takes place under anodic polarization; as such, gels and liquid
solutions with KClO4 were employed.
     EIS spectra were acquired at the OCP, over a frequency ranging from 10 kHz to 1 mHz, with five
points per decade, and using 10 mVrms as a sinusoidal perturbation. The measurements lasted about
1 h. The impedance spectra were fitted using electrical equivalent circuits with the Zview software
(Ametek, Berwyn, PA, USA). Electrolytes with NaCl and with KClO4 —liquid solutions and gels with
various glycerol contents—were tested on the flat ground AISI 304 sheets. Moreover, EIS measurements
were also performed for each region under study defined for the part in Figure 1.
     Each electrochemical measurement was repeated 3–4 times on the flat stainless-steel samples with
each of the eight electrolytes considered in this part of the study. During the study of the sample in
Figure 1, the measurements were repeated twice with each of the two selected electrolytes on the five
surfaces defined for the study. In the final case, the size of the sample did not allow an increase in the
multiplicity of the tests.

3. Results

3.1. Determination of Oxygen Content and Conductivity of the Electrolytes
      There are properties of the gels that can meaningfully affect the corrosion or the passivation
processes of the metals when they are exposed to such environments. The ability of the gels to dissolve
oxygen [30], as well as their conductivity, can be considered key factors. The results obtained from
the measurements of these parameters carried out in gels and in liquid electrolytes allow for a better
understanding of the results obtained with other techniques.
      When the gel was formulated with only agar and salt, its conductivity was quite similar to that
measured for liquid solutions of similar saline concentrations (Table 1). This can be understood bearing
in mind that the amount of agar added was much reduced. Moreover, agar comprises agarose, which
is an effective gelling agent, and agaropectine, which has an ionic behavior that contributes to the
conductivity [31]. The conductivity of the gels with plasticizer was somewhat lower than that of liquid
electrolytes with similar amounts of dissolved salts. The component of the gel that caused this decrease
seems to be the glycerol (conductivity of the gels with 30% glycerol were about double that of gels
with 50% glycerol). However, the use of glycerol in the formulations was essential to improve the
mechanical properties of the gels [28], and to provide the plasticity required for many of their planned
final applications. Thus, plasticizer additions cannot be avoided for measurements on complex-shaped
parts. The salts contributed to the conductivity, though no more than 1% KClO4 can be dissolved in
gels with 50% glycerol. The results in Table 1 also prove that the effect on the conductivity of a given
medium caused by the addition of 1% KClO4 was similar to that caused by the addition of 0.5% NaCl.

             Table 1. Conductivity of electrolytes with 0.5% NaCl or 1% KClO4 at room temperature.

                                                    Conductivity (mS/cm)
                Salt                                         Gel (0.5% Agar)
                          Liquid
                                      0% Glycerol     30% Glycerol    40% Glycerol    50% Glycerol
            0.5% NaCl     9.4 ± 0.2     11 ± 0.5        4.6 ± 0.3        3.2 ± 0.1       2.1 ± 0.1
            1% KClO4      8.6 ± 0.1     8.1 ± 0.7       4.9 ± 0.5        3.3 ± 0.4       2.5 ± 0.5
Non-Destructive Electrochemical Testing for Stainless-Steel Components with Complex Geometry Using Innovative Gel Electrolytes - MDPI
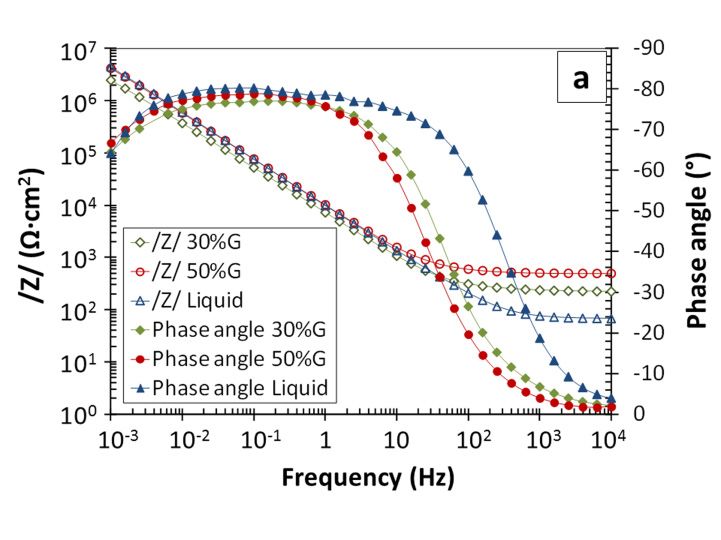
Metals 2018, 8, 500                                                                                                                      6 of 16

     Figure   2 shows
           Metals              thePEER
                   2018, 8, x FOR   comparative
                                        REVIEW         results obtained for the amounts of dissolved 6oxygen                 of 17   in gel
electrolytes and in liquid electrolytes. It can be observed that gel electrolytes presented a lower ability
                  Figure 2 shows the comparative results obtained for the amounts of dissolved oxygen in gel
of dissolving oxygen when compared with liquid electrolytes. In gels, the measured amounts of
           electrolytes and in liquid electrolytes. It can be observed that gel electrolytes presented a lower
oxygen were     roughly
           Metals
           ability2018, 8, x FORhalf
                     of dissolvingPEERthose  determined
                                        REVIEW
                                      oxygen  when compared    forwith
                                                                   liquid
                                                                       liquidsolutions.
                                                                               electrolytes.This   decrease
                                                                                             In gels,           in O2amounts
                                                                                                       the measured     solubility
                                                                                                                           6 of 17   seems
to be mainly    related
           of oxygen      wereto the   presence
                                  roughly          of agar,
                                           half those         as thefor
                                                        determined     increase      in glycerol
                                                                          liquid solutions.   This up    to 50%
                                                                                                    decrease   in Odid  not significantly
                                                                                                                    2 solubility
                 Figure 2 shows the comparative results obtained for the amounts of dissolved oxygen in gel
           seems toobtained
affect the electrolytes
           values       be mainly for related
                                          the to
                                               O2theconcentration.
                                                      presence of agar,The  as the
                                                                                saltincrease
                                                                                      added  in(0.5%
                                                                                                glycerol    up toor50%
                                                                                                         NaCl        1%adid
                                                                                                                         KClO not
                            and in liquid   electrolytes.  It can be observed      that gel electrolytes   presented      lower 4 ) did not
           significantly affect the values obtained for the O2 concentration. The salt added (0.5% NaCl or 1%
affect the ability
           resultsofeither.
                       dissolving  Foroxygen
                                        passive
                                              whenstainless
                                                     comparedsteels,     this electrolytes.
                                                                 with liquid   decrease in   In O 2 concentration
                                                                                                gels,                    does not have a
                                                                                                      the measured amounts
           KClO4) did not affect the results either. For passive stainless steels, this decrease           in O2 concentration
foreseeableof oxygen
              effect      were
                         on the  roughly   half
                                    corrosion   those  determined
                                                 kinetics,           for  liquid
                                                              thoughkinetics,     solutions.
                                                                         it couldthough       This
                                                                                      exertitsome  decrease   in
                                                                                                      influence   O   solubility
                                                                                                                    on active  on processes
                                                                                                                    2
           does   not have     a foreseeable  effect on the corrosion                         could exert   some influence
where theseems
           active
                    to be mainly related to the presence of agar, as the increase in glycerol up to 50% did not
            O2 reduction
                    processes wherewould thebe
                                             O2 the  controlling
                                                reduction   would bestep.
                                                                       the controlling step.
              significantly affect the values obtained for the O2 concentration. The salt added (0.5% NaCl or 1%
              KClO4) did not affect the results either. For passive stainless steels, this decrease in O2 concentration
              does not have a foreseeable effect on the corrosion kinetics, though it could exert some influence on
              active processes where the O2 reduction would be the controlling step.

                               Figure 2. Amount of oxygen dissolved in the various electrolytes under study.
                      Figure 2. Amount of oxygen dissolved in the various electrolytes under study.
              3.2. Effect of the Electrolyte on the Chemical Composition and Electronic Properties of the Passive Film
3.2. Effect of theThe
                   Electrolyte
                      effectFigureon
                              of the  the Chemical
                                      electrolytes
                                   2. Amount       on Composition
                                              of oxygenthe  chemical
                                                        dissolved
                                                                       and   Electronic
                                                                       composition
                                                                  in the
                                                                                           Properties
                                                                                       of the
                                                                         various electrolytes  passive
                                                                                              under
                                                                                                        of theformed
                                                                                                        films
                                                                                                    study.
                                                                                                               PassiveonFilm
              stainless steel was assessed using XPS. The results prove that the passive films on AISI 304 stainless
      The effect   of the
           steelEffect
                  are  alwayselectrolytes
                                 composed       on   the and
                                                of Chemical
                                                    iron   chemical
                                                                chromium composition
                                                                                 compounds.   ofFigure
                                                                                                 the passive
                                                                                                         3 shows  films   formed
                                                                                                                    examples         on stainless
           3.2.        of the Electrolyte   on the             Composition      and Electronic Properties  of the Passive Film of the
steel was assessed
           deconvolution  using     XPS.outThe
                               carried         for results
                                                    the Cr 2p  prove
                                                                 3/2, Fe that
                                                                          2p3/2, the
                                                                                  and passive
                                                                                        O 1s peaks films
                                                                                                      from onthe
                                                                                                               AISIXPS304     stainless
                                                                                                                        spectra.   The steel are
                 The effect of the electrolytes on the chemical composition of the passive films formed on
           chromiumof
always composed          peak   (Figure
                             iron   and   3a) was characterized
                                           chromium                   by the presence
                                                             compounds.            Figure of3Cr(0)
                                                                                                showswithexamples
                                                                                                          a characteristic
                                                                                                                        of   energy
                                                                                                                            the      of
                                                                                                                                  deconvolution
           stainless steel was assessed using XPS. The results prove that the passive films on AISI 304 stainless
           574.3 ± 0.2 eV, while Cr(III) as an oxide and Cr(III) as a hydroxide featured 576.4 ± 0.3 eV and 577.6 ±
carried out    for  the    Cr   2p
           steel are always composed3/2 ,  Fe   2p
                                                of iron  , and     O   1s   peaks     from     the   XPS    spectra.
                                                    3/2 and chromium compounds. Figure 3 shows examples of the          The     chromium    peak
           0.2 eV, respectively [32]. The Fe 2p3/2 ionization spectrum was deconvoluted into four different
(Figure 3a)deconvolution
              was characterized                                                                                                    The ± 0.2 eV,
                             (Figure 3b).by      the
                                                   thepresence
                                                      contributionsof     Cr(0)     with
                               carried out for            Cr 2p3/2, Fe 2p    3/2, and  O 1sa peaks
                                                                                               characteristic
                                                                                                      from the XPS energy     of 574.3
                                                                                                                        spectra.
           contributions                     These                      were    assigned   to the  presence of Fe(0)   with energies
           chromium     peak (Figure      3a)Cr(III)
                                              was characterized       by the presence of Cr(0)      with a characteristic   energy of ± 0.2 eV,
while Cr(III)    as an
           of 707.0   ± 0.2oxide     and
                             eV, Fe(II)   with 710.3 ±as0.2aeV,  hydroxide
                                                                     Fe(III) withfeatured         eV, and±a satellite
                                                                                    711.4 ± 0.2 576.4         0.3 eV ofand Fe(II)577.6
                                                                                                                                  with
           574.3 ± 0.2 eV, while Cr(III) as an oxide and Cr(III) as a hydroxide featured 576.4 ± 0.3 eV and 577.6 ±
           715.0
respectively      ± 0.2
               [32].   TheeV Fe
                              [33].2p
                                    As  previously reported,
                                      3/2 ionization        spectrum an accurate     discrimination among
                                                                            was deconvoluted                   Fe(III)different
                                                                                                        into four      contributions
                                                                                                                                   contributions
           0.2 eV, respectively [32].        The Fe 2p3/2 ionization spectrum was deconvoluted into four different
           from oxides, hydroxides, or oxihydroxides is a very difficult task [34]. The oxygen peak (Figure 3c)
(Figure 3b).   These contributions
           contributions                      werecontributions
                             (Figure 3b). These         assigned to       theassigned
                                                                       were      presence     of Fe(0)
                                                                                          to the  presencewith   energies
                                                                                                             of Fe(0)          of 707.0 ± 0.2 eV,
                                                                                                                       with energies
           was deconvoluted into three components. The first component (corresponding to Fe and/or Cr
Fe(II) withof 707.0 ±±0.2
             710.3                              710.3 ± 0.2 eV,±Fe(III)                                                             ±
                     was0.2    eV,   Fe(III)
                                          with with
                                           at 530.0 ± 711.4
                                                         0.2 eV, the0.2    eV,    and   a ±satellite   of Fe(II)    with    715.0with
                                                                                                                                    Cr0.2 eV [33].
                             eV, Fe(II)                                      with   711.4    0.2 eV, and   a satellite of Fe(II)
           oxides)          positioned                                  second     component     (corresponding     to Fe and/or
           715.0
As previously     ± 0.2  eV
                 reported,    [33]. As  previously      reported,    an accurate    discrimination    among    Fe(III) contributions
           hydroxides)      wasan    accurate
                                 positioned     at discrimination
                                                   531.7 ± 0.2 eV, and     among      Fe(III)
                                                                              the third         contributions
                                                                                         component     (related tofrom     oxides,
                                                                                                                     adsorbed    waterhydroxides,
           from oxides, hydroxides, or oxihydroxides is a very difficult task [34]. The oxygen peak (Figure 3c)
           [18]) was is
or oxihydroxides       positioned
                           a very    at 533.0 ± task
                                     difficult    0.2 eV.[34]. The oxygen peak (Figure 3c) was deconvoluted into three
           was deconvoluted into three components. The first component (corresponding to Fe and/or Cr
components.     Thewas
           oxides)    firstpositioned
                             component        (corresponding
                                          at 530.0    ± 0.2 eV, theto     Fe and/or
                                                                        second            Cr oxides)
                                                                                   component             was positioned
                                                                                                 (corresponding                     Cr ± 0.2 eV,
                                                                                                                               at 530.0
                                                                                                                    to Fe and/or
the secondhydroxides)
              component    was(corresponding
                                 positioned at 531.7to        Fe eV,
                                                           ± 0.2   and/or
                                                                       and the  Crthird
                                                                                     hydroxides)
                                                                                         component was        positioned
                                                                                                       (related                   531.7 ± 0.2 eV,
                                                                                                                 to adsorbedatwater
           [18])component
and the third    was positioned      at 533.0to
                                  (related      ± 0.2  eV.
                                                   adsorbed       water [18]) was positioned at 533.0 ± 0.2 eV.

       Figure 3. Examples of the deconvolution carried out for the spectral peaks of (a) Cr 2p3/2 , (b) Fe 2p3/2 ,
       and (c) O 1s from the X-ray photoelectron spectroscopy (XPS) spectra of the passive films. The peaks
       shown in the images correspond to stainless steel after being exposed for 1 h to the agar + glycerol
       electrolyte with 0.5% NaCl.
Non-Destructive Electrochemical Testing for Stainless-Steel Components with Complex Geometry Using Innovative Gel Electrolytes - MDPI
Metals
Metals2018,
       2018,8,8,xxFOR
                   FORPEER
                      PEERREVIEW
                           REVIEW                                                                                               77of
                                                                                                                                   of17
                                                                                                                                      17

     Figure
      Figure3. 3.Examples
                   Examplesof  ofthe
                                  thedeconvolution
                                     deconvolutioncarried
                                                      carriedout
                                                               outforforthe
                                                                         thespectral
                                                                             spectralpeaks
                                                                                     peaksof  of(a)
                                                                                                 (a)CrCr2p   3/2,,(b)
                                                                                                          2p3/2    (b)Fe
                                                                                                                      Fe2p   3/2,,
                                                                                                                          2p3/2
     and
      and(c)
           (c)O O1s1sfrom
                      fromthetheX-ray
                                 X-rayphotoelectron
                                       photoelectronspectroscopy
                                                       spectroscopy(XPS)(XPS)spectra
                                                                               spectraof
                                                                                       ofthe
                                                                                          thepassive
                                                                                               passivefilms.
                                                                                                          films.The Thepeaks
                                                                                                                         peaks
     shown
      shown in  in the
                    the images
                         images correspond
                                 correspond to
                                             to stainless
                                                 stainless steel
                                                            steel after
                                                                  after being
                                                                         being exposed
                                                                                exposed for
                                                                                         for 11 hh to
                                                                                                    to the
                                                                                                        the agar
                                                                                                            agar ++ glycerol
                                                                                                                      glycerol
Metals 2018, 8, 500                                                                                                              7 of 16
     electrolyte
      electrolytewithwith0.5%
                           0.5%NaCl.
                                NaCl.

      Some
       Some    informative
       Some informative         results
                informativeresults         obtained
                                 resultsobtained
                                           obtained    from
                                                        from
                                                     from   thethe
                                                                the
                                                                 XPSXPS
                                                                     XPS  analysis
                                                                          analysis
                                                                      analysis      are
                                                                                     are plotted
                                                                                are plottedplotted  in
                                                                                                     in Figures
                                                                                              in Figures   4 and 45.
                                                                                                         Figures  4 and
                                                                                                                      The 5.
                                                                                                                      and  5. The
                                                                                                                              The
                                                                                                                          results
results
 results
 from    from
       thefrom   the
                  theair-formed
                           passivepassive
                      air-formed
             air-formed               layer onlayer
                                      passive    layer  on
                                                         onthe
                                                  the initial    initial
                                                                  initialground
                                                             theground   ground   stainless-steel
                                                                                           surface surface
                                                                                   stainless-steel
                                                                         stainless-steel              surface
                                                                                                     were      were
                                                                                                               werecompared
                                                                                                            compared   compared
                                                                                                                         to those
to
 to those
     those   obtained
             obtained   after
                         after   11 hh of
                                        of  exposure
                                             exposure    at
                                                          at room
                                                              room   temperature
                                                                      temperature    to
                                                                                      to three
                                                                                          three  different
                                                                                                  different
 obtained after 1 h of exposure at room temperature to three different 0.5% agar-based electrolytes          0.5%
                                                                                                              0.5%   agar-based
                                                                                                                      agar-based
electrolytes
 electrolytes
(with            (with
        0.5% NaCl,      0.5%
                  (withwith
                         0.5%    NaCl,
                               50%NaCl,    with
                                           withand
                                     glycerol     50%
                                                  50%    glycerol
                                                             NaCl,and
                                                         glycerol
                                                      0.5%           and 0.5%
                                                                     and         NaCl,
                                                                           0.5%50%
                                                                          with   NaCl,   and
                                                                                          and with
                                                                                      glycerol  with
                                                                                                and 1% 50%
                                                                                                        50%  glycerol
                                                                                                              glycerol
                                                                                                           KClO          and
                                                                                                                         and 1%1%
                                                                                                                 4 ). The results
KClO
 KClO44).). The
 obtained   The
             fromresults
                  results obtained
                    the study     of thefrom
                           obtained      from  the
                                                the study
                                          passive    study of
                                                    layers   of the
                                                                 the passive
                                                              formed passive  layers
                                                                               layers
                                                                       in liquid      formed
                                                                                       formed in
                                                                                  electrolytes   inliquid
                                                                                                     liquid
                                                                                                 (0.5%      electrolytes
                                                                                                         NaClelectrolytes
                                                                                                                and 1% KClO(0.5%
                                                                                                                            (0.5%
                                                                                                                                4)
NaCl
 NaCl   and
        and   1%
              1%   KClO
                   KClO    )) were
                              were
were also included in the figures.
                         44          also
                                     also  included
                                            included   in
                                                        in the
                                                            the figures.
                                                                 figures.

      Figure
      Figure 4.4. Ratios
                  Ratios derived
                          derived from
                                   from the
                                         the fitting
                                              fitting of
                                                       of peaks
                                                          peaks of
                                                                of the
                                                                    the XPS
                                                                         XPS spectra
                                                                              spectra of
                                                                                      of the
                                                                                          the stainless-steel
                                                                                               stainless-steel surfaces
                                                                                                                surfaces
      Figure 4. Ratios derived from the fitting of peaks of the XPS spectra of the stainless-steel surfaces
      before
      beforeand
      before andafter
             and   afterbeing
                   after beingin
                         being incontact
                               in contactwith
                                  contact  withthe
                                          with    theliquid
                                                 the  liquidand
                                                     liquid  andgel
                                                             and  gelelectrolytes.
                                                                 gel  electrolytes.
                                                                      electrolytes.

      Figure
       Figure 5.
      Figure     5. Relative
                5.  Relative amounts
                    Relative  amounts of
                              amounts    of cations
                                         of  cations detected
                                            cations   detected using
                                                      detected   using XPS
                                                                 using XPS for
                                                                       XPS   for the
                                                                             for  the passive
                                                                                  the passive layer
                                                                                      passive  layer formed
                                                                                               layer  formed on
                                                                                                     formed  on stainless
                                                                                                             on  stainless
                                                                                                                stainless
      steels
       steels in
               in air
                  air and
                      and after
                           after being
                                 being exposed
                                        exposed   to
                                                   tothe
                                                      the liquid
                                                           liquid and
                                                                  and gel
                                                                      gel electrolytes.
                                                                           electrolytes.
      steels in air and after being exposed to the liquid and gel electrolytes.

      Figure
      Figure44shows
                 showsthe
                        theatomic
                             atomicratio
                                     ratioof
                                           ofthe
                                              theoxidized
                                                  oxidizedandandelemental
                                                                  elementalmetals
                                                                              metalsobtained
                                                                                     obtainedfromfromthetheareas
                                                                                                            areasof
                                                                                                                  of
      Figure 4 shows the atomic ratio of the oxidized and elemental metals obtained from the areas of the
the
 the Fe
      Fe 2p
         2p and
             and CrCr 2p
                       2p photoemission
                            photoemission peaks
                                              peaks from
                                                       from the
                                                             the passive
                                                                  passive layer.
                                                                            layer. From
                                                                                   From this
                                                                                          this ratio,
                                                                                                 ratio, qualitative
                                                                                                         qualitative
 Fe 2p and Cr 2p photoemission peaks from the passive layer. From this ratio, qualitative information
information
 information related
               related to
                        to the
                            the thickness
                                 thickness of
                                            of the
                                                the passive
                                                     passive layer
                                                              layer can
                                                                     can be
                                                                         be worked
                                                                              worked out
                                                                                       out [2].
                                                                                            [2]. Obtained
                                                                                                 Obtained results
                                                                                                             results
 related to the thickness of the passive layer can be worked out [2]. Obtained results suggest that the
suggest
 suggest that
          that the
                the passive
                    passive layers
                              layers on
                                      on surfaces
                                          surfaces in
                                                    in contact
                                                        contact with
                                                                with the
                                                                      the gel
                                                                          gel electrolytes
                                                                               electrolytes presented
                                                                                             presented relatively
                                                                                                          relatively
passive layers on surfaces in contact with the gel electrolytes presented relatively similar thicknesses,
 and were slightly thinner than the passive film corresponding to the initial steel. On the contrary,
 surfaces in contact with liquid electrolytes exhibited the thickest passive films. The thickness of the
passive layer was especially high after being in contact with the NaCl liquid electrolyte. It seems that
Non-Destructive Electrochemical Testing for Stainless-Steel Components with Complex Geometry Using Innovative Gel Electrolytes - MDPI
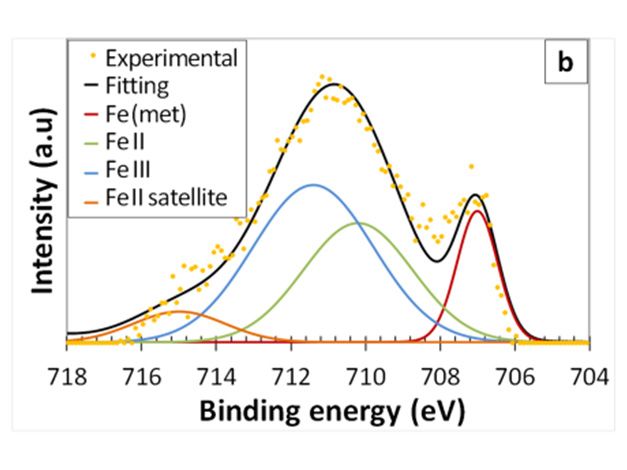
Metals 2018, 8, 500                                                                                  8 of 16

the oxide/hydroxide formation reactions were better promoted in liquid media when compared with
the gels. This result could be related to the lower oxygen concentrations in the gels (Figure 2) that
could limit the process of oxide formation on their surfaces.
     The ratio between the oxides and hydroxides contained in the studied passive layers was
calculated from the deconvolution of the oxygen peaks, and they are plotted in Figure 4. For all
studied surfaces, the amounts of hydroxides detected were higher than those corresponding to the
oxides. These ratios between hydroxides/oxides are often found for XPS studies of passive stainless
steels [35], and they are clearly related to the higher sensitivity of the technique to the compounds
comprising the outermost layers of the material. From the ratio of hydroxides to oxides, it can be
deduced that gel electrolytes promoted the presence of hydroxides in the passive film. This could be
related to the fact that the gels had a lower ability of dissolving oxygen, thus causing oxide formation
(Figure 2).
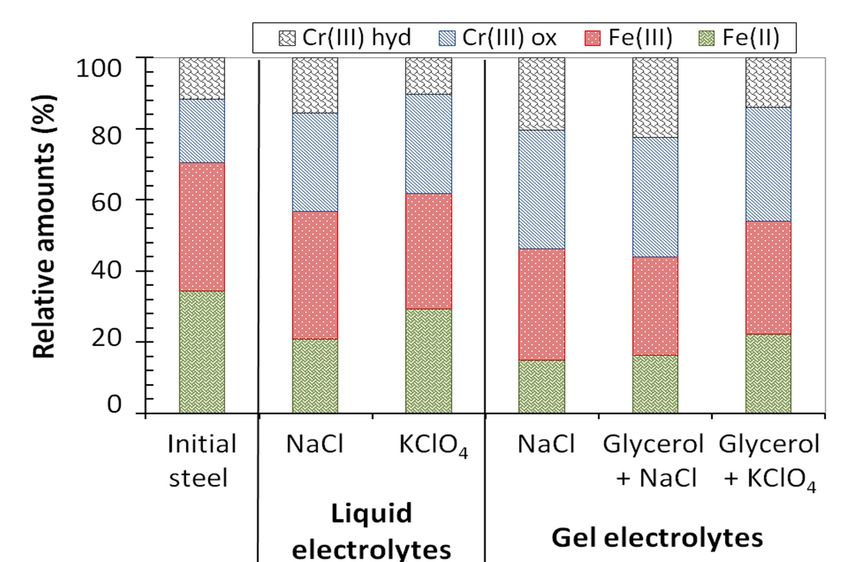
     Moreover, the amounts of Fe and Cr species in the passive layers are usually considered a good
indicator of their protective nature [2]. In Figure 5, the relative amounts of Fe and Cr compounds in
the oxide layer are plotted. The air-formed passive layer on the initial steel mainly comprised iron
compounds. The Fe(III)/Fe(II) ratio was about 1, being compatible with the fact that the iron cations
were mainly in the form of magnetite. Fe3 O4 is traditionally assumed to be the most common iron
oxide in the passive layers of stainless steels [34,36]. Exposure to the various tested electrolytes tended
to decrease the Fe(II) percentage in the passive layer. This fact could perhaps suggest the presence of
Fe2 O3 in the passive layer [37]. However, in the case of the passive layer exposed to gel electrolytes,
the formation of Fe(III) hydroxides was also highly probable, due to the high amount of hydroxyl
anions detected (Figure 4). The Fe(III)/Fe(II) ratio that can be deduced from the results in Figure 5 was
higher after gel exposure than after liquid exposure, which was coherent with a meaningful presence
of Fe(III) hydroxides in the outer region of the passive layer after gel exposure. On the other hand,
the Fe(III)/Fe(II) ratios that can be calculated from the results in Figure 5 were higher in electrolytes
with NaCl than in electrolytes with KClO4 , with the difference being more noticeable after liquid
exposure. These results suggest that the higher aggression of the NaCl promoted a higher oxidation
level of the iron cations.
     The exposure to the studied electrolytes increased the chromium cation percentage in the passive
layer. The increase in Cr(III) was related both to oxide and hydroxide compounds. The Cr(III)
percentage did not differ significantly when considering gel and liquid electrolytes.
     A relevant conclusion that can be drawn from the comparison of results in Figures 4 and 5
corresponding to samples exposed to gels with NaCl (without glycerol and with 50% glycerol) is that
the presence of glycerol in the gel did not change either the thickness or the chemical composition
of the passive layer. Moreover, although the results showed that the contact of the metal with gel
electrolytes produced a modification of passive layer, it needed to be very fast to be in accordance with
the previously reported fast stabilization of OCP in gel electrolytes [28].
     The protective ability of the passive films formed on stainless steels does not only depend on the
chemical nature of the film, but also on their stoichiometry. The dopant density of the compounds
forming the passive film plays an important role in corrosion resistance [1], and can help achieve
a better understanding of the eventual performance of stainless steels in corrosive environments.
The Mott–Schottky method is a valid tool to determine the dopant density (N) in the surface oxides.
This approach assumes that the charge distribution at the semiconductor/solution interface is usually
determined by measuring electrode capacitance (C), as a function of electrode potential [1,34]. N can
be calculated from the slope of the plots of experimental C−2 versus E, using the following expression:
                                                                
                                      1      2                kT
                                         =          E − EFB −      ,                                    (1)
                                      C2   εε 0 N              e

where e is the electron charge (1.602 × 10⁻¹⁹ C), ε is the dielectric constant of the passive film
(usually taken as 15.6 for oxides formed on stainless steel [13,16,17]), ε0 is the vacuum permittivity
Non-Destructive Electrochemical Testing for Stainless-Steel Components with Complex Geometry Using Innovative Gel Electrolytes - MDPI
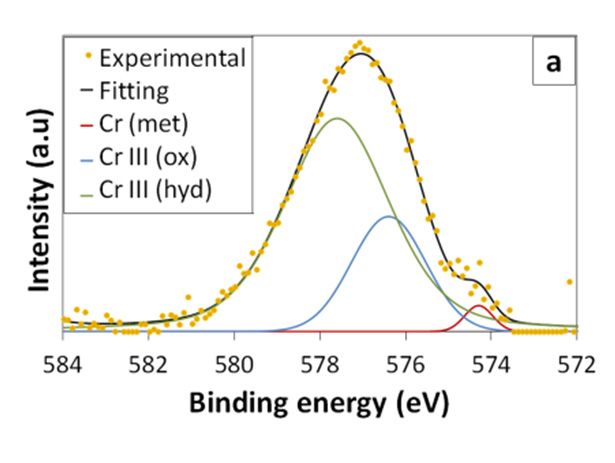
Metals 2018, 8, x FOR PEER REVIEW                                                                                                 9 of 17

Metals 2018, 8, 500                                                                                                               9 of 16
where e is the electron charge (1.602 × 10⁻¹⁹ C), ε is the dielectric constant of the passive film (usually
taken as 15.6 for oxides formed on stainless steel [13,16,17]), ε0 is the vacuum permittivity (8.854 ×
(8.854   × 10−k14isF/cm),
10−14 F/cm),                 k is the Boltzmann
                     the Boltzmann                  constant
                                       constant (1.38           J/K),×
                                                        × 10−23(1.38      is −
                                                                        T 10   23 J/K), T is the absolute temperature,
                                                                             the   absolute temperature, and EFB is the
and   E FB potential. This expression can be used for the calculation the
flat-band  is the  flat-band    potential.  This  expression   can   be  used   for       calculation
                                                                                      of donor        of donor
                                                                                                densities        densities
                                                                                                          (Nd), as well as
(N   ), as welldensities
of dacceptor     as of acceptor
                            (Na). densities (Na ).
       Representative
       Representative results
                           resultsfrom
                                    fromthethecurves
                                                curvesobtained
                                                        obtained forfor
                                                                      thethe
                                                                           Mott–Schottky
                                                                              Mott–Schottky   analysis of the
                                                                                                 analysis     studied
                                                                                                           of the      gel
                                                                                                                  studied
electrolytes   are  shown    in Figure  6.  A curve  obtained
gel electrolytes are shown in Figure 6. A curve obtained for thefor  the  KClO      liquid electrolyte was  also included
                                                                                  4 KClO4 liquid electrolyte was also
in  the figure
included         for comparison.
             in the                   The valuesThe
                      figure for comparison.        of the C−2 of
                                                        values   parameter       for a givenfor
                                                                     the C−2 parameter         E were  clearly
                                                                                                 a given       higher
                                                                                                          E were       for
                                                                                                                   clearly
surfaces
higher for exposed
              surfaces to exposed
                          the gel electrolytes   than for those
                                     to the gel electrolytes   thanexposed     to liquid
                                                                       for those    exposedones.
                                                                                              to Moreover,
                                                                                                 liquid ones.these values
                                                                                                               Moreover,
tended    to increase
these values    tended   with  increasing
                           to increase  withglycerol  content
                                               increasing       of thecontent
                                                           glycerol     gels. of the gels.

      Figure 6. Examples
                 Examplesofofthe
                              theMott–Schottky
                                  Mott–Schottkycurves
                                                 curvesobtained in in
                                                         obtained   thethe
                                                                         liquid andand
                                                                            liquid  gelgel
                                                                                        electrolytes with
                                                                                           electrolytes   1%
                                                                                                        with
      KClO
      1%   4. 4 .
         KClO

      For all
      For  all results
               resultsobtained
                         obtainedin    inthe
                                           thegel
                                                gelelectrolytes,
                                                     electrolytes,three
                                                                      threemean
                                                                             meanslopeslope   regions
                                                                                            regions   cancan
                                                                                                           bebe   identified
                                                                                                               identified       (Figure
                                                                                                                             (Figure   6).
6).  The  negative   slope     corresponds       to  compounds         in the   passive   film
The negative slope corresponds to compounds in the passive film with p-type semiconductivity,     with  p-type   semiconductivity,
while the
while   the positive
             positive slopes
                         slopes found
                                   found for forpotentials
                                                 potentialshigherhigherthan
                                                                          than−  −0.6  V vs.
                                                                                   0.6 V   vs. SCE
                                                                                                SCE correspond
                                                                                                      correspond to    to compounds
                                                                                                                          compounds
with n-type
with   n-typesemiconductivity.
                 semiconductivity.       TheTheXPSXPS      results
                                                     results          (Figures
                                                               (Figures   4 and 5)4 showed
                                                                                     and 5) showed          that the
                                                                                                 that the passive        passive
                                                                                                                      film          film
                                                                                                                            comprised
comprised     chromium         and   iron   oxides,   as   well  as  chromium       and   iron   hydroxides.
chromium and iron oxides, as well as chromium and iron hydroxides. Cr2 O3 and Cr-rich Fe-Cr spinels              Cr  2O3 and Cr-rich

Fe-Cr spinels
behave            behave
          as p-type            as p-type semiconductors
                       semiconductors          [37]. Hence, the[37].       Hence,
                                                                     negative        the in
                                                                                 slopes    negative
                                                                                              curves,slopes
                                                                                                        such asinthose
                                                                                                                     curves,    such as
                                                                                                                           in Figure    6,
are used to calculate the doping density of chromium or chromium-rich oxides [38], that is to say,[38],
those  in  Figure   6, are    used   to calculate    the   doping    density    of chromium        or chromium-rich        oxides    Na .
that is
      Ontothe
            say,other
                 Na. hand, iron oxides assumed to be present in the passive layers (Figure 5) usually
behaveOnasthe   othersemiconductors
             n-type      hand, iron oxides    due assumed        to be of
                                                    to the presence      present    in the passive
                                                                            Fe(II) cations    in Fe(III)layers   (Figure
                                                                                                          positions     due 5)
                                                                                                                             to usually
                                                                                                                                oxygen
vacancies [39]. Thus, the doping density of the iron oxides in the passive layers of stainlessdue
behave    as  n-type     semiconductors          due    to  the  presence     of  Fe(II)   cations    in  Fe(III)  positions           to
                                                                                                                                  steels
oxygen    vacancies     [39].   Thus,    the   doping     density    of the  iron   oxides    in  the
was calculated from the positive slope defined at high values of E [38]. These values are hereafter    passive   layers    of  stainless
steels was
termed    Nd2 .calculated from the positive slope defined at high values of E [38]. These values are
hereafter   termed Nof
      The existence       d2.
                              another positive slope clearly defined at medium potentials for passive layers
exposed to gels allowsanother
      The   existence     of   Nd1 to be  positive    slopeThe
                                             calculated.       clearly   defined
                                                                   existence        at medium
                                                                                of two   positivepotentials
                                                                                                     slopes in thefor Mott–Schottky
                                                                                                                        passive layers
exposed    to  gels allows      N d1 to be calculated. The existence of two positive slopes in the Mott–Schottky
curves was already reported in the literature by other authors studying stainless-steel surfaces [40].
curves
The      was already
      existence             reported
                  of a double            in the
                                     slope        literature
                                              reflects          by other of
                                                         the existence      authors     studying
                                                                                two donor      levelsstainless-steel
                                                                                                        in the passive   surfaces
                                                                                                                             layer [40].
                                                                                                                                    [41].
The   existence   of   a  double     slope    reflects   the   existence    of  two   donor    levels
Some authors attempted relating the origin of an additional donor level to various factors such as a    in the   passive    layer   [41].
Some authors attempted
non-homogenous          doping relating
                                   distributionthe origin
                                                     over theof semiconductor
                                                                 an additional donor  [42] orlevel   to various factors
                                                                                                the electrochemical           such asofa
                                                                                                                           behavior
non-homogenous           doping      distribution     over    the  semiconductor        [42]   or
spinels [40]. The contribution of hydroxides to the semiconductivity was often neglected in many   the  electrochemical       behavior
                                                                                                                                  of the
of  spinels  [40]. The     contribution      of  hydroxides       to the  semiconductivity         was
previously published studies, but some authors reported results that seemed to prove that hydroxides     often  neglected      in many
of then-type
have     previously      published studies,
                semiconductivity          [43,44]. but
                                                     Hence,some    authors
                                                                bearing        reported
                                                                           in mind    thatresults     that seemed
                                                                                             the presence               to proveinthat
                                                                                                              of hydroxides          the
passive layers is favored in gel electrolytes (Figure 4), and that the donor level at medium values of E of
hydroxides      have     n-type     semiconductivity          [43,44].    Hence,    bearing      in  mind    that   the   presence     is
hydroxides in the passive layers is favored in gel electrolytes (Figure 4), and that the donor level at
Non-Destructive Electrochemical Testing for Stainless-Steel Components with Complex Geometry Using Innovative Gel Electrolytes - MDPI
Metals 2018, 8, 500                                                                                                    10 of 16
Metals 2018, 8, x FOR PEER REVIEW                                                                                      10 of 17

medium
not       values of
    well defined   in E
                      theisMott–Schottky
                           not well defined     in the
                                             curves     Mott–Schottky
                                                     performed           curves
                                                                 in liquid       performed
                                                                            electrolyte       in 6),
                                                                                        (Figure  liquid   electrolyte
                                                                                                     the hypothesis
(Figure  6), the hypothesis   that hydroxides     are
that hydroxides are related to Nd1 becomes feasible.   related to N d1 becomes feasible.

     The N Na and
               and N Nd values  estimated from the slope of the straight lines of C−−22 vs.   vs. E   of the
                                                                                                         the passive
                                                                                                              passive
     The     a        d values estimated from the slope of the straight lines of C                 E of
films formed    in various  electrolytes  are  shown    in Figure 7. As  the positive slope  at medium
films formed in various electrolytes are shown in Figure 7. As the positive slope at medium values          values of
E  was  not  clearly  defined  for  measurements       carried  out  in liquid  electrolytes, perhaps
of E was not clearly defined for measurements carried out in liquid electrolytes, perhaps due to the      due  to the
lower amount
lower  amount of  of hydroxides
                     hydroxides inin their
                                      their surface
                                            surface (Figure
                                                     (Figure4),
                                                              4),no
                                                                  novalue
                                                                      valuecorresponding
                                                                             correspondingto  toNNd1 was
                                                                                                       was included
                                                                                                            included
                                                                                                  d1
in the figure.
in the figure.

      Figure 7.
      Figure  7. Effect
                 Effect of
                        of liquid
                            liquid and
                                   and gel
                                       gel electrolytes
                                            electrolytes with
                                                         with 1%
                                                               1%KClO
                                                                 KClO4 on
                                                                       on acceptor
                                                                          acceptor densities
                                                                                   densities (N
                                                                                              (Na)) and
                                                                                                    and donor
                                                                                                        donor
                                                                     4                          a
      densities (N d) for the compounds comprising the passive layer.
      densities (Nd ) for the compounds comprising the passive layer.

      The order of magnitude obtained for the charge-carrier densities (Figure 7) is close to that
     The order of magnitude obtained for the charge-carrier densities (Figure      7) is close to that reported
reported in the literature for stainless steel in alkaline electrolytes
                                                                  20  21(1020–10321 at/cm3) [36,45]. Obtained
in the literature for stainless steel in alkaline electrolytes (10 –10 at/cm ) [36,45]. Obtained Na and
Na and Nd values were higher in liquid electrolytes than in gel electrolytes. Hence, the thicker
Nd values were higher in liquid electrolytes than in gel electrolytes. Hence, the thicker passive layers
passive layers formed in liquid electrolytes (Figure 4) were more disordered than the thinner ones
formed in liquid electrolytes (Figure 4) were more disordered than the thinner ones formed in gels.
formed in gels. It was demonstrated that the more ordered, less defective passive layers are related
It was demonstrated that the more ordered, less defective passive layers are related to higher corrosion
to higher corrosion resistance [10]. As chromia acts as main barrier for ion diffusion, the decrease in
resistance [10]. As chromia acts as main barrier for ion diffusion, the decrease in Na value for gel
Na value for gel electrolytes can be considered relevant and related to the lower amount of iron
electrolytes can be considered relevant and related to the lower amount of iron oxides formed in the
oxides formed in the passive layer (Figures 4 and 5). It is logical that less conductive, passive layers
passive layer (Figures 4 and 5). It is logical that less conductive, passive layers tend to grow less
tend to grow less and become thinner than more conductive, passive layers when exposed to similar
and become thinner than more conductive, passive layers when exposed to similar environments.
environments. However, the possible influence of the lower O2 content of the medium on the
However, the possible influence of the lower O2 content of the medium on the thickness of the oxide
thickness of the oxide layer cannot be forgotten.
layer cannot be forgotten.
      In Figure 7, a slight decrease in Na and Nd1 of the passive layers is also visible with increasing
     In Figure 7, a slight decrease in Na and Nd1 of the passive layers is also visible with increasing
glycerol content, but it can be considered almost      negligible.
glycerol content, but it can be considered almost negligible.
3.3. Non-Destructive
3.3. Non-Destructive Electrochemical
                         Electrochemical Measurements
                                           Measurements in    in Gel
                                                                 Gel Electrolytes
                                                                      Electrolytes with
                                                                                    with Various
                                                                                          Various Compositions
                                                                                                    Compositions
       MeasurementsofofOCP
      Measurements           OCP are are   relatively
                                      relatively  simple, simple,
                                                             but at but   at the
                                                                    the same        same
                                                                                time,  theytime,
                                                                                            provide they   provide
                                                                                                       useful           useful
                                                                                                                 information
information
about          aboutor
        the passive    the  passive
                         active       or of
                                 states  active  states ofsystems.
                                            the studied       the studied
                                                                        Thesystems.     The stable
                                                                              stable values           values
                                                                                               obtained    for obtained    for
                                                                                                                flat surfaces
flat surfaces  using    various   electrolytes   are   summarized       in  Table   2. When
using various electrolytes are summarized in Table 2. When the OCP of the systems with liquid   the  OCP     of  the systems
with liquid were
electrolytes  electrolytes
                    compared weretocompared      to that
                                     that obtained     with obtained
                                                              gels withwith
                                                                          thegels  withglycerol
                                                                               lowest    the lowest    glycerol
                                                                                                   content,        content,
                                                                                                              it can  be seenit
can be
that  theseen  that
          values     thehigher
                  were    values(less
                                   werenegative)
                                          higher (less      negative)
                                                      for liquids.      forfact
                                                                     This    liquids.
                                                                                 can beThis   fact to
                                                                                         related    can
                                                                                                      thebesmaller
                                                                                                              relatedoxygen
                                                                                                                        to the
smaller   oxygen   concentration      caused   by   the   agar  presence    in  the  electrolyte
concentration caused by the agar presence in the electrolyte (Figure 2). The lower oxygen content  (Figure    2).  The  lower
                                                                                                                            in
oxygen    content  in   agar  electrolytes   tended     to  shift the  cathodic    reaction   to  lower
agar electrolytes tended to shift the cathodic reaction to lower (more negative) potentials, also lowering(more     negative)
potentials,
the           also
     E value at      lowering
                 which            the and
                         the anodic     E value
                                            cathodic at processes
                                                          which the      anodic
                                                                     reached       and cathodic
                                                                                equilibrium,    that isprocesses      reached
                                                                                                        to say, decreasing
equilibrium,    that  is to say,  decreasing    OCP      [46]. As  the  glycerol    content   increased
OCP [46]. As the glycerol content increased in the gels, the OCP also tended to increase (became less       in  the  gels, the
OCP also tended
negative).            to increase
             This trend            (becametoless
                           can be related       the negative).
                                                      effects thatThis
                                                                     the trend
                                                                          changescaninbethe
                                                                                          related   to the effects
                                                                                             conductivity      of thethat  the
                                                                                                                       media
changes in the conductivity of the media (Table 1) can have on the OCP, as a less conductive media
Metals 2018, 8, 500                                                                                                         11 of 16
  Metals 2018, 8, x FOR PEER REVIEW                                                                                            11 of 17

   increases
(Table 1) canthe ohmic
               have    dropOCP,
                    on the  between   the working
                                 as a less         electrode
                                           conductive  media and  the CE,
                                                              increases   shifting
                                                                        the ohmicthe measured
                                                                                   drop betweenOCP
                                                                                                the to
   higherelectrode
working   values [47].
                   and the CE, shifting the measured OCP to higher values [47].

         Table
      Table      2. Open-circuit
            2. Open-circuit      potential
                            potential (OCP) (OCP)   values obtained
                                            values obtained           forstainless
                                                            for AISI 304   AISI 304   stainless
                                                                                   steel         steel
                                                                                         in various    in various
                                                                                                    electrolytes
         electrolytes
      with 0.5% NaClwith
                      and0.5%   NaCl4 .and 1% KClO4.
                           1% KClO

                                                                           Gel (0.5%Agar)
                      Heading                           Salt      Liquid                     Gel (0.5%Agar)
                 Heading                   Salt    Liquid     30% Glycerol 40% Glycerol 50% Glycerol
                                                            30% Glycerol 40% Glycerol 50% Glycerol
                     OCP                      NaCl −40 ± 18     −108 ± 5       −21 ± 5          9±5
   mV vs. saturatedOCP                       KClO4−40 39
                    calomel electrode (SCE)NaCl       ± 18
                                                         ±9   −108 ± ±5 6
                                                                 −56       −21 ±
                                                                               −625 ±4    9 ± 5 33 ± 9
    mV vs. saturated calomel electrode (SCE)       KClO4        39 ± 9         −56 ± 6           −62 ± 4           33 ± 9

         EIS is a more complex non-destructive electrochemical technique that can also be used for
      EIS  is amonitoring.
   corrosion      more complex         non-destructive
                                  EIS measurements            electrochemical
                                                           were   carried out intechnique
                                                                                      electrolytesthatwithcan  alsoasbewell
                                                                                                            NaCl,         usedas for
                                                                                                                                 those
corrosion   monitoring.       EIS  measurements         were   carried   out   in electrolytes
   with KClO4. Figure 8a shows some examples of Bode diagrams obtained using electrolytes          with  NaCl,   as well   as those
                                                                                                                                  with
with  KClO
   NaCl.   An4 . equivalent
                 Figure 8a showscircuitsome   examples
                                        generated           of Bode
                                                       through         diagrams
                                                                  frequency         obtained
                                                                                 fitting   fromusing     electrolytes
                                                                                                  all studied   spectrawith   NaCl. in
                                                                                                                          is shown
AnFigure
    equivalent
            8b. Thecircuit  generated
                        validity         through
                                   of this           frequency
                                            equivalent     circuitfitting   from allthe
                                                                     to simulate       studied   spectra is shown
                                                                                           electrochemical            in Figure
                                                                                                               behavior           8b.
                                                                                                                            of passive
The  validity    of  this  equivalent     circuit   to  simulate    the  electrochemical        behavior
   stainless steels was previously demonstrated [34,48]. Processes having various time scales are           of passive    stainless
steels was previously
   commonly       represented  demonstrated
                                   in equivalent   [34,48].
                                                      diagramsProcesses
                                                                   by the having        various time(R–C)
                                                                             resistive–capacitive         scales  are commonly
                                                                                                               delay   sections with
represented
   various values of R and C. Constant phase elements (CPEs) are used to simulatewith
                 in  equivalent     diagrams      by   the resistive–capacitive          (R–C)   delay   sections     the various
                                                                                                                            capacitive
values  of R and
   behavior           C. Constant
                of elements     in thephase   elements
                                        circuit   in a more (CPEs)     are way.
                                                               realistic     used Rtoe is
                                                                                        simulate   the capacitive
                                                                                          the resistance              behavior used
                                                                                                            of the electrolyte    of
elements    in  the  circuit   in a more    realistic   way.  R   is  the  resistance     of the  electrolyte
   to perform the measurement. The resistance, R1, and the constant phase element, CPE1, dominating
                                                                e                                               used   to  perform
theatmeasurement.
      medium frequencies,The resistance,     R1 , and the
                                    are commonly             constantwith
                                                         associated      phase theelement,     CPE1 , dominating
                                                                                    electrochemical       behavior of  at the
                                                                                                                          medium
                                                                                                                               passive
frequencies,
   layer [2,49]. are  commonly
                    The   resistance,associated
                                        R2, and the  with  the electrochemical
                                                        constant   phase element,behavior           of the passive
                                                                                         CPE2, dominating       at lowlayer   [2,49].
                                                                                                                         frequencies,
Theare
     resistance,
       attributed   R2to
                       , and  the constant
                          resistance   of thephase     element, CPE
                                               charge-transfer          2 , dominating
                                                                      process   and to the  at low   frequencies,
                                                                                               double-layer         are attributed
                                                                                                                capacitive    effect.
to resistance of the charge-transfer process and to the double-layer capacitive effect.

      Figure 8. (a) Electrochemical impedance spectroscopy (EIS) spectra obtained for electrolytes with 0.5%
         Figure
      NaCl, and 8.
                 (b)(a) Electrochemical
                     equivalent           impedance
                                 circuit generated by spectroscopy   (EIS) spectra
                                                      fitting the experimental     obtained for electrolytes with
                                                                               spectra.
         0.5% NaCl, and (b) equivalent circuit generated by fitting the experimental spectra.

      Table 3 displays the average values obtained from the EIS spectra for the electrochemical parameters
         Table 3 displays the average values obtained from the EIS spectra for the electrochemical
of the systems, with the corresponding variations resulting from experimental measurements also included.
    parameters of the systems, with the corresponding variations resulting from experimental
A trend of increasing R1 with increasing glycerol content can be observed. A slight increase in R2 , which
    measurements also included. A trend of increasing R1 with increasing glycerol content can be
is related to the corrosion rate of the stainless steel, is also quite clear. The evolution in R2 with glycerol
    observed. A slight increase in R2, which is related to the corrosion rate of the stainless steel, is also
content agrees with the icorr evolution results obtained from polarization curves [28].
    quite clear. The evolution in R2 with glycerol content agrees with the icorr evolution results obtained
    from polarization curves [28].
You can also read