Hyaluronan-Arginine Interactions-An Ultrasound and ITC Study
←
→
Page content transcription
If your browser does not render page correctly, please read the page content below
polymers
Article
Hyaluronan-Arginine Interactions—An Ultrasound
and ITC Study
Adam Jugl       and Miloslav Pekař *
 Faculty of Chemistry, Brno University of Technology, Purkyňova 464, 612 00 Brno, Czech Republic;
 xcjugl@fch.vut.cz
 * Correspondence: pekar@fch.vut.cz; Tel.: +420-541-149-330

 Received: 6 August 2020; Accepted: 10 September 2020; Published: 12 September 2020

 Abstract: High-resolution ultrasound spectroscopy and isothermal titration calorimetry were used to
 characterize interactions between hyaluronan and arginine oligomers. The molecular weight of arginine
 oligomer plays an important role in interactions with hyaluronan. Interactions were observable for
 arginine oligomers with eight monomer units and longer chains. The effect of the ionic strength and
 molecular weight of hyaluronan on interactions was tested. In an environment with increased ionic
 strength, the length of the arginine oligomer was crucial. Generally, sufficiently high ionic strength
 suppresses interactions between hyaluronan and arginine oligomers, which demonstrated interactions
 in water. From the point of view of the molecular weight of hyaluronan, the transition between the rod
 conformation and the random coil conformation appeared to be important.

 Keywords: hyaluronan; arginine; interaction; high-resolution ultrasound spectroscopy; isothermal
 titration calorimetry

1. Introduction
      Hyaluronan is a naturally occurring polysaccharide, which was discovered by Meyer and Palmer
in the vitreous humor of cattle eyes [1]. This biopolymer, with a relatively simple primary structure,
is synthesized by organisms from bacteria to humans [2]. However, according to research results to
date, despite its simple composition [3], hyaluronan plays a significant role in many biological processes
of the human body, such as regulating water balance and osmotic pressure, stabilizing structures [2],
and influencing the diffusion of large molecules [4].
      Hyaluronan is one of the basic components of the extracellular matrix, in which it interacts
primarily with a number of proteins [5]. The first interaction with proteins was discovered in 1972 [6].
Proteins capable of such interactions are called hyaladherins [7], e.g., HARE, which controls the
endocytosis of hyaluronan [8,9]; LYVE1 [5,9], which is structurally similar to the CD44 receptor [9];
and many others including, intracellular receptors whose functions have not yet been fully clarified [10].
For most hyaluronan binding proteins, a domain of about 100 amino acids, known as the “Link module,”
is responsible for binding [5,8,11].
      CD44 is the major cell receptor for hyaluronan [12]. The part of CD44 called HABD is responsible
for binding with hyaluronan [13]. Hyaluronan hexasaccharide (2.4 kDa) seems to be of the optimum
size for binding to the CD44 receptor [14,15]. However, shorter fragments of between about 3 and
5 disaccharide units (1.2–2.0 kDa) also have receptor binding capacity [12]. The binding of hyaluronan
to the receptor is mainly driven by their shape and their ability to form hydrogen bonds and van der
Waals forces, rather than by electrostatic interactions [16–18]. Electrostatic interactions in physiological
saline solution contribute to the total energy of the interaction by approximately 25%, although at
physiological pH, almost all carboxyl groups are dissociated [6]; moreover, they are strongly dependent
on the ionic strength of the environment [19]. A total of 13 amino acid residues are involved in the

Polymers 2020, 12, 2069; doi:10.3390/polym12092069                             www.mdpi.com/journal/polymers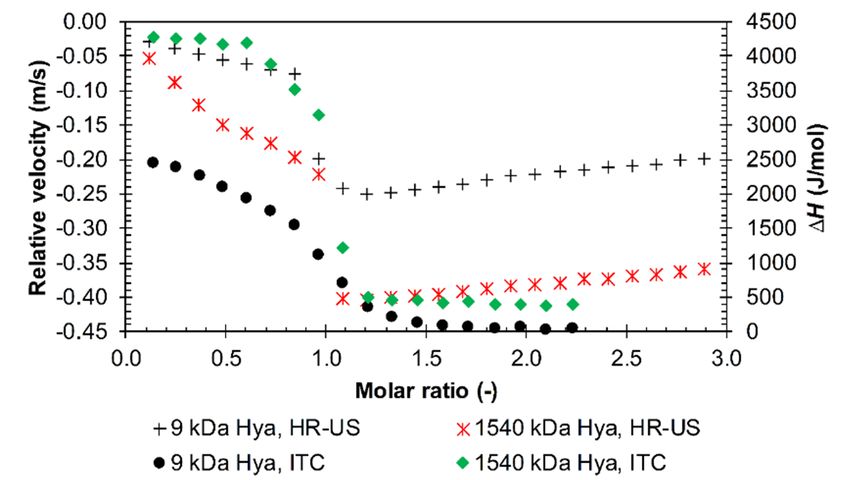
Polymers 2020, 12, 2069                                                                               2 of 20

interaction between hyaluronan and CD44. A large part of the interaction is mediated by aliphatic,
aromatic, and basic residues [16].
      In addition to its binding to cellular receptors, where electrostatic interactions involving hyaluronan
contribute only partially, the ability of hyaluronan to create electrostatic interactions has also become
the basis for many other research studies.
      The electrostatic binding of low-molecular-weight ligands to hyaluronan was studied by capillary
electrophoresis [20]. It was found that β-naphthylamide derivatives with Arg, Lys, and Ala interact
only very weakly in phosphate buffer (pH 7.4; I = 0.17 M), unlike in acetate buffer medium (pH 4.65;
I = 0.05 M), where the electrostatic interaction was stronger mainly due to the lower ionic strength.
      Oyarzun-Ampuero and his team [21] prepared nanoparticles by simply mixing solutions of
hyaluronan (165 and 29 kDa) and polyarginine (5–15 kDa). It was found that systems can be
prepared depending on the charge ratio between positive or negative zeta potential. At the same
time, higher molecular weight hyaluronan was shown to form more stable particles. The stability of
nanoparticles was tested as short term in PBS, as well as long term in water for 3 months. Systems with
low-molecular-weight hyaluronan were shown to be unstable in PBS.
      The electrostatic complexation of hyaluronan was also used for targeted siRNA distribution [22].
Hyaluronan (19 kDa) interacted with poly L-arginine (15–70 kDa) in aqueous media, and the resulting
complex was used for interaction with siRNA and its targeted distribution. A simple mixing of the
solutions was used to prepare the complexes.
      A similar example of electrostatic interaction between hyaluronan and a cationic liposome/plasmid
DNA complex was created by the Balbino group [23], where they allowed the liposome/DNA complex
to interact with low-molecular-weight hyaluronan (16 kDa) in aqueous media in order to provide tools
for targeted gene distribution.
      Hyaluronan has already been shown to interact with amino acids under appropriate conditions [11].
In particular, pH and ionic strength appear to be important; when the pH drops to about 2.5, virtually no
interactions can be observed, since the carboxyl groups of the hyaluronan providing the interaction are
no longer dissociated [24]. According to calculations (density functional theory), Arginine together
with hyaluronan form a more rigid structure, while lysine is more flexible [11].
      The formation of complexes and aggregates between proteins and polysaccharides is often driven
entropically in the case of strongly charged polyelectrolytes, probably through released counterions
and water molecules and conformational changes in polymers during interaction [25].
      Bovine serum albumin and hyaluronan have been shown to be capable of electrostatic complexation
at around a pH 4, independently of the length of hyaluronan [26]. A single BSA molecule can be
enveloped by multiple short HYA chains, while a long hyaluronan molecule can interact with multiple
BSA molecules [26]. The turbidity of the solution and the size of the complexes were measured,
and the HYA-protein complexes were analyzed by spectrophotometric measurement [26]. Complexes of
hyaluronan and bovine serum albumin may be of three types [27]—namely, neutral insoluble complexes
in the phase separation region and small positively charged complexes or large negatively charged
complexes, which are soluble and are formed in an excess of albumin or hyaluronan, respectively.
      Complexes of hyaluronan and silk fibrin (silk fibroin) have also been studied. These complexes
exist in the pH range of 2.5–3.5, and the complexes are mainly formed by electrostatic interactions [27].
In contrast, lysozyme, which has an isoelectric point higher than albumin, formed complexes at
significantly higher pH (pH 3–9) [28].
      Thus, interactions between hyaluronan and amino acids, which also form proteins, are of interest
from the point of view of both the functioning of hyaluronan in biological systems and its application
in medical technologies and nanotechnologies. The aim of this work was to obtain a detailed picture of
interactions between hyaluronan and various arginine oligomers using ultrasound spectroscopy and
isothermal titration calorimetry, the latter also delivering basic thermodynamic parameters for these
interactions. Such a system has not been investigated by these two techniques and only rarely by some
other techniques [11].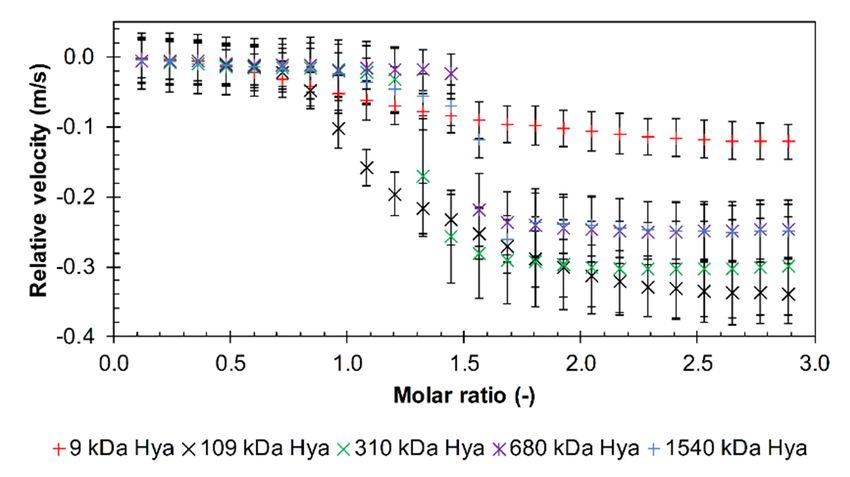
Polymers 2020, 12, 2069                                                                           3 of 20

2. Materials and Methods

2.1. Materials
      Hyaluronan samples were obtained from Contipro Biotech (Dolní Dobrouč, Czech Republic),
where they were produced by extraction from cell walls of the bacteria Streptococcus zooepidemicus.
The product types are named according to the range of molecular weights in which the particular
product falls. Seven product types were used in this work. Their molecular weights ranged from
9 to 1540 kDa. The various product types and the exact molecular weights of all used samples,
as determined by the producer using size exclusion chromatography with multi-angle light scattering
(SEC-MALS) technique, can be found in Table S1 in Supplementary Materials.
      Hyaluronan solutions were prepared at a concentration of 0.1% (weight, i.e., w/w, % are used
throughout this work) by dissolving hyaluronan powder in ultrapure deionized water from a PURELAB
purification system (OPTION R7/15; ELGA, High Wycombe, Great Britain), in PBS (VWR Life science,
Radnor, PA, USA, Lot NO.: 0016C297, 137 mM sodium chloride, 2.7 mM potassium chloride, 12 mM
phosphate buffer; ionic strength 172 mM), or in NaCl solutions of various concentrations (10, 50, 100,
and 150 mM); both the hyaluronan powder and the solvents were weighed using analytical balances.
The used hyaluronan concentration corresponded to a negative charge concentration of 2.5 mM at
complete dissociation of the hyaluronan carboxyl groups. The mixture was stirred for 24 h in a closed
vessel at room temperature to ensure complete dissolution [29].
      Arginine hydrochlorides in monomeric and oligomeric forms were obtained from several suppliers,
as shown in Table S2 in Supplementary Materials. Arginine oligomers were synthesized commercially
according to our requirements. Monomeric arginine hydrochloride was purchased from Sigma Aldrich
(St. Louis, MO, USA) as a commercially available product.
      Arginine solutions were prepared as 30 mM solutions of monomer units, by direct dissolution of
a given arginine oligomer in volumetric flasks containing water, PBS, or NaCl solutions of various
concentrations. The mixture was stirred for 24 h at room temperature to ensure complete dissolution.
Preprepared NaCl or PBS solutions were used instead of water to prepare solutions of higher
ionic strength.
      Because the stock solutions of some of the arginine oligomers (dimer, tetramer, and octamer)
had too low a pH (probably due to some excess of acid used to prepare the hydrochloride form)
(see Table S3 in Supplementary Materials), their values had to be adjusted so that their pH was above
the hyaluronan dissociation constant [24] and similar to the pH of the other oligomers (around 6).
The pH adjustment was done by adding a small volume of 2 M NaOH (G.R. Batch no. PP/2008/06964/0,
Lach:ner, Neratovice, Czech Republic) to the stock solution (Table S4 in Supplementary Materials).
Although these pH adjustments led to an increase in the ionic strength, their effect was negligible.
The increase in ionic strength during titrations with the pH-adjusted solutions was at most 8 mM,
which had no observable effect on the titration curves, as demonstrated in independent experiments
on the effect of the ionic strength. Arginine decamer stock solution had a pH of 5.71 ± 0.03, dodecamer,
5.62 ± 0.04, and triacontamer (30-mer), 6.77 ± 0.03.

2.2. Methods

2.2.1. High-Resolution Ultrasound Spectroscopy
      The ultrasonic velocity for each sample was measured at six selected frequencies in the range from
2.5 to 14.9 MHz using an HR-US 102T ultrasonic spectrometer (ultrasonic Scientific, Dublin, Ireland)
with titration accessory. This device is equipped with two cells enabling single-cell or differential
measurements. The differential regime was used in this work. It allows a resolution of 0.2 mm·s−1 for
ultrasonic velocity (this corresponds to a value of 10−5 % in water). The temperature was controlled
with a Thermo Scientific Haake PC 200 heating bath, which provided a temperature stability of
±0.01 ◦ C. The temperature was recorded by a sensor inserted in the ultrasonic spectrometer by the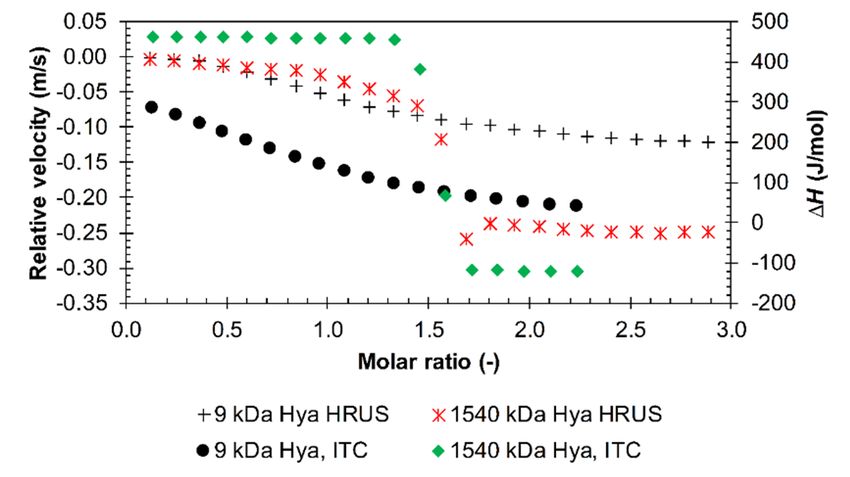
Polymers 2020, 12, 2069                                                                              4 of 20

manufacturer. The measuring and reference cells were filled with deeply degassed sample solution
and water, respectively, using a calibrated 1 mL Hamilton syringe. A volume of 1 mL was placed in
each cell.
      The measuring cell was filled with deeply degassed hyaluronan solution and solution containing
amino acid was added through the titration accessory. The reference cell was filled with ultrapure and
degassed deionized water. Ultrasonic velocity and attenuation were monitored continuously over the
course of the titration at 25 ◦ C.
      Before each measurement, baseline correction was performed by taking measurements with
deionized water in both cells. The measured dependences did not show any effect of the ultrasound
frequency; consequently, only the results from measurements made at 11.6 MHz are reported.
      Each measurement was made at least three times, and average values are reported in figures for
the sake of clarity; error bars are shown in the figures. Reproducibility was much better in the case of
relative velocity than in the case of attenuation in the sample cell, as expected.
      From each amino acid titration to hyaluronan, the titrations of the solvent to hyaluronan and of
the corresponding amino acid to the solvent were subtracted to account for dilution effects.

2.2.2. ITC
     Heat effects resulting from the titration of a titrant solution into the measuring cell were, in most
cases, measured using a MicroCal PEAQ-ITC instrument (Malvern Panalytical Ltd., Westborough, MA,
USA). A minority of experiments were performed with a Nano ITC 2G instrument (TA Instruments,
New Castle, DE, USA). The titration of water to water was performed prior to each experiment to
ensure that the instrument measured correctly. Each measurement was performed at least three times;
average values are reported in figures and tables for the sake of clarity; standard deviations are given
in tables and corresponding error bars are shown in figures. The reference cell was filled with water in
both devices.
     All experiments performed with the MicroCal PEAQ-ITC calorimeter had the reference power
set to 41.9 µW. Peak integration and the processing of data obtained from the measurements were
performed using MicroCal PEAQ-ITC Analysis Software (version 1.21, Malvern Panalytical Ltd.,
Westborough, MA, USA). In the case of Nano ITC 2G, data were processed using the NanoAnalyze Data
Analysis program (version 2.1.13, TA instruments, New Castle, DE, USA). Both software use standard
procedures [30] to determine basic thermodynamic parameters—specifically, here, the standard
interaction Gibbs energy (∆G), the standard interaction enthalpy (or the enthalpic contribution; ∆H),
and entropy (∆S); the product T∆S is called the entropic contribution. The software also delivers an
equilibrium constant (K), usually called the dissociation constant; this traditional terminology is kept
here, although it is not exactly appropriate for the observed interactions.
     When investigating interactions of arginine oligomers with hyaluronan, the hyaluronan solution
(0.1 %wt) was, in all cases, placed in the cell and arginine oligomer solution was added. For MicroCal
PEAQ-ITC, a 40 µL syringe was used. The first addition was 0.8 µL, other additions were 2 µL; a total
of 36.8 µL of stock solution was added to 280 µL of hyaluronan stock solution. The stirring rate
was set to 750 rpm and the interaction parameters were measured at 25 ◦ C. The interval between
additions was empirically set at 150 s, which was sufficient time for the signal to return to the baseline.
Measurements were performed in pure water, PBS, or NaCl solutions of various concentrations (10, 50,
100, and 150 mM).
     In the case of Nano ITC 2G, a 250 µL syringe was used with a first addition of 5.14 µL followed
by 20 additional additions of 12 µL to a 990 µL cell. The stirring rate was set to 250 rpm, and the
interaction parameters were measured at 25 ◦ C. The interval between additions was empirically set at
500 s, which was sufficient time for the signal to return to the baseline.
     To determine the dilution heats, titrations of arginine oligomer into water were performed.
The heat of dilution was subtracted from the titration at the start of the evaluation. The dilution heat of
hyaluronan during the experiment was not taken into account, because the heat released during one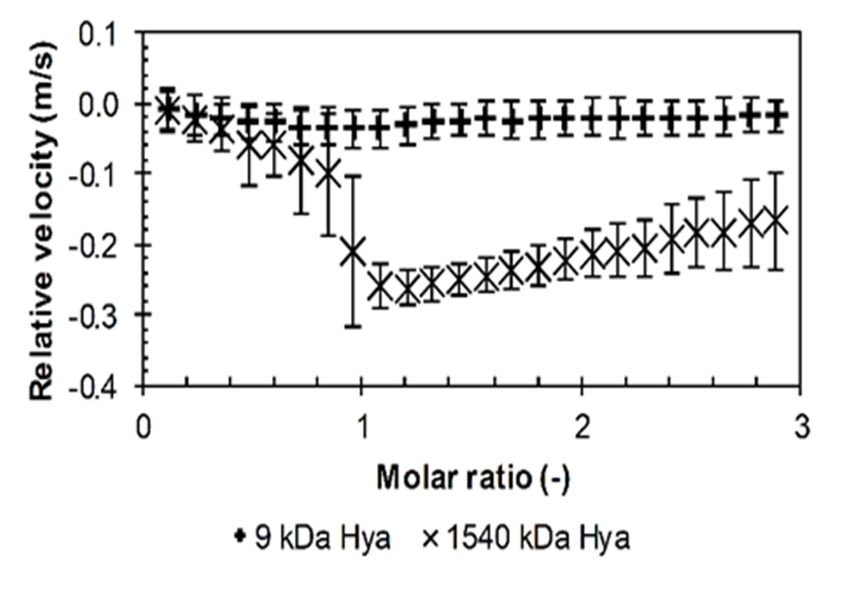
Polymers 2020, 12, 2069                                                                            5 of 20

titration is in the order of hundreds of microjoule, while the dilution heat of hyaluronan is very small
and, according to available literature [31–33], corresponded to the order of units of microjoule in water
for our hyaluronan solutions.

2.2.3. The Molar Ratio
     The molar ratio was calculated as the ratio of the number of hyaluronan disaccharide units and
the number of arginine monomer units present in solution. A molecular weight of 401.229 g/mol for
hyaluronan disaccharide repeating units was used together with its weight-average molecular weight
as determined by SEC-MALS. If the presence of one negative charge on each hyaluronan disaccharide
unit and one positive charge on each monomer unit of arginine hydrochloride oligomers is assumed,
the molar ratio gives the ratio of negative and positive charges. In other words, the molar ratio is then
the ratio of the number of charges on hyaluronan to the number of charges on arginine.

3. Results
     Basic information about the system was obtained by simple visual observation. Molecular weights
of hyaluronan of 9 and 1540 kDa were tested with all arginine oligomers. All visual observations for
solutions in water, PBS, and environments with increased ionic strength are summarized in Tables S5
and S6 in Supplementary Materials. No changes were observed for the monomer or for the dimer
and tetramer of arginine hydrochloride during addition to the hyaluronan solution and the solutions
remained clear. In the case of higher oligomers, the system generally changed from clear to opaque
and subsequently cloudy for 9 kDa hyaluronan; in the case of 1540 kDa hyaluronan, there was also a
macroscopic phase separation (precipitation). These phase changes generally occurred in water at
a molar ratio around one. If additional ions were present in the solution, these changes generally
occurred at higher molar ratios. Such shifts were particularly evident in the case of PBS.

3.1. Results from High-Resolution Ultrasound Spectroscopy
      Arginine monomer and oligomers up to and including four monomer units showed almost
unchanged ultrasound velocity during the whole titration course in water; data are shown in Figures S1
and S2 in Supplementary Materials for hyaluronan of the lowest and highest molecular weights used.
This indicated no interactions, at least from the point of view of the ultrasound wave. As noted above,
the pH of dimer and tetramer solutions had to be adjusted to a neutral value; the adjustment resulted
in no change in the ultrasound spectroscopy record (cf. Figure S2 in Supplementary Materials).
      The situation changed with arginine octamer in water. Visual observations showed that, unlike the
shorter arginine oligomers, arginine octamer developed turbidity during titration. Observations
varied depending on the used molecular weight of the hyaluronan. In the case of pH-adjusted
solutions of arginine octamer, the change was clearly evident for the smallest molecular weight of
hyaluronan. Unlike with the shorter arginine oligomers, the relative velocity decreased during titration
as the hydration water was released from the hydration shell. This was particularly evident with
high-molecular-weight hyaluronan, as shown in Figure 1. The decrease stopped at around a molar
ratio equal to one, i.e., around the supposed charge equilibration, then the relative velocity slightly
increased. The pH-adjustment, which was also made for the octamer, did not result in essential changes
in titration profiles; see Figure S3 in Supplementary Materials. In comparison with pH-untreated
samples, the decrease in the relative velocity was more distinct in the case of very low-molecular-weight
hyaluronan, whereas it was not so deep for the high-molecular-weight sample. The pH-adjustment
also “smoothed” the velocity decrease and, instead of a minimum, a sigmoidal shape with a point of
inflection at a molar ratio of about 1.7–1.9 was observed.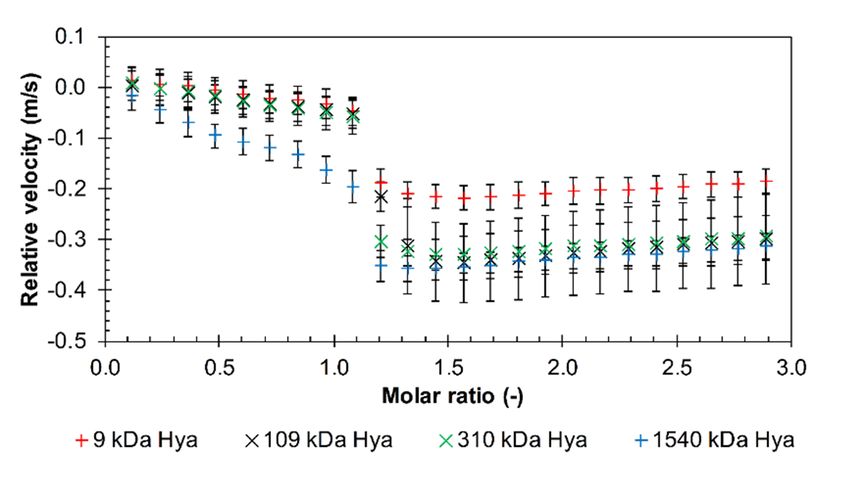
Polymers 2020, 12, x FOR PEER REVIEW 6 of 20
Polymers 2020, 12, 2069 6 of 20
Polymers 2020, 12, x FOR PEER REVIEW 6 of 20
Figure 1. The relative ultrasonic velocity in dependence on molar ratio for titrations of arginine
octamer
Figure in hydrochloride
1. The formvelocity
relative ultrasonic to hyaluronan of different
in dependence molecular
on molar weights
ratio for in water
titrations (11.6 octamer
of arginine MHz, 25
Figure
°C). 1. The relative ultrasonic velocity in dependence on molar ratio for titrations
in hydrochloride form to hyaluronan of different molecular weights in water (11.6 MHz, 25 C). of◦ arginine
octamer in hydrochloride form to hyaluronan of different molecular weights in water (11.6 MHz, 25
Theresults
°C).
The resultsfor
forlonger
longerarginine
arginineoligomers
oligomers (10,
(10, 12,12,
andand
30)30) were
were similar,
similar, andand more
more detailed
detailed study
study of
of effect
the the effect of hyaluronan
of hyaluronan molecular
molecular weightweight
was made was using
madedecamer
using decamer and dodecamer.
and dodecamer. First, theFirst, the
relative
The
relative results
velocity for longer
decreased arginine
almost oligomers
linearly (10,
during 12, and
the 30) were
titration up similar,
to a
velocity decreased almost linearly during the titration up to a molar ratio of about one. Afterwards, and
molar more
ratiodetailed
of aboutstudy
one.
of
the the effectdecreased
Afterwards,
velocity ofthehyaluronan
velocity molecular
decreased
more sharply and weight was made
more slightly
then, sharply andusing
increased then, decamer
slightly
(decamer andand dodecamer.
increased
dodecamer) First, and
(decamer
or remainedthe
relative
dodecamer)
almost velocity
constant decreased
or (triacontamer).
remained almost almost linearly
constant
Data during the
(triacontamer).
are shown titration
in Figure 2 Data
and in up to
areFigures
shownS4 a molar
inand
Figureratio
S5 in of
2 and about one.
in Figure S4
Supplementary
Afterwards,
and Figure the
S5 in velocity decreased
Supplementary more
Materials. sharply
Here, alsoand
some then, slightly
effect of
Materials. Here, also some effect of hyaluronan molecular weight can be seen. Hyaluronan with increased
hyaluronan (decamer
molecular and
weight
the
dodecamer)
can be seen. or remained
Hyaluronan almost
with constant
the highest (triacontamer).
molecular Data
weight ofare
1540shown
kDa in
had Figure
the
highest molecular weight of 1540 kDa had the steepest slope in the initial titration phase while the lines 2 and
steepest in Figure
slope in S4
the
and
of allFigure
initialthe S5 in
titration
other Supplementary
phase
samples while
werethe Materials.
lines Here,
of all the
undistinguishable. otheralso some were
samples
Hyaluronan effect of hyaluronan
of theundistinguishable.
lowest molecular molecular weight
Hyaluronan
weight (9 kDa) of
can
the be seen.
lowest Hyaluronan
molecular with
weight the
(9 highest
kDa) gave molecular
the smallestweight
drop of
in1540 kDa
velocity had
during
gave the smallest drop in velocity during titrations. Further, the difference between the highest and the steepest
titrations. slope in
Further, the
the
initial
lowest titration
difference
molecular phase
between while
the
weight the lines
highest
of hyaluronan ofwas
all the
and lowest other in
molecular
smallest samples
weight
the casewere
of undistinguishable.
of hyaluronan
the arginine was Hyaluronan
smallest
triacontamer of
in the case
(Figure S5
the lowest molecular
ofSupplementary
in the arginine weight (9
triacontamer
Materials). kDa) gave
(Figure S5 inthe smallest dropMaterials).
Supplementary in velocity during titrations. Further, the
difference between the highest and lowest molecular weight of hyaluronan was smallest in the case
of the arginine triacontamer (Figure S5 in Supplementary Materials).
Figure 2. The relative ultrasonic velocity in dependence on molar ratio for titrations of arginine decamer
Figure 2. The relative ultrasonic velocity in dependence on molar ratio for titrations of arginine
in hydrochloride form into hyaluronan of different molecular weights in water (11.6 MHz, 25 ◦ C).
decamer in hydrochloride form into hyaluronan of different molecular weights in water (11.6 MHz,
Figure
25 °C). 2. The relative ultrasonic velocity in dependence on molar ratio for titrations of arginine
The results of the visual observations for longer arginine oligomers are summarized in Table S5
decamer in hydrochloride form into hyaluronan of different molecular weights in water (11.6 MHz,
in Supplementary Materials. In the case of hyaluronan with the highest molecular weight tested,
The
25 results of the visual observations for longer arginine oligomers are summarized in Table S5
°C).
a cloudy solution was always formed, which turned into a precipitate at around a molar ratio of 1,
in Supplementary Materials. In the case of hyaluronan with the highest molecular weight tested, a
after which the solution remained clear. At the lowest molecular weight of hyaluronan, a cloudy
Thesolution
cloudy results of
was thealways
visualformed,
observations
whichfor longer
turned arginine
into oligomers
a precipitate are summarized
at around in of
a molar ratio Table S5
1, after
solution was formed with the decamer and dodecamer of arginine. As with the highest molecular
in Supplementary
which the solutionMaterials.
remained In the At
clear. case oflowest
the hyaluronan withweight
molecular the highest molecular aweight
of hyaluronan, cloudytested,
solutiona
weight of hyaluronan, the triacontamer of arginine formed a precipitate, but at this time, the solution
cloudy solution
was formed was
with thealways
decamerformed, which turned
and dodecamer of into a precipitate
arginine. As withatthe
around a molar
highest ratio of
molecular 1, after
weight of
remained slightly cloudy even after its formation.
which the solution
hyaluronan, remained clear.
the triacontamer At the formed
of arginine lowest molecular weight
a precipitate, ofthis
but at hyaluronan, a cloudyremained
time, the solution solution
was formed
slightly witheven
cloudy the after
decamer and dodecamer of arginine. As with the highest molecular weight of
its formation.
hyaluronan, the triacontamer of arginine formed a precipitate, but at this time, the solution remained
3.1.1. Influence
slightly of theafter
cloudy even Environment
its formation.
3.1.1. Influence of the Environment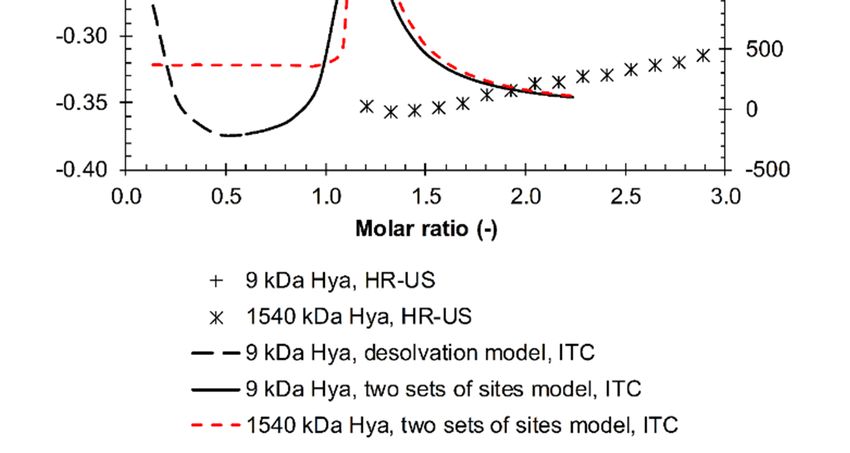
Polymers 2020, 12, 2069 7 of 20
Polymers 2020, 12, x FOR PEER REVIEW 7 of 20
Influence of the Environment
The longest arginine oligomers, i.e.,
The i.e., dodecamer
dodecamer and and triacontamer,
triacontamer, were were chosen
chosen for these
experiments based on the the results
results of
of measurements
measurements in in water,
water, in which
which they
they demonstrated
demonstrated interactions
interactions
with hyaluronan of all molecular weights studied. The The influence
influence of of ions
ions or ion-controlled
ion-controlled pH was
studied by preparing solutions in PBS or in NaCl solutions of varying concentration.
The effect of PBS at pH 7.4 on on interactions
interactions was was investigated
investigated with
with arginine
arginine triacontamer.
triacontamer. Selected
Selected
molecular weights
molecular weights of of hyaluronan
hyaluronan in in the
the range
range of of 9–1540
9–1540 kDakDa were
were tested,
tested, as as shown
shown in the graph graph in
Figure 3. The
Figure The relative
relative velocity
velocitydecrease
decreasedid didnot
notoccur
occurfrom
fromthethefirst
firsttitration
titrationstep
stepas asititdid
didin inwater.
water.
The first additions resulted in constant values of relative velocities, so it is likely that interactions did
not occur
not occur during
during this time. Then
Then aa drop
drop inin relative
relative velocity
velocity occurred—as
occurred—as in in the
the case
case of titrations
titrations in
water—perhaps with
water—perhaps with the
the exception
exception of 9 kDa hyaluronan, where the velocity decrease was smooth
and moderate.
and moderate.The Thedrop
dropin in
thethe case
case of 109
of 109 kDakDa was was not
not as as steep
steep as forasthefor the remaining
remaining samples samples of
of higher
higher molecular
molecular weight weight and over
and spread spread over a range
a certain certainofrange of theratio.
the molar molarInratio.
general,In general,
the molar theratio
molar
at
ratio atthe
which which
droptheoccurred
drop occurred was shifted
was shifted to higher
to higher values
values in comparison
in comparison to to
thethe titrationsininwater.
titrations water.
However, the effect of PBS was dependent on the hyaluronan molecular weight. This is also seen in
Figure S6 in Supplementary Materials,
Figure Materials, where the increasing ultrasound attenuation well illustrates
the (micro)phase separation and
the (micro)phase separation and the
the formation
formation of of precipitates
precipitates that
that occurred
occurred at higher molecular
molecular
weights ofofhyaluronan.
hyaluronan.Increased
Increased attenuation
attenuation means the formation
means the formationof structures or aggregates
of structures capable
or aggregates
capable of scattering
of scattering the ultrasound
the ultrasound wave and wave and increasing
increasing samplesample heterogeneity
heterogeneity [34,35].[34,35]. Precipitates
Precipitates were
observable
were for hyaluronan
observable molecular
for hyaluronan weights
molecular from 310
weights fromkDa310and
kDawere
and formed from afrom
were formed molar ratio of
a molar 1.5.
ratio
of 1.5.particles
Thus, Thus, particles were in
were created created in thethat
the system system that the
allowed allowed
soundthe sound
to be to be dispersed.
dispersed. Greater
Greater dispersion
dispersion (higher attenuation)
(higher attenuation) occurred withoccurred
higherwith higherweight
molecular molecular weight hyaluronan.
hyaluronan.
Figure 3.
Figure The relative
3. The relative ultrasonic
ultrasonic velocity
velocity in
in dependence
dependence on
on the
the molar
molar ratio
ratio for
for titrations
titrations of
of arginine
arginine
triacontamer in hydrochloride form into hyaluronan of different molecular weights in PBS (11.6 MHz,
triacontamer in hydrochloride form into hyaluronan of different molecular weights in PBS (11.6 MHz,
25 ◦ C).
25 °C).
Arginine dodecamer in PBS were tested using ITC only; no heat effects were observed.
Arginine dodecamer in PBS were tested using ITC only; no heat effects were observed. Visual
Visual observations indicated that the solutions remained clear (Table S6 in Supplementary Materials).
observations indicated that the solutions remained clear (Table S6 in Supplementary Materials).
The effect of increasing NaCl concentration, i.e., of increasing ionic strength, was investigated
The effect of increasing NaCl concentration, i.e., of increasing ionic strength, was investigated
using arginine dodecamer, which did not show interactions in PBS, together with hyaluronan of
using arginine dodecamer, which did not show interactions in PBS, together with hyaluronan of
molecular weight 680 kDa. As shown in Figure 4, as the ionic strength increased, the drop in the
molecular weight 680 kDa. As shown in Figure 4, as the ionic strength increased, the drop in the
relative velocity value gradually decreased. The slope of the initial decrease in the relative velocity also
relative velocity value gradually decreased. The slope of the initial decrease in the relative velocity
decreased with increasing ionic strength and, at the two highest NaCl concentrations, it was almost
also decreased with increasing ionic strength and, at the two highest NaCl concentrations, it was
zero. Visual observations showed that in both cases, a precipitate occurred around a molar ratio of
almost zero. Visual observations showed that in both cases, a precipitate occurred around a molar
1.1, but in the case of increased ionic strength (100 mM NaCl), the supernatant solution remained
ratio of 1.1, but in the case of increased ionic strength (100 mM NaCl), the supernatant solution
cloudy (Table S6 in Supplementary Materials). At the highest NaCl concentration (150 mM), the drop
remained cloudy (Table S6 in Supplementary Materials). At the highest NaCl concentration (150
in the relative ultrasound velocity was shifted to a significantly higher molar ratio but, at the same
mM), the drop in the relative ultrasound velocity was shifted to a significantly higher molar ratio but,
at the same time, seems not to be statistically significant. This is in good agreement with the visual
observation, which showed only very slight turbidity in 150 mM NaCl (Table S6 in Supplementary
Materials).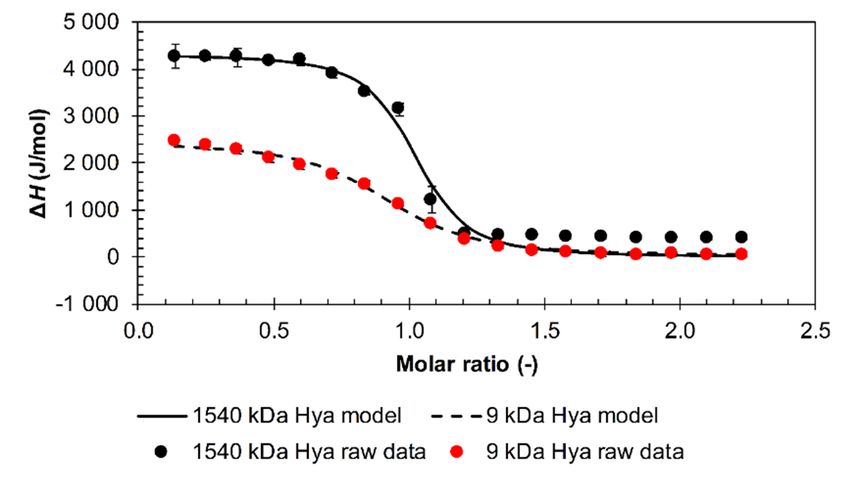
Polymers 2020, 12, 2069 8 of 20
Polymers 2020, 12, x FOR PEER REVIEW 8 of 20
time, seems not to be statistically significant. This is in good agreement with the visual observation,
Polymersshowed
which 2020, 12, xonly very REVIEW
FOR PEER slight turbidity in 150 mM NaCl (Table S6 in Supplementary Materials).
8 of 20
Figure 4. The relative ultrasonic velocity in dependence on the molar ratio for titrations of arginine
dodecamer in hydrochloride form into 680 kDa hyaluronan solutions in different ionic strength
Figure 4.
Figure The relative
4. The
environments relative ultrasonic
ultrasonic
(11.6 MHz, velocity in
25 °C). velocity in dependence
dependence on
on the
the molar
molar ratio
ratio for
for titrations
titrations of
of arginine
arginine
dodecamer in hydrochloride form into 680 kDa hyaluronan solutions in different ionic
dodecamer in hydrochloride form into 680 kDa hyaluronan solutions in different ionic strength strength
environments (11.6 MHz, 25 ◦ C).
3.2. Results from ITC
environments (11.6 MHz, 25 °C).
3.2. Results from ITC
ITC enabled a basic thermodynamic characterization of interactions between hyaluronan and
3.2. Results from ITC
arginine oligomers
ITC enabled a basic to be thermodynamic
obtained. All measurements
characterization reported in this part
of interactions were performed
between hyaluronaninand an
ITC
aqueous enabled a
medium withoutbasic thermodynamic
buffer. After characterization
subtracting the of interactions
dissolution heat between hyaluronan and
arginine oligomers to be obtained. All measurements reported in this partfrom
werethe heat obtained
performed in an
arginine
during oligomers
titration, all to be obtained.
performed All measurements
titrations were found reported
to be in this part
endothermic, as were
shown performed
in Table in
S8 an
in
aqueous medium without buffer. After subtracting the dissolution heat from the heat obtained during
aqueous
Supplementarymedium without
Materials. buffer.
Threewere After
types subtracting
of titration the dissolution
curves (showing heat from
the dependence the heat obtained
titration, all performed titrations found to be endothermic, as shown in Table S8 inof the enthalpy
Supplementary
during
change titration,
on the all performed
molar ratio duringtitrations
titration) werewerefound to be Besides
observed. endothermic,
the as shown
sigmoidal in Table
shape typicalS8for
in
Materials. Three types of titration curves (showing the dependence of the enthalpy change on the
Supplementary
interacting Materials.
systems Three
with the types ofoftitration
saturation curves
interacting (showing
sites, simply the dependence two-site
decreasing of the enthalpy
molar ratio during titration) were observed. Besides the sigmoidal shape typical forand curves
interacting systems
change
were the on obtained. of interacting sites, simply decreasing and two-site curves were also obtained. for
the molar
alsosaturation ratio during titration) were observed. Besides the sigmoidal shape typical
with
interacting
For systems with the saturation of interacting sites, asimply decreasing titration
and two-site curves
For the
the shortest
shortest arginine
arginine oligomers,
oligomers, including
including octamer,
octamer, a typical
typical sigmoidal
sigmoidal titration pattern
pattern was
was
were
not also obtained.
not observed, irrespective of the hyaluronan molecular weight. As shown in Figure 5, the
observed, irrespective of the hyaluronan molecular weight. As shown in Figure 5, curves
the curves
For the
decreased shortest
steeply fromarginine oligomers,
thebeginning
beginning includingup octamer, a typical sigmoidal titration pattern was
decreased steeply from the ofoftitrations
titrations up to to
thethe
molarmolar ratio
ratio of about
of about one,one,
fromfrom
which which no
no heat
not
heat observed,
effects irrespective
were recorded. ofThese
the hyaluronan
curves molecular
resembled the weight.
decreasing As parts
shownofintypical
Figuresigmoidal
5, the curvesITC
effects were recorded. These curves resembled the decreasing parts of typical sigmoidal ITC curves,
decreased steeply
curves,indicates
which from the
indicates the beginning
saturation of
of titrations
interaction upsites
to theand molar ratio
theofend of of about one,Visually,
interactions. from which no
dimer
which the saturation of interaction sites and the end interactions. Visually, dimer and
heat
and effects
tetramer were recorded.
systems These
remained curves resembled
clear, octamer
whereasand the
octamer decreasing parts of
and low-molecular-weighttypical sigmoidal
hyaluronanITC
tetramer systems remained clear, whereas low-molecular-weight hyaluronan systems were
curves,
systems which
were indicates
gently the saturation
opaque at low of interaction
molar ratios. sitesarginine
The and the octamer
end of interactions.
(pH Visually,
untreated) and dimer
high-
gently opaque at low molar ratios. The arginine octamer (pH untreated) and high-molecular-weight
and tetramer systems
molecular-weight remained
hyaluronan systemclear,
also whereas
exhibited octamer and low-molecular-weight ahyaluronan
hyaluronan system also exhibited opacity, which didopacity, which
not disappear; did not disappear;
a precipitate was even precipitate
formed
systems
was even were
formedgently
at opaque
around a at low
molar molar
ratio of ratios.
one. The
These arginine
observations octamer
were (pH
not untreated)
reflected in andcurves,
ITC high-
at around a molar ratio of one. These observations were not reflected in ITC curves, which were for
molecular-weight
which for allhyaluronan
werepractically systems system also
practically exhibited opacity,
indistinguishable which did
(cf. Figure not disappear;
5). From a precipitate
these titration
all systems indistinguishable (cf. Figure 5). From these titration curves, only the curves,
overall
was
only even formed
theinoverall at around
changeenthalpy a molar
in the standard ratio of one. These observations were not reflected in ITC curves,
change the standard change enthalpy
(∆H; Table change (ΔH; Table S8 inMaterials)
S8 in Supplementary Supplementary Materials)
was calculated as
which
was were forasallthe
calculated systems practically
difference between indistinguishable
the first and the (cf. Figure
last addition. 5). From these titration curves,
the difference between the first and the last addition.
only the overall change in the standard enthalpy change (ΔH; Table S8 in Supplementary Materials)
was calculated as the difference between the first and the last addition.
Figure 5.
Figure Isothermal titration
5. Isothermal titration calorimetry
calorimetry (ITC)
(ITC) records
records for
for the
the titration
titration of
of various
various arginine
arginine oligomers
oligomers
in hydrochloride form into a 1540 kDa hyaluronan solution in water (25 ◦ C).
in hydrochloride form into a 1540 kDa hyaluronan solution in water (25 °C).
Figure 5. Isothermal titration calorimetry (ITC) records for the titration of various arginine oligomers
Typical
in sigmoidal
hydrochloride formtitration shapes
into a 1540 were obtained
kDa hyaluronan with
solution arginine
in water dodecamer and triacontamer
(25 °C).
and hyaluronan of all tested molecular weights. An example is shown in Figure 6. This shape points
Typical sigmoidal titration shapes were obtained with arginine dodecamer and triacontamer
and hyaluronan of all tested molecular weights. An example is shown in Figure 6. This shape points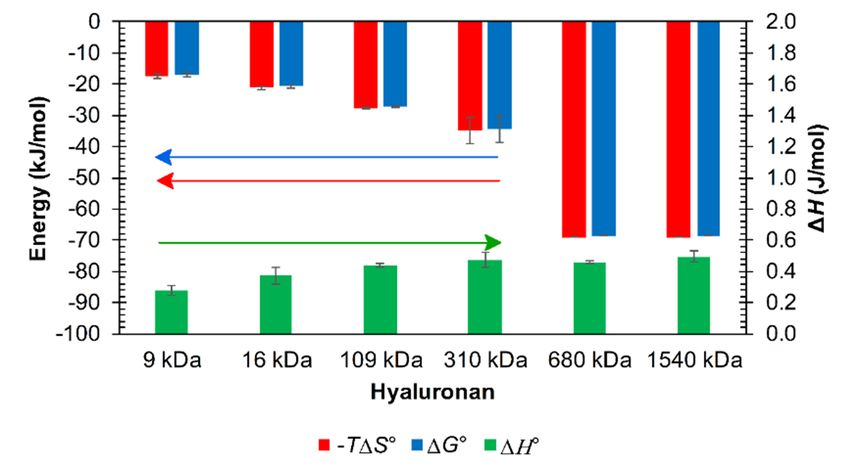
Polymers 2020, 12, 2069 9 of 20
Polymers 2020, 12, x FOR
Typical PEER REVIEW
sigmoidal titration shapes were obtained with arginine dodecamer and triacontamer9 of 20
and hyaluronan of all tested molecular weights. An example is shown in Figure 6. This shape
to hyaluronan–arginine interactions
points to hyaluronan–arginine from thefrom
interactions firstthe
oligomer additions
first oligomer in allininvestigated
additions cases,
all investigated which
cases,
continued
which continued until the available hyaluronan interaction sites in solution were depleted at a molarratio
until the available hyaluronan interaction sites in solution were depleted at a molar
of about
ratioone. The sigmoidal
of about shape was
one. The sigmoidal alsowas
shape observed for titrations
also observed of arginine
for titrations octamer
of arginine with with
octamer adjusted
pH into high-molecular-weight
adjusted hyaluronan,
pH into high-molecular-weight with anwith
hyaluronan, inflex pointpoint
an inflex shiftshift
to atomolar
a molarratio
ratioofof about
about 1.5.
1.5. This system is also represented in Figure S7 in Supplementary Materials to illustrate
This system is also represented in Figure S7 in Supplementary Materials to illustrate the baseline shift the baseline
shift observed
observed because because of the change
of the change in theinheat
the heat capacity
capacity of the
of the system
system [36]inincases
[36] cases with
with the
theformation
formation of
of a precipitate.
a precipitate.
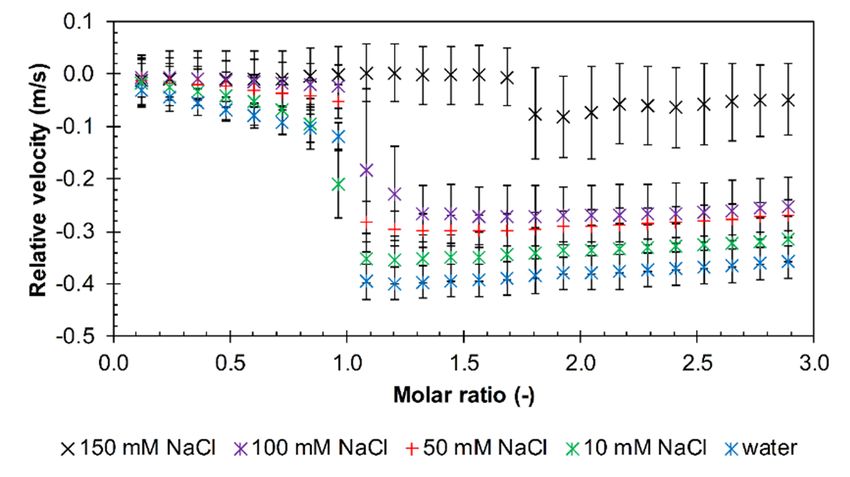
Figure 6. ITC records for the titration of arginine dodecamer in hydrochloride form into 9 and 1540 kDa
Figure 6. ITC records for the titration of arginine dodecamer in hydrochloride form into 9 and 1540
hyaluronan solutions in water (25 ◦ C). Single binding site models were used for data evaluation.
kDa hyaluronan solutions in water (25 °C). Single binding site models were used for data evaluation.
Using software implemented in the used apparatus, titrations with a typical sigmoidal shape
Usingfitted
were software
with aimplemented in the
traditional single usedsite
binding apparatus,
model totitrations
determinewith a typical sigmoidal
thermodynamic parameters shape
were(see
fitted with a traditional
Methods). singleparameters
The obtained binding site aremodel
showntoin determine
Table S8 thermodynamic
in Supplementary parameters
Materials. (see
Methods). The obtained
Thermodynamic parameters
energy-based binding (or,aremoreshown in interaction)
precisely, Table S8parameters
in Supplementary Materials.
for various arginine
oligomers are not
Thermodynamic appreciably different,
energy-based bindingand (or,themore
ratios precisely,
of the standard enthalpic and
interaction) standard entropic
parameters for various
contributions were very similar; an illustrative example is given in Figure 7
arginine oligomers are not appreciably different, and the ratios of the standard enthalpic andfor the arginine dodecamer.
Arginine
standard oligomer–hyaluronan
entropic contributions were interactions were characterized
very similar; an illustrative byexample
small and isunfavorable
given in Figurestandard
7 for the
enthalpy changes and were entropically driven. The smallest molecular weight of hyaluronan (9 kDa)
arginine dodecamer. Arginine oligomer–hyaluronan interactions were characterized by small and
had the highest dissociation constant; other molecular weights above 109 kDa had lower dissociation
unfavorable standard enthalpy changes and were entropically driven. The smallest molecular weight
constants with approximately the same values. In addition, the arginine triacontamer had, overall,
of hyaluronan (9 kDa) had the highest dissociation constant; other molecular weights above 109 kDa
lower dissociation constant values compared to the arginine dodecamer. However, the dissociation
had constants
lower dissociation constants
were determined with with approximately
relatively high standard thedeviations
same values.
due toIn theaddition, the arginine
high sensitivity of
triacontamer had, overall, lower dissociation constant values compared to the
the model used for fitting to the steep changes in the titration curves from which the constants are arginine dodecamer.
However, the dissociation
determined. constants
Such constants can thus were determined
be used with
only for the relatively
estimation high standard
of relative deviations
differences between due
to the high sensitivity
different of the model used for fitting to the steep changes in the titration curves from
titrated systems.
which the From the viewpoint
constants of isothermal
are determined. titration
Such calorimetry,
constants the decamer
can thus be usedwas a unique
only oligomer.
for the Its of
estimation
titration isotherm (see example in Figure 8)
relative differences between different titrated systems. did not manifest either a sigmoidal or simple decreasing
shape as in the case of the other investigated oligomers; its shape was, however, typical for the case
involving several binding sites [30,37] (interaction events seem to be a more appropriate term in
our case).
Figure 7. Example of magnitudes of thermodynamic parameters determined from ITC for interactions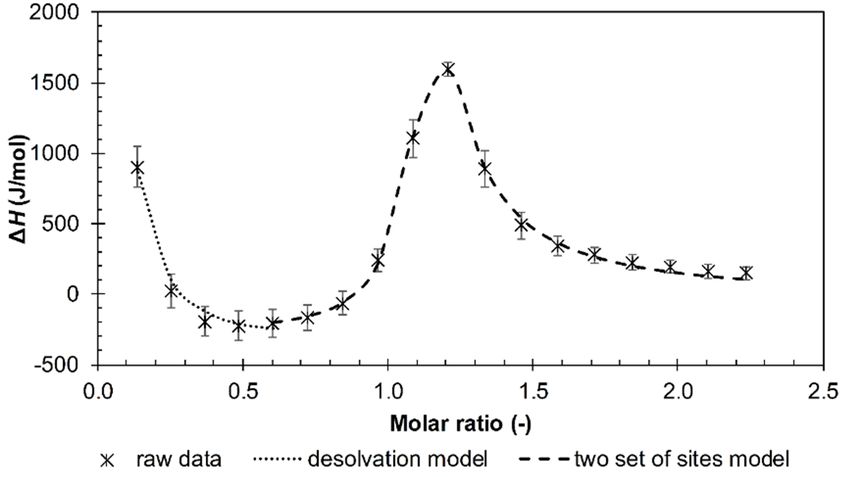
had lower dissociation constants with approximately the same values. In addition, the arginine
triacontamer had, overall, lower dissociation constant values compared to the arginine dodecamer.
However, the dissociation constants were determined with relatively high standard deviations due
to the high sensitivity of the model used for fitting to the steep changes in the titration curves from
which the constants are determined. Such constants can thus be used only for the estimation of
Polymers 2020, 12, 2069 10 of 20
relative differences between different titrated systems.
Polymers 2020, 12, x FOR PEER REVIEW 10 of 20
From the viewpoint of isothermal titration calorimetry, the decamer was a unique oligomer. Its
titration isotherm (see example in Figure 8) did not manifest either a sigmoidal or simple decreasing
shape as in7.the
Figure case ofofthe
Example other investigated
magnitudes oligomers;
of thermodynamic its shape
parameters was, however,
determined from ITCtypical for the case
for interactions
Figure 7. Example of magnitudes of thermodynamic parameters determined from ITC for interactions
involving several
of arginine bindinginsites
dodecamer [30,37] (interaction
hydrochloride events seem
form with hyaluronan to be a more
of molecular appropriate
weight 1540 kDa interm in our
water
of arginine dodecamer in hydrochloride form with hyaluronan of molecular weight 1540 kDa in water
case).(25 ◦ C).
(25 °C).
Figure 8.8.ITC
ITCrecords
recordsforfor
the the titration
titration of arginine
of arginine decamer decamer in hydrochloride
in hydrochloride form intoform into
a 9 kDa a 9 kDa
hyaluronan
solution
hyaluronanin water (25 ◦inC).
solution Two(25
water sets°C).
of sites
Twoand
setsthe desolvation
of sites and the model were used
desolvation modelforwere
dataused
evaluation.
for data
evaluation.
The fitting of multievent results was realized as follows. Data exemplified in Figure 8 were fitted
by two Themodels.
fitting The first modelresults
of multievent fitted the
wasfirst, decreasing,
realized partData
as follows. of theexemplified
isotherm, thein second
Figure 8model
were fitted
the
by two models. The first model fitted the first, decreasing, part of the isotherm, the secondshorter
subsequent part with a maximum. The first part resembled the ITC curves measured with model
arginine
fitted theoligomers
subsequent (cf.part
Figure
with5) aand was, therefore,
maximum. called
The first partthe “desolvation”
resembled model
the ITC curves(desolvation
measured part).
with
The second model was called the “Two Sets of Sites” model in the ITC software
shorter arginine oligomers (cf. Figure 5) and was, therefore, called the “desolvation” model and represents here
some first and
(desolvation second
part). Theinteraction
second model events.
wasThis multievent
called the “Twofitting
Sets ofvaried
Sites” with
modeltheinmolecular weight
the ITC software
of
and hyaluronan.
represents hereAll three
some types
first andof interactions were recognizable
second interaction for the lowest
events. This multievent molecular
fitting weight
varied with the
(Figure 8). However, as the molecular weight increased, the desolvation part disappeared
molecular weight of hyaluronan. All three types of interactions were recognizable for the lowest and only the
two remaining
molecular interaction
weight (Figureevents were retained
8). However, as the(Figure S8 in Supplementary
molecular weight increased, Materials). Note thatpart
the desolvation the
maximum
disappeared on the
andtwo-interaction
only the two event model was
remaining still observed
interaction at thewere
events sameretained
molar ratio regardless
(Figure S8 of in
the hyaluronan molecular weight. The thermodynamic parameters estimated
Supplementary Materials). Note that the maximum on the two-interaction event model was still for each used hyaluronan
molecular
observed atweight andmolar
the same modelratio
are regardless
shown in Table
of theS9 in Supplementary
hyaluronan molecular Materials.
weight. The thermodynamic
parameters estimated for each used hyaluronan molecular weight and model are shown in Table S9
Influence of the Environment
in Supplementary Materials.
As in the case of ultrasonic spectrometer experiments, the longest arginine oligomers were
3.2.1. Influence
chosen of the Environment
for experiments involving the presence of additional ions. Unlike arginine triacontamer,
arginine
As in the case of ultrasonicshowed
dodecamer and decamer no interactions
spectrometer with hyaluronan
experiments, the longestin PBS (pH 7.4),
arginine regardless
oligomers of
were
the molecular
chosen weight of involving
for experiments hyaluronan the(no heat effects
presence measuredions.
of additional withUnlike
ITC). In the case
arginine of arginine
triacontamer,
triacontamer, the titration curve was always observed to have a sigmoidal
arginine dodecamer and decamer showed no interactions with hyaluronan in PBS (pH shape and the effect of
7.4),
PBS on interactions with hyaluronan of different molecular weights could be investigated
regardless of the molecular weight of hyaluronan (no heat effects measured with ITC). In the case of with the
single
arginineinteraction site model.
triacontamer, The estimated
the titration curve was thermodynamic parameters
always observed to have are summarized
a sigmoidal in Table
shape S7
and the
in Supplementary Materials. The molar ratio corresponding to the saturation of interacting
effect of PBS on interactions with hyaluronan of different molecular weights could be investigated sites
(the
withinflex point interaction
the single on the ITC curve) increased
site model. with increasing
The estimated hyaluronanparameters
thermodynamic molecular weight. The change
are summarized in
Table S7 in Supplementary Materials. The molar ratio corresponding to the saturation of interacting
sites (the inflex point on the ITC curve) increased with increasing hyaluronan molecular weight. The
change in the standard interaction enthalpy was of one order of magnitude lower than in the case of
the titration of solutions prepared only in water. As with aqueous solutions, interactions were
dominated by the standard entropy contribution, as shown in Figure 9. The greater standard entropyPolymers 2020, 12, 2069 11 of 20
in the standard interaction enthalpy was of one order of magnitude lower than in the case of the
titration of solutions prepared only in water. As with aqueous solutions, interactions were dominated
by the standard entropy contribution, as shown in Figure 9. The greater standard entropy contribution
at hyaluronan molecular weights of 680 and 1540 kDa compared to that at other molecular weights of
hyaluronan was due to the low value of the dissociation constant for these molecular weights, as shown
in Table S7 in Supplementary Materials.
Polymers 2020, 12, x FOR PEER REVIEW 11 of 20
Figure 9.
Figure Graph showing
9. Graph showing the
the thermodynamic
thermodynamic parameters
parameters obtained
obtained from
from ITC
ITC for
for the
the arginine
arginine
triacontamer in hydrochloride form and hyaluronan of various molecular weights in the environment
triacontamer in hydrochloride form and hyaluronan of various molecular weights in the environment
of PBS.
of PBS.
Due to the inability of the arginine dodecamer to interact with hyaluronan in PBS, this arginine
Due to the inability of the arginine dodecamer to interact with hyaluronan in PBS, this arginine
oligomer was chosen for testing the effect of increasing ionic strength. Several media with ionic strengths
oligomer was chosen for testing the effect of increasing ionic strength. Several media with ionic
of 10, 50, 100, and 150 mM (NaCl concentration) were tested with 680 kDa hyaluronan. All samples
strengths of 10, 50, 100, and 150 mM (NaCl concentration) were tested with 680 kDa hyaluronan. All
except for the 150 mM ionic strength medium exhibited a sigmoidal titration curve. With 150 mM NaCl,
samples except for the 150 mM ionic strength medium exhibited a sigmoidal titration curve. With 150
however, the interactions were no longer noticeable (no heat effects measured with ITC). The data in
mM NaCl, however, the interactions were no longer noticeable (no heat effects measured with ITC).
Table S10 in Supplementary Materials show that the molar ratio at the point of interaction saturation
The data in Table S10 in Supplementary Materials show that the molar ratio at the point of interaction
remained at about one and thus, no shift was observed as it was in PBS solution. The magnitude of the
saturation remained at about one and thus, no shift was observed as it was in PBS solution. The
standard interaction enthalpy change decreased with increasing ionic strength, whereas the dissociation
magnitude of the standard interaction enthalpy change decreased with increasing ionic strength,
constant remained approximately constant (Table S10 in Supplementary Materials). The change in
whereas the dissociation constant remained approximately constant (Table S10 in Supplementary
standard Gibbs energy and the standard entropy contribution appeared to be unaffected by the
Materials). The change in standard Gibbs energy and the standard entropy contribution appeared to
magnitude of the ionic strength. Thus, the ionic strength did not appear to have a significant effect on
be unaffected by the magnitude of the ionic strength. Thus, the ionic strength did not appear to have
the intensity of the interactions, unless it was sufficiently high (150 mM).
a significant effect on the intensity of the interactions, unless it was sufficiently high (150 mM).
The arginine decamer, which demonstrated very specific behavior in ITC performed in water, did not
The arginine decamer, which demonstrated very specific behavior in ITC performed in water,
show any interactions in ITC performed in PBS, irrespective of the molecular weight of hyaluronan.
did not show any interactions in ITC performed in PBS, irrespective of the molecular weight of
The solution also remained clear throughout the titration (Table S6 in Supplementary Materials).
hyaluronan. The solution also remained clear throughout the titration (Table S6 in Supplementary
Environments of 10 and 50 mM NaCl were also tested. In both cases, the decamer of arginine interacted
Materials). Environments of 10 and 50 mM NaCl were also tested. In both cases, the decamer of
similarly with hyaluronan of molecular weights 9 and 1540 kDa. It formed turbid systems or precipitates
arginine interacted similarly with hyaluronan of molecular weights 9 and 1540 kDa. It formed turbid
with low- or high-molecular-weight hyaluronan, respectively (Table S6 in Supplementary Materials).
systems or precipitates with low- or high-molecular-weight hyaluronan, respectively (Table S6 in
All samples with high-molecular-weight hyaluronan exhibited a sigmoidal titration curve with yet smaller
Supplementary Materials). All samples with high-molecular-weight hyaluronan exhibited a
values for the standard interaction enthalpy than those measured for the arginine dodecamer in a similar
sigmoidal titration curve with yet smaller values for the standard interaction enthalpy than those
environment (cf. Table S10 in Supplementary Materials). In contrast, samples with low-molecular-weight
measured for the arginine dodecamer in a similar environment (cf. Table S10 in Supplementary
hyaluronan exhibited only a simple decrease, similarly to shorter oligomers of arginine. From the
Materials). In contrast, samples with low-molecular-weight hyaluronan exhibited only a simple
titration curves with 9 kDa hyaluronan, only the overall change in the measured enthalpy change was
decrease, similarly to shorter oligomers of arginine. From the titration curves with 9 kDa hyaluronan,
calculated as the difference between the first and the last addition. Sigmoidal curves were evaluated
only the overall change in the measured enthalpy change was calculated as the difference between
by means of a standard model. The results of individual titrations are summarized in Table S11 in
the first and the last addition. Sigmoidal curves were evaluated by means of a standard model. The
Supplementary Materials. The specific behavior of the decamer was thus suppressed by the presence of
results of individual titrations are summarized in Table S11 in Supplementary Materials. The specific
additional ions.
behavior of the decamer was thus suppressed by the presence of additional ions.
4. Discussion
For arginine monomer and oligomers up to and including four monomer units, no interactions
were observed in solutions prepared in water, even after pH adjustment, regardless of the used
molecular weight of the hyaluronan. The relative ultrasound velocity did not change (Figure S1 andYou can also read