Unobtrusive Monitoring the Daily Activity Routine of Elderly People Living Alone, with Low-Cost Binary Sensors - MDPI
←
→
Page content transcription
If your browser does not render page correctly, please read the page content below
sensors
Article
Unobtrusive Monitoring the Daily Activity Routine
of Elderly People Living Alone, with Low-Cost
Binary Sensors
Ioan Susnea 1, *, Luminita Dumitriu 1 , Mihai Talmaciu 2 , Emilia Pecheanu 1 and Dan Munteanu 1
 1    Department of Computer and Information Technology, University “Dunarea de Jos” of Galati, 800146 Galat, i,
      Romania; Luminita.Dumitriu@ugal.ro (L.D.); Emilia.Pecheanu@ugal.ro (E.P.);
      Dan.Munteanu@ugal.ro (D.M.)
 2    Department of Mathematics and Informatics, University “Vasile Alecsandri” of Bacau, 600115 Bacău,
      Romania; mtalmaciu@ub.ro
 *    Correspondence: Ioan.Susnea@ugal.ro; Tel.: +40-742-271-976

 Received: 2 April 2019; Accepted: 14 May 2019; Published: 16 May 2019

 Abstract: Most expert projections indicate that in 2030, there will be over one billion people aged
 60 or over. The vast majority of them prefer to spend their last years at home, and almost a third of
 them live alone. This creates a growing need for technology-based solutions capable of helping older
 people to live independently in their places. Despite the wealth of solutions proposed for this general
 problem, there are very few support systems that can be reproduced on a larger scale. In this study,
 we propose a method to monitor the activity of the elderly living alone and detect deviations from the
 previous activity patterns based on the idea that the residential living environment can be modeled
 as a collection of behaviorally significant places located arbitrarily in a generic space. Then we use
 virtual pheromones—a concept defined in our previous work—to create images of the pheromone
 distribution maps, which describe the spatiotemporal evolution of the interactions between the user
 and the environment. We propose a method to detect deviations from the activity routines based on a
 simple statistical analysis of the resulting images. By applying this method on two public activity
 recognition datasets, we found that the system is capable of detecting both singular deviations and
 slow-deviating trends from the previous activity routine of the monitored persons.

 Keywords: long-term activity monitoring; anomaly detection; modeling the living space;
 virtual pheromones

1. Introduction
     According to the projections of the United Nations Organization [1], by 2030, the number of older
persons (60 y.o. or older) will exceed 16% of the total world population. That is over one billion people.
A large proportion of these people (32% in Europe [2]) live alone. Despite the obvious difficulties of
living alone, 90% of older adults still prefer to spend their last years in the comfort of their homes [3]
rather than going to a nursing home.
     At the social scale, the economic impact of the population aging goes far beyond the significant
increase of public expenditures on age-related health issues and influences the labor market, migration,
and eventually the global economic growth [4,5].
     At the individual and family scale, as the professional caregivers become a scarce and expensive
resource, the burden of care for the elderly affected by debilitating diseases rests on the families and
a small number of volunteers. This often results in even higher costs, because one third of these
caregivers are affected by depression and other psychological disorders [6].

Sensors 2019, 19, 2264; doi:10.3390/s19102264                                      www.mdpi.com/journal/sensors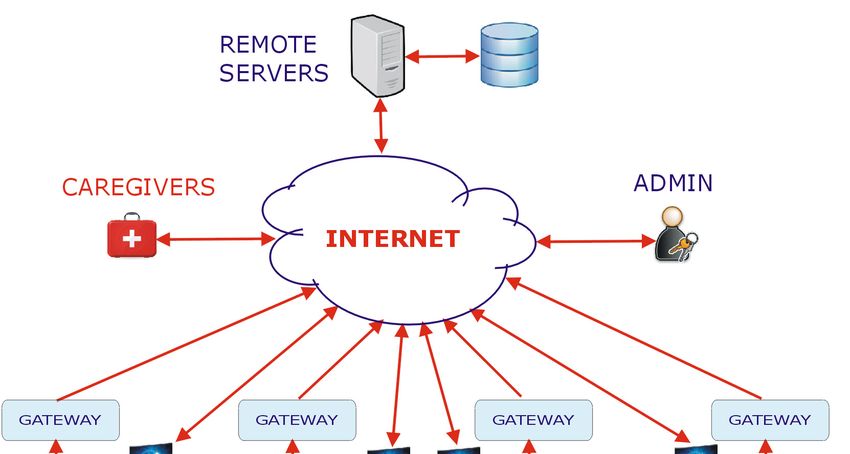
Sensors 2019, 19, 2264                                                                                           2 of 15

 Sensors 2018, 18, x FOR PEER REVIEW                                                                           2 of 15
       On the other hand, the unprecedented progress of technology (wearable sensors, ICT, smart
phones  On  theother
          and    other  hand,devices,
                      mobile   the unprecedented        progress of technology
                                         wireless communications,       etc.) enables(wearable   sensors, ICT,
                                                                                        the development         smart
                                                                                                           of effective
  phones    and   other   mobile   devices,    wireless   communications,
solutions to help older people to live independently in their homes.           etc.)  enables  the  development     of
  effective solutions   to help older   people   to live independently    in their  homes.
       The research aimed at harmonizing the aging society with the technological innovations received
        The ofresearch
a variety       names in aimed   at harmonizing
                            the literature.            the aging
                                               For example,     thesociety   with the
                                                                    term “smart          technological
                                                                                     home”   designatesinnovations
                                                                                                          a residence
  received   a  variety  of  names   in  the  literature.  For  example,   the  term   “smart
augmented with sensors, actuators, data processing, and communication devices aiming to improve home”   designates   a
  residence   augmented     with  sensors,   actuators,   data  processing,  and   communication     devices
comfort, security, the healthcare of the inhabitants, or to contribute to a better energy management of       aiming
  to building
the   improve [7,8].
                comfort, security, the healthcare of the inhabitants, or to contribute to a better energy
  management      of thetelemonitoring,
       Telemedicine,     building [7,8]. and telecare are partly overlapping concepts designating the
technologies capable of providing and
        Telemedicine,    telemonitoring,     remotetelecare  are consultations,
                                                        medical   partly overlapping      concepts
                                                                                     remote         designating
                                                                                             monitoring            the
                                                                                                            of certain
  technologies parameters,
physiological     capable of providing        remote medical
                                 remote supervision        of theconsultations,     remote or
                                                                   medical treatments,       monitoring    of certain
                                                                                                other health-related
  physiological    parameters,
activities or habits [9,10].      remote   supervision     of  the medical    treatments,   or  other health-related
  activities or habits [9,10].
       Ambient assisted living (AAL) designates the use of any technological means, integrated in the
        Ambient assisted living (AAL) designates the use of any technological means, integrated in the
living and working environment, in order to enable users to live independently and to remain active
  living and working environment, in order to enable users to live independently and to remain active
while avoiding social isolation into old age [11,12].
  while avoiding social isolation into old age [11,12].
       Gerontechnology [13,14] is concerned with the research on the specific medical and social needs
        Gerontechnology [13,14] is concerned with the research on the specific medical and social needs
of the elderly, and the technological response to these needs, not necessarily in connection with the
  of the elderly, and the technological response to these needs, not necessarily in connection with the
living environment.
  living environment.
       The definition of “e-Health” varies from “the integration of the Internet into health care”, to “the
        The definition of “e-Health” varies from “the integration of the Internet into health care”, to
use of ICT in the health care sector for clinical, educational, or administrative purposes” [15].
  “the use of ICT in the health care sector for clinical, educational, or administrative purposes” [15].
       This multitude of perspectives led to a wealth of solutions. Starting from the comprehensive
        This multitude of perspectives led to a wealth of solutions. Starting from the comprehensive
surveys of the recent literature available in Refs. [7,8,16–20], we derived a taxonomy of the research
  surveys of the recent literature available in Refs. [7,8,16–20], we derived a taxonomy of the research
directions in AAL based on the explicit goals of the AAL Joint Programme, formulated in Ref. [21].
  directions in AAL based on the explicit goals of the AAL Joint Programme, formulated in Ref. [21]. It
It is shown in Figure 1.
  is shown in Figure 1.

       Figure1.1.A A
      Figure          taxonomy
                   taxonomy      of research
                             of the the research  directions
                                             directions      in ambient
                                                        in ambient        assisted
                                                                   assisted         living based
                                                                            living (AAL)    (AAL)onbased  on the
                                                                                                    the objectives
       objectives  formulated by  the AAL  Joint
      formulated by the AAL Joint Programme.     Programme.

      Thegeneral
     The   generalstructure
                   structureofofaatypical
                                   typical AAL
                                           AAL system
                                                 system is presented in Figure
                                                                          Figure 2.
                                                                                  2. Basically,
                                                                                     Basically,such
                                                                                                suchaasystem
                                                                                                       system
 includesa number
includes   a number     of sensors
                    of sensors       to the
                               to track  track the interactions
                                            interactions betweenbetween      theperson
                                                                   the assisted   assisted
                                                                                         andperson   and the
                                                                                              the environment
 environment
and            and uses
     uses the sensor   datathe  sensor
                            to infer     data to infer
                                      information      information
                                                    about             about
                                                           the activities     the subject.
                                                                          of the   activitiesFurthermore,
                                                                                               of the subject.
                                                                                                           the
 Furthermore, the activities are analyzed from the perspective of the health and safety of the assisted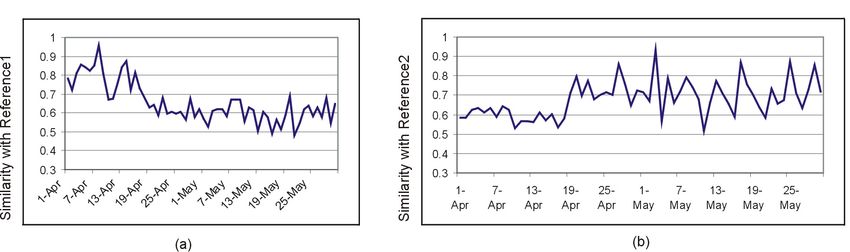
Sensors 2019, 19, 2264 3 of 15
Sensors 2018, 18, x FOR PEER REVIEW 3 of 15
activitiesand,
person are analyzed from the perspective
upon detection of the health
of any anomaly or and safety
risk, theof the assisted
system person
either and, upon
issues local
detection of any anomaly or risk, the system either issues
warnings/reminders or sends alert messages to remote caregivers. local warnings/reminders or sends alert
messages to remote
An excellent caregivers.
review of the ambient sensors used for elderly care is available in Ref. [22]. This
class of sensors includes: the
An excellent review of ambient
Passive sensors
infrared usedmotion
(PIR) for elderly care is available
detectors, magneticinswitches,
Ref. [22]. This class
pressure,
of sensors includes: Passive infrared (PIR) motion detectors, magnetic switches, pressure,
temperature and CO2 concentration sensors, RFID (radio frequency identification), sound and temperature
and CO2 concentration
vibration sensors, and sensors, RFID (radio
others based frequency
on emerging identification),
technologies suchsound and vibration
as silicon sensors,
photomultipliers
and others
(SiPMs) [23].based on emerging technologies such as silicon photomultipliers (SiPMs) [23].
Figure 2. A
A general
general structure of a typical AAL system.
A special type of ambient sensors are the video video sensors.
sensors. The research on video-based activity
independently from AAL, in the larger context of machine vision, with notable
recognition evolved independently
applications in
applications in surveillance,
surveillance,health healthmonitoring,
monitoring, andand general
general human–computer
human–computer interfaces
interfaces [24,25].
[24,25]. As
As shown in Ref. [25], video-based human activity recognition delivered
shown in Ref. [25], video-based human activity recognition delivered the most promising results, the most promising results,
but this
thisapproach
approach remains
remainsthe most
the mostintrusive and is considered
intrusive inappropriate
and is considered for long-term
inappropriate for monitoring.
long-term
Finally, wearable sensors [26,27] are designed to be worn 24/7 and constantly monitor certain
monitoring.
biomedical
Finally,parameters (e.g., pulse
wearable sensors rate,are
[26,27] blood pressure)
designed or the
to be worn physical
24/7 and motion of the subjects
constantly monitor(e.g., the
certain
gait or falls).parameters
biomedical Notable examples
(e.g., pulseof such
rate, sensors are inertial
blood pressure) or sensors (accelerometers
the physical motion of the andsubjects
gyroscopes),
(e.g.,
sensors
the gaitfor orperipheral
falls). Notablecapillary oxygenof
examples saturation (SpO2 )are
such sensors or galvanic skin response
inertial sensors (GSR). In most
(accelerometers and
cases, they aresensors
gyroscopes), attached fortoperipheral
a wristband or included
capillary in smart
oxygen watches
saturation (SpOor smart phones. skin response
2) or galvanic
(GSR). TheIn complexity
most cases, of theare
they data preprocessing
attached subsystem
to a wristband is closely
or included inlinked to sensorortechnology.
smart watches smart phones. For
example, binary sensors
The complexity need
of the dataonly minimal preprocessing
preprocessing subsystem is(e.g., pulse
closely counting),
linked to sensorbuttechnology.
others, like Forthe
SpO2 , GSR,
example, inertial,
binary and video
sensors sensors,
need only require
minimal specific and relatively
preprocessing (e.g., pulse complex signal
counting), butconditioning
others, like andthe
calibration
SpO 2, GSR,modules.
inertial, and video sensors, require specific and relatively complex signal conditioning
In what concerns
and calibration modules. the implementation of the actual data processing subsystem, this largely depends
on the Ingranularity
what concerns of thethedesired output: While
implementation of most of the proposed
the actual solutions
data processing attempt a fine
subsystem, this grained
largely
discrimination
depends on theof the activities
granularity of desired
of the the daily life (ADL)
output: Whileofmost the of
assisted personssolutions
the proposed [28,29], others
attempt are
a
focused
fine on long-term
grained lifestyleofmonitoring
discrimination the activities andofonthe
detecting deviations
daily life (ADL) from of thecertain
assistedexpected
persons behaviors
[28,29],
considered
others are “normal”
focused on [30,31].
long-term lifestyle monitoring and on detecting deviations from certain
Despite
expected the remarkable
behaviors considered performances
“normal” [30,31].recorded in the laboratory and reported in the literature,
thereDespite
are still the
veryremarkable
few real-lifeperformances
applications of activity in
recorded recognition to support
the laboratory the independent
and reported living of
in the literature,
the elderly.
there are stillAmong
very few thereal-life
reasonsapplications
for this apparent paradox,
of activity we count:
recognition to support the independent living
of the elderly. Among the reasons for this apparent paradox, we count:
• The set of sensors used and their spatial distribution is highly dependent on the specific needs of
• the assistedTheperson
set of sensors
and their used andenvironment,
living their spatial hence
distribution is highlytodependent
the difficulties reproduce on thethe specific
solution in
aneeds of the
different assisted
context. person
Often, evenand their sensor
a simple living environment,
change may result hence in the need
difficulties
to traintothereproduce
network
the solution
again. In other in awords,
different
thesecontext.
systems Often, even
are not a simple
scalable andsensor change
have low may result
tolerance in the
to sensor need to
faults.
• train the
Most of thenetwork
existing again. In other
solutions words, these
are perceived systems are
as intrusive andnot scalable
raise privacy and have low
concerns tolerance
at the users.
• to sensor faults.
They are expensive.
• Most of the existing solutions are perceived as intrusive and raise privacy concerns at
the users.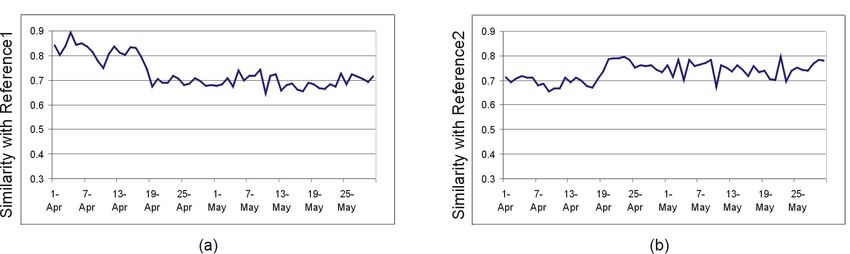
Sensors 2019, 19, 2264                                                                                        4 of 15

•     Finally, it is not without importance to note that most of the existing solutions for AAL tend to
      treat the assisted persons as totally helpless and neglect the fact that many of them are capable
      and willing to provide some sort of assistance to similar peers. Knowing that assigning even very
      limited responsibilities to the elderly, like watering a plant, can help them to live happier and
      longer [32], we suggest that involving the assisted persons in ICT-mediated groups for P2P health
      and lifestyle monitoring might be psychologically beneficial for them.
     In this general context, the study described in this article aims to overcome some of the
abovementioned limitations. We propose a non-intrusive data-driven solution to detect deviations from
the long-term daily activity routine of the elderly people living alone based on low-cost binary sensors,
like PIR motion detectors or magnetic door contacts. Our research hypothesis can be formulated
as follows:
      “The structure of the activities can be encoded in a series of visual representations of the interactions
      between the user and their living space, starting from the data provided by a set of low-cost binary
      sensors, and this encoding is sufficient for detecting anomalies in the daily activity routines.”
     Key contributions:
     Starting from the distinction formulated in Ref. [33] between “location” (defined as a specific
position in space) and “place” (a location with behavioral meaning attached), we propose an abstraction
of the residential living space represented as a collection of behaviorally significant places (bedroom,
kitchen, bathroom, living room), located arbitrarily in a generic Cartesian space. A number of low-cost
binary sensors (PIR motion detectors and magnetic door contacts) are located in each place of this
space. Furthermore, we use the sensor data and the concept of “virtual pheromones”—defined in our
previous work [34] as “traces created by the agents not in the environment, but in a representation
thereof, a map”—to create visual images of the pheromone distribution maps, which describe the
spatiotemporal evolution of the interactions between the user and the environment. We propose
a method to detect deviations from the activity routines by computing a similarity index between
these pheromone-based activity maps and a set of reference images created starting from the average
values of the sensor data. This data-driven approach does not require explicit labelling of activities for
detecting deviations from the previously recorded routine.
     The remainder of this presentation is structured as follows:
     Section 2 is a brief review of the closely related work. Section 3 contains a description of the
proposed method. In Section 4, we present the experimental results, while Section 5 is reserved
for discussion.

2. Related Work
    According to Ref. [35], there are four types of abnormal (or deviating) behaviors detectable starting
from sensor data:
•     Known behavior in a deviating spatial context (e.g., sleeping in the kitchen);
•     Know behavior occurring at a deviating moment in time (e.g., having dinner very late in the night);
•     Known behavior with an abnormal duration (e.g., sleeping until noon, or spending too much time
      in the bathroom);
•     Behavior resulting in abnormal/unexpected sensor firings patterns (e.g., abnormal gait or falling).
      One particular type of abnormal behavior—the fall—has been extensively studied, and there
exists a whole literature dedicated to fall detection systems (see Refs. [36,37]).
      The systems for detecting all the other types of abnormal behavior (surveyed in
Refs. [12,18,29,31,38,39]) implicitly rely of some sort of synthetic representation of the human activity
in a spatiotemporal context.
      For example, Ref. [40] proposed color-coded “activity density maps”, wherein black cells represent
time away from home, white corresponds to very low densities of activity, and color shades between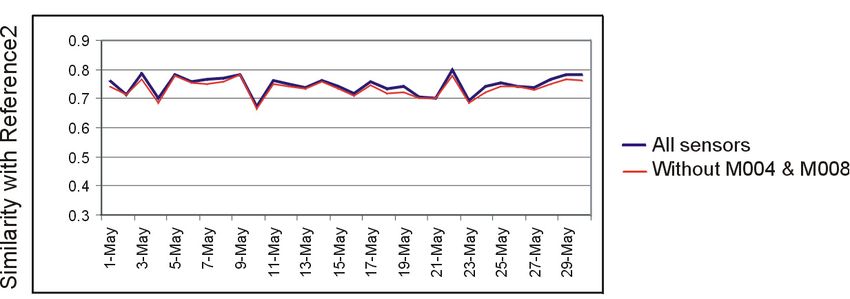
Sensors 2018, 18, x FOR PEER REVIEW 5 of 15
Sensors 2019, 19, 2264 5 of 15
For example, Ref. [40] proposed color-coded “activity density maps”, wherein black cells
represent time away from home, white corresponds to very low densities of activity, and color
yellow
shades and dark blue
between encode
yellow the number
and dark of sensor
blue encode theevents
number perofhour. A similar
sensor events solution butAwithout
per hour. similar
detecting
solution but without detecting the time away from home intervals and with different colorincodes
the time away from home intervals and with different color codes can be found Ref. [41]
can
(see Figure 3).
be found in Ref. [41] (see Figure 3).
Figure 3.
Figure 3. An
An example
example of
of color-coded activity density
color-coded activity density map.
map.
It should
shouldbe benoted
notedthat
thatthis type
this of activity
type maps
of activity doesdoes
maps not embed any information
not embed aboutabout
any information the space
the
where the activities
space where occur. occur.
the activities However, the spatial
However, dimension
the spatial of the of
dimension activities remains
the activities important
remains from
important
the
fromperspective of detecting
the perspective deviating
of detecting behaviors.
deviating The authors
behaviors. The ofauthors
Refs. [42,43] solved
of Refs. the problem
[42,43] solved theof
linking
problemsensor data with
of linking the data
sensor locations
withwhere the observed
the locations whereactivities occur using
the observed the concept
activities of virtual
occur using the
pheromones defined
concept of virtual in Ref. [34].defined in Ref. [34].
pheromones
Considering a metric space (M,d), where M is a set of points and d is a distance distance function,
function, we
defined a “virtual pheromone source” S as a point, characterized by a position and a real positive
scalar P,
P, called
called“pheromone
“pheromoneintensity”.
intensity”.The
Thepheromones
pheromones diffuse in space,
diffuse so that
in space, at theatdistance
so that x fromx
the distance
the
fromsource, the pheromones
the source, the pheromonesfrom source S can be
from source “sensed”
S can with the
be “sensed” withintensity p(x): p(x):
the intensity
− x x f or x ≤ σ
PP11 σ for x
p(x) =
p( x) 0 f or x > σ , , (1)
(1)
0 for x
where σ is a positive constant called diffusion range. If N discrete pheromone sources exist, then the
where isresultant
aggregated intensity
a positive due
constant called superposition
to thediffusion of If
range. effects is PR : pheromone sources exist, then
N discrete
the aggregated resultant intensity due to the superposition of effects is PR:
N !
X d
PR = N Pk 1 − kd , (2)
P P 1 σ k ,
R k =1 k (2)
k 1
where Pk is the intensity of the source Sk and dk is the distance from the current point to the source Sk .
where Pk is the
Finally, theintensity of the sourceevaporate,
virtual pheromones Sk and dk is thethe
i.e., distance from
intensity of the
the current pointsources
pheromone to the source Sk.
decrease
Finally, the virtual pheromones
with time. Assuming a linear variation: evaporate, i.e., the intensity of the pheromone sources decrease
with time. Assuming a linear variation:
N !
ddk t −t tk t
XN
P = P − k 1−
PR Pk 1 σ 1 τ ,k ,
R
k 1 (3)
(3)
kk=
1
1
where ttkk is
where is the
the moment
moment of of creation
creation of
of the
the source and τis is
source SSkk,, and the evaporation
the evaporation constant.
constant.
Starting
Starting from
from this
this model,
model, inin Ref.
Ref. [42],
[42], it
it was
was assumed
assumed that
that there
there exists
exists an
an indoor
indoor localization
localization
system
system (e.g., the one presented in Ref. [44]) capable of providing accurate coordinates of the assisted
(e.g., the one presented in Ref. [44]) capable of providing accurate coordinates of the assisted
person
person within
withinaaknown
knownenvironment.
environment.Periodically,
Periodically, a marking
a markingsubsystem
subsystem reads the location
reads of theofuser
the location the
and
usercreates pheromone
and creates marks in
pheromone the corresponding
marks position ofposition
in the corresponding a map ofofthe a environment, conveniently
map of the environment,
structured
conveniently as structured
a grid of cells. Theoflocal
as a grid cells.pheromone marks diffuse
The local pheromone marks indiffuse
space and evaporate
in space in time,
and evaporate
resulting in an aggregated track that describes the recent motion of the observed subject,
in time, resulting in an aggregated track that describes the recent motion of the observed subject, as as shown in
Figure
shown 4a. Subsequently,
in Figure the aggregated
4a. Subsequently, the track is cellwise
aggregated compared
track is cellwisefor compared
similarity with a referencewith
for similarity tracka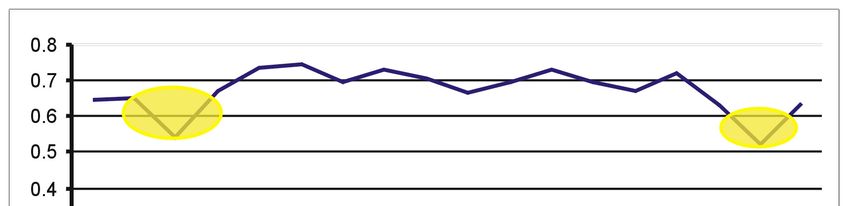
Sensors 2019, 19, 2264 6 of 15
Sensors 2018, 18, x FOR PEER REVIEW 6 of 15
generatedtrack
reference in thegenerated
same mannerin the forsame
a period
mannerof time
forselected
a periodbyofa time
human operator.
selected by aDissimilarities
human operator. that
exceed a certain threshold are reported. The authors argue that this system has
Dissimilarities that exceed a certain threshold are reported. The authors argue that this system has good performances
with respect
good to localization
performances errors,tobut
with respect in our opinion,
localization errors,it but
still in
remains very sensitive
our opinion, it still to even small
remains very
variationstoineven
sensitive the small
environment
variations (e.g., moving
in the a piece of
environment furniture
(e.g., moving may lead of
a piece to furniture
changes of maythelead
user's
to
habitual motion pathways through the environment, resulting in large
changes of the user's habitual motion pathways through the environment, resulting in large deviations from the recorded
routine andfrom
deviations systematic false alerts).
the recorded routine and systematic false alerts).
The solution
solution described Ref.
described in [43] does
in Ref. [43] notdoesneednota localization subsystem:subsystem:
need a localization The virtualThe pheromone
virtual
sources are placed
pheromone sourceson a Cartesian
are placed onmap of the environment
a Cartesian map of the in fixed positions,
environment each positions,
in fixed correspondingeach
to a binary sensor.
corresponding Every sensor.
to a binary time the sensor
Every timeis the
triggered
sensor by the presence
is triggered of presence
by the the user of in the
its proximity,
user in its
the pheromone
proximity, source located
the pheromone source in the corresponding
located position onposition
in the corresponding the mapon releases
the map a fixed amount
releases of
a fixed
pheromones.
amount Figure 4b Figure
of pheromones. shows 4b theshows
pheromone intensitiesintensities
the pheromone map generated by four sensors
map generated by four recently
sensors
activated,
recently in the assumption
activated, of a linear
in the assumption of adiffusion. The pheromone
linear diffusion. The pheromoneintensities are encoded
intensities in shades
are encoded in
of gray, between black (no pheromones detected in that point) and
shades of gray, between black (no pheromones detected in that point) and white (maximum white (maximum intensity of
pheromones
intensity in the respective
of pheromones in theposition).
respective position).
Figure
Figure 4. Examples
Examples of
of pheromone-based
pheromone-based activity
activity maps
maps described in Refs. [42,43].
Images of the type presented
Images presented in Figure 4b can be considered “snapshots”
“snapshots” ofof the recent activity
activity
within the
theobserved
observedarea. Pairs
area. of such
Pairs images
of such (x,y) can
images (x,y)becan
compared for similarity
be compared using the using
for similarity structural
the
similarity index
structural SSIM
similarity defined
index in defined
SSIM Ref. [45].in Ref. [45].
2 x µx y +y
((2µ C1C
)(2xy +xy C2 )C 2 )
)(12σ
SSIM x,yy))=
SSIM(x, , , (4)
(4)
((µx +µ y +CC
x
2 2
y
2 2 σx 2 +2 σy 2 +2C2 )C
1 )()(
x y
1 2)
where µx , µ y , σx 2 , σ2y 2 are2the mean and variance values and σxy is the covariance for x and y. C1 and C2
where x , for:
are notations y , x , y are the mean and variance values and xy is the covariance for x and y.
C1 and C2 are notations for: C1 = (k1 L)2 ; C2 = (k2 L)2 , (5)
with k1 , k2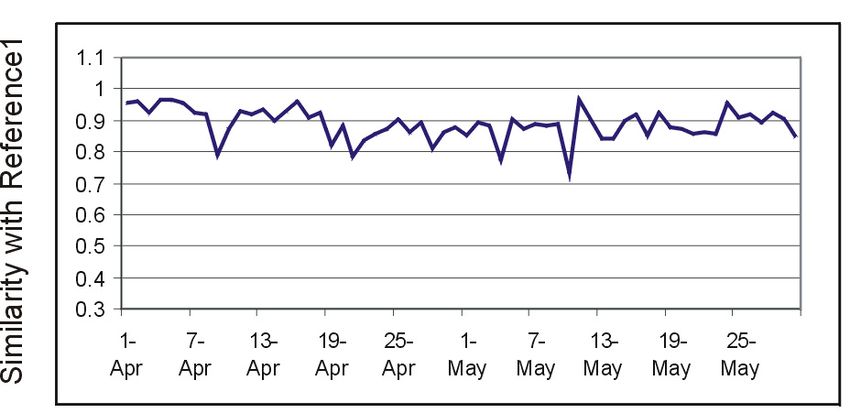
Sensors 2019, 19, 2264 7 of 15
3. Method and Datasets
Sensors 2018, 18, x FOR PEER REVIEW 7 of 15
Arguably, from the perspective of assessing the daily life routine, many details concerning the
Arguably,
environment where from
Sensors 2018, 18, xthe
the FOR perspective
PEER REVIEW of assessing the daily life routine, many details concerning 7the
elderly live (e.g., the surface of the apartment, the type and spatial distribution of 15
environment
of the furniture,where
the size theandelderly
locationliveof(e.g., the surface are
the appliances) of unimportant.
the apartment,Stripping
the type away and spatial
all these
distribution Arguably,
of the from thethe
furniture, perspective
size and oflocation
assessingofthe
thedaily life routine,
appliances) are many details concerning
unimportant. Stripping the
environmental details would greatly simplify the task of long-term monitoring
environment where the elderly live (e.g., the surface of the apartment, the type and spatial of the activity of the
away all these environmental details would greatly simplify the task of long-term monitoring of the
people living in the respective
distribution environments.
of the furniture, the size and location of the appliances) are unimportant. Stripping
activity of the people living in the respective environments.
To this purpose,
away all these we propose an details
environmental abstract model
would of the
greatly livingthe
simplify environment consisting
task of long-term of a set
monitoring of
of the
To this purpose, we propose an abstract model of the living environment consisting of a set of
behaviorally significant
activity “places”
of the people livingarbitrarily distributed
in the respective in a generic space. For example, Figure 5a
environments.
behaviorally significant “places” arbitrarily distributed in a generic space. For example, Figure 5a
To this
presents the floor plan purpose, we propose
and sensor an abstract
deployment model
for one of the
of the living environment
CASAS smart homesconsisting
testbedsof a set of
(namely,
presentsbehaviorally
the floor plan and sensor deployment for distributed
one of the CASAS smart homes testbeds (namely,
HH126, see Ref. [46]), while Figure 5b,c shows the corresponding generic space with the location 5a
significant “places” arbitrarily in a generic space. For example, Figure of
HH126,presents
see Ref. the[46]), while
floor planFigure 5b,c deployment
and sensor shows the corresponding
for one genericsmart
of the CASAS spacehomes
with the location
testbeds of
(namely,
thethe
four places
fourHH126, (P1-bedroom,
places see(P1-bedroom, P2-Kitchen,
P2-Kitchen, P3-bathroom,
P3-bathroom, P4-living room)
P4-living room) and a
and spacesample
a sample pheromone
Ref. [46]), while Figure 5b,c shows the corresponding generic with pheromone
the location of
distribution map
distribution for
mapplaces this
for thisspace.
space.
the four (P1-bedroom, P2-Kitchen, P3-bathroom, P4-living room) and a sample pheromone
distribution map for this space.
Figure
5. 5.
(a)(a) Floor
Floor planand
andsensor
sensor layoutfor
forCASAS
CASAS HH126
HH126 testbed, (b)
(b)the corresponding generic
Figure Figure 5. plan
(a) Floor plan andlayout
sensor layout for CASAS HH126 testbed,
testbed, the corresponding
(b) the correspondinggeneric
generic
space,
space, andand(c)(c)
a a samplepheromone
sample pheromonemapmapdescribing
describing the
the activity
activity within
within this
thisspace.
space.
space, and (c) a sample pheromone map describing the activity within this space.
ForFor this
this particular
particular
For sensorlayout,
sensor
this particular layout,layout,
sensor thecorrespondence
the correspondence between
between
the correspondence sensors
sensors
between and places
andand
sensors placesis:is:is:
places
{P1 } = {{P
M1}010 } ∪010
{M {M}
011}∪
{M {M
011} 013
{M}013}
{P1 } = {M010} ∪ {M011} ∪ {M013}
{P2 }{P=2{}{P=
M 003 M∪003
{}
2 }{M003}
{M
∪ }004
{M}∪
{M004} ∪{
004M
} 005 ∪
{M}∪005
{M005} {}M015
{M015}{M}015}
, , , (6)(6)
(6)
{P3 }{P=3{}{PM 012 } ∪012
=3 }{M012}
{M {M
∪ 014} 014}
{M014}
} {M
{P4 }{P=4{}{P=
M {M001} ∪ {M002} ∪ {M006} ∪ {M007} ∪ {M008} ∪ {M009}
{}M∪001
4 }001 {M}
002}∪
{M {M
002} 006 ∪ {}M007
{M}006 ∪ {}M
{M}007 008 ∪}{M
{M }008 {009} }
M 009
where {Pi }{where
denotes
P {Pi }thedenotes
set
the of
setsensor events associated withwith
thewith
respective place, Mk isMkthe
Mkismotion
i } denotes
where the
of set of sensor
sensor events events associated
associated the the respective
respective place,
place, is
thethe
detector sensor k, and {Mk} is the set of events generated by the sensor Mk.
motion motion
detectordetector k, and k,{Mk
sensor sensor and}{Mkis the} is
setthe
of set of events
events generated
generated by sensor
by the the sensorMkMk . .
The raw sensorThe raw
data for data
sensor
the CASAS
for the
datasets,
CASAS
downloaded
datasets,
from
downloaded
Ref.Ref.
from
[47], is structured
[47], is structured
as shown
as shown
The raw sensor data for the CASAS datasets, downloaded from Ref. [47], is structured as shown
in Figure 6. in6.
Figure 6.
in Figure
2013-09-28 16:44:33.287172 M013 OFF
2013-09-28 16:44:33.845267 M013 ON
2013-09-28 16:44:35.722460 M013 OFF
2013-09-28 16:44:37.409018 M013 ON
2013-09-28 16:44:39.659969 M013 OFF
2013-09-28 16:44:41.720457 M013 ON
2013-09-28 16:44:43.970157 M013 OFF
2013-09-28 16:44:45.360782 M010 ON
2013-09-28 16:44:45.883728 M012 ON
2013-09-28 16:44:46.487170 M010 OFF
2013-09-28 16:44:47.013099 M012 OFF
2013-09-28 16:44:50.556849 M014 ON
2013-09-28 16:44:51.680213 M014 OFF
2013-09-28 16:44:55.992485 M014 ON
The raw
Figure 6.Figure data
6. The rawformat in theinCASAS
data format datasets.
the CASAS datasets.
Figure 6. The raw data format in the CASAS datasets.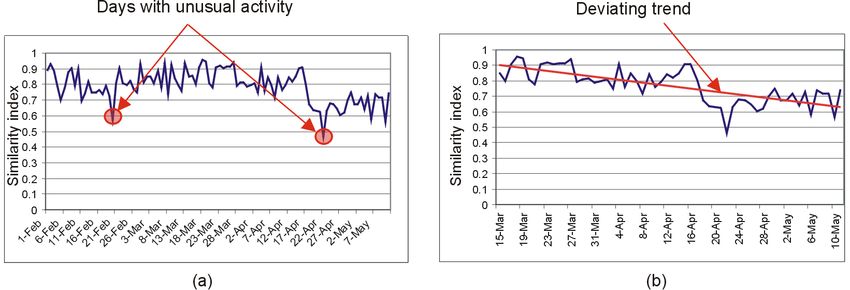
Sensors 2019, 19, 2264 8 of 15
Sensors 2018, 18, x FOR PEER REVIEW 8 of 15
Sensors 2018, 18, x FOR PEER REVIEW 8 of 15
In the preprocessing phase, the following operations were performed on the raw data:
InIn the
the preprocessingphase,
preprocessing phase,the
thefollowing
following operations
operations were
wereperformed
performedon
onthe
theraw
rawdata:
data:
All the OFF events associated with the motion detectors were filtered out, because
• • Allthese
the OFF All the OFF
events
sensors
eventswith
areassociated
designed to
associated
turntheOFF
motionwithdetectors
the motion
automatically weredetectors out,
a fewfiltered
werebecause
seconds after
filteredthese
out, becauseare
the momentsensorsthey are
these sensors
designed to turnare
OFFdesigned to turn OFF
automatically fewautomatically
seconds afterathe fewmoment
secondsthey
afterare
thetriggered,
moment they are
triggered, regardless of the externala activity. regardless
triggered, regardless of the external activity.
of the external activity.
Repeated signals from the same sensor occurring faster that one event per minute were
• Repeated signals from the same sensor occurring faster that one event per minute were
• Repeated signals
also filtered from
out as the same sensor occurring faster that one event per minute were also
irrelevant.
also filtered out as irrelevant.
filtered outThe sensors were associated with the places P1–P4 according to the rules in Equation
as irrelevant.
• The sensors were associated with the places P1–P4 according to the rules in Equation
• The (6).
sensors were associated with the places P1–P4 according to the rules in Equation (6).
(6).
Finally,
• • Finally, theFinally, the sets of events {P1 }....{sorted
P4 } were sortedintervals
by time intervals of one hourand
each,the
sets ofthe sets of{Pevents
events 1 }....{P4{}Pwere by time of one hour each,
1 }....{P4 } were sorted by time intervals of one hour each,
and
cardinalsthe cardinals of these subsets were presented in distinct daily activity files, as shown in
and the of these subsets
cardinals of thesewere presented
subsets in distinctin
were presented daily activity
distinct files,
daily as shown
activity in Figure
files, as shown 7.in
Figure 7.
Figure 7.
Figure
Figure 7.7.The
Thesynthetic
syntheticactivity
activity data
data for one
one day
day after
afterthe
thepreprocessing
preprocessingphase.
phase.
Figure 7. The synthetic activity data for one day after the preprocessing phase.
Using
Using these
these dataand
data andthe
theconcept
conceptof
ofvirtual
virtual pheromones
pheromones modeled
modeledwithwithEquation
Equation(3), wewe
(3), created
created
Using these data and the concept of virtual pheromones modeled with Equation (3), we created
for
forfor each
each day aset
setofof24
24images
images (128 ××128 pixels ininsize) representing thethe
hourly pheromone maps. A
each day a set of 24 images (128 × 128 pixels in size) representing the hourly pheromone maps.maps.
day a 128 pixels size) representing hourly pheromone A
fragment
A fragment
fragment of of the
ofthe resulting
theresulting activity
resultingactivity maps
activitymaps
maps for five days is shown in Figure 8.
forfor five
five days
days is shown
is shown in Figure
in Figure 8. 8.
Figure 8. A fragment of the activity map built with hourly images of the pheromone distributions.
Figure
Figure 8.8.AAfragment
fragmentof
ofthe
theactivity
activity map
map built
built with
withhourly
hourlyimages
imagesofofthe
thepheromone
pheromonedistributions.
distributions.
Sensors 2019, 19, 2264 9 of 15
Sensors 2018, 18, x FOR PEER REVIEW 9 of 15
Compared to
Compared to the
the previously
previously described
described activity
activity maps,
maps, like
like the
the one
one depicted
depicted in in Figure
Figure 3,3, this
this type
type
of activity map is substantially richer in information because it contains not just an overall indexthe
of activity map is substantially richer in information because it contains not just an overall index of of
intensity
the of activity
intensity but also
of activity but embeds information
also embeds about about
information the places where the
the places activities
where occurredoccurred
the activities and the
relative
and the weights of these of
relative weights places
thesefrom thefrom
places perspective of the spatial
the perspective of thedistribution of activity.
spatial distribution of activity.
The corresponding hourly images can be compared for any two days, as in Ref. [43], but
The corresponding hourly images can be compared for any two days, as in Ref. [43], but with
with
little practical
little practicalbenefits.
benefits.AAmore moreefficient
efficientwaywayto use these
to use mapsmaps
these is by is
creating a set ofa reference
by creating images
set of reference
starting starting
images from thefrom average
thevalues
average of sensor
values data over adata
of sensor certain
over time interval.
a certain Theinterval.
time referenceThetime interval
reference
(e.g., a week) (e.g.,
time interval can be manually
a week) can selected
be manuallyby a selected
caregiverbyoraacaregiver
member or of athe family,of
member asthe
in Ref. [42],asbut
family, in
it is also possible to select a number of consecutive days with the lowest dispersion
Ref. [42], but it is also possible to select a number of consecutive days with the lowest dispersion of of the values of
sensor data.
the values of sensor data.
In the
In the first
first stage
stage of of our
our experiment,
experiment, we we created
created the
the reference
reference images
images by by averaging
averaging thethe sensor
sensor
data hour by hour for an arbitrary interval of one week. Then, we
data hour by hour for an arbitrary interval of one week. Then, we computed with Equation (4)computed with Equation (4) the
the
structural similarity indices for the entire interval studied with respect to the
structural similarity indices for the entire interval studied with respect to the reference image set. reference image set.
By simply
By simply plotting
plotting thethe similarity
similarity index
index against
against time,
time, it
it is
is possible
possible to to identify
identify either
either certain
certain days
days
with unusual activity (i.e., with lower similarity indices), as shown in Figure
with unusual activity (i.e., with lower similarity indices), as shown in Figure 9a, or trends of 9a, or trends of evolution
that indicate
evolution thatdeviations from the previous
indicate deviations from theactivity
previous routine (Figure
activity 9b).(Figure 9b).
routine
Figure 9. (a) Days with
with aa low
lowsimilarity
similarityindex
indexmay
mayindicate
indicateunusual
unusualactivity.
activity.
(b)(b) Descending
Descending trends
trends in
in the evolution of the similarity index may indicate deviations from the activity
the evolution of the similarity index may indicate deviations from the activity routine.routine.
The CASAS HH126 dataset is not annotated, but it has a useful property: The set of sensors was
upgraded after
upgraded after the data recording started.
started. Specifically,
Specifically, onon 18 April
April 2014,
2014, new
new sensors
sensors (M002,
(M002, M003,
M003,
M004, M005,
M005, M006,
M006,M008,
M008,M010,
M010,M014M014and andM015)
M015)werewere added
added to to
thethe
initial set.set.
initial This major
This shiftshift
major in the
in
sensor
the sensordatadata
flowflow
should be clearly
should identified
be clearly by the
identified byactivity monitoring
the activity system
monitoring as anas
system event of theoftype
an event the
illustrated
type in Figure
illustrated 9b. To9b.
in Figure make To use
make of this
use property, we selected
of this property, the time the
we selected interval
timefor this study
interval for
for this
60 days
study forbetween
60 days1between
April and 30 May
1 April and 2014 to include
30 May 2014 tothe date ofthe
include 18 date
Aprilof2018.
18 April 2018.
Further, it is worth noting that the CASAS HH126 testbed contains exclusively PIR motion
detectors and magnetic door contacts as sensors—the same type of sensors that are extensively used
and already present in millions of homes throughout the world as components of low-cost intrusion
Demonstrating that
security systems. Demonstrating that this
this type
type ofof sensors
sensors can
can be
be used
used for
for efficient long-term activity
monitoring may stimulate
monitoring stimulate the manufacturers of security systems to implement certain functions of
activity monitoring as special features of their products.
In order
order totodemonstrate
demonstratethat thatthetheproposed
proposed solution
solutionis also capable
is also of detecting
capable isolated
of detecting days days
isolated with
unusual
with activity
unusual of the of
activity type
theillustrated in Figure
type illustrated 9a, we repeated
in Figure the experiment
9a, we repeated on a smaller
the experiment on a(18 days
smaller
between
(18 days 20 November
between 2008 and 7 December
20 November 2008 and 2008) but fully2008)
7 December annotated dataset,
but fully namelydataset,
annotated Kasterennamely
House
C, downloaded
Kasteren House from Ref. [48]. The
C, downloaded from Kasteren
Ref. [48].House C is a two
The Kasteren storyCbuilding,
House is a two with
story two bedrooms,
building, with
two bedrooms,
bathrooms,two andbathrooms,
multiple other living spaces, but it easily fits into the four places
and multiple other living spaces, but it easily fits into the four placesmodel of the
model of the living environment, by using the correspondence between the activity relevant places
and the sensors defined in Equation (7):Sensors 2019, 19, 2264 10 of 15
living environment, by using the correspondence between the activity relevant places and the sensors
defined in Equation
Sensors
Sensors (7):
2018, 18, x FOR
2018, 18, x FOR
PEER REVIEW
PEER REVIEW
10 of 15
10 of 15
{P{1 }S = {S05} ∪ {S29} ∪ {S39}
P11 }} =
{{P = {S 05 05}} ∪∪ {{S 29}} ∪
S 29 ∪ {{SS 39
39}}
{P2 } = {S07} ∪ {S13} ∪ {S18} ∪ {S20} ∪ {S21} ∪ {S22} ∪ {S23} ∪ {S27} ∪ {S30}
{{P =
= 3{{}S
P22 }} {P S=07 }} ∪
07{S08}∪ {{SS∪13
13 }} ∪
∪ {{∪S 18}} ∪
18
S{S11} ∪∪{{S 20 ∪
20}} ∪
S{S16} {{S 21}}∪∪
S 21
∪ {S25} {{S
S 22
∪{S35} ∪
∪ {{S
22∪}}{S38} 23}} ∪
S 23 ∪ {{S 27}} ∪
S 27 ∪ {{S
S 30
30}} (7) (7)
{S10}
{{P =
= 4{{}S
P33 }} {P S=08 }} ∪
∪ {{S
08{S06} S∪10
10}} ∪
{S15}∪ {{∪S 11}} ∪
11
S{S28} ∪∪{{S 16}} ∪
16
S{S36} ∪ {{S 25}} ∪
S 25 ∪ {{S 35}} ∪
S 35 ∪ {{SS 38
38}}
(7)
P4 }} =
{{P
4 = {{S 06}} ∪
S 06 ∪ {{S
S1515}} ∪∪ {{S 28}} ∪
S 28 ∪ {{S S 36
36}}
where Sxx denotes the sensor with the ID == xx.
where Sxx
Sxx denotes the
denotes
where
The preprocessing ofsensor
the sensor with
with the
this dataset the
wasID
ID ==
== xx.
xx.
slightly different because the respective testbed contains
The preprocessing
The preprocessing of this
of this dataset
dataset was slightly
was slightly different
different because
because the respective testbed contains
three pressure sensors, placed under the beds and couch, which reportthe respectivehigh
unusually testbed contains
levels of activity
three
three pressure
pressure sensors,
sensors, placed
placed under
under the
the beds
beds and
and couch,
couch, which
which report
report unusually
unusually high
high levels
levels of
of for
whenactivity
the user wasthe
when
actually
user was
asleep or resting.
actually asleep
Therefore,
or resting.
these sensors
Therefore, these
were
sensors
conventionally
were
muted
conventionally
activity when the user was actually asleep or resting. Therefore, these sensors were conventionally
10 min after each
muted accounted event.
muted for
for 10
10 min
min after
after each
each accounted
accounted event.
event.
The availability
The of annotations allowed us to make a moreaccurate
accurate selection of the reference
The availability of annotations allowed
availability of annotations allowed us us to
to make
make aa more
more accurate selection
selection of
of the
the reference
reference
interval. To this
interval.
interval. To
purpose,
To this
this purpose,
wewe
purpose, we
have
have used
have used
the
used the
minimum
the minimum
standarddeviations
minimum standard
deviations
standard deviations of of the
of the
duration
the duration
duration of
of sleep
of sleep
sleep
over
over seven consecutive days as a measure of the uniformity of the lifestyle. With this criterion, we
over seven seven consecutive
consecutive daysdaysas as
a a measure
measure of
of the
the uniformity
uniformity of
of the
thelifestyle. With
lifestyle. this
With criterion,
this criterion,
we we
selected
selected the the
week week
fromfrom 24–30
24–30 November
November 2008
2008 as
as a a reference
reference interval
interval for the
for Kasteren
the
selected the week from 24–30 November 2008 as a reference interval for the Kasteren C dataset. KasterenC dataset.
C dataset.
4.
4. Experimental
4. Experimental Results
Results
Experimental Results
4.1.
4.1. Results
4.1. Results withwith
Results CASAS
CASAS
with HH126
HH126
CASAS Dataset
Dataset
HH126 Dataset
In
In order to
to illustrate the
the change in
in the sensor data flow caused
In order order illustrate
to illustrate the change change
in the the sensor
sensor datadata
flowflow
caused byby
caused by adding
adding
adding newnew
new sensors
sensorson
sensors on
on1818
18April,
April, we
April, we the compared
compared the similarity
the similarity of the pheromone
of the pheromone based activity
based activity maps
maps for the interval 1
1 April
we compared similarity of the pheromone based activity maps for theforinterval
the interval
1 April April
2014–30
2014–30
2014–30 May
May 2014 with
with two reference intervals, before and after
afterofthe event
event of interest: Reference
May 2014 with
interval
two2014reference two reference
intervals, intervals,
before before
and after theand
event the
interest: of interest: interval
Reference Reference1 (1–7
interval 1 (1–7 March 2014), and reference interval 2 (1–7 June 2014). The results are shown in
1 (1–7 March 2014), and reference interval 2 (1–7 June 2014). The results are shown in Figure
Figure
March 2014), and reference interval 2 (1–7 June 2014). The results are shown in Figure 10.
10.
10.
SinceSince
many of the newly added sensors were located inthe the kitchen, we presumed that the
Since many
many of of the
the newly
newly added
added sensors
sensors were
were located
located inin the kitchen,
kitchen, wewe presumed
presumed that that the
the
dissimilarities between
dissimilarities
dissimilarities between
thethe
between the
intervals
intervals before
intervals before
and
before and
after
and after
18April
after 18
Aprilare
18 April
areeven
even
are even
more
more
more visible
visible
visible in
in the
in the
morning
the morning
morning
hours,hours,
whenwhen
hours, when the
the user
the user user is
is likely
is likely to to
likely use
to use
use the
the kitchen
thekitchen
kitchen toto prepare
prepare breakfast.
to prepare breakfast.The
breakfast. The
The similarity
similarity
similarity index
index computed
index computed
computed
for
for just just
for3just 3
h (7–10h (7–10
a.m.)
3 h (7–10 a.m.) shown
shown
a.m.) shown in
in in Figure
Figure 11 supports
Figure1111supports this
supports this hypothesis.
hypothesis.
this hypothesis.
Figure 10. The
10. (a) (a) The similarityindex
similarity index after comparison with a reference interval beforebefore
18 April 2014. (b)2014.
Figure
Figure 10. (a) The similarity index after comparison
after comparison with
with a reference
a reference interval
interval before 18 April182014.
April
(b)
The
(b) The similarity index after comparison with a reference interval after 18 April 2014.
Thesimilarity
similarityindex aftercomparison
index after comparison with
with a reference
a reference interval
interval afterafter 18 April
18 April 2014. 2014.
Figure 11. (a) The similarity index for the morning hours after comparison with a reference interval
FigureFigure 11.The
11. (a) (a) The similarity
similarity index
index forforthe
themorning
morning hours
hours after
aftercomparison
comparison with a reference
with interval
a reference interval
before 18 April 2014. (b) The similarity index for the morning hours after comparison with a
beforebefore 18 April
18 April 2014. 2014. (b)similarity
(b) The The similarity
indexindex formorning
for the the morning
hourshours after comparison
after comparison with with a
a reference
reference interval after 18 April 2014.
reference
interval interval
after 18 Aprilafter
2014.18 April 2014.Sensors 2019,
Sensors 2018, 19,
18, 2264
x FOR PEER REVIEW 11
11 of
of 15
15
Sensors
Sensors 2018,
2018, 18,
18, xx FOR
FOR PEER
PEER REVIEW
REVIEW 11
11 of
of 15
15
The bedroom was less affected by the sensor change in April 18—only one sensor (M10) was
The bedroom
The bedroom
bedroom was less
was the affected
lessactivity by
affectedmaps the
by the
the sensor
sensor change
change in April
in April 18—only
April 18—only
18—only one sensor
one sensor
sensor (M10)
(M10) was
was
added—and
The therefore,
was less affected by for the night
sensor changetimein (between midnight
one and 6 am) barely
(M10) was
added—and
added—and therefore,
therefore, the activity
theactivity
activity maps
maps for
for the night time (between midnight and 6 am) barely
reflect
added—andthe moment of April
therefore, the 18 (seemaps
Figure the the
for12). night
night timetime (between
(between midnight
midnight and 6 and 6 am) reflect
am) barely barely
reflect
reflect the
the moment
moment of
of April
April 18
18 (see
(see Figure
Figure 12).
12).
the moment of April 18 (see Figure 12).
Figure 12. The similarity index for the night time (between midnight and 6 am) barely reflects the
Figure
Figure 12.
12. The
Figurechange
12. The similarity
Thefrom
similarity
similarity index
index for
index for the
for the night
the night time
night time (between
time (between midnight
(between midnight and
midnight and 666 am)
and am) barely
am) reflects
barely reflects
barely the
reflects the
the
sensor April 18.
sensor change
sensor change
sensor from
change from April
fromApril 18.
April18.
18.
This suggests that the relative influence of individual sensors on the overall capacity of the
This
This suggests that the relative influence of
of individual sensors on the overall capacity of
of the
system tosuggests
This suggests that
thatthe
detect deviations relative
the from influence
relative of individual
theinfluence
activity is sensors
individual
routine on the
sensors
small, on
provided overall
the capacity
thatoverall of the
capacity
there exists a systemthe
certain
system
to detect to detect
todeviationsdeviations
from from the activity routine is small, provided that there exists a certain
system
level of redundancy in the the
detect deviations activity
from
sensing the routine
activity
system. is small,
routine
To verify thisisprovided thatwe
small, provided
hypothesis, there exists
that
simulated aa certain
there level
exists afault
sensor certainof
for
level
level of
redundancy
of redundancy
in the
redundancy in
sensing
in the
the sensing
system.
sensing system.
To verify
system. To
To verify
this this
hypothesis,
verify this hypothesis,
we we
simulated
hypothesis, we simulated
a sensor
simulated aa sensor
fault for
sensor fault
M004
fault for
and
for
M004 and M008 by filtering out the data provided by these sensors and compared the similarity
M004
M008
M004 byand M008
filtering by
by filtering
out the data out the
the data provided by andthese sensors and compared the
the similarity
index and
with M008obtained
that with provided
filtering out by dataset.
data
the original these sensors
provided Thebyresult compared
theseissensors
shown in the
and similarity
13. index
compared
Figure with that
similarity
index
obtainedwith
index with that
with
that obtained
the with
originalwith
obtained the
dataset. original dataset.
The result
the original is shown
dataset. The
Theinresult is
Figure
result shown
13.
is shown in Figure 13.
in Figure 13.
Figure 13. The results of a simulated sensor fault for M004 and M008 versus the results obtained with
Figure
Figure 13. The
13. The
The results
results
results of simulated
of aa simulated
simulated sensor
sensor fault
fault for
for M004
M004 and
and M008
M008 versus
versus the
the results
results obtained
obtained with
with
the original dataset.
the original dataset.
the original dataset.
4.2. Results
4.2. with
with Kasteren
Results with House
House C
Kasteren House Dataset
C Dataset
Dataset
4.2.
4.2. Results
Results with Kasteren
Kasteren House CC Dataset
Figure 14
Figure 14 shows
shows the
the evolution
evolution of
of the
the similarity index
similarity index computed
index computed for
computed for the
for the entire
the entire Kasteren House
entire Kasteren House C
C
Figure
Figure 14
14 shows
shows the
the evolution
evolution of
of the
the similarity
similarity index computed for the entire Kasteren
Kasteren House
House C
C
dataset versus
dataset versus the
the reference
reference week
week 24–30
24–30 November
November 2008.
2008.
dataset versus the reference week 24–30 November
dataset versus the reference week 24–30 November 2008. 2008.
Days with
Figure 14. Days with dissimilarities
dissimilarities from the activity routine in the Kasperen dataset.
Figure
Figure 14.
14. Days
Days with
with dissimilarities
dissimilarities from
from the
the activity
activity routine
routine in
in the
the Kasperen
Kasperen dataset.
dataset.
The
The graph
graph in
in Figure
Figure 14
14 indicates the dates
indicates the dates of
of 21
21 and
and 22
22 November,
November, and
and 55 and
and 66 December
December as as
The graph in Figure 14 indicates the dates of 21 and 22 November, and 55 and 66 December as
days with unusual activity. Indeed, the activity list extracted from annotations (seeDecember
days The
with graph
unusualin Figure
activity.14 indicates
Indeed, the the dates
activity of
list 21 and
extracted 22 November,
from and
annotations (seeand
Figure as
15) reveals
Figure 15)
days with
obviously unusual
days withunusual
unusual activity.
activity.
sleep Indeed,
Indeed,
and eating the
timesthe activity
in activity list
these days, extracted
listorextracted from annotations
from to
unusual times annotations (see Figure
(see and
leave the house Figure 15)
15)
return.Sensors 2018, 18, x FOR PEER REVIEW 12 of 15
reveals2019,
Sensors obviously
19, 2264 unusual sleep and eating times in these days, or unusual times to leave the 12
house
of 15
and return.
Figure 15.
Figure 15.The
Theactivities
activities from
from one one ofdays
of the the in
days in the Kasteren
the Kasteren C dataset,Cextracted
dataset, from
extracted from the
the annotations.
annotations.
Yellow Yellow
highlights highlights
indicate indicate
unusual timesunusual times for the
for the respective respective activities.
activities.
5. Discussion
5. Discussion
We
We presented
presenteda amethodmethod to monitor
to monitor the activity and detect
the activity deviations
and detect from the
deviations long-term
from activity
the long-term
routine
activity of the elderly
routine of thepeople
elderlyliving
people alone using
living low-cost,
alone unobtrusive
using low-cost, binary sensors.
unobtrusive binaryInsensors.
our approach,
In our
the residential living space was reduced to a set of behaviorally significant places, located
approach, the residential living space was reduced to a set of behaviorally significant places, located arbitrarily in
a generic space. Each of these places was equipped with a number of sensors
arbitrarily in a generic space. Each of these places was equipped with a number of sensors capable ofcapable of detecting
the presence
detecting the of the assisted
presence of theperson.
assisted When
person.triggered, the sensors
When triggered, activate
the sensorsa activate
corresponding source of
a corresponding
virtual pheromones located in the respective place. The pheromones diffuse
source of virtual pheromones located in the respective place. The pheromones diffuse in space and in space and evaporate
with time, and
evaporate withtheir
time,density distribution
and their maps encode
density distribution the spatiotemporal
maps evolution ofevolution
encode the spatiotemporal the interactions
of the
between the user and the environment. Series of images representing pheromone-based
interactions between the user and the environment. Series of images representing pheromone-based activity maps
were compared for similarity with a reference set of images created starting from
activity maps were compared for similarity with a reference set of images created starting from the the average values
of sensorvalues
average data over a certain
of sensor data time
over interval. By applying
a certain time interval.this method on
By applying thistwo publicondatasets,
method two publicwe
demonstrated that it is capable of identifying either singular days with unusual activity,
datasets, we demonstrated that it is capable of identifying either singular days with unusual activity, or trends of
evolution indicating deviations from the previous activity routine.
or trends of evolution indicating deviations from the previous activity routine.
The
The proposed
proposed solution
solution addresses
addresses all all the
the major
major drawbacks
drawbacks of of the
the typical
typical long-term
long-term activity
activity
monitoring systems:
monitoring systems:
- -ItItisisbased
basedon
onlow-cost
low-costPIR PIRmotion
motion detectors
detectors andand magnetic
magnetic door
door contacts,
contacts, which
which are
are totally
totally
unobtrusive and require minimal
unobtrusive and require minimal preprocessing; preprocessing;
- -ItItisischeap;
cheap;
- -ItItdoes
doesnotnotneed
needcomplex
complexpersonalization
personalizationand andtraining;
training;
- -ItItisisindependent
independentfrom from the
the particular
particular details
details of of
thethe monitored
monitored living
living environment
environment (surface
(surface of
of the
the apartment,
apartment,numbernumberand andrelative
relativeposition
positionofofthe
therooms,
rooms,size
sizeand
andlocation
locationofofthe
thefurniture,
furniture,etc.);
etc.);
- -Provided
Providedthat that there
there exists
exists a certain
a certain levellevel of redundancy
of redundancy in thein
setthe set of sensors,
of sensors, the is
the system system
tolerantis
tolerant to sensor
to sensor faults. faults.
The main limitation of the proposed method is that it is applicable strictly to monitoring people
living alone.
shouldbebenoted
It should noted
thatthat is relatively
is relatively easy
easy to to design
design a networka network of such residential
of such residential activity
activity monitoring
monitoring
systems thatsystems thattoallows
allows peer peer to peer
peer monitoring monitoring
of the of the activity
activity routines. routines.
For example, in aFor example,
network within a
the
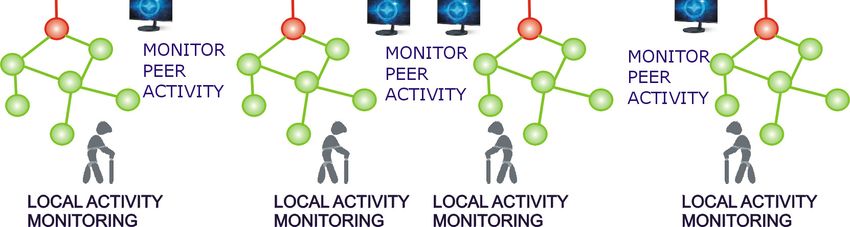
structure shown in Figure 16, the users may choose to (anonymously) share the output of their activityYou can also read


