Machine Learning Approach for COVID-19 Detection on Twitter
←
→
Page content transcription
If your browser does not render page correctly, please read the page content below
Computers, Materials & Continua                                                                Tech Science Press
DOI:10.32604/cmc.2021.016896
Article

                            Machine Learning Approach for COVID-19
                                      Detection on Twitter
          Samina Amin1, * , M. Irfan Uddin1 , Heyam H. Al-Baity2 , M. Ali Zeb1 and M. Abrar Khan1

                1
                Institute of Computing, Kohat University of Science and Technology, Kohat, 26000, Pakistan
    2
        Department of Information Technology, College of Computer and Information Sciences, King Saud University,
                                                 Riyadh, 11543, Saudi Arabia
                           *
                             Corresponding Author: Samina Amin. Email: kustsameena@gmail.com
                                    Received: 14 January 2021; Accepted: 22 February 2021

                    Abstract: Social networking services (SNSs) provide massive data that can
                    be a very influential source of information during pandemic outbreaks. This
                    study shows that social media analysis can be used as a crisis detector (e.g.,
                    understanding the sentiment of social media users regarding various pan-
                    demic outbreaks). The novel Coronavirus Disease-19 (COVID-19), commonly
                    known as coronavirus, has affected everyone worldwide in 2020. Streaming
                    Twitter data have revealed the status of the COVID-19 outbreak in the most
                    affected regions. This study focuses on identifying COVID-19 patients using
                    tweets without requiring medical records to find the COVID-19 pandemic in
                    Twitter messages (tweets). For this purpose, we propose herein an intelligent
                    model using traditional machine learning-based approaches, such as support
                    vector machine (SVM), logistic regression (LR), naïve Bayes (NB), random
                    forest (RF), and decision tree (DT) with the help of the term frequency inverse
                    document frequency (TF-IDF) to detect the COVID-19 pandemic in Twitter
                    messages. The proposed intelligent traditional machine learning-based model
                    classifies Twitter messages into four categories, namely, confirmed deaths,
                    recovered, and suspected. For the experimental analysis, the tweet data on
                    the COVID-19 pandemic are analyzed to evaluate the results of traditional
                    machine learning approaches. A benchmark dataset for COVID-19 on Twit-
                    ter messages is developed and can be used for future research studies. The
                    experiments show that the results of the proposed approach are promising in
                    detecting the COVID-19 pandemic in Twitter messages with overall accuracy,
                    precision, recall, and F1 score between 70% and 80% and the confusion matrix
                    for machine learning approaches (i.e., SVM, NB, LR, RF, and DT) with the
                    TF-IDF feature extraction technique.

                    Keywords: Artificial intelligence; coronavirus; COVID-19; pandemic; social
                    network; Twitter; machine learning; natural language processing

                         This work is licensed under a Creative Commons Attribution 4.0 International License,
                         which permits unrestricted use, distribution, and reproduction in any medium, provided
                         the original work is properly cited.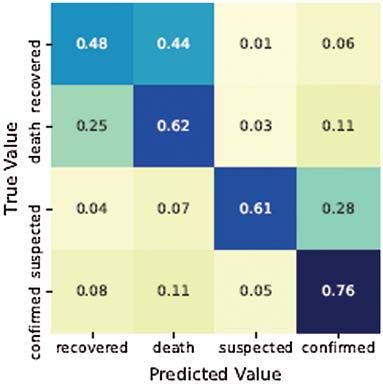
2232                                                                         CMC, 2021, vol.68, no.2

1 Introduction
     Online social network sites (SNSs) like online blogs, Facebook, Instagram, and microblogging
services (i.e., Tumbler and Twitter) are web forums or online platforms that are spread over long
distances all around the world. Millions of people worldwide currently use SNSs to share images
and videos, update their current status, and post regular comments on various topics. SNSs can
also provide massive data that can be a very influential source of information during pandemic
outbreaks [1,2]. Early warning on outbreak detection can decrease the influence of epidemic
outbreaks on public health. SNSs can now be used for disease surveillance to monitor the rate of
epidemic outbreaks quicker than health care specialists and health organizations [2–4].
     COVID-19 and the coronavirus pandemic have started spreading around the globe since the
start of 2020. The disease is contagious and, in extreme cases, can proceed to severe acute
respiratory syndrome coronavirus 2 (SARS-CoV-2), a novel human bacterium that epidemiologists
(virologists) consider to have originated from bats and suddenly transferred to humans through
an intermediary host [1,5]. Due to its prompt spread, the COVID-19 pandemic was deemed a
“Public Health Emergency of International Concern” by the World Health Organization (WHO)
on January 30, 2020 [6]. The disease has influenza-like symptoms (pneumonia) and has become
a major challenge for healthcare professionals in terms of system development and diagnosis for
monitoring the pandemic. The early detection of COVID-19 is essential in monitoring and track-
ing its future dissemination. SNSs can be considered as a quick detection and monitoring tool for
COVID-19 to provide awareness and overcome the dissemination of the coronavirus pandemic.
     Information on COVID-19 and the coronavirus pandemic have not been promptly circu-
lated by healthcare organizations. On the contrary, SNSs have gained great attention for equally
spreading awareness about COVID-19 [5,7,8]. The massive proliferation of COVID-19 and the
coronavirus pandemic has developed a strong necessity for the exploration of reliable methods
of analytical research to understand information dissemination and pandemic crisis formation in
social media. Various research studies have examined epidemic outbreaks and monitored health-
care to more rapidly and efficiently obtain informed decisions from healthcare organizations using
SNS data [4,9].
     Therefore, emphasis is focused on suggesting techniques that would empower SNSs to track
and detect early cautions relevant to pandemic outbreaks to realize a real-time analysis [4,10].
Through SNSs, health care practitioners can be informed to deliver basic resources to monitor
pandemic outbreaks. Nowadays, people regularly use SNSs to upload images and videos, update
their current status, and post regular comments on a health status, specifically during pandemic
in a region. The SMA provides a piece of effectual information for outbreak tracking and a
convenient approach for communicating with the public to decrease pandemic outbreaks with
machine learning approaches [10–17].
     A consistent feature in today’s technology is that artificial intelligence plays an important
role in this new wave of approaches for public health. From a methodological point of view, the
machine learning approach is one of the most applicable with artificial intelligence. This study pro-
poses an intelligent model that will retrieve text related to COVID-19 or the coronavirus pandemic
from Twitter messages (tweets) using machine learning approaches, such as SVM, NB, LR, RF,
and DT [18–23] with TF-IDF [24], Glove [25], and n-grams [26]. The tweets are categorized into
four groups of COVID-19, namely confirmed (a tweet about a person with coronavirus), death
(a tweet expressing death from COVID-19), recovered (a tweet expressing a person’s recovery from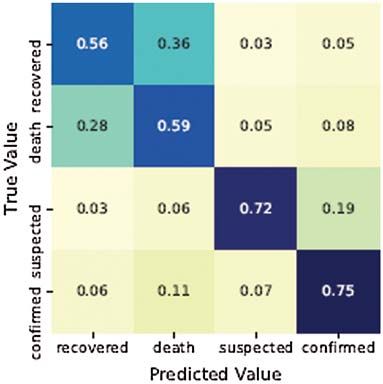
CMC, 2021, vol.68, no.2                                                                       2233

COVID-19), and suspected (a tweet expressing COVID-19 symptoms). The main contributions of
the proposed work are as follows:
    • provide awareness about COVID-19 by identifying the dissemination of the latest infor-
      mation on COVID-19 from online social media to help prevent the dissemination of
      COVID-19;
    • automate COVID-19 analysis by detecting the COVID-19 pandemic from SNSs to perform
      a real-time analysis;
    • categorize Twitter messages related to the coronavirus and COVID-19 pandemic into four
      groups as “confirmed,” “death,” “recovered,” and “suspected;”
    • explore traditional machine learning approaches, namely, SVM, LR, NB, RF, and DT, for
      tweet identification with the help of TF-IDF with the n-grams approach (e.g., following a
      unigram, the approach means considering the detection of the COVID-19 spread using an
      individual word in tweets); and
    • build a benchmark dataset for COVID-19 from Twitter messages that will be available
      online for future research studies.
     This study aims to evaluate COVID-19-related tweets with “confirmed,” “death,” “recovered,”
and “suspected” patients to analyze the pandemic outbreak from the SMA. The proposed tradi-
tional machine learning-based approach is tested and evaluated on various domains to measure
its performance, accuracy, and efficiency (Section 4).
    The remainder of this paper is structured as follows: Section 2 provides a brief overview
of the related work in the literature; Section 3 validates the approach followed to obtain the
experimental results; Section 4 presents the analysis evaluation; and Section 5 concludes the
research and delivers further research results.

2 Related Work
     Several disease detection approaches for coronavirus and the COVID-19 pandemic are used
by researchers around the globe to create informed decisions and develop appropriate moni-
toring systems [27–29]. Kouzy et al. [30] and Singh et al. [31] proposed intelligent models for
the dissemination of information and measurements relevant to COVID-19 using online social
media data.
    Early detection and public awareness about outbreaks, especially the COVID-19 outbreak and
coronavirus, and the techniques for monitoring the COVID-19 pandemic are major contempla-
tions [32,33]. Kabir et al. [34] presented a method that discovers the user sentiment and posts
shared by the public on COVID-19 in social media and modeled public opinion using machine
learning and topic modeling techniques. They mainly investigated the psychology and actions of
the public, which can be facilitated in handling financial and social crises during the current
outbreak of COVID-19 and its major side effect.
     Hung et al. [1] developed an artificial intelligence-based model to analyze Twitter discussion
associated with public sentiment on the COVID-19 pandemic. Khanday et al. [32] developed an
effective model for textual clinical data classification by empowering machine learning approaches.
They classified clinical textual data into three classes that are COVID, severe acute respiratory
syndrome, and acute repository distress syndrome. In addition, they presented a comparative
analysis among machine learning techniques and showed that the multinomial naïve Bayes model
outperformed the other models.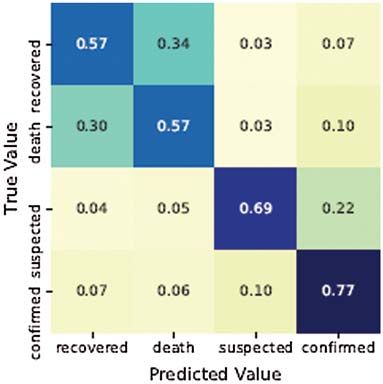
2234                                                                        CMC, 2021, vol.68, no.2

     Mistrust of social media affects the propagation of disaster information because it not only
includes changes in the interpretation and sharing of media; variations in the way individuals and
administrations interpret the information in crisis circumstances also have an impact [35]. In their
work, Mirbabaie et al. [35] tried to understand the crises created during the COVID-19 pandemic
and the coronavirus, as well as the potential circumstances, from Twitter to decrease the mistrust
of SNS content and promote the context (sense-making) of the SMA.
     Aggarwal et al. [36] developed a model for a multi-criterion decision support system for
COVID-19 and used the COVID-19 dataset from the government official link for result validation.
Similarly, Yun et al. [37] performed a COVID-19 screening laboratory data analysis. From plasmid
acid and hematology data, they gathered 2510 cases for a cumulative examination for COVID-19
infection detection. They conducted the results on influenza infections and planned to explore the
effect of fecal matter. Mediating 2510 cases, they suggested clinical and medical actions. However,
the data could vary from one place to another; therefore, immunity and several other factors
inside the body differ from one area to another.
    SNSs can be efficiently used to classify disease infected information and influences on health
campaigns with interference to improve public health [9]. Motivated by literature studies, the usage
of the SMA patterns of early warnings on pandemic outbreaks can be detected, consequently
reducing the time that passes between onset and detection. To the best of our knowledge, previous
studies have not considered the alarming situation of COVID-19 and important features like
categorization of COVID-19 patients into “confirmed,” “death,” “recovered,” and “suspected” to
analyze the pandemic outbreak from the SMA. Furthermore, no benchmark dataset has been
made available on the COVID-19 pandemic that delivers analysis on public sentiment. This study
performs a textual analysis of Twitter data by identifying information from social sensors (referred
to as tweets). Specifically, tracking of the awareness related to the prompt dissemination of the
COVID-19 pandemic is analyzed. To find information on the COVID-19 pandemic in Twitter
messages (tweets), the proposed work focuses on the problem of identifying COVID-19 patients
using tweets without requiring medical records. Accordingly, this work proposes an intelligent
model using traditional machine learning-based approaches. It also outlines an artificial intelli-
gence approach to design an intelligent model for analyzing Twitter data in detail to identify and
track the key word association and trends for disaster situations similar to the novel coronavirus
and COVID-19 pandemic.

3 Proposed Approach
     Fig. 1 illustrates the proposed methodology adopted to make an intelligent approach for
detecting the spread of COVID-19 pandemic in Twitter messages using machine learning tech-
niques. The proposed model incorporates various components, including data gathering, prepro-
cessing, data visualization, classifier, and results from the evaluation. The pseudocode for the
proposed approach is also presented at the end of this section. The component details are
presented below.

3.1 Data Gathering
    We used the Twitter streaming application programming interface (API) to retrieve tweets
from Twitter [38]. We gathered about 900,000 tweets during the period between May 13, 2020
and September 30, 2020 using the Twitter API. We selected keywords, including #covid-19,
#coronavirus, #corona, covid19, and #covid to collect the relevant tweets. Fig. 2 depicts the other
most commonly discussed words about COVID-19 found in a COVID-19 corpus.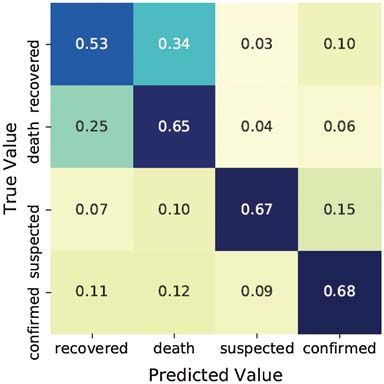
CMC, 2021, vol.68, no.2                                                                                               2235

      API to extract tweets                                    Data
                                  Twitter                 Preprocessing
                                                           Eliminating stop                           Feature
                                                                words                                Engineering

                                                             Eliminating        Building ground
                                                           retweets,HTML       truth dataset for        TF-IDF
                                                                                  COVID-19
                                                             Stemming
                                Collection of                                                      N-gram generator
                                 COVID-19
                                  tweets                    Tokenizatin

                                                              Machine
                                                                                                       Categories
                                                              Learning

                                Data Split                      SVM                                     Confirmed

                                                         Logistic Regression   Evaluate model
                              Train set (80%)                                                             Death
                                                                                on test data
                                                            Naïve Bayes
                                                                                                        Suspected
                              Test set (20%)
                                                           Decision Tree
                                                                                                        Recovered
                                                          Random Forest

                                                Figure 1: Proposed COVID-19 detection approach

                   Figure 2: Commonly discussed keywords about COVID-19 founded in the corpus
2236                                                                        CMC, 2021, vol.68, no.2

3.2 Data Preprocessing
    After the tweet data collection from Twitter, the collected data are promoted to certain
preprocessing steps in NLP [39]:
    • eliminating non-English tweets (e.g., all tweets written in English are considered);
    • eliminating stop words: stop words, such as “a”, “is,” “be,” and “the,” do not convey
      meaningful information;
    • eliminating retweet entities: meaningful analytics would be affected by redundant (repeti-
      tive) tweets;
    • eliminating punctuation marks, special characters, and numbers: they do not express an
      opinion regarding the disease outbreak;
    • eliminating URLs or hyperlinks: only tweets containing text are considered herein;
    • eliminating people in @mention: the names of people reported in @mention are irrelevant
      for the disease exploration;
    • stemming: to transform the words into base or root words utilizing stemming tech-
      niques [40]; and
    • tokenizing: break a sentence or phrase into tokens, such as words, by using Natural
      Language Tool Kit (NLTK) modules [40].
     These preprocessing steps were incorporated to enhance the performance of the proposed
model and improve the processing speed. The tweet data were stored in a common separated value
file after preprocessing.

3.3 Data Annotation and Building a Benchmark Dataset
     A total of 3102 sample tweets on COVID-19 are selected for tagging after the preprocessing
step. The sample tweets are tagged with the help of three annotators to eradicate the gaps or
prejudice in an annotation. The tweets are then categorized into four groups of COVID-19,
namely confirmed, death, recovered, and suspected, by the three annotators. This means that a
label confirmed is assigned when someone is infected with COVID-19. For instance, tweets are
considered as confirmed to reflect people with COVID-19. The suspected tweets are considered
to represent the COVID-19 symptoms in people. In the annotation phase, tagged tweets are
approved with the help of an inter-annotator agreement level using Cohen’s Kappa test [41] and
calculated as strong (i.e., kappa = 0.841) [42]. Tab. 1 shows the representation of tweets with the
assigned category.

3.4 Feature Engineering
    Machine learning approaches are not efficient in directly tackling the text data. For this pur-
pose, different features are retrieved from the preprocessed annotated tweet data and transferred
into probabilistic numbers. To retrieve the related features, the TF-IDF [24] feature extraction
approach is utilized while unigrams and bigrams are extracted. The proposed approach is trained
on approximately 5000 feature weights. Thus, we have 5000 features for the whole training set
presented as max_features = 5000. After assigning the appropriate weight to the features, the
CMC, 2021, vol.68, no.2 2237
numeric values of the features are moved into machine learning approaches for further analysis
because machine learning approaches cannot directly analyze the text data.
N
W m, n = tf m, n × log (1)
tf m
where m in n, are the numbers of amounts and tfm shows numbers of documents consisting m
while N shows total numbers of documents.
Table 1: Representation of COVID-19 tweets tagged by three annotators. The annotations are
acknowledged via an inter-annotator agreement level
S# Tweet Category
1. Unfortunately one of our team has tested positive for Coronavirus. Confirmed
2 Jaehyun tested positive for coronavirus I hope he feels good and I hope he will Confirmed
recover fast. Get well soon.
3. Please can you keep my mum in your prayers? She has tested positive for corona. Confirmed
4. People are really testing positive and not telling anyone like Corona is a private Suspected
party.
5. 114986 recovered from corona so far. Recovered
6. 1 in 200 Americans over age 65 have died from #COVID19. My god. Death
7. A 41 year-old, healthy man with a young family just died from COVID. Death
8. I felt equally positive after both of my parents recovered from COVID19-knowing Recovered
that recovering from the disease produces the same immunity as the vaccine.
9. I have now officially recovered from #COVID19 and have been cleared to come to Recovered
work today.
10. Many with suspected COVID19 (number not provided) ICU census unknown. Suspected
11. This is so utterly sad. COVID claims the life of someone so young, age 38, who Death
just got elected to serve the country.
12. Three of my friends had Corona Vaccination and they are down with fever and Suspected
body aches.
Another technique adopted herein for feature extraction is n-gram [20]. Following a unigram
(1 gram), the approach means that an individual word in a tweet is considered to detect the
spread of COVID-19, while a bigram (2-gram) considers two words in a tweet as it defines its
corresponding word (N − 1 = 1) as the presence of the word in a suggested sentence. Consider
the following example tweet to understand the n-gram approach: “I have tested positive for
COVID-19.” Therefore, the n-gram formulation for 2-gram (2 −1 = 1, in this context, it determines
the appearance of a word) dependent on the previous work would transform the stated example
as “I have,” “have tested,” “tested positive,” “positive for,” and “for COVID-19.”
3.5 Data Splitting
A random split approach is adopted to split the data into training and testing. In random
splitting, a pre-specified proportion of the data set is split into the train and test data sam-
ples. For instance, in the 80:20 split, the samples were spontaneously selected. Compared to
the other approaches, the randomly split approach was more stable because the dataset was
more correctly split up. From the 80:20 ratio, 80% of the data samples were used to train2238 CMC, 2021, vol.68, no.2
the model. The remaining 20% of the data samples were kept to test the model performance using
performance evaluation metrics.
3.6 Machine Learning Approaches
Different machine learning approaches are used to detect the COVID-19 tweets and classify
them into four categories of COVID-19 (i.e., confirmed, death, recovered, and suspected). In this
work, machine learning approaches like LR, SVM, NB, DT, and RF are empowered to validate
the proposed objectives.
3.6.1 Support Vector Machine
SVM is a machine learning-based approach most commonly used for classification tasks [18].
By organizing data into different groups, the SVM operates by finding a state line boundary often
called a hyperplane, which separates the data set into groups. The state line boundary between
vectors is related to a specific class. It is mathematically defined as follows:
y = a.x + b (2)
a.x + b − y = 0 (3)
Suppose that vector X = (x, y) and W = (a, −1). We form a hyperplane in vector written
as follows:
W.X + b = 0 (4)
where, x denotes the input features; w is the weight value; and b is a bias term.
3.6.2 Naïve Bayes
NB [22] is a probabilistic supervised learning model based on the Bayes’ theorem. The
fundamental concept of the NB method is to calculate the probabilities of categories allocated to
the corpus and classify the test data. The Bayes algorithm presents a methodology that computes
the posterior probability p (c/x) by p (c) and p (x/c) written as follows:
p (x/c) p (c)
p (c/x) = (5)
p (x)
where, p (c/x) = p (x1 /c) .p (x2 /c) .p (x3 /c) . . . p (xn /c). p (c) is a posterior probability of the class
(c, source) specified predictor (x, parameters), and p (c) is a prior probability of a class. The
probability p (x/c) is a likelihood of a specified predictor class, and p (x) is the prior probability of
a predictor. However, in the training process, the variant of the NB (MultinomialNB) commonly
used for the text classification is optimized in the proposed work.
3.6.3 Logistic Regression
LR [21] is the most commonly used supervised method because it is used to calculate the
categorical variable based on independent variables. For instance, consider a situation where it
is required to classify whether a person is infected by COVID-19 or not. If linear regression is
used for this scenario, then the threshold value is required to be generated on which classification
can be performed. If the real class category is positive or confirmed in our case, the threshold
value is 0.5, and the expected value is 0.4. The feature vector would be classified as COVID-19
negative, leading to severe consequences in real time. LR is used to overcome the limitation inCMC, 2021, vol.68, no.2 2239
linear regression considering that the LR value ranges from 0 to 1. It can be mathematically
denoted as follows:
1
y= (6)
1 + ez
z = w.x + b (7)
where, b is a bias term; w is the weight value; and x denotes the continuous input values (e.g.,
the number of words in a tweet in our case) and produces the output between 0 and 1 range to
classify the data into four categories.
3.6.4 Decision Tree
DT [23] is a simplified model used for classification problems. It is a supervised learning model
in which data are separated based on certain features. DT classifies the data by sorting them down
the tree to some terminal nodes from the base node, with the data identified by the terminal node.
For a certain attribute, each node in the tree serves as a testing phase. Each edge descending
from the node refers to the correct options for the testing phase. This mechanism is repeated for
each subtree rooted throughout the new node. The entropy and entropy classes for each attribute
are determined in the first phase. The information gain (IG) is determined for all the attributes
defined in the following equations. This procedure is reiterated until all attributes are in the node.
E (Y, X) = P (c) E (c) (8)
CεX
IG (Y, X) = E (Y) − E (Y/X) (9)
where, x represents the input, and T is the current state. DT employs different techniques to
determine if a node is divided into two or more sub-nodes. The sub-node formation increases the
uniformity of the resulting sub-nodes. In other words, for the target variable, the node integrity
can be assumed to increase. The DT divides the nodes into available attributes and determines
the split that occurs in the most homogeneous sub-attributes.
3.6.5 Random Forest
RF [19,43], is a traditional machine learning model based on an ensemble tree because it
comprises a large number of DT that performs as an ensemble. It is a set of DTs from a randomly
chosen subset training set. It collates votes from various DT approaches to evaluate the actual
class of the test set. The Gini index is used by RF as an input parameter that calculates the
defilement of an attribute in reference to the classes. For a certain training set x, one category
(pixel) is randomly picked and claimed to correspond to some categories. The Gini index is
defined as:
(f (ci , x) /x) f cj , x /x (10)
j=i
where, (f (ci , x) /x) is a probability that belongs to a certain class category ci . Thus, x represents
the input values, and c is the targeted category.
3.7 Pseudocode for the Proposed Approach2240 CMC, 2021, vol.68, no.2
Pseudocode: To detect the covid-19 pandemic in tweets
Begin
Input: Twitter messages about COVID-19
Output: To detect and classify the COVID-19 tweets into four categories
Parameters: Tweet: Tw , URL, Re-Tweets: RTw, Symbols: Symb
1. Begin
2. initialize keyword list w
3. create a JSON file to keep COVID-19 tweets
4. load twitter API credentials
5. foreach Tw do
6. search (Tw , w)
7. if (Tw relevant to w)
8. then
9. save_to_JSON_file (Tw )
10. else
11. discard (Tw )
12. end if
13. end foreach
14. end
15. # Data Preprocessing
16. Begin
17. foreach Tw do
18. language = check_language (Tw )
19. if (language = “english”)
20. then
21. save_to_database (Tw )
22. else
23. remove_from_database (Tw )
24. end if
25. repeat preprocess until
26. remove RTw , #Tags, URL, Symb, emoticons
27. do apply tokenization & stemming
28. end for
29. end
30. do transform preprocessed data into TF-IDF
31. do split the data into train (80%) and test (20%)
32. do apply machine learning approaches
33. SVM, NB, LR, DT and RF
34. for test data do perform 10-fold cross to compute
35. accuracy
36. precision,
37. recall,
38. f 1 -score,
39. then evaluate:
40. training model on test data
41. end
EndCMC, 2021, vol.68, no.2 2241
4 Experiments and Results
This section presents the experimental results for the proposed approach. The empirical
analysis was conducted using the Anaconda framework (Python 3.8) [44] with the open-source
Python modules Scikit-Learn [45], Numpy [46], and Keras [47]. The performance of the proposed
approach was evaluated using these modules.
The proposed approach was trained using machine learning approaches. The performance of
each approach was evaluated on the test set by utilizing performance evaluation metrics [48].
Moreover, the performance of each model was graphically visualized by making a confusion
matrix. A confusion matrix is a suitable approach for demonstrating the results in supervised
learning problems because it reflects the output of the classification models on the testing set and
attempts to evaluate the predicted (detected) dataset as per their true class label.
The obtained results depict that the SVM model led to slightly improved results. Similarly, the
NB classifier performed well, as illustrated in the given figures and tables. The slight improvement
in the results could be related to the length of the tweet summaries in our dataset. Tab. 2 only
considers the classifiers that obtained the highest performance results with n-gram approaches.
Table 2: Train and test accuracy for machine learning approaches with TF-IDF + unigram +
bigram
Approach Train + unigram (%) Test + unigram (%) Train + bigram (%) Test + bigram (%)
SVM 82 80 80 79
NB 79 77 79 78
LR 76 75 76 76
DT 75 75 76 75
RF 74 72 75 73
Tab. 3 shows the performance results considering the five machine learning approaches trained
with the TF-IDF feature extraction approach. For a better comprehension, the precision, recall,
and F1-score for each COVID-19 category (i.e., confirmed, death, recovered, and suspected) were
interpreted separately. Tab. 4 presents the average scores of precision, recall, and F1-score for
each approach. The classifiers that obtained the highest accuracy were NB and SVM. Com-
pared to the other categories, the death class showed a low F1-score possibly because it is the
minority category.
Table 3: Performance results
Approach Confirmed (%) Death (%) Suspected (%) Recovered (%)
Precision Recall F1-score Precision Recall F1-score Precision Recall F1-score Precision Recall F1-score
SVM 80 79 80 72 72 72 76 77 78 78 79 79
NB 75 78 77 72 76 75 74 77 70 78 79 77
LR 74 76 78 70 70 71 72 70 72 74 76 71
DT 71 76 74 70 70 70 70 70 71 71 70 70
RF 70 71 71 70 71 70 71 70 70 70 71 702242 CMC, 2021, vol.68, no.2
Table 4: Performance measure with an average total
Approach Precision (%) Recall (%) F1-score (%)
SVM 80 81 81
NB 78 77 79
LR 76 76 78
DT 71 73 76
RF 70 72 74
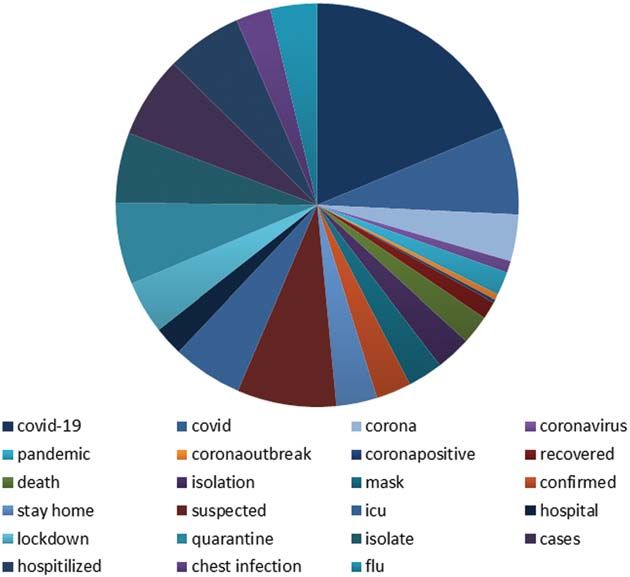
Moreover, the confusion matrix results were generated for the selected approaches (i.e., SVM
(Fig. 3), NB (Fig. 4), LR (Fig. 5), DT (Fig. 6), and RF (Fig. 7)).
Figure 3: Confusion matrix for the SVM
Figure 4: Confusion matrix for the NBCMC, 2021, vol.68, no.2 2243
Figure 5: Confusion matrix for the LR
Figure 6: Confusion matrix for the DT
The figures presented above conclude that 77% of the confirmed ratings was detected as
confirmed; 76% of the suspected ratings was detected as suspected; 70% of the death ratings was
detected as death; and 74% of the recovered ratings was detected as recorded. These are not the
best detections, but they are a good baseline or benchmark for even better approaches using deep
learning techniques.2244 CMC, 2021, vol.68, no.2
Figure 7: Confusion matrix for the RF
5 Conclusion
As a consistent feature in today’s technology, artificial intelligence plays an important role in
the new wave of approaches for public health. From a methodological point of view, machine
learning approaches are one of the most applicable with artificial intelligence. This study analyzed
the problem of identifying COVID-19 patients using Twitter messages without requiring medical
records. This framework can be used as a surveillance system for observing the COVID-19
pandemic in real time. The experimental setups, results, and evaluation of the proposed approach
were illustrated to detect COVID-19-infected people on microblogging services that aim to
tackle several challenges and offer a model for detecting COVID-19 pandemic to validate the
proposed objectives.
The proposed intelligent traditional machine learning-based model classifying Twitter mes-
sages into four categories (i.e., confirmed, deaths, recovered, and suspected). For this purpose,
a novel dataset was collected using Twitter streaming API to design a benchmark dataset for
COVID-19 on Twitter messages that can be used for future research studies. The work also
graphically visualized data to understand the data attributes. Data visualization revealed the
highest number of the most frequently occurring keywords in the dataset. For the experimental
analysis, Twitter data on the COVID-19 pandemic were analyzed to evaluate the results of the
traditional machine learning approaches. The results of the proposed method were obtained using
the SVM, LR, NB, RF, and DT with the help of the TF-IDF feature extraction technique. The
proposed approach performance was evaluated using accuracy, precision, recall, F1 score, and
confusion matrix techniques. Their results were then graphically visualized.
In the future, we aim to improve the performance of the proposed approach with deep
learning approaches to analyze the novel coronavirus and the COVID-19 pandemic outbreak.
Acknowledgement: This work has been supported by a grant from the Research Center of the
Female Scientific and Medical Colleges, Deanship of Scientific Research, King Saud University.CMC, 2021, vol.68, no.2 2245
Funding Statement: This work has been supported by a grant from the Research Center of the
Female Scientific and Medical Colleges, Deanship of Scientific Research, King Saud University.
Conflicts of Interest: The authors declare that they have no conflicts of interest to report regarding
the present study.
References
[1] M. Hung, E. Lauren, E. Hon, E. S. Birmingham, W. C. Xu et al., “Social network analysis of COVID-
19 sentiments: Application of artificial intelligence,” Journal of Medical Internet Research, vol. 22, no. 8,
pp. 1–13, 2020.
[2] S. Amin, M. I. Uddin, M. A. Zeb, A. A. Alarood, M. Mahmoud et al., “Detecting information on the
spread of dengue on Twitter using artificial neural networks,” Computers, Materials & Continua, vol. 67,
no. 1, pp. 1317–1332, 2021.
[3] A. R. Ahmad and H. R. Murad, “The impact of social media on panic during the COVID-19
pandemic in Iraqi Kurdistan: Online questionnaire study,” Journal of Medical Internet Research, vol. 22,
no. 5, pp. 1–11, 2020.
[4] S. Amin, M. I. Uddin, M. A. Zeb, A. A. Alarood, M. Mahmoud et al., “Detecting dengue/flu infections
based on tweets using LSTM and word embedding,” IEEE Access, vol. 8, pp. 189054–189068, 2020.
[5] J. Samuel, G. G. M. N. Ali, M. M. Rahman, E. Esawi and Y. Samuel, “COVID-19 public sentiment
insights and machine learning for tweets classification,” Information—An International Interdisciplinary
Journal, vol. 11, no. 6, pp. 1–22, 2020.
[6] M. L. Holshue, C. DeBolt, S. Lindquist, H. K. Lofy, J. Wiesman et al., “First case of 2019 novel
coronavirus in the United States,” New England Journal of Medicine, vol. 382, no. 10, pp. 929–936, 2020.
[7] S. Ranjan and B. B. Gupta, “Multiple features based approach for automatic fake news detection on
social networks using deep learning,” Appllied Soft Computing Journal, vol. 100, no. 3, pp. 106983, 2021.
[8] M. Chora, “Advanced machine learning techniques for fake news (online disinformation) detection:
A systematic mapping study,” Appllied Soft Computing Journal, vol. 101, pp. 107050, 2020.
[9] S. Amin, M. I. Uddin, S. Hassan, A. Khan, N. Niddal et al., “Recurrent neural networks with TF-IDF
embedding technique for detection and classification in tweets of dengue disease,” IEEE Access, vol. 8,
no. July, pp. 131522–131533, 2020.
[10] M. J. Paul and M. Dredze, “Social monitoring for public health,” Synthesis Lectures on Information
Concepts, Retrieval, and Services, vol. 9, no. 5, pp. 1–183, 2017.
[11] M. J. Paul, A. Sarker, J. S. Brownstein, J. S. Brownstein, A. Nikfarjam et al., “Social media mining
for public health monitoring and surveillance,” in Biocomputing 2016: Proc. of the Pacific Sym. Fairmont
Orchid, Big Island of Hawaii, pp. 468–479, 2016.
[12] X. Zhang, L. Yang and L. Ding, “Sparse vector coding-based multi-carrier NOMA for in-home health
networks,” IEEE Journal on Selected Areas in Communications, vol. 39, no. 2, pp. 325–337, 2020.
[13] G. Zhiwei, Y. Shen, A. K. Bashir, M. Imran and N. Kumar, “Robust spammer detection using collab-
orative neural network in internet of thing applications,” IEEE Internet of Things Journal, pp. 1, 2020.
https://doi.org/10.1109/JIOT.2020.3003802.
[14] K. P. Yu, L. Tan, M. Aloqaily, H. Yang and Y. Jararweh, “Blockchain-enhanced data sharing
with traceable and direct revocation in IIoT,” IEEE Transactions on Industrial Informatics, 2021.
https://scholar.google.com.pk/scholar?hl=en&as_sdt=0%2C5&q=Blockchain-enhanced+data+sharing+
with+traceable+and+direct+revocation+in+IIoT%2C%E2%80%9D+IEEE+Transactions+on+Indu&
btnG=.
[15] K. Yu, L. Lin, M. Alazab, L. Tan and B. Gu, “Deep learning-based traffic safety solution for a
mixture of autonomous and manual vehicles in a 5G-enabled intelligent transportation system,” IEEE
Transactions on Vehicular Technology, vol. 69, no. 11, pp. 1–11, 2020.2246 CMC, 2021, vol.68, no.2
[16] C. Feng, K. Yu, M. Aloqaily, M. Alazab, Z. Lv et al., “Attribute-based encryption with parallel
outsourced decryption for edge intelligent IoV,” EEE Transactions on Vehicular Technology, vol. 69,
no. 11, pp. 13784–13795, 2020.
[17] K. Yu, L. Tan, X. Shang, J. Huang, G. Srivastava et al., “Efficient and privacy-preserving med-
ical research support platform against COVID-19: A blockchain-based approach,” IEEE Consumer
Electronics Magazine, vol. 3, no. 11, pp. 1–6, 2020.
[18] S. Tong and D. Koller, “Support vector machine active learning with applications to text classification,”
Journal of Machine Learning Research, vol. 2, no. 11, pp. 45–66, 2001.
[19] Y. Al Amrani, M. Lazaar and K. E. El Kadirp, “Random forest and support vector machine based
hybrid approach to sentiment analysis,” Procedia Computer Science, vol. 127, pp. 511–520, 2018.
[20] V. F. Rodriguez-Galiano, B. Ghimire, J. Rogan, M. Chica-Olmo and J. P. Rigol-Sanchez, “An assess-
ment of the effectiveness of a random forest classifier for land-cover classification,” ISPRS Journal of
Photogrammetry and Remote Sensing, vol. 67, no. 1, pp. 93–104, 2012.
[21] C. Y. J. Peng, K. L. Lee and G. M. Ingersoll, “An introduction to logistic regression analysis and
reporting,” Journal of Educational Research, vol. 96, no. 1, pp. 3–14, 2002.
[22] B. Liu, E. Blasch, Y. Chen, D. Shen and G. Chen, “Scalable sentiment classification for big data
analysis using naïve bayes classifier,” in 2013 IEEE Int. Conf. on Big Data, Santa Clara, CA, USA,
pp. 99–104, 2013.
[23] I. D. Mienye, Y. Sun and Z. Wang, “Prediction performance of improved decision tree-based algo-
rithms: A review,” Procedia Manufacturing, vol. 35, pp. 698–703, 2019.
[24] C. P. Medina and M. R. R. Ramon, “Using TF-IDF to determine word relevance in document
queries,” in Proc. of the First Instructional Conf. on Machine Learning, Piscataway, NJ USA, pp. 133–
142, 2003.
[25] J. Pennington, R. Socher and C. Manning, “Glove: Global vectors for word representation,” in Proc. of
the 2014 Conf. on Empirical Methods in Natural Language Processing, Doha, Qatar, pp. 1532–1543, 2014.
[26] J. Violos, K. Tserpes, I. Varlamis and T. Varvarigou, “Text classification using the n-gram graph
representation model over high frequency data streams,” Frontiers in Applied Mathematics and Statistics,
vol. 4, no. 9, pp. 1–19, 2018.
[27] C. Y. Dai, M. L. Yu, Y. J. Jong and C. K. Ho, “Familial clusters of the 2019 novel coronavirus diseases
in Taiwan,” Travel Medicine and Infectious Disease, vol. 36, no. 382, pp. 101813, 2020.
[28] A. T. Huang, B. Garcia-Carreras, M. D. T. Hitchings, B. Yang, L. C. Katzelnick et al., “A system-
atic review of antibody mediated immunity to coronaviruses: Kinetics, correlates of protection, and
association with severity,” Nature Communications, vol. 11, no. 1, pp. 1–16, 2020.
[29] A. Ianevski, M. H. Fenstad, S. Biza, E. Zusinaite, T. Reisberg et al., “Potential antiviral options against
SARS-CoV-2 infection,” Viruses, vol. 12, no. 6, pp. 1–19, 2020.
[30] R. Kouzy, J. Abi Jaoude, A. Kraitem, M. B. E. Alam, B. Karam et al., “Coronavirus goes viral:
Quantifying the COVID-19 misinformation epidemic on Twitter,” Cureus, vol. 12, no. 3, Preprint, 2020.
[31] L. Singh, S. Bansal, L. Bode, C. Budak, G. Chi et al., “A first look at COVID-19 information and
misinformation sharing on Twitter,” arXiv preprint arXiv: 2003.13907, 2020.
[32] A. M. U. D. Khanday, S. T. Rabani, Q. R. Khan, N. Rouf and M. Mohi Ud Din, “Machine learning
based approaches for detecting COVID-19 using clinical text data,” International Journal of Information
Technology, vol. 12, no. 3, pp. 731–739, 2020.
[33] M. P. Hossain, A. Junus, X. Zhu, P. Jia, T. H. Wen et al., “The effects of border control and quarantine
measures on the spread of COVID-19,” Epidemics, vol. 32, no. 5, pp. 100397, 2020.
[34] M. Y. Kabir and S. Madria, “CoronaVis: A real-time COVID-19 tweets data analyzer and data
repository,” arXiv: 2004.13932v2, 2020.
[35] M. Mirbabaie, D. Bunker, S. Stieglitz, J. Marx and C. Ehnis, “Social media in times of crisis: Learning
from hurricane harvey for the coronavirus disease 2019 pandemic response,” Journal of Information
Technology, vol. 35, no. 3, pp. 195–213, 2020.CMC, 2021, vol.68, no.2 2247
[36] L. Aggarwal, P. Goswami and S. Sahdeva, “Multi-criterion intelligent decision support system for
COVID-19,” Appllied Soft Computing Journal, vol. 101, pp. 107056, 2020.
[37] H. Yun, Z. Sun, J. Wu, A. Tang, M. Hu et al., “Laboratory data analysis of novel coronavirus
(COVID-19) screening in 2510 patients,” Clinica Chimica Acta, vol. 509, no. 8, pp. 94–97, 2020.
[38] “Twitter scraper,” [Online]. Available: https://github.com/taspinar/twitterscraper (Accessed
05 August 2018).
[39] “Processing raw text,” [Online]. Available: https://www.nltk.org/book/ch03.html.
[40] “NLTK 3.5 documentation,” [Online]. Available: https://www.nltk.org/_modules/nltk/stem/porter.html
(Accessed 24 July 2019).
[41] M. L. McHugh, “Interrater reliability: The kappa statistic,” Biochemia Medica, vol. 22, no. 3, pp. 276–
282, 2012.
[42] J. L. Fleiss, B. Levin and M. C. Paik, “The measurement of interrater agreement,” Statistical Methods
for Rates and Proportions, vol. 2, pp. 598–626, 2004.
[43] L. Breiman, “Random forests,” Machine Learning, vol. 45, no. 1, pp. 5–32, 2001.
[44] “Anaconda,” [Online]. Available: https://anaconda.org/.
[45] “Scikit-learn,” [Online]. Available: https://scikit-learn.org/stable/.
[46] “NumPy,” [Online]. Available: https://numpy.org/.
[47] “Keras,” [Online]. Available: https://keras.io/api/layers/initializers/.
[48] D. M. W. Powers, “Evaluation: From precision, recall and f-measure to roc, informedness, markedness
& correlation,” Journal of Machine Learning Technologies, vol. 2, no. 1, pp. 37–63, 2011.You can also read