Funding Programme for 2018
←
→
Page content transcription
If your browser does not render page correctly, please read the page content below
Economic Policy &
Funding Programme for 2018

                    May 2018
Disclaimer
This presentation material has been prepared by the Spanish Treasury and is updated on a regular basis, using only public and
already published information. We reserve all rights.
This document is for information purposes only. Nothing in this presentation material constitutes, or forms part of, any offer or
invitation to underwrite, subscribe or otherwise acquire or dispose of Spanish Government debt. It is provided for information
purposes only and it is not intended to provide the basis for any credit or any other third party evaluation of that debt. While the
Spanish Treasury applies its best efforts to include accurate information and the information herein is believed to be reliable, it makes
no representation or warranty as to the accuracy or completeness of such information.
Distribution of information contained in this presentation material may be forbidden or limited by legislation of some jurisdictions.
ACCESS IS DENIED TO PERSONS TO WHOM THESE RESTRICTIONS IN SUCH JURISDICTIONS APPLY AND GRANTED ONLY TO
JURISDICTIONS IN WHICH THE DISTRIBUTION OF THIS INFORMATION IS NOT LEGALLY LIMITED.
The information contained on this website does not constitute an offer for sale in the United States of America. The securities
described have not been, and will not be, registered under the US Securities Act of 1933, as amended, or with any securities regulatory
authority of any state or other jurisdiction in the United States of America and may not be offered or sold, directly or indirectly, into
the United States of America unless the securities are so registered or an exemption from the registration requirements is available.
Each person is required to inform himself accordingly and to comply with applicable restrictions. The Treasury of the Kingdom of
Spain is by no means liable for any such infringement.
As a consequence of the previous information, you confirm that you are not a resident of the United States of America or of any
jurisdiction in which the distribution of this information is legally limited and that you will not distribute any of the information and
documents contained hereon to any person resident in the United States of America or in any jurisdiction in which the distribution of
this information is legally limited. None of the information displayed or in connection with the presentation material is an offer of
securities for sales in the United States of America.

                                                                                                                                            1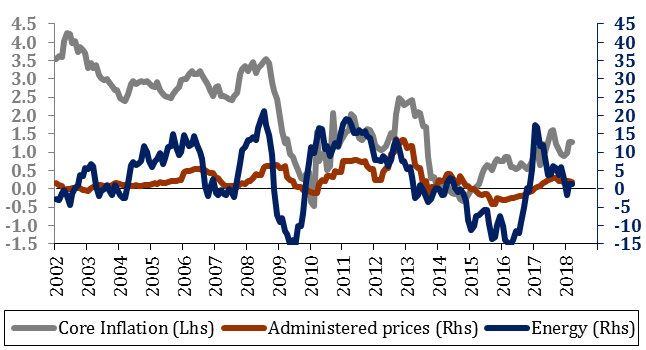
Highlights: Correction of imbalances
                   Investment-Savings Gap                     Unemployment Rate                      Private Sector Debt-to-GDP Ratio
                         (% of GDP)                (Seasonally Adjusted. % of Active Population)                  (% GDP)
   IMBALANCES
    DOMESTIC

                   Exports and Imports      Current Account Adjustment
                                                               Current Account
                                                                          since 2007               Net International Investment Position
                       (% of GDP)                       (In pp of GDP)
                                                                   (% of GDP)                                    (% of GDP)
   EXTERNAL
    SECTOR

                     Budget Balance                     Reduction in the Structural Deficit        Debt-to-GDP of the General Government
                       (% of GDP)                                2009-2017 (f)                                   (% of GDP)
   PUBLIC SECTOR

                                                                 (% of GDP. IMF)

Introduction                                                                                                                               2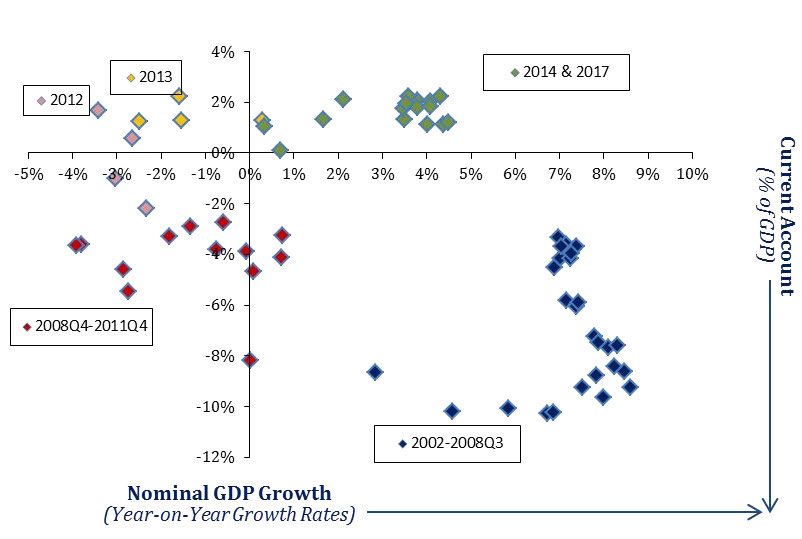
1. Transformation of Spain’s growth model

1.1 Recent macroeconomic trends                          Page 4-5
1.2 The structural transformation of the labour market   Page 6-8
1.3 Population trends                                    Page 9
1.4 Trends in inflation                                  Page 10
1.5 The adjustment of the financial sector               Page 11-12
1.6 New credit flows consistent with deleveraging        Page 13-14
1.7 Positive developments in the construction sector     Page 15
1.8 From net borrower to net lender                      Page 16-20

2. Spanish Economic Policy & Reforms

3. The Funding Programme in 2018
Macroeconomic scenario 2016-2018
Recent macroeconomic trends
Strengthening of balance sheet clean-up in the private sector & CA surplus
Unemployment rate forecast to decline to 11% by 2021
Macroeconomic scenario (YoY growth rates in percent)
Growth Forecasts for 2018.
2015 2016 2017 2018 2019 2020 2021 International Monetary Fund
Private consumption expenditure 3.0 3.0 2.4 2.0 1.8 1.7 1.7 (Year-on-Year Growth Rates)
General Government consumption expenditure 2.1 0.8 1.6 1.1 1.2 1.2 1.2
Gross Fixed Capital Formation 6.5 3.3 5.0 4.7 4.4 4.3 4.3
National Demand* 3.9 2.5 2.8 2.3 2.2 2.1 2.1
Exports of goods and services 4.2 4.8 5.0 4.8 4.6 4.4 4.2
Imports of goods and services 5.9 2.7 4.7 4.1 4.2 4.0 4.0
External demand* -0.4 0.7 0.3 0.4 0.3 0.2 0.2
Gross Domestic Product 3.4 3.3 3.1 2.7 2.4 2.3 2.3
Other macroeconomic variables
2015 2016 2017 2018 2019 2020 2021
Unemployment rate (in % of Active Population) 22.1 19.6 17.2 15.5 13.8 12.3 11.0 Source: IMF WEO Database April 2018.
Full-time Equiv. Employment (YoY Growth) 3.2 3.0 2.8 2.5 2.3 2.1 2.0
Net lending(+)/borrowing(-) with RoW (% of GDP) 1.7 2.1 2.0 1.9 1.8 1.7 1.5
Private Consumption deflator (YoY Growth) -0.1 -0.1 1.8 1.4 1.6 1.7 1.8
Headline Balance General Gov't (in % of GDP)** -5.3 -4.5 -3.1 -2.2 -1.3 -0.5 0.1
Underlying assumptions
2015 2016 2017 2018 2019 2020 2021
USD/€ exchange rate 1.1 1.1 1.13 1.2 1.2 1.2 1.2
Euro Area GDP growth (YoY growth) 2.0 1.8 2.5 2.4 2.0 1.8 1.8
Oil prices (Brent, USD/barrel) 52.2 43.3 54.3 67.7 63.9 63.9 63.9
(*) Contributions to GDP in p.p
(**) Including Financial Sector One-Offs Link to Data
Sources: Ministerio de Economía, Industria y Competitividad and Ministerio de Hacienda y Función Pública.
In white, forecasts contained in the Stability Programme Update.
TRANSFORMATION OF SPAIN’S GROWTH MODEL 4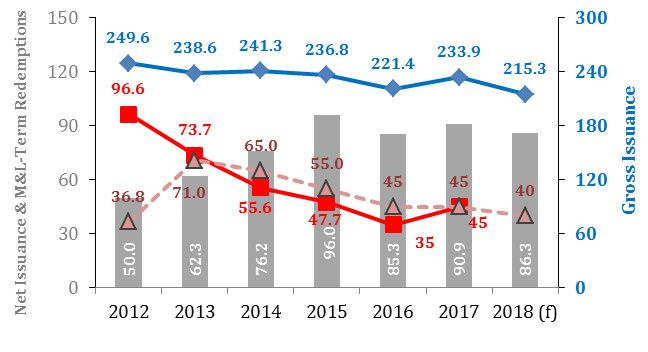
Growth is less vulnerable to volatility
Recent macroeconomic trends
Spain set to be one of the fastest growing Gross Domestic Product
(Year-on-Year Growth Rates)
large advanced economies in 2017 & 2018
Positive tailwinds shared across the Euro
Area (i.e., low interest rates & improved credit
conditions)
The positive effects of structural reforms
explain the differential improvement
Source: Eurostat. Link to Data
Manufacturing PMI Economic Sentiment Indicator
(Index, >50 expansion) (Index, long-term average=100)
Sources: Bloomberg & Eurostat. Link to Data
TRANSFORMATION OF SPAIN’S GROWTH MODEL 5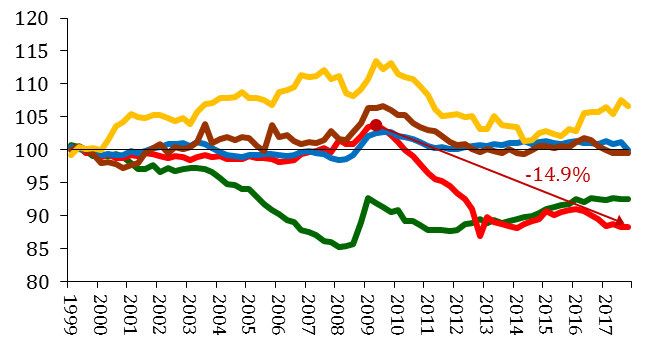
Labour market reform: a change in labour dynamics
The structural transformation of the labour market
Progressive correction of long-term unemployment Long-Term Unemployment
Unemployment & Youth Unemployment (Unemployment pool by time unemployed,
(% of Active Population) Year-on-Year Growth Rates)
Source: National Statistics Institute. Link to Data Source: National Statistics Institute and Eurostat. Link to Data
Real Labour Productivity Real Unit Labour Costs
(Index 1999=100, Seasonally and Calendar Adjusted) (Index 1999=100, Seasonally and Calendar Adjusted)
DE ES
FR IT
UK
DE ES
FR IT
UK
Source: Eurostat. Link to Data
TRANSFORMATION OF SPAIN’S GROWTH MODEL 6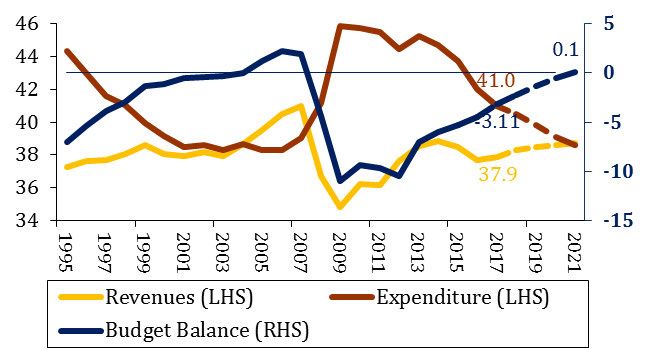
Growth is widely distributed across sectors
The structural transformation of the labour market
Since 2013Q4 employment has increased Weighted Average Percentage of Branches of Economic
Activity with Positive QoQ Employment Growth
by almost 1.8 million persons
In the last year employment growth has
been widespread across sectors and
especially intense in manufacturing and
wholesale & retail trade (approx. 70% of all
branches expanding)
Labour Force Survey, 2017Q2
Breakdown by Branches of Economic Activity.
(Weights in Parenthesis)
Financial & insurance (2.5%)
Domestic Service (3.5%) Year-on-Year
Electricity, gas, steam & air cond. (0.5%) vs 2013Q4
(Thousands of Persons)
International Organisations (0.0%)
Mining and quarrying (0.2%)
Water supply; Waste & Remediation (0.8%)
Agric., forestry & fishing (4.2%)
Real estate activities (0.7%)
Administrative & support service (5.2%)
Public Admin & Defence; Social Sec. (7.2%)
Other Services (2.5%)
Arts, entertainment & recreation (2.1%)
Information & Communication (3.2%)
Construction (2.4%)
Transportation & storage (5.2%)
Wholesale & retail;repair motor (16.6%)
Education (7.0%)
Prof., Scien. & Tech. (5.4%)
Human health & social work (8.7%)
Accom. & food (9.0%)
Manufacturing (13.3%)
-50 0 50 100 150 200 250 300 350 400
Source: National Statistics Institute. Link to Data
TRANSFORMATION OF SPAIN’S GROWTH MODEL 7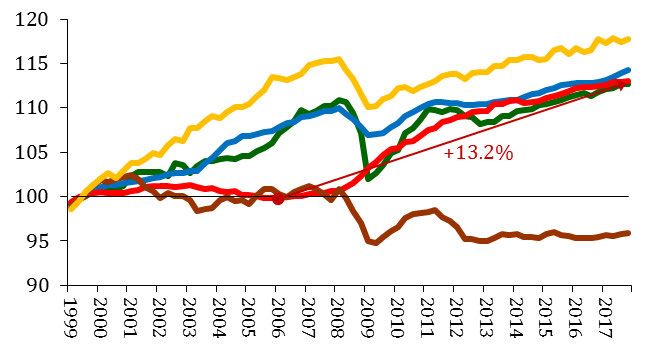
Population trends
Population Trends
Population expanding again on positive net Contributions to the Year-on-Year Growth in
Population Over 16 Years
immigration flows since 2016 Population
46,528,966
Foreign population stabilising after
several years of emigration
Spanish nationals close to balanced
migration flows
Source: National Statistics Institute. Link to Data
Contributions to Year-on-Year Growth the Net Migration Flows by Nationality
Unemployment Rate (Thousands of Persons)
Source: National Statistics Institute. Link to Data
Source: National Statistics Institute. Link to Data
TRANSFORMATION OF SPAIN’S GROWTH MODEL 8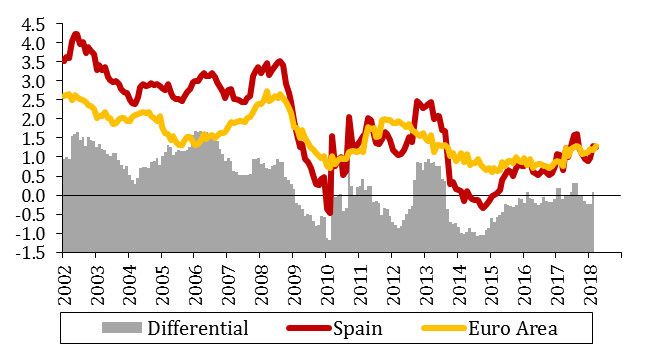
Changing employment patterns strengthen confidence
The structural transformation of the labour market
Less reliance on temporary contracts, more Share of Temporary and Part-Time Contracts
in Total Employment
open-ended & part-time contracts Temporary (In %) Part-Time
Previously discouraged workers re-engaging
the labour force
Higher job security and lower unemployment
boosts confidence and consumption
Source: National Statistics Institute and Eurostat. Link to Data
Consumer Confidence & Retail Sales Consumption & Transition from Employment to Unemployment
(Levels and Year-on-Year Growth Rates) (YoY Growth Rates & Observed Frequencies*)
Source: Ministerio de Economía, Industria y Competitividad. Link to data Source: National Statistics Institute. Link to Data
* Frequency of becoming unemployed in a given quarter of a person
who was employed in the previous quarter.
TRANSFORMATION OF SPAIN’S GROWTH MODEL 9Positive core inflation and favourable inflation differential
Trends in Inflation
Positive core inflation, and favourable Core Inflation and Inflation Differential vs. EU
(In %, Year-on-Year Growth Rates)
inflation differential vs. main trading partners,
support cost-competitiveness
Inflation linked to administered prices to
remain subdued due to the reforms
implemented in 2013 (“De-indexation Law”)
Sub-Components in Spanish HICP
(In %, Year-on-Year Growth Rates)
Source: Ministerio de Economía, Industria y Competitividad. Link to Data
TRANSFORMATION OF SPAIN’S GROWTH MODEL 10Adjustment and recapitalisation of the financial system (I)
The adjustment of the financial sector
Spain’s financial sector is now leaner, more Harmonised Non-Performing Exposure Ratios
(In %)
efficient and better capitalised
Better prepared for NPLs through better
coverage of doubtful exposures
Further improvement of the equity-to-asset
ratio & funding gap
Source: EBA. Link to Data
Equity-to-Assets and Lending-to-Deposits Ratio Harmonised Non-Performing Coverage Ratio
(In %) (In %)
Source: Bank of Spain. Link to Data Sources: EBA. Link to Data
* Up to February 2018
TRANSFORMATION OF SPAIN’S GROWTH MODEL 11Adjustment and recapitalisation of the financial system (II)
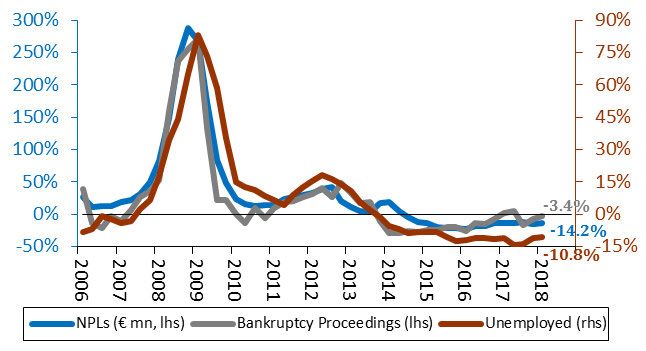
The adjustment of the financial sector
Private resident sectors’ doubtful loans Breakdown of Year-on-Year Growth Rate of NPL
Ratio of the Private Resident Sector into its
declining 14% yoy by 2018Q1 Components
• Decrease in Loans to ORS since
Positive feedback loops between
peak (2008Q4): €641.2bn
• Decrease in NPL: €101.4bn
unemployment reduction, bankruptcy
proceedings and NPLs
Source: Bank of Spain. Link to Data
Adjustment in Deposit Taking Institutions NPLs of the Private Resident Sector, Unemployment &
(Number of Employees and Branches) Bankruptcy Proceedings
Employees Branches (Year-on-Year Growth Rates)
Source: Bank of Spain. Link to Data Sources: Bank of Spain and National Statistics Institute. Link to Data
TRANSFORMATION OF SPAIN’S GROWTH MODEL 12New loans to households & changes in corporate finance
New credit flows consistent with deleveraging
Interest rates have converged in the Euro Lending Rates of New Loans to Non-Financial Corporations
(%. Maturity 1-5 Years and up to €1 mn)
Area
Deleveraging has modified the composition
of liabilities in the private sector: proportionally
fewer loans & more equity
Source: ECB. Link to Data
New Loans Non-Financial Corporates Liability Structure of Households & Non-financial
(Smoothed. Year-on-Year Growth Rates) Corporations
(Households) (Corporations)
Source: Banco de España. Link to Data Source: Banco de España. Link to Data
TRANSFORMATION OF SPAIN’S GROWTH MODEL 13Private sector deleveraging continues
New credit flows consistent with deleveraging
Corporate indebtedness below Euro Area Debt to GDP Ratios of Households and
Non-Financial Corporations
Average (96.8% of GDP vs. 101.7%) (Households) (% of GDP) (Corporations)
Since 2010Q2 the private sector has
deleveraged by €510 bn; firms by €307 bn
and Households by €203 bn
Job creation makes private-sector
deleveraging compatible with growth in
private consumption and investment
Debt Service Ratio Debt to GDP vs. Consumption & Investment
Non-Financial Private Sector (Year-on-Year Growth Rates)
(In %) (Households) (Corporations)
Source: Bank for International Settlements. Link to Data Source: ECB, Bank of Spain and National Statistics Institute. Link to Data
TRANSFORMATION OF SPAIN’S GROWTH MODEL 14Spain’s construction sector is beginning to recover
Positive developments in the construction sector
House Price Index
Prices bottomed out around mid-2014, and (Growth Rates)
have shown a moderate upward trend
Gradual recovery in housing transactions
since 2013; increasing use of fixed-rate
mortgages (38.1% by end-2017)
Gross value added generated by the
construction sector is expanding since 2014
Source: National Statistics Institute. Link to Data
Mortgages and Housing Transactions Gross Value Added in Construction
(Type of References used in Mortgage Transactions) (YoY Growth Rates, LHS / Weight in Total GDP, RHS)
Source: National Statistics Institute. Link to Data Source: National Statistics Institute. Link to Data
TRANSFORMATION OF SPAIN’S GROWTH MODEL 15External sector: from net borrower to net lender
From net borrower to net lender
The weight of exports of goods & services in Exports and Imports
(% of GDP)
GDP has increased from 21.9% in 2009Q1 to
33.9% by 2017Q4
Exports of Goods +61.2%
Exports of non-tourism services +33.8%
Tourism +41.9%
This trend has been feasible due to Spanish
firms’ increased propensity to export Source: National Statistics Institute. Link to Data
Exporting Firms Exports of Goods & Services
(Index 2006=100) (Volume Index. 2008=100)
Goods: +61.2%
Non-Touristic Serv.: +33.8%
Tourism: +41.9%
Source: ICEX. Link to Data Source: Eurostat and National Statistics Institute. Link to Data
* Up to February 2018
TRANSFORMATION OF SPAIN’S GROWTH MODEL 16Exports are more widely diversified
From net borrower to net lender
Change in Share in Spanish Merchandise Exports since 2005
Spain continues diversifying its export base: 1 0 1 4 56 122
# of
5 countries
> -2.0% -2% to -1.2% -1.2% to -0.7% -0.7% to -0.3% -0.3% to 0% 0% to +0.5% >+0.5%
Increasing market share of Eastern
Europe, Africa & Asia, North & South
America
Decreasing market share of West
European countries & Russia
Spain is the single major EA Member to
increase its share in world merchandise
exports since the 1990s
Relative Changes in World Export Shares Most Recent Year-on-Year Growth Rates of Merchandise Exports
(Index 1990=100) >-5% -5% to -2% -2% to 0% 0% to 2% 2% to 5% > 5%
130
110
90
70
50
1990
1991
1992
1993
1994
1995
1996
1997
1998
1999
2000
2001
2002
2003
2004
2005
2006
2007
2008
2009
2010
2011
2012
2013
2014
2015
2016
Spain France Germany Italy UK US
Source: World Bank. Link to Data Source: Datacomex. Link to Data
TRANSFORMATION OF SPAIN’S GROWTH MODEL 17Imports are now increasing for investment and for re-export activities
From net borrower to net lender
Main Export and Import Products (YoY Growth)
Balance by Type of Merchandise (With Weight in Total 2013 Merchandise Exports >1%.
(2018 vs. 2007, € bn) Smoothed data. In Brackets Share and % of Intermediate Goods)
Exports
Imports
Source: Ministerio de Economía, Industria y Competitividad.
Link to Data
TRANSFORMATION OF SPAIN’S GROWTH MODEL 18Services exports expand the CA surplus
From net borrower to net lender
Tourism services are reaching historical Quarterly Services Balance
(€ bn)
highs
Exports of services other than tourism
(exports of services to firms, consultancy &
other professional services, IT-related
services, etc.) are expanding at high growth
rates
Quarterly Services Balance Quarterly Services Balance
Other Than Tourism. By Region Other Than Tourism. By type of Service
(€ bn) (€ bn)
Source: Bank of Spain. Link to Data
TRANSFORMATION OF SPAIN’S GROWTH MODEL 19Net International Investment Position in the context of growth & CA surplus
From net borrower to net lender
GDP growth is not linked to current account Current & Capital Accounts
(% of GDP)
deficits as in previous growth cycles
The NIIP, once excluding valuation effects,
has declined by 18.4pp since 2013
Source: Bank of Spain. Link to Data
Breakdown of the Net International
Investment Position
(% of GDP)
Source: Bank of Spain. Link to Data Sources: National Statistics Institute & Bank of Spain. Link to Data
TRANSFORMATION OF SPAIN’S GROWTH MODEL 201. Transformation of Spain’s growth model 2. Spanish Economic Policy & Reforms 2.1 General Government deficit in 2017 Page 22 2.2 Fiscal Projections for 2018-2028 Page 23 2.3 Budgetary Execution in 2018 Page 24 2.4 Reform Policies Page 25-33 3. The Funding Programme in 2018
General Government deficit in 2017
Fiscal Adjustment
The General Government’s budget balance in 2017 declined to 3.1% of GDP, down from 4.3% in the
previous year, in line with EU Council Recommendations
Regional governments managed to halve their deficit; 11 out of 17 regions complied
Local Governments achieved surplus of 0.6%
Net Lending(+)/Borrowing. (% of GDP. Excl. Financial Sector One-Offs) Balance of Regional Governments
2011 2012 2013 2014 2015 2016
(% of Regional GDP)
Central Government -5.4 -4.3 -4.5 -3.5 -2.7 -2.5 -1.9
Autonomous Regions -3.4 -1.9 -1.6 -1.8 -1.7 -0.8 -0.3
Local Governments -0.4 0.3 0.6 0.5 0.4 0.6 0.6
Social Security Administrations -0.1 -1.0 -1.1 -1.0 -1.2 -1.6 -1.5
General Government -9.3 -6.8 -6.7 -5.8 -5.2 -4.3 -3.1
Memorandum items 2011 2012 2013 2014 2015 2016
Interest Expenditure 2.5 3.0 3.5 3.5 3.1 2.8 2.6
Financial Sector One-offs 0.33 3.68 0.32 0.13 0.05 0.21 0.04
Total Expenditure 45.5 44.4 45.2 44.7 43.7 42.0 41.0
Total Revenue 36.2 37.6 38.6 38.9 38.5 37.7 37.9
Source: Ministerio de Hacienda y Función Pública. Link to data Source: Ministerio de Hacienda y Función Pública. Link to data
* 2011 net of the effects of the Regional Settlement System.
Spanish Economic Policy & Reforms 22Fiscal Projections for 2018-2021
Fiscal Adjustment
Primary surplus to be achieved in 2018. Deficit reduction due primarily to:
Control of public expenditure growth by expenditure rule (requiring primary expenditure growth excl.
cyclical factors to grow below medium-term GDP growth reference rate
Lower impact of unemployment benefits linked to more positive labour market stance
Declining trend in the debt/GDP ratio since 2014, where it reached a peak of 100.4%; debt to
GDP forecast at end-2018 of 97%
Debt-to-GDP of the General Government
(% of GDP)
Net Lending(+)/Borrowing. (% of GDP. Excl. Financial Sector One-Offs)
2016 2017 2018 2019 2020 2021
Central Government -2.48 -1.86 -0.7 -0.3 0.0 0.0
Autonomous Regions -0.84 -0.32 -0.4 -0.1 0.0 0.0
Local Governments 0.61 0.59 0.0 0.0 0.0 0.0
Social Security Administrations -1.59 -1.48 -1.1 -0.9 -0.5 0.0
General Government -4.29 -3.07 -2.2 -1.3 -0.5 0.1
Sources: Ministerio de Economía, Industria y Competitividad and Ministerio de Hacienda y Función Pública.
Forecasts are those contained in the Stability Programme Update. Link to data
Spanish Economic Policy & Reforms 23Budgetary execution in 2018
Budgetary Execution in 2016
Monthly budgetary execution highlights Deficit of Central & Regional Governments and
Social Security Administrations. (Excl. Local Governments &
(February 2018 data): Excl. Financial Sector Recapitalisation)
(% of GDP)
Central Government: deficit €10.8 bn
vs. €11.4 bn by Feb. 2017
Regional Governments: reached a
deficit of €0.6 bn vs. deficit €1.4 bn
up to Feb. 2017
Social Security Administrations: the Source: IGAE. Link to Data
Social Security posted a surplus of
€1.4 bn vs. €1.5 in Feb. 2017
Administrative Distribution of Tax Collection
Jan Feb Mar Apr May Jun Jul Aug Sep Oct Nov Dec
Personal Income Tax
Corporate Income Tax
VAT
Excise Duties
Other Taxes
Total Tax Collection
Tax collection intensity
Lowest Highest
Link to Data
Spanish Economic Policy & Reforms 24Reforms in 2017 and 2018
Reforms in 2017
Self-employment Employment
• Reducing administrative and economic burden • Activation Strategy for Employment 2017-2020
• Broadening of tax incentives to entrepreneurship • Portfolio of Common Services of the Autonomous
• Broadening retirement scheme for entrepreneurs Communities
• Framework Agreement for Collaboration with Private
• Balancing working- and family-life
Employment Agencies
• Law reforming the vocational training system for
Education employment
• State, Social and Political Pact for the Education • Strategy for Youth Entrepreneurship and Employment
• Joint Action Program for the Long-term Unemployed
Public Accounts • Agreement to improve the quality of employment and to
reduce temporality in Public Administrations
• Spending Review
Supervision
• Independent Authority for the Protection of Savers and Financial Investors
• Independent supervisor for insurance and pension funds
• Strengthening of the stock market supervisor with new powers in the fields of accounting and auditing
• Development of internal market for financial services ; enhancement of efficiency and transparency of mortgages and real estate
credit
Science & Environmental Protection
• Medium and long-term framework consistent with the Paris Agreement and the European framework on climate and energy
• State Plan for Science and Technology and Innovation 2017-2020 and the Science Pact
Spanish Economic Policy & Reforms 25A Single Market in Spain: the Law for the Guarantee of Market Unity
Reform Policies
The Market Unity Law establishes uniform principles and regulations in order to guarantee the single
market in Spain, via regulatory cooperation among public administrations & involving the private sector
Establishing a more favourable regulatory framework in order to improve competitiveness and to foster
investment and economic growth. Main areas:
Technical specifications & labelling of products
Licences for self-employed in each region
Public tender operations
Commercial distribution: differences in licensing, opening hours, especial sales, etc.
Initial impact estimates foresee an impact on long-term GDP (10 years) growth estimates of 1.52%
Market Unity Regulations
(Number of Cases)
Regulatory Rationalisation
Economic Operators
National Competition Commission
Agency For the Evaluation of Public Policies
Source: Ministerio de Economía, Industria y Competitividad Link to Data
Spanish Economic Policy & Reforms 26Financial sector reform
Reform Policies
The financial sector reforms aim at addressing the three main problems of corporate financing: the
recovery in financing of viable projects, resolving the dependency on banking credit and reducing the
(declining) differential cost of Spanish SMEs
End 2013 and 2014
Law 26/2013 of savings banks and banking
Initial steps: 2009-Mid 2013 MoU
foundations
FROB I Law 14/2013 Internationalisation bonds & cedulas: support to
2009- Reform of the Legal Framework of Cajas exporting entrepreneurs
2011
Integration of Cajas via “Institutional Protection Schemes” RD-Law 11/2014 financial sector solvency and supervision
and Capital Injections/Asset Protection Schemes
FROB II Venture capital companies and closed-end collective
investment schemes
Clean-up of Balances (I) €50bn in additional
capital and provisions Law 17/2014 Reform of the Insolvency regime (I): pre-insolvency
proceedings; refinancing and restructuring of corporate debt
Clean-up of Balances (II) €29 bn in additional
provisions to cover possible migrations into NPLs Reform of the Insolvency regime (II): broader scope of insolvency
2012 regime & revision of in-court debt restructuring procedures
Asset quality review &
stress tests 2015-2017
Law 9/2012 recovery and
resolution of financial institutions RD-Law 1/2015 Second Chance Act
MoU
Transfer of Law 11/2015 Transposition of the Banking Recovery and
assets to Resolution Directive
2013 Recapitalisation
SAREB for
& restructuring Circular 4/2016 (Bank of Spain)
recapitalised
banks
RD-Law 1/2017 Urgent measures for the protection of
consumers
New legal regime to strengthen credit cooperatives
Spanish Economic Policy & Reforms 27Structural Reforms 2012-2015
Reform Policies
2012: First Generation Reforms
Labour Market Budgetary Framework Financial Sector
2013: Second Generation Reforms
Labour Market Reform Budgetary Plan
Financial Sector Reform
Services/Product Markets Pension System Reform
Strategic Plan for Exporters
Serv. Market Liberalisation Local Administrations
ICO Mediation Credit Lines
Single Market Law De-indexation
Main Reforms 2014-2015
New Legal Measures to
Job Facilitate
Framework for
Activation Reform of the Corporate
IMPLEMENTATION OF Reform of Disintermediati
Strategy and Active Labour Recovery & Debt Second
REFORMS ADOPTED IN the Tax on and
Plan for Market Policy Restructuring Opportunity Law
2012-2013 System Promotion of
Youth Framework
Capital Markets Reform of the
Employment
for SMEs Insolvency Regime
Single Market/Market Unity Law
Economic Structural Reforms Balance Reforms. Three years in
Links to detailed presentations Government
Public Sector Reforms
describing the Reform Agenda
Financial Sector Reforms OECD: CORA Reforms
Spanish Economic Policy & Reforms 28The reform of the public administrations (I)
Reform Policies
The reform of the public sector builds on the structural reform process initiated in 2012
New Regulatory Framework
Liquidity Measures for Regions & Local Governments
Budgetary Reform of the Local
Sustainability Law, 2012-2014 2015
Authorities Embedded into
Fiscal supervisory ENHANCED the Treasury’s
FLA
rules FFPP LIQUIDITY Funding
Enabling the MECHANISMS Programme
Undue expenditures
Fiscal discipline at all levels Provision of centralisation of 2012: €16.6 bn
of the Administration liquidity to public debt Fund for the financing 2013: €23.0 bn
suppliers of issuance in of Local Governments: 2014: €23.0 bn
Early-warning system, Transfer of competences Spain
Local & Fondo de 2015: €39.9 bn
enforcement and sanction Regional 2016: €26.0 bn
Ordenación
procedures Governments Providing
Mergers & integrated Fondo de Impulso 2017: €17.5 bn
liquidity to
Transparency: monthly and management Económico
2012: €27.4 Autonomous
quarterly execution Regions
bn
Changes at minor local 2013: €6.8 bn
Assurance of compliance: Fund for the financing
entities 2014: €8.0 bn Ensuring
coercive measures and of Regional
The fiscal and
enforced compliance Governments Stricter fiscal
Programme has financial
Resizing of the local public
been ended by sustainability Financial facility conditionality &
Law for Transparency in the sector
July 2014 FLA issuance caps
Public Strict
Temporary and exclusive additional fiscal
Administrations: staff of local governments compliance
accountability & governance
Commission for the reform of the public administration
General measures Sub-commission for administrative simplification Sub-commission on administrative overlap
Sub-commission for management of common services and resources Sub-commission for institutional administration
Electronic Billing Law
De-indexation Law
Spanish Economic Policy & Reforms 29The reform of the public administrations (II)
Reform Policies
A highly devolved system of regional and local Spain Austria Germany Italy Italy France Belgium
17 Autonomous
Special Statute
Bundesländer
Bundesländer
competencies, more than elsewhere in Europe
Communities
2 Com. Ling
3 Regions
Ordinary
Regions
Regions
Regions
Statute
16
15
26
5
9
Together with the resources provided by the Education
Regional Financing System, regions have access to Health
Transport
region-specific taxes, transfers from the General
Economy
Justice
State Budgets, EU Funds etc
Universities
Police
Infrastructures
Since 2012 two auxiliary Funds were established by
Environment
Housing
the Central Government FLA and FFPP
Local Entities
Culture
Tourism
“Fund to Finance Supplier Payments” (FFPP) Employment
Social Services
aimed at paying the territorial administrations (both Autonomous
Community
GDP
(Weight in
Total Liquidity
Measures € mn
% in total
Liquidity
regions and municipalities) for outstanding invoices
national GDP) (2012-2017) Measures
CATALUÑA 19.0% 70,910 30.6%
C. VALENCIANA 9.4% 53,757 23.2%
and, hence, regularising the arrears. This Fund was ANDALUCIA
CAST. LA MANCHA
13.3%
3.4%
35,050
14,735
15.1%
6.4%
extinguished in July 2014. The outstanding debt was BALEARS (ILLES)
MURCIA
2.6%
2.6%
9,745
9,666
4.2%
4.2%
assumed by the Spanish Treasury GALICIA
CANARIAS
3.8%
5.2%
7,044
6,816
3.0%
2.9%
CASTILLA - LEON 18.9% 5,007 2.2%
MADRID 5.0% 4,729 2.0%
ARAGON 3.1% 4,635 2.0%
EXTREMADURA 1.6% 3,356 1.4%
CANTABRIA 1.1% 2,960 1.3%
ASTURIAS 1.9% 2,692 1.2%
RIOJA (LA) 0.7% 686 0.3%
PAIS VASCO 6.2% 0 0.0%
NAVARRA 1.7% 0 0.0%
TOTAL € mn 231,786
Spanish Economic Policy & Reforms 30The Pension System reform reduces the impact of population ageing
Reform Policies
In December 2013, the Pension System Gross Expenditure in Public Pensions
(% of GDP)
Reform was approved. It introduced two factors 18
Before the
2020 2030 2050 2060
to which pensions will be linked: 16
reform
A yearly update factor which links pensions 14 After the
reform
to the financial situation of the pension 12
system, to the number of pensioners and to 10
the average pension
Italy
Austria
Spain
Germany
Belgium
Portugal
France
Finland
Luxembourg
Greece
Spain B
A life expectancy factor as from 2019,
which will be evaluated every 5 years Source: European Commission and
Ministerio de Economía, Industria y Competitividad
Link to Data
Projections towards 2030-2060 point towards Year
Statutory retirement
age
Minimum contribution
period for retirement at 65
a stabilisation in gross expenditure in public old 2013 65 years and 1 month
years
35 years and 3 months
age-pensions 2014
2015
65 years and 2 months
65 years and 3 months
35 years and 6 months
35 years and 9 months
2016 65 years and 4 months 36 years
2017 65 years and 5 months 36 years and 3 months
2018 65 years and 6 months 36 years and 6 months
2019 65 years and 8 months 36 years and 9 months
2020 65 years and 10 months 37 years
2021 66 years 37 years and 3 months
2022 66 years and 2 months 37 years and 6 months
2023 66 years and 4 months 37 years and 9 months
2024 66 years and 6 months 38 years
2025 66 years and 8 months 38 years and 3 months
2026 66 years and 10 months 38 years and 3 months
2027+ 67 years 38 years and 6 months
Spanish Economic Policy & Reforms 31The labour market reform addresses Spain’s most important imbalance
Reform Policies
The labour market reform tackles the main shortcomings of the Spanish labour market: high structural
unemployment, high youth unemployment, duality, high employment volatility and wage indexation which
limit gains in competitiveness
Collective Bargaining Internal Flexibility of Firms External Flexibility of Firms Contracts
Dynamic bargaining more Avoiding
Avoiding lay-offs: rigidity
rigidity Reduction of severance pay Crisis contract: new contract
responsive to the needs of fostered
fostered job
job cuts as a means
means ofof for unfair dismissals for entrepreneurs aimed at
businesses and workers adjusting to economic
adjusting to economic changes small businesses. It has a one-
Lack of flexibility avoided Clear and objective year trial period. Tied to
Move beyond the model of innovation and gains in regulatory framework of fair employment tax breaks and
indexing salaries and wages competitiveness dismissals fiscal tax credit, specially for
hiring young workers. Breaks
Balanced regulatory Severance pay for unfair and credits are designed to
Classification of workers
framework in line with dismissal down to 33days/Max limit the dead-weight effect
based on skills not on
economic circumstances 24months of salary vs. Training and skill building:
professional occupations
45days/Max 42 months deep regulatory modifications
Simplification of rules for
Clarification of fair dismissal to provide a structural change
the reallocation of workers
causes (20days/Max 12 Mo) and develop a dual training
Opting out from higher-level Streamlining the adoption of
Removal of administrative system that allows a balance of
agreements significant changes in working
authorisation for collective training and work
Priority of company-level conditions
layoffs Flexible regulation of
agreements Furloughs/Time-reductions
Elimination of procedural telework
Limiting the statutory if legitimate financial,
salaries Part-time contract:
extension rule of expired productive or organisational
Fair dismissals for economic increased flexibility, allowing
agreements up to one year reasons exist
causes of civil servants overtime
(unlimited before) Distribution of working-
Streamlining of dismissals
time
based on absenteeism
Spanish Economic Policy & Reforms 32Reform of the insolvency law
Reform Policies
The reform aims at increasing efficiency and legal certainty in insolvency procedures by ensuring that:
Non-viable debts are resolved
Viable debts are repaid and companies are able to continue with their activity
INSOLVENCY LAW REFORM
Enhancing out-of-court agreements Simplification of in-court Re-designing the judicial
insolvency procedures administration
Second Opportunity/Fresh Start Facilitating the split and sale of Classification and register of
Mechanism for individuals and firms separated production units insolvency administrators according
to their past experience
Promotion of refinancing agreements Adjustment of real estate guarantees
Simplification of Collective Refinancing Designation of the insolvency
Agreements Quorum requirement to pass the administration rests on automatic
draft agreement depends now on the process, instead of judicial
nature of the measures to be agreed appointment
Specific measures
-Certainty while negotiating: interruption
of enforcement measures up to conclusion Liquidation phase: more capacities
attached to judges in order to sell a Creation of a list of functions that the
of arrangements (4 months) judicial administrator is able to
productive unit, even if the offered
-Flexibility on the content of the price is lower, as long as future perform in order to provide more
agreement and by extension of viability of the firm is ensured clarity and legal certainty
agreements to dissenting creditors
Spanish Economic Policy & Reforms 331. Transformation of Spain’s growth model 2. Spanish Economic Policy & Reforms 3. The Treasury’s Funding Programme The Funding Programme in 2018 Page 35-40
The Treasury’s Funding Programme in 2018
Net issuance of €40 bn in 2018; programme (In billon euros and in effective terms) End 2017
Forecast
includes €15 bn loan to Social Security 2018
Total Net Issuance 45.031 40.000
Total issuance up to May €89.3 bn 10th: Total Gross Issuance 233.900 215.327
(41.5% of the funding programme), of which
Medium- and Long-term
Gross Issuance 1 139.462 131.310
€60.7 bn (46.2%) in medium- and long-term Amortisation
Net Issuance
1
1
90.903
48.559
86.310
45.000
instruments and €28.6 bn (34.1%) in Letras del Letras del Tesoro
Tesoro Gross Issuance
Amortisation
94.439
97.966
84.017
89.017
Net Issuance -3.528 -5.000
1
Includes debt in other currencies, Bonos y Obligaciones, loans and assumed debts.
The Treasury’s Funding Programmes Since 2012 Funding Programme in 2018
(In € bn) (Gross issuance, € bn, May 10th. 2018)
( )
Gross Issuance p M&L-Term Redemptions
F'cast Net Issuance (Jan.) Final Net Issuance (Dec.)
Source: Secretaría General del Tesoro y Política Financiera. Link to Data
The Treasury’s Funding Programme 35Cost and life of debt: longer tenors at historically low rates
Cost of Debt Outstanding and Cost at Issuance Average Life of Debt Outstanding
(*As of May 10th 2018, in percent) (*As of May 10th 2018, in years)
Marginal Life at Issuance of Bonos and Obligaciones Average Life at Issuance of Bonos and Obligaciones
(*As of May 10th 2018 in years) (*As of May 10th 2018, in years)
Source: Secretaría General del Tesoro y Política Financiera. Link to Data
The Treasury’s Funding Programme 36Recent trends in investor base
Holdings of Letras & Bonos and Obligaciones del Estado
(€ mn)
Non-Resident (%)
Holdings of Letras & Bonos and Obligaciones del Estado Holdings of Letras & Bonos and Obligaciones del Estado
Resident Credit Institutions (%)
(€ mn) (€ mn)
Bank of Spain (%)
Source: Bank of Spain.
(2012-2015 IBERCLEAR data / 2016- Securities Holdings Statistics) Link to Data
The Treasury’s Funding Programme 37Syndicated issuance in 2017
JANUARY - NEW 10 YEAR REFERENCE. APR. 2027 FEBRUARY - NEW 15 YEAR REFERENCE. JUL. 2033
Geographic Distribution (%) By Type of Investor (%) Geographic Distribution (%) By Type of Investor (%)
Asia / Other Central Nordics Other Other Central
Other Nordics Middle
Hedge
0.4% Bank/OI 2.4% 0.9% 0.6% Bank/OI
Eur. 4.3% Fund Spain
East Spain 5.3% 4.7%
7.4% US / 17.8%
US/ 4.3% 3.9% 42.7% Banks Hedge Banks
Canada 45.3% Canada Funds 37.9%
5.5% 17.1% 18.1%
Pension /
Insurance
Germany 12.4%
/Austria/
Switz.
10.1% United
Kingdom
23.1%
Germany Pension/
France / Austria
United France Insurance Fund
/Italy Fund / Switz.
Kingdom /Italy 14.0% manager
10.9% Manager 20.7%
18.2% 18.0% 24.7%
29.3%
APRIL - NEW 10 YEAR EURO AREA INFLATION- JUNE- NEW 10 YEAR REFERENCE. OCT 2027
LINKED REFERENCE. NOVEMBER 2027
Geographic Distribution (%) By Type of Investor (%) Geographic Distribution (%) By Type of Investor (%)
Other Nordics Other Central Other Nordics Other Central
Europe 4.4% 0.0% Bank/OI Banks Europe 4.4% 0.0% Bank/OI
10.1% 13.6% 30.9% 10.1% 13.8%
Spain Spain Other Banks
37.4% 37.4% 0.4% 37.0%
Hedge
North Funds North Hedge
America 10.7% America Funds
8.9% 8.9% 12.0%
France France
14.0% 14.0%
Pension/
Pension/ Insurance
United United
Insurance Fund 6.6%
Kingdom Kingdom
13.9% manager Fund
25.3% 25.3%
30.9% manager
30.2%
Link to Data
The Treasury’s Funding Programme 38Syndicated issuance in 2018
Final orderbook closed in excess of €43 bn JANUARY - NEW 10 YEAR REFERENCE. APR. 2028
(including €6.25 bn of JLM interest) Geographic Distribution (%) By Type of Investor (%)
The high-quality and diversification of the
investor base allowed to set the transaction
size at €10 bn
This is the largest ever order book in the
history of Spanish government bond
syndications
Final orderbook closed in excess of €26 bn JANUARY - NEW 30 YEAR REFERENCE. OCT. 2048
(including €2.45 bn of JLM interest) Geographic Distribution (%) By Type of Investor (%)
The high-quality and diversification of the
investor base allowed to set the transaction
size at €6 bn
Link to Data
The Treasury’s Funding Programme 39Spain’s Euro inflation-linked programme
Spanish Linker Supply, Auctions & Syndications Share of Inflation-Linked Bonds in Total Outstanding
(As of March 10th 2018, € bn lhs and bps rhs) (As of May 10th 2018, € bn & percent )
Outstanding Inflation-Linked Bonos and Obligaciones Total Outstanding € Inflation Debt -
(As of May 10th 2018, € mn) breakdown by issuer
Bonos Obligaciones del Estado indexed to European inflation (As of May 10th 2018, Percent)
Harmonised index of consumer prices excluding
Reference Index
tobacco for the Eurozone
Maturity Outstanding
Reference Index
Date Years amount (mn €)
SPGBei 0.55% 30/11/2019 1.56 9,786.23
SPGBei 0.30% 30/11/2021 3.56 5,790.57
SPGBei 1.80% 30/11/2024 6.56 13,404.22
SPGBei 0.65% 30/11/2027 9.56 7,915.85
SPGBei 1.00% 30/11/2030 12.56 8,347.13
TOTAL 45,244.01
The Treasury’s Funding Programme 40Evolution of Ratings
Rating and Rating Actions vs.
(rating)
End-of-Month Spread to 10Y Bunds (basis points)
-25
Aaa/AAA/AAA 16 0
25
Aa1/AA+/AA H 50 Announced Rating Dates in 2018
75 Fitch S&P DBRS Moody's
100
Aa2/AA/AA 14 125
January 19
150 February
175 March 23
Aa3/AA-/AA L 200
225 April 6 13
A1/A+/A H
12 250 May
275 June
A2/A/A 300
325 July 13
10
350 August
A3/A-/A L 375 September 21 28
400
Baa1/BBB+/BBB H October 5
425
450 November
Baa2/BBB/BBB 8 475 December
500
525
Baa3/BBB-/BBB L 550
575
Ba1/BB+/BB H 6 600
1999
2000
2001
2002
2003
2004
2005
2006
2007
2008
2009
2010
2011
2012
2013
2014
2015
2016
2017
2018
MOODY'S S&P FITCH DBRS Risk Premium (rhs)
Link to Data
The Treasury’s Funding Programme 41More and updated information on the Spanish economy
For spreadsheets click on ‘Link to Data’
Click here to download all spreadsheets
National Statistics Institute
Includes all relevant short-term and structural statistics generated by
the National Statistics Authorities.
The Spanish Economy
Contains a collection of relevant reports on economic outlook, public
finances, public debt, the financial sector and reform initiatives.
Ministry for the Economy, Industry and Competitiveness
Includes the latest economic forecasts and reports as well as a database
with over 21,000 short-term and long-term indicators and
macroeconomic aggregates.
Central de Información de las Administraciones Públicas
Contains all relevant information on the economic & financial activity of
the public administrations (Budgetary execution, Budgets and planning,
civil servants, etc.).
Bank Spain
Compiles and provides monetary, banking and financial statistics,
interest rates, balance of payments. Also contains useful tools for
statistical analysis of time series data, among other features.
AIREF
The purpose of the Independent Authority for Fiscal Responsibility
(AIReF, as it is known in Spanish) is to oversee the sustainability of
public finances as a means for ensuring economic growth and the
wellbeing of the Spanish society in the medium and long-term.
42Thank you for your attention
Emma Navarro Aguilera – General Secretary of the Treasury and Financial Policy
SecretariaGeneral@tesoro.mineco.es
Carlos San Basilio Pardo – Director General of the Treasury
directortesoro@tesoro.mineco.es
Pablo de Ramón-Laca – Head of Funding and Debt Management
SecretariaDeuda@tesoro.mineco.es
Leandro Navarro
lnavarro@tesoro.mineco.es
Rosa Moral
rmmoral@tesoro.mineco.es
Mercedes Abascal
mabascal@tesoro.mineco.es
Manuel Blanco
mblanco@tesoro.mineco.es
For more information please contact:
Bernardo de Lizaur
bdelizaur@tesoro.mineco.es Phone: 34 91 209 95 29/30/31/32 - Fax:34 91 209 97 10
Reuters: TESORO
Bloomberg: TESO
Internet: www.tesoro.es
For more information on recent developments:
www.thespanisheconomy.com
43You can also read