COOBER PEDY STATE OF THE TOWN REPORT - District Council of ...
←
→
Page content transcription
If your browser does not render page correctly, please read the page content below
COOBER PEDY
                   STATE OF THE TOWN REPORT

AUGUST 2020
Version: Draft 7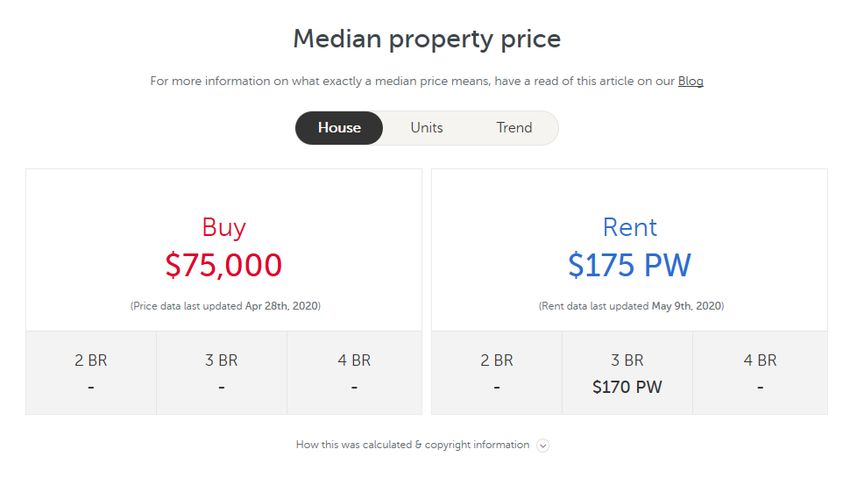
CONTENTS
FOREWORD .................................................................................................................................................................................................................................................. 1
SUMMARY OF INDICATORS .......................................................................................................................................................................................................................... 2
ECONOMIC INDICATORS ........................................................................................................................................................................................................................................... 3
ENVIRONMENTAL INDICATORS ................................................................................................................................................................................................................................ 4
SOCIAL INDICATORS .................................................................................................................................................................................................................................................. 5
STATE OF THE TOWN INDICATORS ................................................................................................................................................................................................................ 6
ECONOMIC INDICATORS ........................................................................................................................................................................................................................................... 7
  SEIFA INDEX .......................................................................................................................................................................................................................................................... 7
  GROSS REGIONAL PRODUCT (GRP) PER CAPITA AND PER WORKER .................................................................................................................................................................... 9
  POPULATION ...................................................................................................................................................................................................................................................... 10
        Population Trend ........................................................................................................................................................................................................................................................................ 10
        Population by Gender and Ethnicity ........................................................................................................................................................................................................................................... 12
        Population by Age Range ............................................................................................................................................................................................................................................................ 13
    LABOUR FORCE ................................................................................................................................................................................................................................................... 14
    EMPLOYMENT .................................................................................................................................................................................................................................................... 15
    UNEMPLOYMENT ............................................................................................................................................................................................................................................... 16
    PROPERTY ........................................................................................................................................................................................................................................................... 18
    MEDIAN WEEKLY INCOME.................................................................................................................................................................................................................................. 21
    EDUCATION ........................................................................................................................................................................................................................................................ 22
        School Staff ................................................................................................................................................................................................................................................................................. 22
        Enrolments ................................................................................................................................................................................................................................................................................. 23
        Attendance (2019) ...................................................................................................................................................................................................................................................................... 24
        VET in Schools (by Year) ............................................................................................................................................................................................................................................................. 27
        Year 12 Results ........................................................................................................................................................................................................................................................................... 28
        Proportion of children who received early childhood development .......................................................................................................................................................................................... 29
ENVIRONMENTAL INDICATORS .............................................................................................................................................................................................................................. 30
  WATER SECURITY ............................................................................................................................................................................................................................................... 30
        Potable water use per capita ...................................................................................................................................................................................................................................................... 30
        Proportion of water re-use ......................................................................................................................................................................................................................................................... 30
    WASTE MANAGEMENT ...................................................................................................................................................................................................................................... 31
        Residential waste per capita....................................................................................................................................................................................................................................................... 31
        Proportion of residential waste re-use ....................................................................................................................................................................................................................................... 31
    RENEWABLE ENERGY ......................................................................................................................................................................................................................................... 32
        Proportion of electricity generated from solar and wind generation ........................................................................................................................................................................................ 32
SOCIAL INDICATORS ................................................................................................................................................................................................................................................ 35
SOCIAL VITALITY ................................................................................................................................................................................................................................................. 35
Proportion of people who regularly volunteer ........................................................................................................................................................................................................................... 35
HOUSING ............................................................................................................................................................................................................................................................ 36
NUMBER OF UNLAWFUL OFFENCES................................................................................................................................................................................................................... 38
Unlawful Offences – Coober Pedy (2010-2019) by Offence ....................................................................................................................................................................................................... 39
NUMBER OF DOMESTIC VIOLENCE OFFENCES ................................................................................................................................................................................................... 41
HEALTH ............................................................................................................................................................................................................................................................... 42
Local Health Services .................................................................................................................................................................................................................................................................. 42
Admissions to Hospital ............................................................................................................................................................................................................................................................... 44
Chronic Conditions ..................................................................................................................................................................................................................................................................... 45
Health Risk Factors ..................................................................................................................................................................................................................................................................... 46
Access to Health Services ........................................................................................................................................................................................................................................................... 47
REFERENCES................................................................................................................................................................................................................................................ 48FOREWORD On Monday 15 April 2019 a Town Meeting was held at which the Administrator of the District Council of Coober Pedy, Tim Jackson, proposed that a community plan be developed to identify ways for the town to move forward. At this meeting three areas requiring action, and key to the future of Coober Pedy, were identified. These were economic development, the environment and the social aspects of the community. On the basis of these three areas of community action, three attendant working groups were established. An Interim Steering Group was then formed to oversee the establishment and outcomes of the three working groups, and to enable cross-pollenisation of the ideas generated through each group and to maximise opportunities for the groups to work together on issues of joint concern. A “Meet & Greet” event was held on Wednesday 26 June 2019 at which “leads” were nominated for each working group. This was followed by a workshop on 14 July 2019 to identify what the working groups would be doing. Following the workshop, the “Interim” Steering Group was replaced with a “Permanent” Steering Committee consisting of the Chair, the Lead of each working group and one other member of each working group and the District Council of Coober Pedy’s Chief Executive Officer. The Working Groups then identified a Utopian Vision, a 10-Year Vision and a series of 10-Year Projects for each group. This document details the measurements or “indicators” that will be used to track the progress the various projects are having on the town. It provides benchmark data detailing the current “state of the town” from which all outcomes will be measured. This document links to the Coober Pedy Town Plan for 2030 (CP30) document which gives full details of all the projects identified by the three working groups. Coober Pedy State of the Town Report (August 2020) 1|Page
SUMMARY OF INDICATORS
The following tables summarise the main areas that Coober Pedy need assistance with.

Key:

RED             Poorly performing area
ORANGE          Medium performing area
GREEN           High performing area

Coober Pedy State of the Town Report (August 2020)                                                      2|Page
ECONOMIC INDICATORS

 Indicator                               Coober Pedy                              South Australia                      Australia
 SEIFA Index                                  879 (Coober Pedy =   4th
                                                                    lowest in                            979 (2016)                          1000 (2016)
                                                      South Australia) (2016)
 Gross Regional Product (GRP) per                              $0.057 (2019)                          $0.065 (2019)
 Capita
 Gross Regional Product (GRP) per                               $0.148 (2019)                         $0.147 (2019)
 Worker
 Population                                                        1,837 (2017)                   1,723,671 (2017)                     24.6 million (2017)
 Population Trend                                                   Decreasing                            Increasing                            Increasing
 Population by Gender and Ethnicity                         Male 54.6% (2016)                    Male 49.3% (2016)                     Male 49.3% (2016
                                                         Female 45.4% (2016)                   Female 50.7% (2016)                  Female 50.7% (2016)
                                                       Aboriginal 17.1% (2016)                 Aboriginal 2% (2016)                Aboriginal 2.8% (2016)
 Labour Force                                                        Increasing
 Employment                                              37% employed (2017)
 Unemployment (average)                                                  11.4%                                 6.3%                                 5.5%
 Rateable Value                                                      Increasing
 Median Property Price                                                 $71,417                           $641,813
 Demand Market                                                     Low demand            Average demand (Adelaide)
 Median Weekly Income (Personal)                                           $497                              $600                                   $662
 School Staff                                                       Decreasing
 Enrolments                                                         Decreasing
 Attendance                                     Decreasing (Coober Pedy = 3rd
                                                     lowest in South Australia)
 Proportion of students attending                                   Decreasing
 90% or more of the time
 VET in Schools – Enrolments                                        Increasing
 VET in Schools – Qualifications                                   Decreasing
 Completed
 Year 12 Results – Senior secondary                                Decreasing
 certificate awarded
 Year 12 Results – Completed senior                                Decreasing
 secondary school
 Proportion of children who received                              3.7% (2016)                           4.2% (2016)                          4.8% (2016)
 early childhood development

Coober Pedy State of the Town Report (August 2020)                                                                                              3|Page
ENVIRONMENTAL INDICATORS
Indicator Coober Pedy South Australia Australia
Potable water use per capita 9805 litres per household (2019) 190.49 litres per person 100,000 litres of freshwater per
person each year
Proportion of water re-use 100% (2019) One in every 3 litres (2019) 20% (2012)
Residential waste per capita 799 tonnes from domestic pickup 3.3 million tonnes per capita
(2019)
Proportion of residential waste re- 0% (2019) 83.6%
use
Proportion of electricity generated 73% (2019) 51% (2018) 19% (2018)
from solar and wind
Coober Pedy State of the Town Report (August 2020) 4|PageSOCIAL INDICATORS
Indicator Coober Pedy South Australia Australia
Proportion of people who regularly 53.2% (2016) 71.0% (2016) 69.0% (2016)
volunteer
Breakdown of housing market Owned: 51.9%
Rented: 41.1%
Unknown: 7%
Breakdown of rental market Private Landlords: 86.7%
Housing authority: 10.2%
Charity: 3.1%
Median property prices Buy: $75,000 Buy: $634,000
Rent: $175 per week Rent: $450 per week
Unlawful offences Decreasing
Number of domestic violence Highest rate in South Australia
offences
Local health services
Admissions to hospital
Chronic conditions
Health risk factors
Access to health services
Coober Pedy State of the Town Report (August 2020) 5|PageSTATE OF THE TOWN INDICATORS Coober Pedy State of the Town Report (August 2020) 6|Page
ECONOMIC INDICATORS
SEIFA INDEX

 About this indicator                                                                Why is this indicator important?
 Socio-Economic Indexes for Areas (SEIFA) is a product developed by the              A score of 1000 or above represents an average level of socio-economic
 Australian Bureau of Statistics (ABS) that ranks areas in Australia according to    advantage and disadvantage. Scores below 1000 represent high levels of
 relative socio-economic advantage and disadvantage. The indexes are based on        disadvantage and scores above 1000 represent low levels of disadvantage.
 information from the five-yearly Census. SEIFA 2016 is the latest version of this   Coober Pedy’s score of 879 is the fourth lowest in South Australia and
 product and consists of four indexes: The Index of Relative Socio-economic          shows the town is experiencing a lower than average level of socio-
 Disadvantage (IRSD); The Index of Relative Socio-economic Advantage and             economic disadvantage.
 Disadvantage (IRSAD); The Index of Education and Occupation (IEO); The Index
 of Economic Resources (IER). Each index is a summary of a different subset of
 Census variables and focuses on a different aspect of socio-economic advantage
 and disadvantage.

Figure 1: Index of Relative Socio-economic Disadvantage (Local Government Areas in South Australia, 2016)

              2016 Local Government Area                2016 Index                                 2016 Local Government Area              2016 Index
              Burnside                                        1,081                                Cleve                                         1,007
              Adelaide Hills                                  1,080                                Wudinna                                       1,004
              Walkerville                                     1,072                                West Torrens                                  1,002
              Mitcham                                         1,068                                Clare and Gilbert Valleys                     1,001
              Unley                                           1,066                                Marion                                        1,001
              Prospect                                        1,046                                Streaky Bay                                     999
              Holdfast Bay                                    1,043                                Orroroo/Carrieton                               991
              Roxby Downs                                     1,042                                Southern Mallee                                 990
              Mount Barker                                    1,033                                Tatiara                                         989
              Tea Tree Gully                                  1,031                                Onkaparinga                                     987
              Norwood Payneham St Peters                      1,029                                Alexandrina                                     986
              Kimba                                           1,027                                Charles Sturt                                   985
              Light                                           1,025                                Northern Areas                                  981
              Lower Eyre Peninsula                            1,019                                Tumby Bay                                       980
              Grant                                           1,018                                Elliston                                        980
              City of Adelaide                                1,014                                Mallala                                         979
              Adelaide                                        1,014                                Mount Remarkable                                978
              Campbelltown                                    1,012                                Naracoorte and Lucindale                        974
              Barossa                                         1,012                                Yankalilla                                      974
              Robe                                            1,011                                Kingston                                        973

Coober Pedy State of the Town Report (August 2020)                                                                                                       7|Page
2016 Local Government Area 2016 Index 2016 Local Government Area 2016 Index
Kangaroo Island 970 Mount Gambier 925
Franklin Harbour 969 Mid Murray 923
Victor Harbor 958 Copper Coast 919
Ceduna 957 Renmark Paringa 917
Gawler 955 Salisbury 917
Karoonda East Murray 953 Berri and Barmera 910
Yorke Peninsula 952 Unincorporated SA 900
Port Lincoln 952 Murray Bridge 894
Loxton Waikerie 951 Port Augusta 889
Goyder 946 Port Pirie City and Dists 886
Barunga West 945 Whyalla 882
Wattle Range 940 Coober Pedy 879
Port Adelaide Enfield 936 Playford 855
Flinders Ranges 935 Peterborough 792
Wakefield 933 Anangu Pitjantjatjara 589
The Coorong 933
Source: (Australian Bureau of Statistics (ABS), 2016)
Figure2: Index of Relative Socio-economic Disadvantage (2016)
Coober Pedy 879
South Australia 979
Australia 1000
Source: (Australian Bureau of Statistics (ABS), 2016)
Coober Pedy State of the Town Report (August 2020) 8|PageGROSS REGIONAL PRODUCT (GRP) PER CAPITA AND PER WORKER
About this indicator Why is this indicator important?
The Gross Regional Product for Coober Pedy (DC) was calculated using the Coober Pedy’s GRP per capita has remained constant between 2018 and 2019
Income Method. at $0.056/$0.057.
GRP can be measured by adding up all incomes:
• earned by individuals (wages and salaries)
• earned by firms (gross operating surplus or profits)
• collected by governments (taxes on products or services)
All values adjusted for 2018 and 2019 prices.
Figure 3: Gross Regional/State Product Per Capita and Per Worker – Coober Pedy and South Australia (2018 and 2019)
2018 2019
Coober Pedy South Australia Coober Pedy South Australia
GRP Income Method ($M) ($M) ($M) ($M)
Wages Salaries $44.844 $51,707.749 $45.558 $52,531.412
Gross Operating Surplus $42.329 $43,182.508 $43.003 $43,870.371
Net Taxes - Products Services $8.946 $8,717.440 $9.089 $8,856.302
Net Taxes - Production $3.069 $3,781.303 $3.118 $3,841.537
Gross Regional / State Product $99.188 $107,389.000 $100.768 $109,099.621
Population 1,766 1,673,794 1,766 1,673,794
Per Capita GRP / GSP $0.056 $0.064 $0.057 $0.065
Per Worker GRP / GSP $0.146 $0.145 $0.148 $0.147
Source: (Australian Bureau of Statistics, 2020)(All figures, data and commentary presented in this report are based on data sourced from the Australia Bureau of Statistics
(ABS), most of which relates to the 2016, 2011, 2006 and 2001 Censuses.)
Coober Pedy State of the Town Report (August 2020) 9|PagePOPULATION
Population Trend
About this indicator Why is this indicator important?
Between 1995 and 2011 Coober Pedy saw a steady decline in its population. In order for Council to collect sufficient rates to remain financially viable,
Since 2012 there has been a modest rise but this is still 31% less than its peak population levels must be maintained at current levels. For the town to maintain
value of 2669 in 1995. community services (like schools and healthcare) and to prosper, population
levels must increase.
This is similar to Outback South Australia’s population trends but does not reflect
South Australia’s gradual and continuing increase.
Figure 4: Population Trend (Coober Pedy)
Population Trend - Coober Pedy
3000 2520 2669 2650 2529
2313 2414
2500 2220
2040 1928 1799 1760 1811 1822 1837
Population
2000
1500
1000
500
0
1991 1993 1995 1997 1999 2001 2003 2005 2007 2009 2011 2013 2015 2017
Year
Source: (Australian Bureau of Statistics, n.d.)
Coober Pedy State of the Town Report (August 2020) 10 | P a g eFigure 5: Population Trend (Outback South Australia)
Population Trend - Outback SA
91001
92000
89735
90000
87757
86850 86911
Population
88000 86143 86118 86026 86499
85376 84892 85132
86000 84481 83934
84000
82000
80000
1991 1993 1995 1997 1999 2001 2003 2005 2007 2009 2011 2013 2015 2017
Year
Source: (Australian Bureau of Statistics, n.d.)
Figure 6: Population Trend (South Australia)
Population Trend - South Australia
2000000 1639614 1671488 1700668 1723671
1520399 1538804 1570619 1608902
1446299 1458632 1465340 1475658 1490934 1503461
1500000
Population
1000000
500000
0
1991 1993 1995 1997 1999 2001 2003 2005 2007 2009 2011 2013 2015 2017
Year
Source: (Australian Bureau of Statistics, n.d.)
Coober Pedy State of the Town Report (August 2020) 11 | P a g ePopulation by Gender and Ethnicity
About this indicator Why is this indicator important?
Coober Pedy’s population is made up of slightly more men (55%) than women Aboriginals make up a significant proportion of the resident population.
(45%). This is on a par with South Australia and Australia. However, of these Transient visitors from the APY Lands can increase population numbers and put
17% are Aboriginal, compared to 2% for South Australia. pressure on local services. Therefore, consideration needs to be given to these
factors when planning for future housing and service provision.
Figure 7: Population by Gender and Ethnicity – Coober Pedy, South Australia, Australia (2016)
Population by Gender and Ethnicity - Coober Pedy, South Australia, Australia (2016)
60 54.6
49.3 50.7 49.3 50.7
50 45.4
40
Percent
30
20 17.1
10 2.8
2
0
Coober Pedy South Australia Australia
Male Female Aboriginal and/or Torres Strait Islander people
Source: (Australian Bureau of Statistics, 2016)
Coober Pedy State of the Town Report (August 2020) 12 | P a g ePopulation by Age Range
About this indicator Why is this indicator important?
Coober Pedy’s main population age groups are: Lower numbers of children mean there will be a limited local workforce in the
Working age (15-64 years): 59.7% - this is similar to the state (64.2%) and future and put the future of the Coober Pedy Area School at risk. A high elderly
national (65.6%) figures. population will put pressure on healthcare services. These factors need to be
Over 65 years: 22.2% - this is somewhat higher than state (18.3%) and considered when planning future service provisions.
national (15.7%) figures.
Children between 0 and 14 years: 15.5% - this is lower than state (17.5%)
and national (18.7%) figures.
Figure 8: Population by Age Range – Coober Pedy, South Australia, Australia (2016)
Population by Age Range - Coober Pedy, South Australia, Australia (2016)
70
60
50
Percent
40
30
20
10
0
0-4 years 5-9 years 10-14 years 15-64 years 65-69 years 70-74 years 75-79 years 80-84 years 85 years and over
Coober Pedy South Australia Australia
Source: (Australian Bureau of Statistics, 2016)
Coober Pedy State of the Town Report (August 2020) 13 | P a g eLABOUR FORCE
About this indicator Why is this indicator important?
Out of a total population of 1837 in 2017, only 842 (45.7%) were of working age. With only 40% of the population contributing to the work force and earning
Out of this potential labour force, 104 were recorded as unemployed in 2017 (see incomes, this means (a) there is a limited work force available to employers,
Unemployment), leaving a total work force of 738 (40% of the population). and (b) there is low financial vitality in the town.
Figure 9: Labour Force – Coober Pedy (2010 – 2019)
Labour Force - Coober Pedy (2010 - 2019)
920
900 895 892
891
884 884
Number of People
880 881 881 882
866 862 866 868
860 857 861 860
850 849 852 851 848
840 841 837 839 841 840 842 839
827 830 836 832 829
820 816 816 819
809 807
800
780
760
DEC-10
DEC-11
DEC-12
DEC-13
DEC-14
DEC-15
DEC-16
DEC-17
DEC-18
DEC-19
SEP-11
SEP-12
SEP-13
SEP-14
SEP-15
SEP-16
SEP-17
SEP-18
SEP-19
MAR-11
MAR-12
MAR-13
MAR-14
MAR-15
MAR-16
MAR-17
MAR-18
MAR-19
JUN-11
JUN-12
JUN-13
JUN-14
JUN-15
JUN-16
JUN-17
JUN-18
JUN-19
Quarter/Year
Source: (Department of Education, Skills and Employment, 2019)
Coober Pedy State of the Town Report (August 2020) 14 | P a g eEMPLOYMENT
About this indicator Why is this indicator important?
Using Coober Pedy’s total population of 1837 in 2017, only 681 (37%) of Service Sector, Tourism and Mining jobs require skilled employees with relevant
residents were employed in 2018. qualifications and experience. Often these people cannot be sourced locally
Its main industries are: (see Proportion of students who successfully completed year 12) and have to
1. Service Sector (Health Care & Social Assistance, Public Administration & be sourced from out of town. In order to retain such employees, Coober Pedy
Safety, Education & Training and Administrative and Support Services) = 312 needs to be able to offer a comparable standard of living to that which people
jobs (45%); would expect in major towns and cities. Alternatively, it needs to ensure
2. Tourism (Accommodation & Food Services plus Retail Trade) = 201 jobs relevant training is provided locally.
(29.5%); There is also an opportunity to develop a new industry based around
3. Mining = 63 jobs (9.25%). sustainable practices.
Figure 10: Number of Jobs by Industry Sector – Coober Pedy (2018)
Number of Jobs by Industry Sector - Coober Pedy (2018)
140 131
118
120
Number of Jobs
100 90
83
73
80 63
53
60
40
18 14
20 10 10 7 4 4 3 0 0 0 0
0
Industry Sector
Source: (Regional Development Australia Far North, 2018)
Coober Pedy State of the Town Report (August 2020) 15 | P a g eUNEMPLOYMENT
About this indicator Why is this indicator important?
The average number of unemployed people in Coober Pedy between 2010 and As can be seen by the labour force figures, Coober Pedy has a limited labour
2019 is 97, representing an average rate of 11.4%. This is considerably higher force. Getting local people out of unemployment and into the work force would
than South Australia’s average rate of 6.3% and Australia’s average rate of 5.5% increase the number of local residents available for work. However, ensuring
for the same period. these people have the appropriate skills and qualifications is another issue that
needs to be addressed.
Figure 11: Unemployment – Coober Pedy (2010 – 2019)
Unemployment - Coober Pedy (2010 - 2019)
131
Number of Unemployed
120 117 118
114
102 100 107 108
102 101
108 106 106 104 109 109
95 99 95 100
89 94 94 92 89
83 84 88 84
82 82 77 81
73 70 66
SEP-11
SEP-12
SEP-13
SEP-14
SEP-15
SEP-16
SEP-17
SEP-18
SEP-19
MAR-11
JUN-11
MAR-12
JUN-12
MAR-13
JUN-13
MAR-14
JUN-14
MAR-15
JUN-15
MAR-16
JUN-16
MAR-17
JUN-17
MAR-18
JUN-18
MAR-19
JUN-19
DEC-10
DEC-11
DEC-12
DEC-13
DEC-14
DEC-15
DEC-16
DEC-17
DEC-18
DEC-19
Quarter/Year
Source: (Department of Education, Skills and Employment, 2019)
Coober Pedy State of the Town Report (August 2020) 16 | P a g eFigure 12: Unemployment Rates – Coober Pedy, South Australia and Australia (2010 – 2019)
Unemployment Rates - Coober Pedy vs South Australia vs Australia (2010 - 2019)
18.0
16.0
14.0
Percentage
12.0
10.0
8.0
6.0
4.0
2.0
0.0
Jun-11
Jun-12
Jun-13
Jun-14
Jun-15
Jun-16
Jun-17
Jun-18
Jun-19
Dec-10
Mar-11
Sep-11
Dec-11
Mar-12
Sep-12
Dec-12
Mar-13
Sep-13
Dec-13
Mar-14
Sep-14
Dec-14
Mar-15
Sep-15
Dec-15
Mar-16
Sep-16
Dec-16
Mar-17
Sep-17
Dec-17
Mar-18
Sep-18
Dec-18
Mar-19
Sep-19
Dec-19
Quarter/Year
Coober Pedy South Australia Australia
Source: (Department of Education, Skills and Employment, 2019)
Coober Pedy State of the Town Report (August 2020) 17 | P a g ePROPERTY
About these indicators Why are these indicators important?
The rateable value represents the total rates raised on all properties in Coober If the rateable value continues to fall, it will have an impact on Council revenue
Pedy. Although this is an upward trend, this represents a rise in rates rather than and may also indicate a fall in demand for home ownership. Although low
a rise in the number of properties. This shows there is little construction (either property prices may attract buyers, the Low Demand Market may make it
residential or commercial) reflecting the declining population rate and demand for difficult to sell properties at a profit, thereby discouraging sales and investment
properties. This may also indicate an increase in demand for rental properties. in the town.
Figure 13: Rateable Value – Coober Pedy (2009 – 2019)
Rateable Value - Coober Pedy (2009 - 2019)
$1,481,052 $1,518,163
$1,600,000 $1,404,771
$1,333,966 $1,348,818
$1,400,000 $1,215,783
$1,269,302
$1,161,277
$1,200,000 $1,017,068 $1,054,090
$1,000,000
Amount
$800,000
$600,000
$400,000
$200,000
$0
2009 2010 2011 2012 2013 2014 2015 2016 2017 2018
Year
Source: (District Council of Coober Pedy, 2020)
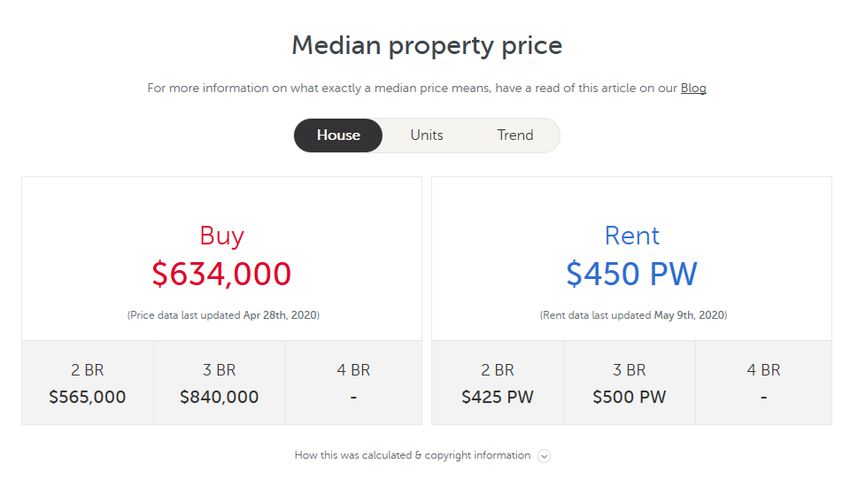
Coober Pedy State of the Town Report (August 2020) 18 | P a g eFigure 14: Median Property Price – Coober Pedy vs Adelaide
Median Property Price - Coober Pedy (2019 - 2020)
120000
97500 95000 95000 95000
100000
80000
80000
65000
55000 55000 55000 55000 54500 55000
60000
40000
20000
0
Sep-19 Oct-19 Nov-19 Dec-19 Jan-20 Feb-20 Mar-20 Apr-20 May-20 Jun-20 Jul-20 Aug-20
Average Price (Coober Pedy): $71,417
Median Property Price - Adelaide (2019 - 2020)
720000 700000 700000
700000 680000
680000
655000
660000
630750 635000
640000
615000 615000 619000 616500 619000 616500
620000
600000
580000
560000
540000
Sep-19 Oct-19 Nov-19 Dec-19 Jan-20 Feb-20 Mar-20 Apr-20 May-20 Jun-20 Jul-20 Aug-20
Average Price (Adelaide): $ 641,813
Source: (realestate.com, 2020)
Coober Pedy State of the Town Report (August 2020) 19 | P a g eFigure 15: Supply and Demand in Coober Pedy vs Adelaide Source: (realestate.com, 2020) Coober Pedy State of the Town Report (August 2020) 20 | P a g e
MEDIAN WEEKLY INCOME

  About this indicator                                                          Why is this indicator important?
  Median weekly incomes in Coober Pedy are 17% lower than South Australia and   Lower pay rates are a disincentive to new people coming to live in Coober
  25% lower than Australia in general.                                          Pedy.

Figure 16
 Median weekly incomes                            Coober Pedy    %              South Australia     %                    Australia             %
 People aged 15 years and over
 Personal                                         497            --             600                 --                   662                   --
 Family                                           1,329          --             1,510               --                   1,734                 --
 Household                                        844            --             1,206               --                   1,438                 --
Source: (Australian Bureau of Statistics, 2016)

Coober Pedy State of the Town Report (August 2020)                                                                                                  21 | P a g e
EDUCATION

 About this indicator                                                                               Why is this indicator important?
 Enrolments at Coober Pedy Area School are falling as are staff numbers. The                        Very few students are participating in local education and those that are not
 proportion of male to female enrolments is about equal and there has been a rise                   achieving qualifications. Consequently, local children have little to offer local
 in the number of Aboriginal students. However, Coober Pedy has the third worst                     employers who are having to look out of town for suitable staff.
 attendance levels of combined primary/secondary schools in the State with
 Aboriginal students attending least.
 Although enrolments in the VET in Schools Program have increased, the number
 of students gaining a qualification has fallen.
 Likewise, the number of students completing Year 12 and/or gaining a Senior
 Secondary Certificate is falling.
 Pre-school enrolments are very low at 21 children.

School Staff

        Figure 17: Coober Pedy Area School – School Staff by Year

                                                         Coober Pedy Area School - School Staff by Year
          40
                   35 34.6
          35
                                              29 28.2                    28                                                                                           28
          30                                                                  26.2                    27 26.2
                                                                                                                                25 24.1 25
          25                 22                                                                                                                             23 22          22.4
                                                        20                           20                                                      19.4
          20                                                                                                    18
                                  16.5                       15.7                         15.3                       14.6
          15
          10
           5
           0
                         2014                       2015                       2016                        2017                       2018                        2019

                           Teaching Staff           FTE Teaching Staff               Non-teaching Staff           FTE Non-teaching Staff            Linear (Teaching Staff)

        Source: (Australian Curriculum, Assessment and Reporting Authority, 2019)

Coober Pedy State of the Town Report (August 2020)                                                                                                                                22 | P a g e
Enrolments
Figure 18: Enrolments, Coober Pedy Area School
Coober Pedy Area School - Enrolments by Year Coober Pedy Area School - Enrolments by Year
300 273
248
(Gender)
242 230 237
250 215 200
Enrolments
200
150
Enrolments
150
100
100
50 50
0 0
2014 2015 2016 2017 2018 2019 2014 2015 2016 2017 2018 2019
Year Year
Total Linear (Total) Boys Girls
Coober Pedy Area School - Enrolments by Year Coober Pedy Area School - Enrolments by Year
(Indigenous) (Language background other than English)
60% 53% 65%
45% 45% 48% 47% 60% 60% 60%
Enrolments
50% 42% 60% 57% 58%
Enrolments
40% 53%
55%
30%
50%
20%
10% 45%
0% 2014 2015 2016 2017 2018 2019
2014 2015 2016 2017 2018 2019 Year
Year
Language background other than English
Indigenous Linear (Indigenous) Linear (Language background other than English)
Source: (Australian Curriculum, Assessment and Reporting Authority, 2019)
Coober Pedy State of the Town Report (August 2020) 23 | P a g eAttendance (2019)
Figure 19: Attendance, Coober Pedy Area School 2019
Coober Pedy Area School - Attendance Coober Pedy Area School - Proportion of
100% students attending 90% or more of the time
80% 60% 52%
48% 48%
40%
60% 40% 34%
30% 29%
25% 22%
40%
20% 12% 9%
4% 5%
20%
0%
0% 2014 2015 2016 2017 2018 2019
2014 2015 2016 2017 2018 2019
All students Indigenous students
All students Indigenous students Non-indigenous students
Non-indigenous students Linear (All students)
Source: (Australian Curriculum, Assessment and Reporting Authority, 2019)
Figure 20: Attendance Rate of all Primary/Secondary Combined Schools in South Australia (Semester 1 – 2019)
Attendance Rate of all Primary/Secondary Combined Schools in South Australia (Semester 1 – 2019)
School_Number School_Name Type_of_School Suburb Postcode Semester_1_2019
907 Plympton International College Primary/Secondary Combined Plympton 5038 95.02097
735 Cowell Area School Primary/Secondary Combined Cowell 5602 94.90446
757 Keith Area School Primary/Secondary Combined Keith 5267 93.06651
781 Minlaton District School Primary/Secondary Combined Minlaton 5575 93.05823
756 Karoonda Area School Primary/Secondary Combined Karoonda 5307 93.04892
754 Cummins Area School Primary/Secondary Combined Cummins 5631 92.58259
771 Booleroo Centre District School Primary/Secondary Combined Booleroo Centre 5482 92.45435
793 Quorn Area School Primary/Secondary Combined Quorn 5433 92.34642
729 Coomandook Area School Primary/Secondary Combined Coomandook 5261 92.2626
777 Jamestown Community School Primary/Secondary Combined Jamestown 5491 92.23439
765 Wudinna Area School Primary/Secondary Combined Wudinna 5652 92.07906
736 Kimba Area School Primary/Secondary Combined Kimba 5641 92.06514
759 Lameroo Regional Community School Primary/Secondary Combined Lameroo 5302 92.02399
740 Orroroo Area School Primary/Secondary Combined Orroroo 5431 91.88697
741 Port Broughton Area School Primary/Secondary Combined Port Broughton 5522 91.8576
Coober Pedy State of the Town Report (August 2020) 24 | P a g eAttendance Rate of all Primary/Secondary Combined Schools in South Australia (Semester 1 – 2019)
School_Number School_Name Type_of_School Suburb Postcode Semester_1_2019
749 Lucindale Area School Primary/Secondary Combined Lucindale 5272 91.62251
128 Elliston Area School Primary/Secondary Combined Elliston 5670 91.18337
1123 Karcultaby Area School Primary/Secondary Combined Karcultaby 5654 91.02388
423 Swan Reach Area School Primary/Secondary Combined Swan Reach 5354 90.85561
1430 The Heights School Primary/Secondary Combined Modbury Heights 5092 90.69017
1028 Charles Campbell College Primary/Secondary Combined Paradise 5075 90.67401
957 Kangaroo Inn Area School Primary/Secondary Combined Kangaroo Inn 5280 90.65842
737 Kingston Community School Primary/Secondary Combined Kingston SE 5275 90.47271
753 Cleve Area School Primary/Secondary Combined Cleve 5640 90.44125
438 Tintinara Area School Primary/Secondary Combined Tintinara 5266 90.30367
732 Ardrossan Area School Primary/Secondary Combined Ardrossan 5571 90.26378
1882 Kangaroo Island Community Education Primary/Secondary Combined Kingscote 5223 90.24938
1907 Reynella East College Primary/Secondary Combined Reynella East 5161 90.05998
1121 Miltaburra Area School Primary/Secondary Combined Wirrulla 5661 89.98034
766 Yankalilla Area School Primary/Secondary Combined Yankalilla 5203 89.92214
1432 Burra Community School Primary/Secondary Combined Burra 5417 89.67136
640 Hallett Cove School Primary/Secondary Combined Hallett Cove 5158 89.59874
755 Eudunda Area School Primary/Secondary Combined Eudunda 5374 89.56314
1170 Mannum Community College Primary/Secondary Combined Mannum 5238 89.52404
773 Clare High School Primary/Secondary Combined Clare 5453 89.48534
762 Oakbank Area School Primary/Secondary Combined Oakbank 5243 89.28201
743 Tumby Bay Area School Primary/Secondary Combined Tumby Bay 5605 89.24483
289 Mount Compass Area School Primary/Secondary Combined Mount Compass 5210 89.14008
778 Kadina Memorial School Primary/Secondary Combined Kadina 5554 89.03027
751 Allendale East Area School Primary/Secondary Combined Allendale East 5291 89.02077
1884 Eastern Fleurieu R-12 School Primary/Secondary Combined Strathalbyn 5255 88.62906
1817 Roxby Downs Area School Primary/Secondary Combined Roxby Downs 5725 88.2809
745 Streaky Bay Area School Primary/Secondary Combined Streaky Bay 5680 88.27337
1099 Paralowie School Primary/Secondary Combined Paralowie 5108 87.19052
908 Ocean View P-12 College Primary/Secondary Combined Taperoo 5017 87.09621
767 Yorketown Area School Primary/Secondary Combined Yorketown 5576 86.81354
761 Central Yorke School Primary/Secondary Combined Maitland 5573 86.74198
230 Lock Area School Primary/Secondary Combined Lock 5633 86.72541
175 Hawker Area School Primary/Secondary Combined Hawker 5434 86.58749
750 Meningie Area School Primary/Secondary Combined Meningie 5264 85.87077
1488 Moonta Area School Primary/Secondary Combined Moonta 5558 85.58695
906 Avenues College Primary/Secondary Combined Windsor Gardens 5087 85.47152
Coober Pedy State of the Town Report (August 2020) 25 | P a g eAttendance Rate of all Primary/Secondary Combined Schools in South Australia (Semester 1 – 2019)
School_Number School_Name Type_of_School Suburb Postcode Semester_1_2019
641 Seaford Secondary College Primary/Secondary Combined Seaford 5169 85.27854
734 Ceduna Area School Primary/Secondary Combined Ceduna 5690 84.92932
1900 Mark Oliphant College (B-12) Primary/Secondary Combined Munno Para 5115 84.81686
746 Woomera Area School Primary/Secondary Combined Woomera 5720 84.23567
774 Gawler and District College B-12 Primary/Secondary Combined Evanston 5116 84.18323
748 Leigh Creek Area School Primary/Secondary Combined Leigh Creek 5731 77.89848
920 Coober Pedy Area School Primary/Secondary Combined Coober Pedy 5723 67.15769
1418 Bowden Brompton Community School Primary/Secondary Combined Brompton 5007 53.08607
1794 Mintabie Area School Primary/Secondary Combined Mintabie 5724
Source: (Data SA, 2019)
Coober Pedy State of the Town Report (August 2020) 26 | P a g eVET in Schools (by Year)
Figure 21: VET Enrolments and Qualifications Completed in Coober Pedy Area School
2014 2015 2016 2017 2018 2019
Enrolments Qualifications Enrolments Qualifications Enrolments Qualifications Enrolments Qualifications Enrolments Qualifications Enrolments Qualifications
Completed Completed Completed Completed Completed Completed
Architecture
and Building 1 0 7 6 6 0 6 0 No data available
Society and
Culture 3 1 1 2 0 3 0 No data available
Mixed Field
Programs 1 No data available
Food,
Hospitality and
Personal
Services 4 1 No data available
Engineering
and Related
Technologies 1 0 No data available
Management
and Commerce 1 0 No data available
TOTALS 1 0 4 1 11 8 9 0 10 0
Coober Pedy Area School: VET in Schools (by Coober Pedy Area School: VET in Schools (by
Year) - Enrolments Year) - Qualifications Completed
16 10
Qualifications Completed
14 8
11 8
12 10
Enrolments
10 9
6
8
6 4
4
4
1 2 1
2 0 0 0
0 0
2014 2015 2016 2017 2018 2019 2014 2015 2016 2017 2018 2019
Year Year
Source: (Australian Cirriculum, Assessment and Reporting Authority, 2020)
Coober Pedy State of the Town Report (August 2020) 27 | P a g eYear 12 Results
Figure 22: Percentage of students who successfully completed year 12 in Coober Pedy Area School 2018
Coober Pedy Area School 2014 2015 2016 2017 2018 2019
4 2 4 3 3 No data
Senior secondary certificate awarded available
Completed senior secondary school 10 4 8 5 3 No data
available
Coober Pedy Area School - Senior Coober Pedy Area School - Completed Senior
Secondary Certificte Awarded Secondary School
5 12
4 4 10
Number of Students
Number of Students
4 10
8
3 3 8
3
2 6 5
2 4
4 3
1 2
0 0
2014 2015 2016 2017 2018 2019 2014 2015 2016 2017 2018 2019
Year Year
Source: (Australian Curriculum, Assessment and Reporting Authority, 2020)
Coober Pedy State of the Town Report (August 2020) 28 | P a g eProportion of children who received early childhood development Figure 23: Proportion of children who received early childhood development in Coober Pedy 2016 Education Coober Pedy % South Australia % Australia % Preschool 21 3.7 20,292 4.2 347,621 4.8 Primary - Government 102 18.0 94,526 19.5 1,314,787 18.2 Primary - Catholic 0 0.0 26,196 5.4 380,604 5.3 Primary - other non Government 8 1.4 22,589 4.7 231,490 3.2 Secondary - Government 44 7.8 52,721 10.9 827,505 11.5 Secondary - Catholic 0 0.0 19,484 4.0 338,384 4.7 Secondary - other non Government 0 0.0 21,053 4.3 280,618 3.9 Technical or further education institution 34 6.0 31,394 6.5 424,869 5.9 University or tertiary institution 20 3.5 78,780 16.2 1,160,626 16.1 Other 14 2.5 11,501 2.4 198,383 2.8 Not stated 323 57.1 106,438 21.9 1,707,023 23.7 Source: (Australian Bureau of Statistics, 2016) Coober Pedy State of the Town Report (August 2020) 29 | P a g e
ENVIRONMENTAL INDICATORS
WATER SECURITY

 About this indicator                                                                             Why is this indicator important?
 Coober Pedy lies in the heart of South Australia’s arid lands and is supplied by                 Climate change resulting in increased temperatures for longer periods and
 bore water from the Great Artesian Basin. Water is treated locally at the town’s                 reduced rainfall will have a major impact on Coober Pedy's water supply.
 reverse osmosis plant. 100% of waste water is re-used but during the peak                        Reduction of potable water usage and maximizing storage of waste water for re-
 tourist season there is insufficient capacity to store excess waste water meaning it             use will be critical to Coober Pedy’s long-term survival.
 is lost to the atmosphere.

Potable water use per capita

                               Figure 24: Potable water use per capita
                                 Potable water use per capita                                       Amount
                                 Coober Pedy (2019)                                                 9805 litres per household
                                 South Australia (2020)                                             190.49 litres per person
                                 Australia (2020)                                                   100,000 litres of freshwater per
                                                                                                    person each year
                                 Source: (District Council of Coober Pedy, 2020), (SA Water, 2020), (Australian Government: Your Home, 2020)

Proportion of water re-use

                               Figure 25: Proportion of water re-use
                                 Proportion of water re-use                                         Amount
                                 Coober Pedy (2019)                                                 100% re-use of waste water on Oval
                                 South Australia (2020)                                             One in every three litres
                                 Australia (2012)                                                   20%
                                 Source: (District Council of Coober Pedy, 2020), (SA Water, 2020), (Recycled Water in Australia, 2012)

Coober Pedy State of the Town Report (August 2020)                                                                                                                   30 | P a g e
WASTE MANAGEMENT
About this indicator Why is this indicator important?
The District Council of Coober Pedy provides a weekly domestic waste collection Coober Pedy aims to establish itself as the most sustainable town in Australia.
service which is deposited into the Council’s landfill site. No Council recycling Not having a comprehensive recycling service is at odds with this goal and
service is offered. having a large landfill site over the Great Artesian Basin poses a threat to the
A limited recycling service is offered by a private company but only takes cans purity of the town’s water supply.
and some bottles. Therefore, there is no plastic, paper, or organic waste
recycling service.
Residential waste per capita
Figure 26: Residential waste per capita
Residential waste per capita Amount
Coober Pedy (2019) Approx. 799 tonnes from domestic pickup
South Australia (2017/18) 5.370 million tonnes / 1.72 million = 3.3
million tonnes per capita
Australia 540 kg of household waste per person,
each year
Source: (District Council of Coober Pedy, 2020), (Green Industries SA, 2019), (Clean Up Australia, n.d.)
Proportion of residential waste re-use
Figure 27: Proportion of residential waste re-use
Proportion of residential waste re-use Amount
Coober Pedy (2019) 0% (no recycling service is offered for
domestic waste)
South Australia (2017/18) 83.6%
Australia
Source: (District Council of Coober Pedy, 2020), (Green Industries SA, 2019)
Coober Pedy State of the Town Report (August 2020) 31 | P a g eRENEWABLE ENERGY
About this indicator Why is this indicator important?
Coober Pedy has long-been a leader in renewable energies. It was the first town Coober Pedy is not connected to the national power grid, therefore, needs to
in Australia to install a wind turbine and in 2017 the Coober Pedy Hybrid generate its own energy. Generating this energy from renewable sources
Renewable Power Station (consisting of two wind turbines, a solar farm and creates power security for the town at affordable costs to its customers. The
a diesel generator) was installed. Since then the town has sustained Hybrid Renewable Power Station is the first step in making Coober Pedy the
approximately 70% renewable power generation, avoiding 6000 tonnes CO2 most sustainable town in Australia.
emissions per annum.1
1 https://edlenergy.com/project/coober-pedy/ (Accessed April 2020)
Proportion of electricity generated from solar and wind generation
Figure 28: Proportion of electricity generated from solar and wind generation
(Coober Pedy 2017 – 2019)
Total Usage Diesel Gen Renew Gen
2017 (kWh) (kWh) (kWh) Renew %
JAN
FEB
MAR 1,122,299
APR 864,544
MAY 900,413
JUN 1,017,018
JUL 1,038,829 625,855 719,897 40%
AUG 937,681 354,654 1,000,996 62%
SEP 868,002 242,652 1,259,919 72%
OCT 861,725 174,982 1,406,435 80%
NOV 907,514 273,836 1,168,627 70%
DEC 976,192 406,228 1,016,114 56%
9,494,217 2,078,207 6,571,988 63%
Coober Pedy State of the Town Report (August 2020) 32 | P a g eTotal Usage Diesel Gen Renew Gen
2018 (kWh) (kWh) (kWh) Renew %
JAN 1,149,168 391,014 1,330,721 66%
FEB 996,759 295,009 1,208,045 71%
MAR 971,243 226,527 1,320,698 77%
APR 922,795 268,892 1,128,051 71%
MAY 897,232 195,808 1,162,802 78%
JUN 1,016,905 359,428 981,303 65%
JUL 1,029,528 252,537 1,250,135 76%
AUG 940,057 159,276 1,495,385 83%
SEP 837,252 171,029 1,199,068 80%
OCT 860,639 158,987 1,236,436 82%
NOV 864,066 171,531 1,043,892 80%
DEC 1,022,114 263,603 1,152,521 74%
11,507,758 2,913,641 14,509,057 75%
Source: (District Council of Coober Pedy, 2020)
Coober Pedy State of the Town Report (August 2020) 33 | P a g eTotal Usage Diesel Gen Renew Gen
2019 (kWh) (kWh) (kWh) Renew %
JAN 1,197,923 426,935 1,104,873 64%
FEB 933,211 238,100 982,746 75%
MAR 994,660 289,504 1,000,789 71%
APR 742,458 153,680 1,015,059 67%
MAY 848,839 217,253 938,318 72%
JUN 1,065,764 296,392 1,051,003 70%
JUL 1,046,859 285,726 1,024,371 73%
AUG 986,414 173,011 1,238,126 83%
SEP 835,144 160,492 1,069,449 81%
OCT
NOV
DEC
8,651,272 2,241,093 9,424,734 73%
Source: (District Council of Coober Pedy, 2020) (statistics from when the renewal system was installed in 2017).
Coober Pedy (solar and wind) 73%
South Australia (solar and wind) 51%
Australia (renewables) 19%
Source: (District Council of Coober Pedy, 2020), (Climate Council, 2019)
Coober Pedy State of the Town Report (August 2020) 34 | P a g eSOCIAL INDICATORS
SOCIAL VITALITY
About this indicator Why is this indicator important?
Coober Pedy benefits from a large number of clubs, events and activities. To Without the support of a large number of volunteers, Coober Pedy would not
support these, 279 (18.8%) of the population volunteer. enjoy the level of social opportunities it does. As a remote outback town which
cannot compete with social and cultural activities available in large cities, local
clubs and events play a major role in engaging existing residents, attracting new
ones and providing a sense of community and social vitality.
Proportion of people who regularly volunteer
Figure 29: Proportion of people who regularly volunteer
Unpaid work Coober Pedy % South Australia % Australia %
People aged 15 years and over
Did unpaid domestic work (last week) 787 53.2 982,036 71.0 13,143,914 69.0
Cared for child/children (last two weeks) 230 15.5 380,737 27.5 5,259,400 27.6
Provided unpaid assistance to a person with a disability (last two weeks) 116 7.8 168,496 12.2 2,145,203 11.3
Did voluntary work through an organisation or group (last 12 months) 279 18.8 295,670 21.4 3,620,726 19.0
Source: (Australian Bureau of Statistics, 2016)
Coober Pedy State of the Town Report (August 2020) 35 | P a g eHOUSING
About this indicator Why is this indicator important?
52% of residents own their homes in Coober Pedy. Of the 41% that rent, 87% Property is cheap in Coober Pedy. However, it can often be low standard3.
rent from private landlords, whilst 13.3% are in social housing provided by either Whether buying or renting this is both an incentive and a disincentive. Social
the state housing authority or social support groups. With average private weekly housing stock is also limited.
rentals of $175, and the average price of buying a home $75,000, this makes
Coober Pedy considerably cheaper than living in Adelaide. However, it can take
2 - 4 years to sell a property in Coober Pedy2.
2 3
Source: Linn Andrews Real Estate (Coober Pedy) Shelter SA: Coober Pedy Housing and Homelessness Roundtable Report
Figure 30: Breakdown of Housing Market and Rental Market
Housing Market (Percent) - Coober Pedy (2016) Rental Market (Percent): Coober Pedy (2016)
3.1
7.0 10.2
41.1 51.9
86.7
Dwellings rented from state or territory housing authority
Owned dwellings Rented dwellings Unknown Dwellings rented from a housing co-operative, community or church group
Dwellings rented from private landlords
Source: (Public Health Information Development Unit (PHIDU) Torrens University Australia, 2019)
Coober Pedy State of the Town Report (August 2020) 36 | P a g eMedian Property Prices – Coober Pedy vs Adelaide (May 2020) Figure 31: Median Property Prices – Coober Pedy vs Adelaide (May 2020) Coober Pedy Adelaide Source: (realestate.com, 2020) Source: (realestate.com, 2020) Coober Pedy State of the Town Report (August 2020) 37 | P a g e
NUMBER OF UNLAWFUL OFFENCES

 About this indicator                                                                 Why is this indicator important?
 There has been a downward trend in overall rates of unlawful offences in Coober      Safe and secure homes, businesses and public spaces are essential in
 Pedy from 2010 to 2019. Property-related offences, different forms of assault        attracting and maintaining residents and visitors to Coober Pedy. With an
 and theft form the majority of unlawful offences in the town.                        average crime rate of one to two unlawful offence per day, this does not paint
                                                                                      Coober Pedy as a crime-free location. Identifying the root cause behind the
                                                                                      crimes being committed could help to establish ways in which to reduce their
                                                                                      occurrence.

Figure 32: Unlawful Offences in Coober Pedy 2010-2019

                                                     Unlawful Offences - Coober Pedy (2010 - 2019)
                        700
                                                                      591
                        600                          542
                               483
   Number of Offences

                        500              458                                        453                                 459
                                                                                                      418                                 410
                                                                                                                                                            377
                        400

                        300

                        200

                        100

                         0
                              2010-11   2011-12    2012-13          2013-14        2014-15          2015-16           2016-17           2017-18           2018-19
                                                                                    Year

Source: (Data SA, 2010-2019)

Coober Pedy State of the Town Report (August 2020)                                                                                                          38 | P a g e
You can also read