Summary statistics for schools in Scotland - The Scottish ...
←
→
Page content transcription
If your browser does not render page correctly, please read the page content below
Summary statistics for schools in Scotland
                                   15 December 2020

This annual statistical publication provides information on:

   •   The annual census of pupils and teachers in publicly funded schools in Scotland,
       conducted on 16 September 2020
   •   Early learning and childcare provision in Scotland, collected in the week
       commencing 14 September 2020

The statistics in this bulletin supersede all previously published statistics

Supplementary data tables for early learning and childcare can be found at:
https://www.gov.scot/collections/early-learning-and-childcare-statistics/
Supplementary statistics on school staff and pupils for 2020 are scheduled for publication
in March 2021. Supplementary statistics for previous years can be found at:
https://www.gov.scot/collections/school-education-statistics/

A school information dashboard is also available:
https://www.gov.scot/collections/school-education-statistics/#interactivedashboards
2
Contents
    Chapter 1: Introduction .......................................................................................... 4
    Chapter 2: Overview .............................................................................................. 5
    Chapter 3: School teachers ................................................................................... 7
    Chapter 4: Classes and pupils ............................................................................. 15
    Chapter 5: Early Learning and Childcare ............................................................ 20
    Chapter 6: Glossary ............................................................................................. 25
    Chapter 7: Background notes .............................................................................. 28
       National Statistics publication .......................................................................... 28
       Sources and Timing ......................................................................................... 28
       Teachers .......................................................................................................... 29
       Classes and Pupils .......................................................................................... 33
       Early Learning and Childcare .......................................................................... 39
       Corrections ...................................................................................................... 42
       Costs ................................................................................................................ 42
       Rounding and symbols .................................................................................... 42

3
Chapter 1: Introduction
This publication brings together information on pupils and teachers at publicly funded
schools and early learning and childcare provision.
Early • Local authorities have a duty to secure a part-time funded place
(currently 600 hours a year) for three and four year olds and eligible
learning
two year olds
and
• Places are provided by local authority services, or secured through
childcare partnership arrangements with private or third sector services
• Children usually start school between 4½ and 5½ years old
Primary • There are seven stages from Primary 1 (P1) to Primary 7 (P7)
schools • Pupils are not streamed by ability at primary school and
automatically move up a stage each year
Secondary • Pupils attend for up to six years (S1-S6)
schools • Qualifications are usually taken in S4 to S6 starting at age 15-16
• Most children with additional support needs are educated in
mainstream schools but some with complex or specific needs are
Special educated in special schools
schools • Not all local authorities have special schools
• In these statistics pupils attending special schools are not
assigned to primary or secondary or to a stage
• Most teachers have a four year degree including or concurrent
with a teaching qualification, or have completed a Professional
Graduate Diploma in Education (PGDE) following a degree
Teachers
• Teaching graduates from a Scottish university are guaranteed a
one year probationary teaching post and are referred to as
induction scheme teachers in these statistics
4Chapter 2: Overview
90,126 registrations in 2,587 early learning & childcare centres (ELC)
702,197 pupils in 2,476 schools
53,400 teachers (full-time equivalent, including ELC)
13.3 pupil teacher ratio in schools
The overall number of pupils and teachers both increased in 2020. The pupil teacher ratio
(PTR) in schools, which gives a measure of the size of the teaching workforce relative to
the pupil population, decreased to 13.3.
Table 2.1: Schools, pupils, teachers and PTR
2014 2015(1) 2016 2017 2018(6) 2019 2020
Schools
ELC(2) 2,449 2,492 2,514 2,532 2,544 2,576 2,587
Primary 2,048 2,039 2,031 2,019 2,012 2,004 2,005
Secondary 362 361 359 360 357 358 357
Special 145 144 141 135 114 114 114
Pupils
ELC(2) 101,463 97,262 96,961 95,893 96,549 96,375 90,126
Primary 385,212 391,148 396,697 400,312 400,276 398,794 393,957
Secondary 284,762 281,939 280,983 281,993 286,152 292,063 300,954
Special(3) 6,940 6,871 6,668 6,654 6,823 7,132 7,286
Total (excluding ELC)(3) 676,914 679,958 684,348 688,959 693,251 697,989 702,197
Teachers
ELC(2) 1,200 1,038 985 921 821 798 729
School based 48,335 48,395 48,746 49,463 50,099 50,477 51,663
Primary 22,960 23,425 23,920 24,477 24,899 25,027 25,651
Secondary 23,401 23,059 22,957 23,150 23,317 23,522 24,077
Special 1,974 1,911 1,869 1,836 1,883 1,927 1,934
Centrally employed (school) 1,186 1,283 1,239 1,129 1,039 972 1,009
Total school (excluding ELC) 49,521 49,679 49,985 50,592 51,138 51,449 52,672
Total (including ELC) 50,720 50,717 50,970 51,513 51,959 52,247 53,400
Pupil Teacher Ratios
Publicly funded schools(4) 13.7 13.7 13.7 13.6 13.6 13.6 13.3
(5)
Total based in schools 14.0 14.0 14.0 13.9 13.8 13.8 13.6
Primary 16.8 16.7 16.6 16.4 16.1 15.9 15.4
Secondary 12.2 12.2 12.2 12.2 12.3 12.4 12.5
Special 3.5 3.6 3.6 3.6 3.6 3.7 3.8
(1) The pupil teacher ratio for Total based in schools in 2015 was amended in October 2017. See background
notes for details.
(2) ELC centre count includes local authority and partnership centres, and ELC teacher figures include ELC home
visiting.
(3) Special and total pupil count were updated for 2011-2016 in October 2017. See background notes for details.
(4) Includes all school based and centrally employed teachers. Includes grant-aided pupils and teachers.
(5) Excludes centrally employed teachers.
(6) Prior to 2018, special schools with no pupils or where no pupils were on roll but pupils from other schools
attended were included in school counts in this table. From 2018, they have been excluded.
5The numbers of teachers increased across all sectors except early learning & childcare. The decrease in primary pupils combined with the increase in primary teachers meant there were fewer pupils per teacher and consequently the primary PTR decreased to 15.4. This is the lowest ever PTR for primary schools. In secondary schools the number of pupils grew at a faster rate than the number of teachers meaning there were more pupils per teacher, so the secondary PTR increased to 12.5. This is the highest PTR in secondary schools since 2004, when the PTR was 12.7. (Statistics pre-2014 are available from the supplementary statistics and historical time series). 6
Chapter 3: School teachers

    52,672    teachers in schools compared to 51,449 in 2019 (excludes ELC)
    13.3      pupil teacher ratio in local authority schools
    85%       of teachers on the 2019/20 Teacher Induction Scheme were in employment
              the following school year

Table 3.1: Teachers in Scotland by sector and local authority, 2020
Full Time Equivalents (FTE)
                                                                Centrally
 Local Authority              Primary    Secondary   Special                 Total
                                                                employed
 Aberdeen City                     891         751        36           48      1,725
 Aberdeenshire                   1,403       1,234        46           37      2,720
 Angus                             596         575         #           25      1,197
 Argyll and Bute                   425         406         8             8       846
 City of Edinburgh               1,652       1,594       157         114       3,518
 Clackmannanshire                 291         233          27           3        554
 Dumfries and Galloway            654         664          21          75      1,413
 Dundee City                      656         593          59          31      1,340
 East Ayrshire                    593         545          77          18      1,233
 East Dunbartonshire              589         686          51          40      1,366
 East Lothian                      496         485         #           27      1,008
 East Renfrewshire                 620         665        35            2      1,322
 Falkirk                           804         804        72            7      1,688
 Fife                            1,862       1,592        91           82      3,627
 Glasgow City                    2,738       2,261       307          140      5,446
 Highland                        1,046       1,145         43          50      2,284
 Inverclyde                        344         362         43           2        751
 Midlothian                        492         434         27          31        985
 Moray                             433         418          #          21        873
 Na h-Eileanan Siar                150         151          #          11        312
 North Ayrshire                    688         634        44           45      1,412
 North Lanarkshire               1,807       1,641       232           63      3,742
 Orkney Islands                    114         126         #            7        247
 Perth and Kinross                 687         626        17           16      1,346
 Renfrewshire                      856         811        90           21      1,778
 Scottish Borders                  498         523        39            5      1,065
 Shetland Islands                  162         154         #           13        329
 South Ayrshire                    523         514        28           35      1,101
 South Lanarkshire               1,661       1,628       150            0      3,438
 Stirling                          436         480        21           17        954
 West Dunbartonshire              465         436         49           14        964
 West Lothian                     997         855        119            0      1,971

 All local authorities         25,630       24,030      1,886       1,009    52,555
 Grant aided                       21          48          48           #       117

 Scotland                      25,651       24,077      1,934       1,009    52,672

7
Table 3.2 shows that total teacher numbers (primary, secondary, special and centrally employed) rose in each year from 2014 to 2020. The number of teachers increased by 1,224 between 2019 and 2020, the biggest recorded annual increase since 1975. (Statistics pre-2014 are available from the supplementary statistics and historical time series). Additional teachers have been recruited in the 2020/21 school year to support the recovery of education following the disruption caused by COVID-19. These additional teachers are likely to be a major contributing factor to the increase in teacher numbers, reduction in overall PTR, decrease in average primary class sizes, increase in proportion of teachers on temporary posts and the overall proportion of the 2019/20 cohort of Teacher Induction Scheme (TIS) probationers in teaching posts. Further information on COVID-19 Education Recovery grant funded teachers, and on teachers funded through the Attainment Scotland Fund, can be found in the background notes. Although the number of teachers has increased since 2019, this was not the case for each local authority. In 27 local authorities the number of teachers increased, with the largest increase of 8% seen in East Dunbartonshire; followed by Clackmannanshire and Renfrewshire, with an increase of 6%. The other five local authorities saw small decreases in teachers this year, of up to 2%. 8
Table 3.2: Teachers (all sectors excluding ELC)(1)
Full Time Equivalents (FTE)
 Local Authority               2014       2015      2016     2017     2018     2019     2020
 Aberdeen City                 1,623      1,632     1,603    1,624    1,636    1,675    1,725
 Aberdeenshire                 2,593      2,650     2,655    2,675    2,650    2,696    2,720
 Angus                         1,140      1,136     1,125    1,133    1,160    1,172    1,197
 Argyll and Bute                 866        844       841      825      861      834      846
 City of Edinburgh             3,159      3,193     3,213    3,281    3,346    3,452    3,518
 Clackmannanshire                495        490       528      513      512      520      554
 Dumfries and Galloway         1,481      1,479     1,466    1,470    1,436    1,436    1,413
 Dundee City                   1,372      1,375     1,367    1,330    1,321    1,316    1,340
 East Ayrshire                 1,139      1,151     1,149    1,189    1,185    1,205    1,233
 East Dunbartonshire           1,191      1,204     1,217    1,245    1,248    1,269    1,366
 East Lothian                    902        920       913      935      960      973    1,008
 East Renfrewshire             1,201      1,213     1,227    1,265    1,277    1,306    1,322
 Falkirk                       1,578      1,581     1,605    1,620    1,634    1,629    1,688
 Fife                          3,469      3,476     3,494    3,498    3,503    3,530    3,627
 Glasgow City                  4,803      4,779     4,869    5,020    5,263    5,352    5,446
 Highland                      2,331      2,357     2,355    2,365    2,388    2,300    2,284
 Inverclyde                      725        734       735      738      745      730      751
 Midlothian                      847        866       873      892      930      941      985
 Moray                           881        874       848      856      868      866      873
 Na h-Eileanan Siar              323        324       321      327      327      313      312
 North Ayrshire                1,325      1,332     1,371    1,396    1,393    1,376    1,412
 North Lanarkshire             3,452      3,406     3,474    3,502    3,545    3,590    3,742
 Orkney Islands                  254        255       260      253      250      251      247
 Perth and Kinross             1,337      1,337     1,329    1,329    1,346    1,329    1,346
 Renfrewshire                  1,576      1,596     1,633    1,656    1,676    1,674    1,778
 Scottish Borders              1,063      1,049     1,052    1,055    1,070    1,038    1,065
 Shetland Islands                322        323       318      323      322      320      329
 South Ayrshire                1,062      1,063     1,043    1,056    1,048    1,065    1,101
 South Lanarkshire             3,147      3,176     3,202    3,282    3,298    3,341    3,438
 Stirling                        932        921       942      925      934      938      954
 West Dunbartonshire             911        921       928      961      956      980      964
 West Lothian                  1,868      1,880     1,899    1,924    1,924    1,909    1,971
 All local authorities        49,368     49,538    49,858   50,464   51,012   51,327   52,555

 Grant aided                     153        141      127      127      126      122      117
 Scotland                     49,521      49,679   49,985   50,592   51,138   51,449   52,672
(1) Includes centrally employed teachers.

9
Table 3.3 shows pupil teacher ratios (PTRs) which give a measure of the size of the
teaching workforce relative to the pupil population. The national PTR had remained stable
at 13.6 between 2017 and 2019. In 2020, the PTR decreased to 13.3, the lowest national
PTR since 2009. (Statistics pre-2014 are available from the supplementary statistics and
historical time series).
Across Scotland, 26 local authorities have decreased or maintained their PTR from 2019.
Since 2014, Clackmannanshire and Renfrewshire have had the largest decrease in PTR
at 1.3. The largest increases in PTR since 2014 were in Orkney Islands and Dundee City
at 0.8, however Orkney Islands’ current PTR still remains below the national average.
Table 3.3: Pupil teacher ratio (PTR) (all sectors excluding ELC)(1)
Pupils per teacher
            Local Authority   2014      2015      2016       2017      2018      2019      2020
 Aberdeen City                 13.6      13.6      14.0       14.0      14.1      13.8      13.7
 Aberdeenshire                 13.5      13.3      13.4       13.3      13.5      13.3      13.4
 Angus                         13.3      13.2      13.3       13.3      13.1      13.0      12.8
 Argyll and Bute               12.2      12.4      12.3       12.5      12.0      12.2      12.0
 City of Edinburgh             14.9      14.9      15.1       15.1      15.1      14.9      14.8
 Clackmannanshire              13.3      13.4      12.5      12.9      13.0      12.8       12.0
 Dumfries and Galloway         12.7      12.7      12.7      12.8      13.1      13.1       13.2
 Dundee City                   12.9      13.0      13.2      13.7      13.8      13.9       13.7
 East Ayrshire                 14.0      13.9      13.9      13.3      13.5      13.4       13.2
 East Dunbartonshire           13.6      13.6      13.5      13.4      13.6      13.5       12.7
 East Lothian                  15.2      15.1      15.4      15.2      15.1      15.1       14.8
 East Renfrewshire             13.7      13.7      13.7      13.5      13.5      13.2       13.2
 Falkirk                       13.5      13.5      13.5      13.5      13.4      13.5       13.0
 Fife                          14.0      14.0      14.1      14.1      14.2      14.2       13.9
 Glasgow City                  13.6      13.8      13.8      13.5      13.1      13.0       12.9
 Highland                      13.2      13.1      13.1      13.0      12.9      13.5       13.5
 Inverclyde                    13.8      13.5      13.5      13.4      13.2      13.6       13.1
 Midlothian                    14.2      14.2      14.2      14.2      13.8      14.0       13.7
 Moray                         13.7      13.7      14.1      13.9      13.7      13.8       13.9
 Na h-Eileanan Siar            10.4      10.3      10.5      10.3      10.2      10.6       10.7
 North Ayrshire                13.7      13.6      13.3      13.1      13.1      13.1       12.8
 North Lanarkshire             14.2      14.4      14.1      14.0      13.8      13.7       13.2
 Orkney Islands                10.5      10.5      10.4      10.8      11.1      11.1       11.3
 Perth and Kinross             13.3      13.3      13.6      13.5      13.3      13.6       13.5
 Renfrewshire                  14.7      14.6      14.3      14.2      14.1      14.2       13.4
 Scottish Borders              13.7      13.8      13.8      13.8      13.6      14.0       13.6
 Shetland Islands              10.0      10.0      10.2      10.0      10.1      10.2       10.0
 South Ayrshire                13.2      13.2      13.4      13.3      13.3      13.2       13.0
 South Lanarkshire             13.7      13.7      13.7      13.4      13.4      13.4       13.1
 Stirling                      13.2      13.4      13.2      13.5      13.5      13.5       13.4
 West Dunbartonshire           13.6      13.5      13.4      13.1      13.1      12.8       13.0
 West Lothian                  14.1      14.1      14.1      14.0      14.1      14.3       13.9
 All local authorities         13.7      13.7      13.7      13.6      13.6      13.6       13.3
              (2)
 Grant aided                    8.1       8.6       9.2       9.3        9.4       9.6      10.0

 Scotland                         13.7       13.7       13.7     13.6    13.6      13.6      13.3
(1) Includes centrally employed teachers.
(2) The pupil teacher ratio for grant aided schools in 2011-2016 was amended in October 2017. See
background notes for details.

10
One of the most important uses of the data collected in the school staff census is in
modelling future changes in the workforce to provide guidance on the number of new
teachers to train. Chart 1 shows that the age profile of teachers has changed much over
the past 10 years. The prominent peak of teachers aged in their fifties, as seen in 2010, no
longer exists. In 2020, teacher numbers were highest between the ages of 25 and 41.
The average (mean) age of primary, secondary and special school teachers was 40 in 2020,
compared to 43 in 2010, so teachers were, on average, younger in 2020 than in 2010.
Chart 1: Age profile of teachers (excluding ELC)
2,000
Teachers (FTE)
2010
2020
1,000
0
20 30 40 50 60
Table 3.4 shows that there are many more female teachers than male. In both primary and
secondary sectors the proportion of teachers who were female fell at each level of
seniority. In primary schools, 89% of teachers at all grades were female compared to 84%
of head teachers. In secondary schools 64% of teachers at all grades were female
compared to 42% of head teachers. However the rates were higher in special schools,
where 77% of teachers at all grades were female compared to 81% of head teachers.
Teaching posts were classified into three employment types for the purposes of the school
staff census: Permanent, Temporary and Teacher Induction Scheme. Teachers may be
employed on a permanent contract but be recorded in the staff census as temporary if they
are working in a post classified as a temporary employment type, for example while
covering a vacancy. The proportion of teachers in temporary posts was 12% (compared
with 11% last year). This increase in temporary posts was seen across all school types.
Further details on the recording of employment types is included in the background notes.
In 2020, the percentage of teachers working part-time, as a proportion of all FTE, was
17%. There was a higher rate amongst females (20%) than males (7%).
11Table 3.4: Teacher characteristics
Percentage of Full Time Equivalents (FTE)
School Type
Centrally
Characteristic Primary Secondary Special Total
Employed
Sex
Female 89 64 77 83 77
Male 11 36 23 17 23
Age (years)
Under 25 7 5 1 1 6
25 to 34 32 29 17 10 29
35 to 44 28 28 32 25 28
45 to 54 23 23 31 32 23
55 or over 11 15 19 32 13
Average Age 39 41 45 48 40
Ethnicity(1)
White - Scottish 69 62 65 54 65
White - other British 22 25 23 26 24
White - other 2 4 5 5 3
Minority ethnic group 1 2 2 5 2
Not known 3 4 3 7 4
Not disclosed 2 3 2 3 2
Post employment type
Permanent 79 85 86 84 82
Temporary 14 10 14 16 12
Teacher Induction Scheme 7 6 0 0 6
Grade
Head teacher 7 1 5 3 4
Percentage female 84 42 81 77 77
Depute head teacher 6 5 7 2 5
Percentage female 87 58 76 86 74
Principal teacher 7 22 11 10 14
Percentage female 87 63 73 78 69
Teacher or chartered 81 72 78 85 77
Percentage female 90 66 77 84 79
All - percentage female 89 64 77 83 77
Mode of working (2)
Full-time 80 87 80 69 83
Percentage female 88 61 74 80 75
Part-time 20 13 20 31 17
Percentage female 95 84 87 90 91
(1) More information on the ethnicity categories can be found in the Ethnicity section in the background
notes.
(2) The mode of working is the percentage of FTE by working pattern in a school sector at a particular grade.
See background notes for more details.
12Teachers provisionally registered with the General Teaching Council for Scotland (GTCS)
(for example those that have recently completed their initial teacher education) are
required to complete a period of probation before becoming eligible for full registration.
Probation can be completed through either the one year full time Teacher Induction
Scheme (TIS) or a flexible route.
Table 3.5 shows the percentage of previous TIS probationers who were in teaching posts
in a publicly funded school in Scotland in the year following their probation. The
percentage of teachers in such employment in the first year following probation increased
from 80% for the 2013/14 cohort to 88% for the 2016/17 cohort. That percentage
decreased to 84% for the 2018/19 cohort, before rising slightly for the most recent cohort
to 85%. Teachers not in a post in a publicly funded school may be teaching elsewhere
(including abroad or in the independent sector), in non-teaching employment or
unemployed.
The proportion of TIS probationer cohort in a full-time permanent post at the time of the
following year’s census increased between 2013/14 and 2016/17, however it has
decreased for the last three years. For the 2019/20 cohort it was 38%, down from 48% for
the previous cohort. A higher proportion of the TIS probationer cohort are in full-time
temporary post at the time of the following year’s census, rising from 27% in 2015/16 to
42% in 2019/20.
Table 3.5: Teacher Induction Scheme post-probationers teaching in the year
following their probation
Percentage of headcount
TIS probationer cohort
2013/14 2014/15 2015/16 2016/17 2017/18 2018/19 2019/20
Full-time permanent 39 45 55 57 55 48 38
Full-time temporary 33 35 27 28 27 30 42
Part-time permanent 2 2 2 1 2 2 1
Part-time temporary 6 4 2 2 3 5 3
Other(1) 20 14 13 12 13 16 15
All teaching post
types’ 80 86 87 88 87 84 85
Headcount of
teachers in cohort 2,215 2,448 2,524 2,630 2,852 2,836 3,076
(1) The “Other” category includes those teaching elsewhere, including in the independent sector, those who
have found supply work, and those who are unemployed or who have left teaching, although this detail is not
included in the census data.
Table 3.6 shows the percentage of TIS probationers in teaching posts up to six years
following their probation. Since the 2014/15 TIS probationer cohort there has been a trend
for the employment rate to reduce in each year after the first year following probation. For
example, 86% of the 2014/15 cohort were in a teaching post in a publicly funded school in
their first year after probation but this reduced to 79% by 2019. This trend has not
continued into 2020 with the employment rate for the 2018/19 TIS cohort increasing from
84% in 2019 to 85% in 2020.
13Table 3.6: Long-term employment of Teacher Induction Scheme probationers
Percentage headcount
Sep-14 Sep-15 Sep-16 Sep-17 Sep-18 Sep-19 Sep-20
2013/14 cohort 80 81 79 78 77 76 75
2014/15 cohort 86 83 82 80 79 79
2015/16 cohort 87 84 83 81 80
2016/17 cohort 88 85 83 83
2017/18 cohort 87 84 84
2018/19 cohort 84 85
2019/20 cohort 85
14Chapter 4: Classes and pupils
14.0% of P1-P3 pupils were taught in classes of 18 or fewer compared to 12.3%
in 2019.
23.1 Average class size for pupils in primary school – this has decreased from
23.5 in 2019.
Table 4.1 shows average class sizes for each stage in primary school alongside the
overall primary school average. In 2020 the overall average for primary has decreased
from 23.5 in 2019 to 23.1. This is the smallest average class size since 2012 when the
average was 22.7 (statistics pre-2014 are available from the supplementary statistics). The
average class size for P1-P3 decreased from 23.2 to 22.9 between 2019 and 2020 while
the average class size for P4-7 decreased from 25.9 to 25.5. Statistics on class sizes in
the secondary sector are not collected as class size varies widely across subjects.
Table 4.1: Average class size of primary school pupils(1)
Headcount
Stage 2014 2015 2016 2017 2018 2019 2020
P1 21.2 21.1 21.2 21.0 20.9 21.0 20.8
P2 23.9 24.1 24.0 23.9 23.9 23.9 23.8
P3 24.7 24.8 24.7 24.7 24.6 24.7 24.2
P4 25.9 26.0 26.0 26.0 25.7 25.7 25.3
P5 25.8 26.0 26.1 26.1 26.1 26.0 25.5
P6 25.5 25.8 26.0 26.1 26.0 26.0 25.5
P7 25.4 25.4 25.8 25.9 26.0 25.9 25.6
P1-P3 23.3 23.3 23.3 23.2 23.2 23.2 22.9
P4-P7 25.7 25.8 26.0 26.0 25.9 25.9 25.5
Primary 23.3 23.4 23.5 23.5 23.5 23.5 23.1
(1) Data refers to the average class size of pupils in each stage, not the average class size of single stage
classes. The total primary average class size is calculated on a different basis to all the other class sizes
shown, see background notes for details.
15Table 4.2 shows that the percentage of pupils taught in classes of 18 or fewer increased to 14.0% (22,899 pupils) in 2020 from 12.3% (20,591 pupils) in 2019. Over the same period, the number of pupils taught in classes of 26 or more decreased from 43,634 (26.0%) in 2019 to 40,064 (24.4%). Table 4.2: P1-P3 pupils by class size(1) Headcount Class Size 2014 2015 2016 2017 2018 2019 2020 0 - 18 22,138 20,999 21,906 20,997 20,613 20,591 22,899 19 - 25 103,968 104,426 104,517 106,023 104,453 103,326 100,948 26 - 30 45,539 46,489 45,486 44,340 44,362 43,410 39,874 31 or more 470 658 807 625 350 224 190 % in classes of 18 or fewer or in two teacher classes of 36 or fewer 12.9 12.2 12.7 12.2 12.1 12.3 14.0 (1) The percentage of P1-P3 pupils in classes of 18 or fewer includes two-teacher classes with 36 or fewer. Classes taught by two teachers at all times are treated as two classes of half the size. Legislation limits class sizes to 25 for P1 pupils and to 30 for P2 and P3 (see background notes for more information). Table 4.3 shows the number of P1 pupils by class size. Some P1 pupils may be in classes of over 25 due to the inclusion of one or more ‘excepted pupils’ (see background note). In 2020 the number of P1 pupils in classes of 26 or more was 188; this was a reduction from 267 in 2019. In 2020, there were 7 classes with 26 or more pupils and at least one P1 pupil, compared to 11 such classes in 2019 (data not shown). Table 4.3: P1 pupils by class size Headcount Class size 2014 2015 2016 2017 2018 2019 2020 0 - 18 11,558 11,213 11,737 11,925 11,326 11,393 12,570 19 - 25 45,544 45,307 45,102 44,195 43,254 43,525 40,551 26 or more 451 637 698 631 511 267 188 16
Table 4.4 shows that the percentage of P1-P3 pupils in classes of 18 or fewer varies
considerably between local authorities and years. One of the main reasons for this was the
differing number of small schools between local authorities.
Table 4.4: P1-P3 pupils in classes of size 18 or fewer or in two teacher
classes with a pupil teacher ratio of 18 or fewer
Percentage Headcount
Local Authority                2014      2015       2016       2017      2018     2019   2020
Aberdeen City                  11.2       10.6       11.0      13.0        9.9    13.5   12.8
Aberdeenshire                  13.3       12.4       14.7      17.7       16.0    20.0   18.6
Angus                          23.1       22.4       19.6      16.5       20.1    19.2   17.7
Argyll and Bute                34.9       24.2       27.2      27.1       34.6    28.5   39.1
City of Edinburgh                7.2       6.1        5.7        6.0       5.2     4.5    6.0

Clackmannanshire               17.8       11.8       19.7      14.1       11.8    16.5   13.1
Dumfries and Galloway          16.4       13.6       17.1      22.0       20.2    17.7   16.8
Dundee City                      2.8       3.4        2.6        4.4       3.1     5.9    7.1
East Ayrshire                  13.0        9.5       11.1        9.9       8.3    12.0   17.0
East Dunbartonshire            11.3       10.6       12.9      10.3       10.5     9.3   10.1

East Lothian                     6.3       6.0        4.2        6.5       8.8     6.1   12.2
East Renfrewshire              15.7        9.5       16.5      12.6       11.9    18.3    9.5
Falkirk                          6.3       8.5        5.6        7.9       8.8    10.6   15.2
Fife                           22.9       20.8       20.8      11.6        7.1     3.7    7.1
Glasgow City                     3.7       3.6        4.2        5.5       6.5     8.0   10.9

Highland                       18.1       20.5       19.1      18.1       18.8    16.7   21.0
Inverclyde                     10.0        7.5        6.5        5.0       6.1     8.0    4.8
Midlothian                     11.7       10.3       16.7      11.2       16.2     9.4   11.4
Moray                          14.1       10.8        8.0        8.1       9.0    11.0    9.0
Na h-Eileanan Siar             48.0       51.3       57.8      52.3       56.4    60.4   55.3

North Ayrshire                   7.6      10.8       13.0        9.9      10.9    16.4   14.6
North Lanarkshire                7.7       8.6        9.8      11.4        8.9     9.4   13.7
Orkney Islands                 29.6       22.6       19.8      24.7       24.8    30.6   36.8
Perth and Kinross              15.1       14.3       14.7      11.0       11.8    16.7   17.5
Renfrewshire                   10.8       11.9       13.3      14.4       16.1    13.7   15.4

Scottish Borders               12.7       14.3       10.3      14.4       12.5    10.6   13.0
Shetland Islands               31.2       25.5       33.9      32.2       36.2    31.3   46.7
South Ayrshire                 17.8       24.6       19.5      20.1       15.4    14.1   19.2
South Lanarkshire              17.7       16.1       15.5      16.8       19.2    18.1   16.9
Stirling                       15.2       17.4       14.9      11.3       10.0    13.9   17.0

West Dunbartonshire            13.3       13.6       16.2      14.0       19.2    15.7   16.4
West Lothian                   17.0       13.6       16.3      14.7       17.1    13.6   17.1

Scotland(1)                       12.9      12.2       12.7      12.2      12.1   12.3   14.0
(1) The statistics for Scotland include one grant-aided mainstream school.

17
Table 4.5 shows pupil characteristics used in equalities monitoring. In 2020, 83.3% of
pupils were recorded as being White-Scottish or White-other British. The next largest
proportions of ethnic backgrounds were White-Other (3.2%), White-Polish (2.3%), Asian
Pakistani (2.1%) and mixed (1.5%).
There were 226,838 pupils (32.3% of all pupils) with an additional support need (ASN)
recorded. This was an increase of 1.4 percentage points on 2019 (215,897 pupils with an
ASN record, 30.9% of all pupils). The number of pupils identified with ASN has increased
markedly since 2010 and there continue to be year on year increases. These increases
were likely due in part to continued improvements in recording and the introduction of the
additional need types 'Child plans' and ‘Other’ in 2011.
Statistics on additional support needs include pupils in special schools and those in
mainstream schools who are assessed or declared disabled or have a Co-ordinated
Support Plan (CSP), Individualised Education Programme (IEP), Child Plan or another
type of support. Pupils may have more than one type of ASN, therefore the totals for ASN
do not equal the sum of individual types of ASN.

18
Table 4.5: Pupil characteristics(1)
Headcount
                                                      Female       Male       Total
Total Pupils                                         344,469    357,728    702,197

Ethnicity
White - Scottish                                     265,979    275,900    541,879
White - Other British                                 21,070     22,267     43,337
White - Irish                                            730        774       1,504
White - Polish                                          7,972      8,360    16,332
White - Gypsy/Traveller                                  689        743       1,432
White - Other                                         11,098     11,454     22,552

Mixed                                                   5,443      5,283    10,726

Asian - Indian                                          3,402      3,535      6,937
Asian - Pakistani                                       7,080      7,316    14,396
Asian - Bangladeshi                                      635        646       1,281
Asian - Chinese                                         2,218      2,227      4,445
Asian - Other                                           2,114      2,186      4,300

Caribbean/Black - Scottish/British                       465        439        904
Caribbean/Black - Other                                  204        239        443

African - Scottish/British                              3,095      3,053      6,148
African - Other                                         1,540      1,584      3,124

Arab                                                    1,731      1,996      3,727

Other                                                   2,032      2,210      4,242

Not known                                               5,290      5,635    10,925

Not disclosed                                           1,682      1,881      3,563

English as an Additional Language                     22,907     25,031     47,938

Additional Support Needs (ASN)
CSP (Co-ordinated Support Plan)                          585        949       1,534
IEP (Individualised Education Programme)              10,954     23,524     34,478
Child Plans                                           16,688     28,989     45,677
Assessed/Declared Disabled                              6,052    12,800     18,852
        (2)
Other                                                 79,244    102,825    182,069
                        (3)
All pupils with ASN                                   95,359    131,479    226,838

All pupils with ASN (excluding Other type)(3)          27,293      49,711     77,004
 (1) Statistics for English as an Additional Language do not include grant-aided special schools as this
information is not collected. There were 117 pupils at grant-aided special schools in 2020.
(2) See the background notes for further information on what the other category includes.
(3) Pupils may have more than one type of ASN, therefore the totals for ASN may not equal the sum of
individual types of ASN.

19
Chapter 5: Early Learning and Childcare 95% of eligible three and four year olds were registered for funded ELC (98% in 2019) 9% of two year olds were registered for funded ELC (11% in 2019) Table 5.1 shows that there were 90,126 registrations for funded Early Learning and Childcare (ELC) in September 2020, a decrease of 6.5% since September 2019 when there were 96,375 registrations. Uptake of funded ELC for eligible three and four year olds remains very high, with an estimated 95% registered (98% in 2019). Children registered to receive funded ELC at more than one centre may be counted more than once, so this will slightly overestimate true uptake. The decrease in the uptake of funded ELC this year may be due to the effects of COVID-19, with some parents choosing not to register their children. The number of two year olds registered for funded ELC has decreased from 5,990 in 2019 to 4,863 in 2020. 9% of all two year olds were registered in 2020, a decrease from 11% in 2019. At local authority level, the proportion of two year olds registered varies considerably, with the highest proportions found in Clackmannanshire (21%), West Dunbartonshire (19%) and Inverclyde (18%). Aberdeen City (3%), East Lothian (4%) and Shetland Islands (4%) had the lowest proportions of their two year old populations registered for funded ELC. It should be noted that the proportion of the two year old population registered for funded ELC will be affected by the proportion of the population that is eligible in each local authority area. However, this is currently not known, so the proportion of eligible two year olds that are registered for funded ELC cannot be reported on. The number of deferred registrations for funded ELC increased by 12% from 5,326 in 2019 to 5,940 in 2020. Of children potentially eligible for deferral, 21% were registered for funded ELC in 2020, compared with 19% in 2019. Table 5.2 shows that the overall FTE of teachers, graduates and staff working towards the Scottish Social Services Council (SSSC) benchmark degree level qualifications in ELC was 5,015 in 2020, compared with 4,781 in 2019, an increase of 5%. The FTE of teachers working in ELC was 729 in 2020, compared with 798 in 2019, a 9% decrease of 70 FTE. There were 2,721 FTE graduates working in ELC with degrees relevant to early years, other than teachers, a 7% increase of 185 FTE compared with 2,535 recorded in 2019. The FTE of ELC staff working towards the SSSC benchmark degree level qualifications increased by 117 to 1,565 in 2020, an 8% increase compared with 1,448 in 2019. 20
Table 5.1: Registrations(1) for funded early learning and childcare at local
authority and partnership centres, September 2020
                                       2 year olds          3 & 4 year olds(2)         Deferred entry(4)
                          Under
                                                % of                  % of those                % of those      Total
                            2      Number                  Number                     Number
                                              population              eligible(3)               eligible(5)
Aberdeen City                  0         73            3      3,046              90       256              22    3,375
Aberdeenshire                  2        152            5      4,201              95       322              21    4,677
Angus                          0         89            8      1,529              91       162              29    1,780
Argyll and Bute                0         61            9      1,093              99        92              25    1,246
City of Edinburgh             90        374            8      6,907              95       527              22    7,898
Clackmannanshire               0        110           21        790           97           28              10      928
Dumfries and Galloway          0        104            8      2,021          105          163              25    2,288
Dundee City                    1        207           15      2,062           93          234              32    2,504
East Ayrshire                 26        181           15      1,865           98           88              13    2,160
East Dunbartonshire           11         74            7      1,803           97          133              22    2,021
East Lothian                   6         42            4      1,690              97       158              26    1,896
East Renfrewshire              7         70            7      1,668              95       110              18    1,855
Falkirk                        0        137            9      2,307              95       202              24    2,646
Fife                           0        488           14      5,334              95       325              17    6,147
Glasgow City                  42        535            9      8,366              86       553              17    9,496
Highland                       0        144            7      3,366          102          442              39    3,952
Inverclyde                    43        123           18      1,074          104           83              24    1,323
Midlothian                     1        137           12      1,700           94          155              25    1,993
Moray                          0         59            7      1,414          105          131              28    1,604
Na h-Eileanan Siar             2         20            9        362           95           32              26      416
North Ayrshire                 0        178           14      1,858           97           77              12    2,113
North Lanarkshire              2        272            8      5,195           93          281              15    5,750
Orkney Islands                 0         10            6        293           95           40              41      343
Perth and Kinross              0        115            9      1,995           97          200              28    2,310
Renfrewshire                  78        285           16      2,715          100          222              24    3,300
Scottish Borders               0         55            5      1,484           91          104              18    1,643
Shetland Islands               0          9            4        401          101           55              42      465
South Ayrshire                11         76            8      1,568          100           93              17    1,748
South Lanarkshire             78        291            9      5,190          102          348              21    5,907
Stirling                       1         72            8      1,271           97           62              13    1,406
West Dunbartonshire           24        166           19      1,276              92        82              17    1,548
West Lothian                   0        154            8      3,054              95       180              17    3,388
Scotland                       425       4,863             9      78,898          95    5,940           21 90,126
(1) This is a snapshot of registrations at census week (14-18 September 2020). It does not include children
who were registered between census week and the end of December.
(2) Refers to academic year - three and four year olds were previously referred to as ‘ante pre-school’ and
‘pre-school’ respectively.
(3) Eligible children are estimated from National Records of Scotland population projections. For three year
olds, only around half of children are eligible at the time of the census (14-18 September 2020). Children are
counted once for each centre they are registered with, so the same child may be counted multiple times if
they attend more than one centre. Children may also attend centres outside of the local authority they live in,
which would also affect these figures.
(4) Refers to children who are eligible to attend primary school but have deferred entry and remain in ELC.

21
(5) Eligibility figures for deferral are calculated on the assumption that all children born from September to February inclusive are potentially eligible for funded ELC if they defer entry to primary school; January and February born children are entitled to the additional year of funded ELC, while for September to December born children, the local authority decides whether to provide it. Children born after school commencement date in mid-August can also defer entry to primary school, but they are not included in the calculation for the percentage of those eligible for deferred entry to avoid double counting with the four year old category. 22
Table 5.2: Teachers, graduate staff, and staff working towards graduate
qualifications at centres providing funded early learning and childcare, by
local authority, September 2020
Full Time Equivalent (FTE) and percentage
                                                                 Working                Total
                                                             towards graduate             % change
                             Teachers (1)    Graduates (2)    qualifications (3)   FTE    since 2019
Aberdeen City                        28               65                      70     164            7
Aberdeenshire                        19               88                      84     191          -12
Angus                                12               44                      41       96           8
Argyll and Bute                      11               37                      26       74          -1
City of Edinburgh                    91              310                    150      551            3
Clackmannanshire                        3              29                    19        51         11
Dumfries and Galloway                   8              99                    19       126          8
Dundee City                            36              53                    35       125         -6
East Ayrshire                          13              94                    49       156         -3
East Dunbartonshire                    31              55                    39       126          8
East Lothian                            5              46                   12         64         15
East Renfrewshire                      33              53                   29        115        -10
Falkirk                                 4              53                   50        107          2
Fife                                   66              79                   86        231         10
Glasgow City                           51             467                  255        773          3
Highland                               33              33                    27        93          0
Inverclyde                              9              46                    38        94         14
Midlothian                             14              73                    16       103         -5
Moray                                  14              41                    25        79         50
Na h-Eileanan Siar                      3               6                     5        14         41
North Ayrshire                         10             101                    46       157          8
North Lanarkshire                       3             194                    76       272          2
Orkney Islands                          5               8                    14        27         39
Perth and Kinross                      44              80                    61       184         15
Renfrewshire                            5             126                    41       171          5
Scottish Borders                       21              27                    18        66         57
Shetland Islands                        6               6                    14        26         23
South Ayrshire                         31              56                    51       138         18
South Lanarkshire                      80             154                    65       299          7
Stirling                                7              74                    43       124         -4
West Dunbartonshire                    16              62                    23       101          6
West Lothian                           18              63                    38       119         11
Scotland                                729           2,721             1,565      5,015           5
(1) GTCS registered teachers. Includes teachers in ELC centres, centrally employed teachers, and home
visiting teachers.
(2) Includes staff that hold: a degree level benchmark qualification required by the SSSC for registration as a
manager/lead practitioner (see background notes for list of benchmark qualifications); a degree level (SCQF
level 9) qualification relevant to early years and are working towards a degree level benchmark qualification
required by the SSSC for registration as a manager/lead practitioner; or a degree level qualification sufficient
to meet the registration standards of another regulatory body (e.g. Nursing and Midwifery Council, General
Medical Council).
(3) Staff that do not hold degrees (SCQF level 9) relevant to early years, but are working towards a SSSC
benchmark degree level qualification for registration as a manager/lead practitioner.

23
Table 5.3 shows the characteristics of teachers in ELC. The vast majority of teachers
(93%) were female. Since 2015, the proportion of male teachers has more than doubled
from 3% to 7%.
Table 5.3: ELC Teacher characteristics percentages, 2020
Percentage of headcount
Sex Age
Average
Female Male Under 25 25 to 34 35 to 44 45 to 54 55 or over Age
93 7 1 15 32 34 19 45
Since 2012, the average age of teachers has remained around age 45. Data on age and
sex is only available for teachers, although they only form part of the graduate workforce in
ELC.
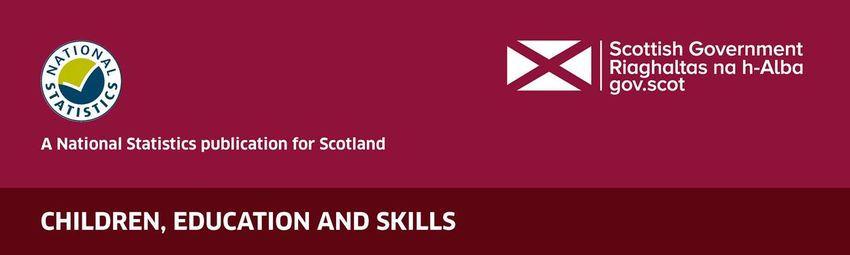
Chart 2 shows the age profile of GTCS registered ELC teachers, as at September 2020.
The number of teachers generally increases to age 39, then peaks at age 39 and 50,
before decreasing sharply after age 57.
Chart 2: Age profile of GTCS registered early learning and childcare teachers
24Chapter 6: Glossary Additional support needs (ASN): The Education (Additional Support for Learning) Scotland Act 2004 (as amended) states that a child or young person has an additional support need where they need additional support in order to benefit from school education. Centrally employed teachers: Teachers who were recorded as working across a local authority rather than an individual school or early learning and childcare centre. Child Plans: Single or multi agency plans based on an assessment guided by the Getting it Right for Every Child National Practice Model. More information about the Getting it Right for Every Child National Practice Model can be found here: www.gov.scot/Publications/2012/11/7143. Children and Young People Act: This act came into force in 2014. More information about the act can be found here: https://www.parliament.scot/parliamentarybusiness/Bills/62233.aspx Co-ordinated Support Plan (CSP): This statutory education plan is prepared by local authorities to identify, and ensure provision of, services for children and young people with complex or multiple additional support needs. Early Learning and Childcare (ELC): Three and four year olds and eligible two year olds are entitled to 600 hours of funded early learning and childcare (ELC). As part of the phasing for the expansion of funded ELC to 1,140 hours by August 2020, some children may be receiving more than 600 hours of funded ELC. ELC is secured by local authorities through their own provision, or through partner providers in the private, independent or third sector. English as an Additional Language (EAL): Refers to pupils for whom English is a second or additional language. Excepted pupils: These pupils do not count towards class size for the purpose of class size limits. A list of the reasons that a pupil may be defined as excepted can be found in the background note. Full-time equivalent (FTE): The total number of hours worked by all teachers divided by the number of hours in a standard full-time working week. Grant-aided Schools (GAS): Schools that are supported financially directly by the Scottish Government and follow the Curriculum for Excellence but are independent from Local Authorities. Grant-aided schools are not equivalent to schools termed ‘academies’ in some parts of the UK. 25
Grant-aided special schools (GASS):
These schools provide for young people with a wide range of ASN. There are seven GASS
in Scotland.

General Teaching Council for Scotland (GTCS):
The independent professional body responsible for keeping a register of teachers in public
education in Scotland and advising the Scottish Ministers on teacher education. All
teachers in public education must be registered with the GTCS.

Individualised Education Programme (IEP):
Individualised Education Programmes are written plans setting targets that a child with
additional support needs is expected to achieve.

Independent schools:
Privately owned and self-financing schools (also known as private or fee-paying schools).

Least Deprived (LD):
Pupils whose home address is in the 20% of least deprived data zones as defined by the
Scottish Index of Multiple Deprivation (http://www.gov.scot/simd).

Local authority early learning and childcare (ELC) centres:
ELC centres which are run and financed by the local authority.

Local authority schools:
Schools which are run and financed by the local authority.

Most Deprived (MD):
Pupils whose home address is in the 20% of most deprived data zones as defined by the
Scottish Index of Multiple Deprivation (http://www.gov.scot/simd).
Partnership agreement – (relating to ELC entitlement):
This is the agreement between local authorities and partner providers through which they
deliver the early learning and childcare entitlement.

Partnership ELC centres:
This is partner provider settings in the private, third or independent sectors which could
include private or third sector nurseries, playgroups, family centres and school based
nurseries. Child-minders are not currently included in the census, although they can and
do also work as partner providers with local authorities.

Pupil Teacher Ratio (PTR):
The average number of pupils per teacher.

Publicly funded schools:
Includes local authority and grant-aided schools.

26
Registration (for funded ELC):
A funded place received by a child at an ELC centre. Children are counted once for each
centre they are registered with, so the same child may be counted multiple times if they
attend more than one centre.

SIMD – Scottish Index of Multiple Deprivation:
The Scottish Index of Multiple Deprivation identifies small area concentrations of multiple
deprivation across Scotland. More information can be found here:
http://www.gov.scot/simd.

Teacher Induction Scheme probationer:
GTCS provides a guaranteed one-year training post in a local authority to every eligible
student graduating with a teaching qualification from one of Scotland's universities.

27
Chapter 7: Background notes
National Statistics publication
This is a National Statistics Publication. National Statistics are produced to high
professional standards set out in the Code of Practice for Statistics.
These statistics undergo regular quality assurance reviews to ensure that they meet
customer needs. They are produced free from any political interference. This publication
has been assessed by the UK Statistics Authority.
Sources and Timing
The information in this publication is derived from a number of sources: the pupil census,
the school staff census, and the Early Learning and Childcare (ELC) census. The 2020
pupil and school staff censuses were carried out on 16 September 2020. The early
learning and childcare census took place in the week commencing 14 September 2020.
Supplementary tables on the school staff census and the pupil census will be published in
March 2021. Additional early learning and childcare tables are available on the Scottish
Government website at:
https://www.gov.scot/collections/early-learning-and-childcare-statistics/
The information required to complete the pupil and staff censuses was collected
electronically, through local authorities, from all publicly funded primary, secondary and
special schools, as part of the ScotXed programme. The information collected is largely
sourced from school management information systems, thus reducing the burden on data
provider.
The ELC census is completed by the approximately 2,600 centres that provide funded
early learning and childcare in Scotland, and the figures are validated by local authorities.
Following the September 2010 consultation of users of school statistics, and changes to
the legislation around school handbooks, we have made a number of changes to our
collections and publications. This included moving the absence and exclusions data to a
biennial (two yearly) collection. Local authorities continue to collect information on pupils’
attendance, absence and exclusions each year on their management information systems
and this can be requested directly from local authorities.

28
Teachers
The school staff census covers all publicly funded schools in Scotland (i.e. local authority
and grant-aided schools).

Definitions and data quality
Teacher number statistics and the number of teachers used in pupil teacher ratio
calculations include only those teachers defined as ‘on roll’ (or ‘in complement’). This is
based on the full-time equivalent (FTE) of teachers in post at the time of the census with
one of the following status categories:

 Teacher Status                                    Further information
 Normal complement                                 Classroom teacher

                                                   Replacement for a teacher on sick
 Long term sick absence replacement                absence

                                                   Replacement for a teacher on
 Secondment replacement                            secondment

                                                   Replacement for a teacher on maternity
 Maternity leave replacement                       leave

                                                   Other replacement includes teachers
                                                   who are on short term contracts over two
 Other replacement (over two days)*
                                                   days to cover a vacancy and are
                                                   teaching on census day.

 Supernumerary                                     In addition to normal teaching staff

 Long term training/staff development              Replacement for a teacher on absent
 replacement                                       due to training

 Temporary contract covering a vacancy

 Teacher abroad on foreign exchange

 Other

                                                   If an authority runs a supply pool, those
                                                   teachers should be included ‘in
 Short term supply teacher (2 days or
                                                   complement’ if they are assigned to a
 fewer) and centrally employed
                                                   school on the census day. They can be
 (mainstream supply teacher from supply
                                                   included either in the assigned sector, or
 pool)
                                                   in the centrally employed total, but not
                                                   both.
*as per changes to the Teacher Pay deal in 2013.

29
For the purposes of these statistics:
• An individual teacher cannot exceed 1 FTE.
• Centrally employed teachers (including peripatetic/visiting specialists, hospital
teaching service and home visiting tutors) who are teaching on census day will be
assigned a status as above and are included in the total number of teachers in
Scotland and the overall pupil/teacher ratio. Where they teach at a number of
schools it is permissible to split their time across those schools.
• Teachers recorded in roles such as quality improvement officer or educational
advisor are classed as support staff, and are not included in these teacher statistics
or PTR calculations.
• Vacant posts are not included.
If a normal complement teacher is unexpectedly absent during census week and requires
cover, the replacement teacher covering this post can be recorded under a number of
statuses, depending on the nature of the cover.
Some local authorities will only record the replacement teacher as having a qualifying
status if the teacher they are replacing is absent ‘long term’ (there is no fixed definition of
long term). In this circumstance, the absent teacher would be recorded under the
appropriate status, such ‘long term absence’ to describe their reason for absence.
Other local authorities, however, may record the replacement teacher as ‘short term
supply teacher (up to two days) covering a normal complement teacher’. If this teacher is
not centrally employed they would not be counted as on roll for the purposes of these
statistics. The absent teacher will continue to be recorded as normal complement and as
such will be included in calculations of the number of teachers.
Some local authorities record replacement teachers as ‘other replacement’ and do not
change the status of the normal complement teacher who is absent. This situation may
result in double counting of an absent teacher and their replacement, however such cases
are rare.
Further information on teacher status categories can be found in the staff census data
specification/guidance which is available here:
http://www.gov.scot/Topics/Statistics/ScotXed/SchoolEducation/StaffCensus
Centrally Employed Teachers
There are some differences in the way in which authorities deal with centrally employed
teachers. In some cases these visiting specialists are considered as allocated to the
schools where they teach and have been included, with relevant partial FTE, in the school-
level data. In other cases they are included as centrally employed staff. We are also aware
that local authorities have changed procedures for reporting centrally employed teachers
during recent years. Centrally employed teachers are a small proportion of the total FTE,
only around 2%, so the effect of these different recording methods is small.
Special Schools
Statistics for the special school sector are compiled from schools formally designated as
special schools in the Scottish Government’s School Establishment collection. There is not
always a clear distinction between special schools and special units or classes within a
mainstream school. This should be kept in mind when analysing the statistics.
30Probationers In these statistics a Teacher Induction Scheme probationer is defined as an individual in a post on the Teacher Induction Scheme and individuals on other probationer schemes providing that scheme only spans a single September. Other probationers, that enter into teaching via a flexible or alternative route, will be recorded with a temporary or permanent post employment type. In Table 3.6, induction scheme teachers in 2018 were defined as teachers in a post where the employment type was reported as induction scheme. Prior to 2018, induction scheme teachers were based on a list of registration identifiers provided by the General Teaching Council for Scotland (GTCS) on an annual basis. Post-induction scheme teachers are identified by matching these registration identifiers with the identifiers collected as part of the following year’s school staff census. Grade For the purposes of the school staff census, only the teacher’s substantive grade is collected. However, in some local authorities where a teacher holds a post on temporary promotion, the substantive grade is changed to the grade of the promoted post. In some cases, such as when a teacher is on a temporary promoted post, a teacher may have multiple posts, each at a different grade. Mode of working (full-time/ part-time) The mode of working statistics in Table 3.4: Teacher Characteristics define working pattern on the cumulative FTE for an individual within a single school type (primary, secondary, special or centrally employed) and specific grade. Therefore, teachers working across multiple sectors or at multiple grades will be counted as part time for each sector and grade combination, even if their total FTE sums to one. In 2020, there were 700 FTE teachers working for a total of one FTE but across more than one grade or sector so have therefore been recorded as part time in Table 3.4. Employment type Employment type (permanent, temporary and Teacher Induction Scheme) relates to each post that a teacher holds, rather than their employment contract. This means that you could have permanent employment contract but be recorded with a temporary employment type for an individual post. Where local authorities record posts under the SEEMiS categories ‘acting up’ or ‘seconded’ the employment type will be returned as permanent for the purposes of the school staff census. We are aware that local authorities are taking different approaches to recording temporary promotions. For example, in the situation where a main-grade teacher is on temporary promotion to a principal teacher post they may be reported as having a temporary employment type and principal teacher grade. Alternatively they may be recorded as ‘acting up’ in SEEMiS and so reported as permanent in the school staff census, at their substantive grade (main-grade teacher). It is also possible that this situation reported as permanent principal teacher or a temporary main-grade teacher. 31
Ethnicity

The ethnicity groupings used in Table 3.4 contain the following categories:
   • White – other British includes White – Other British and White – Irish
   • White – other includes White – Other, White – Other and White – Polish
   • Ethnic minority group includes African – African / Scottish / British, Caribbean or
      Black – Caribbean / British / Scottish, Asian – Indian/British/Scottish, Asian –
      Pakistani / British / Scottish, Asian – Pakistani / British / Scottish, Asian – Chinese /
      British / Scottish, Mixed or multiple ethnic groups, Asian – Other, African – Other
      and Other – Arab.
Prior to 2019, ‘not disclosed’ ethnic background presented in Table 3.4 included the
categories ‘unknown’ and ‘not disclosed’. In 2019 these categories have been presented
separately.

Pupil teacher ratio (PTR)
Any commentary on changes to PTR over time, such as the commentary for Table 3.3, is
based on the difference after rounding the PTR to one decimal place.

Teachers funded through the Attainment Scotland Fund
The Attainment Scotland Fund (ASF) is a targeted initiative focused on closing the
attainment gap between the most and least disadvantaged children. It is delivered through
two primary routes: the Scottish Attainment Challenge and the Pupil Equity Fund (PEF).
One way in which this funding may be used is to recruit additional teaching capacity.
Since 2016, the total FTE of ASF funded teachers across Scotland has been published as
part of the reporting on the school staff census. This information helps with the monitoring
and development of ASF policy.
In 2018, a new field was added to the local authority management information system
(SEEMiS) with the aim of recording the ‘funding source’ for each teaching post. Analysis of
2018 and 2019 data has revealed that the way in which teaching posts are funded has
become increasingly complex.
As such, it is not always possible, or meaningful, to assign a single source of funding to a
teaching post or teacher.
For example:
     •   Some posts may be funded jointly through core local authority budgets and ASF
         budgets. Where it is not possible to account for posts with a single source of
         funding then the source which funds the majority of the post should be returned in
         the school staff census.
     •   A specific example of this joint funding are cases where PEF has been used to fund
         the difference between a teacher’s substantive post and their promoted post (e.g.
         where a teacher has taken on additional responsibility for ASF related work).
     •   ASF funding may also be being used indirectly. For example, PEF may be used to
         allow a school to recruit additional probationer teachers which, in turn, enables
         existing staff (who are core funded) to undertake PEF related work.
     •   The innovative nature of ASF work means that it is challenging the commonly held
         definition of what a teaching post entails; and this may vary between local
         authorities.

32
In addition, there are other factors that may affect the reliability of the data on the funding
source for teaching posts collected through the school staff census:
• Unlike the majority of school staff data which is also used operationally by schools
and local authorities, data on the funding source for teaching posts is generally only
recorded on SEEMiS for the purpose of the school staff census. Therefore any
anomalies with these figures would not necessarily be identified in the usual course
of business, as would be the case for other aspects of the school staff census data.
• The increasingly diverse models of school education provision may also mean that
schools and local authorities take different approaches to the recording of similar
situations.
Therefore, all of these factors have implications for the interpretation and use of the
information collected on the funding source of teaching posts. Even where it is appropriate
to measure the teacher FTE funded through ASF, the factors described above may result
in an over count in some circumstances and an undercount in others. Therefore, the
number of FTE teachers funded through ASF is an estimate based on the data recorded
and submitted by local authorities.
Taking all of this into account, using the information collected as part of the 2020 school
staff census, it is estimated that 939 FTE teachers were funded through ASF, which is
similar to the estimate of 975 FTE in 2019.
The Scottish Government will continue to work with local authorities through the school
staff census framework to further understand the use of ASF funding in terms of teaching
resource whilst seeking to minimise the reporting burden on local authorities and schools.
COVID-19 Education Recovery grant funded teachers
The Scottish Government has a programme to distribute grants totalling £80m to local
authorities to employ staff to support recovery of education provision following the
disruption caused by COVID-19. £75m of this funding was ring-fenced for teachers.
Teachers employed using this source of funding to perform a role that meets the definition
of ‘on roll’ and in post at the time of the census have been included in the teacher statistics
presented here. However, the data collected through the teacher census does not include
any identifiers that allow these teachers to be analysed separately from teachers funded
through core local authority budgets.
Management information on the number of teachers funded through COVID-19
Education Recovery grants was recently published by the Scottish Government.
This data is not collected on the same basis as the statistics presented here and it
is not possible to make direct comparisons between them.
Classes and Pupils
Scope and timing
The pupil census covers all publicly funded schools in Scotland (local authority and grant-
aided). Where a school has more than one department, for example a secondary school
with a primary department, these are counted as separate schools.
At September 2020 there was one grant-aided mainstream school, with primary and
secondary departments, and seven grant-aided special schools. These schools are
33You can also read