ECONOMIC UPDATE SEPTEMBER 2019 - ONLINE VERSION - Supporting the South Australian Building & Construction Industry & Workforce - CITB

Page created by Sherry Rodgers
 
CONTINUE READING
ECONOMIC UPDATE SEPTEMBER 2019 - ONLINE VERSION - Supporting the South Australian Building & Construction Industry & Workforce - CITB
ECONOMIC UPDATE SEPTEMBER 2019
ONLINE VERSION

         Supporting the South Australian Building & Construction Industry & Workforce
CONTENTS
Overview                                                                               1
   Positive Indicators                                                                 1
   Negative Indicators                                                                 1
Building and Construction Indicators                                                   2
   Summary of ABS Indicators - South Australia                                         2
   Analysis of ABS Construction Work Done June Quarter 2019,
   Cat. No. 8755.0. Australia                                                          2
   Analysis of ABS Building Approvals August 2019, Cat. No. 8731.0                     4
   Major Projects                                                                      5
   Other commentary on Building and Construction Indicators                            6
Summary of Latest Forecasting Reports Available                                        9
   Master Builders Association (August 2019)                                           9
   Australian Construction Industry Forum
   (May 2019): Australian Construction Market Report                                 11
Employment and Unemployment Indicators                                               12
   ABS Construction Sector Employment
   Quarterly Data, August 2019 - analysis by CITB                                    12
   ABS Labour Force - August 2019, Cat. No. 6202.0                                   13
   Vacancy Report - August 2019, Australian Government of
   Employment, Skills, Small and Family Business                                     13
   Other commentary on employment and unemployment indicators                        13
Population Estimates                                                                 15
   ABS Population Estimates - March Quarter 2019, Cat. No. 3101.0                    15
Commentary on General Economic Conditions (various analysis)                         15

Published 29 October 2019
Contact: citb@citb.org.au | 1800 739 839
5 Greenhill Road, Wayville SA 5034
PO Box 1227, Unley SA 5061

Disclaimer

This publication has been produced for general information only and is not intended to constitute advice. Readers relying on the content of the publication
do so entirely at their own risk.

No warranty (express or implied) is given as to the accuracy or completeness of information provided. The information may be true and correct at the date of
publication but this may change after publication. The CITB is not responsible for providing updates on such information.

All projections and forecasts are based on assumptions. These assumptions may not hold true and therefore such projections and forecasts cannot be relied
upon. The CITB is not responsible for providing updates on such projections and forecasts cannot be relied upon. The CITB is not responsible for providing
updates on such projections and forecasts.

All statements of opinion by the CITB represent the subjective views of the CITB and the CITB gives no warranty that such statements are correct. The
publication may include statements of opinion by third parties which do not necessarily reflect the opinion of the CITB.

All links to third party websites and references to third parties are included for convenience only and do not constitute endorsement of the material on those
sites, or endorsement of the relevant third parties and their product or service.

Readers should make their own assessment of all information provided (including statements of opinion and projections and forecasts) and consider
obtaining independent professional advice before making any decisions based on such information.

In no event is the CITB (or its trustees, officers, employees or any related body corporate) liable for any liability, loss, risk or damage (including incidental or
consequential damages) incurred or suffered (directly or indirectly) out of the use of any information contained in this publication, whether based on contract,
tort or other legal action.

Copyright in the publication belongs or is licensed to the CITB and no part of this publication may be used, reproduced or copied without the CITB’s consent.

Please refer all queries in respect of this publication to Eric Parnis, CITB Manager Research, (08) 8172 9509, ericp@citb.org.au
Overview
•   There have been declines in all categories for construction work undertaken nationally
    and in South Australia.
•   Nationally, the housing contraction is quite severe, however not as significantly in South
    Australia.
•   Capacity constraints are a risk to the investment pipeline, especially in the Eastern
    States.

Positive Indicators
•   South Australia’s population growth rate is increasing.
•   Employment in South Australia’s construction sector is at its highest level on record
•   The decline in building approvals in South Australia over the past year has not been as
    severe as in other states.
•   Although construction activity has eased over the past year, activity levels remain at a
    high level by recent standards.

Negative Indicators
•   South Australia’s unemployment rate is the highest of all states and territories.
•   Construction work done across all sectors (housing, commercial and civil) continues to
    fall).
•   Business confidence is declining.

                                                                              CITB Economic Update September 2019   |   1
BUILDING AND CONSTRUCTION INDICATORS
Summary of ABS Indicators - South Australia
    Monthly data (trend)                            Latest Month        Compared to a year
                                                                                   earlier

    Dwelling approvals (August 2019                           893                     -11.4%

    •       Private houses                                    619                       -3.3%

    •       Private ‘other’ dwellings
                                    1
                                                              244                     -33.0%

    Non-residential building approvals                   $195.9m                        -0.0%
    Quarterly data                                Latest Quarter        Compared to a year
                                                                                   earlier
    Dwelling commencements (Mar
                                                            2,447                      34.2%
    qtr 2019, seas. adj.)
    Construction work done (June qtr
                                                            $2.9b                     -11.3%
    2019, chain volume seas. adj.)
    •       Residential                                     $0.8b                     -12.3%

    •       Non-Residential                                 $0.6b                       -5.1%

    •       Engineering                                     $1.5b                     -13.1%
    Construction work in the pipeline
                                                            $7.4b                     -24.3%
    (Mar qtr 2019, original)
    •       Residential                                     $2.7b                       -8.0%

    •       Non-Residential                                 $2.4b                     -23.4%

    •       Engineering                                     $2.3b                     -37.7%

Source: ABS Building and Construction data.

Analysis of ABS Construction Work Done -
June Quarter 2019, Cat. No. 8755.0. Australia

                                                                                                Taken from ANZ Research – 28 August 2019:
                                                                                                •   Australian construction activity fell 3.8%
                                                                                                    quarter on quarter in the June quarter
                                                                                                    2019. This was the fourth (and largest)
                                                                                                    quarterly contraction in a row with de-
                                                                                                    clines across all three categories.

Source: ABS, ANZ Research.

1
    Other’ dwellings includes semi-detached, town houses, units, and multi-storey apartments.

2       |    CITB Economic Update September 2019
South Australia
                                     Construction Work Done in the Quarter                                                     Chart and table prepared by CITB
             Construction Work Done
                                  South  in the Quarter($billion, seas. adj.)
                                            Australia
             South Australia ($billion, seas. adj.)                                                                            •   Declines are evident in all categories.
    4.0

    3.5

    3.0
                                                                                         Total
    2.5

    2.0
                                                                    Engineering

    1.5

    1.0
                                                 Residential

    0.5
                                                               Non-Residential
    0.0
                                                               Jun-14
          Jun-09

                   Jun-10

                            Jun-11

                                        Jun-12

                                                    Jun-13

                                                                          Jun-15

                                                                                      Jun-16

                                                                                                 Jun-17

                                                                                                             Jun-18

                                                                                                                      Jun-19

Source: ABS

    Quarterly data                                              Latest              Compared              Compared
    South Australia                                            Quarter             to previous             to a year
                                                                                       quarter               earlier
    Construction work done (Jun qtr
                                                                   $2.9b                -4.8%                -11.3%
    2019, chain vol. seas. adj.)

    Residential                                                    $0.8b                -4.8%                -12.3%

    Non-Residential                                                $0.6b                  1.0%                 -5.1%
Source: ABS

Analysis by South Australian Centre for Economic Studies – Analysis of
Construction Work Done data 4/9/19
•           South Australian construction activity moderated in the June quarter
            2019, continuing a general pattern of slow decline since activity peaked
            in the second quarter last year. Data released by the ABS show that total
            construction work done in real seasonally adjusted terms fell by 4.8 per cent
            in the June quarter and was 11 per cent lower than a year earlier. A similar
            pattern is evident at the national level, with construction activity down 3.8
            per cent in the June quarter and down 11 per cent through the year.
•           The fall in construction activity over the past year has been broadly based,
            led by large falls in engineering construction (down 13 per cent) and
            residential building (down 12 per cent), accompanied by a modest decline in
            non-residential building (down 5.1 per cent).
•           Although construction activity has eased over the past year, activity levels
            remain at a high level by recent standards. The volume of work done in the
            June quarter 2019 was 10 per cent above the previous 5-year average level.

                                                                                                                               CITB Economic Update September 2019           |   3
BUILDING APPROVALS                                                                                                                  August 2019
                       SUMMARY                                                               Total Number of Dwelling Approvals Per Month
    Monthly data (trend)                       Latest Compared
                                                                                                         CHART 1: TOTAL NUMBER OF DWELLING
    South Australia During August 2019, the number
                                               Month
                                                   of newto a year
                                                          dwellings                                            APPROVALS PER MONTH
                                                            earlier                       2,400                                                                                                                     24,000
                       approved:
                                                                                                                               AUSTRALIA (RHS)
    Dwelling approvals
                    • (August
                        fell by2019)                893 in trend
                                0.9% in South Australia       -11.4%
                                                                 terms
                             (nationally, new dwelling approvals fell 3.9%);
    Private houses                                       619       -3.3%                  2,000                                                                                                                     20,000
                             and
    Private ‘other’ dwellings2
                                                   244 in seasonally
                       • fell by 30% in South Australia    -33.0%
                             adjusted terms (nationally, new dwelling
    Non-residential building approvals             $195.9m    0.0%                        1,600                                                                                                                     16,000
                             approvals fell 1.1%).
Source: ABS                                                                                                            SOUTH AUSTRALIA (LHS)

                       FURTHER ANALYSIS                                                   1,200                                                                                                                     12,000

Analysis of ABS Building
             TREND DATA Approvals - August 2019,
Cat. No. 8731.0
                  The total number of dwelling approvals in South                          800                                                                                                                      8,000
                  Australia    in August 2019 was 11% lower than a year
Analysis by CITB and reproduced from the Department of Treasury and                                                             TREND
Finance Economic ago.     Nationally,
                   Briefing  series.     the number of dwelling approvals                                                       SEASONALLY ADJUSTED
                  was 26% lower than a year ago – see Chart 1 and
•    The total number
                   The of   dwelling approvals in South Australia in August
                         value
                                                                                           400                                                                                                                      4,000
                  Table    1. of renovation approvals in South Australia
     2019 was 11% lower than a year ago. Nationally, the number of
                                                                                          During August, the value of non-residential building
                                                                                                   Aug-14

                                                                                                                     Aug-15

                                                                                                                                       Aug-16

                                                                                                                                                           Aug-17

                                                                                                                                                                                   Aug-18

                                                                                                                                                                                                           Aug-19
                   fell bywas
     dwelling approvals
                            1.1%  during August
                                26%oflower
                                                    but was
                                            thansector
                                                  a yearhouses
                                                         ago.
                                                               11% lower than a           approvals fell by 0.8% in South Australia, but was
                  The number            private                   approved for
                   year ago. Nationally, the value of renovation                          unchanged through the year — see Chart 4.
•    The number ofconstruction
                     private  sector in houses
                                        South Australia
                                                approved  fell
                                                          for   by 1.6% during
                                                               construction in            Source: ABS Cat. No. value
                                                                                                               8731.0 of non-residential building
                   approvals fell 0.8% in August to be 2.2% higher than                   Nationally,   the
     South Australia  fell byto
                  August      1.6%
                                 be during
                                       3.3% August   to be a3.3%
                                             lower than       yearlower
                                                                    agothan  a
                                                                         — see
     year ago.     a year earlier — see Chart 3.                                          approvals rose by 5.7% during August, to be 36%
                  Chart 2.
                                                                                          higher than   a year
                                                                                                     CHART       ago. AUSTRALIAN PRIVATE
                                                                                                             2: SOUTH
•         Private ‘other’ dwelling approvals in South Australia remained
                        Private ‘other’ dwelling approvals in South Australia                                    SECTOR—NUMBER OF DWELLINGS APPROVED
          unchanged during August but were 33% lower than a year earlier.                       South Australian Non-Residential
                                                                                                                 PER MONTH       Buildings
                       remained  unchanged
                              CHART            during
                                     3: APPROVALS     August
                                                    FOR      but were
                                                        ALTERATIONS & 33%                           CHART 4: SOUTH   AUSTRALIAN NON-
                                                                                          1,600        Approved - $M. Per Month
                                                                                                                  RESIDENTIAL
                                                                                                                        TREND BUILDINGS APPROVED -
                       lower than a year  earlier.
                                    ADDITIONS—$M.     PER MONTH
                         90                                                         900                                    $M. PER MONTH
                                                                                                                        SEASONALLY ADJUSTED
                                                                                           400
                     Nationally, the number of private sector houses
                                                   AUSTRALIA (RHS)                        1,400
              Trend Dwelling
                     approvedApprovals   by State
                                 for construction    fell by 1.0% during                                                                                                     TOTAL

                     August, while the number of private ‘other’ dwelling
                     approvalsAug
                                fell by
                                     19 9.2%.
                                        vs     Aug 19 vs                                  1,200
                     Aug 19                                                                300
                                     Jul 10        Aug 18
                      (no.)60                                            600
                             Table(%  change)Dwelling
                                   1: Trend     (% change)
                                                      Approvals By State
                                                                                          1,000

    NSW              3,687             -5.4           -30.0
                                                       Aug 19 vs.     Aug 19 vs.           200
                                           Aug 19
    VIC              4,153             -4.0           -22.8
                                                         Jul 19        Aug 18              800
                                            (no.)
    QLD           2,415                -2.3           (% change) (% change)
                                                      -25.2
                       30                                                     300
                      NSW                   3,687         -5.4         -30.0
 SA                893                 -0.9           -11.4                                600
                      VIC                   4,153 SOUTH -4.0           -22.8
                                                          AUSTRALIA (LHS)                  100
                                                                                                                                                                                            HOUSES
 WA               1,252
                      QLD              -0.2 2,415      -9.2
                                                          -2.3         -25.2
 TAS               237SA                     893
                                       -0.4 TREND         -0.9
                                                       -8.8            -11.4
                                                                                           400                                        TREND
                      WA                    1,252         -0.2           -9.2
                                                                                                  Aug-14Aug-14

                                                                                                                       Aug-15Aug-15

                                                                                                                                            Aug-16Aug-16

                                                                                                                                                                    Aug-17Aug-17

                                                                                                                                                                                            Aug-18Aug-18

                                                                                                                                                                                                                       Aug-19Aug-19

                                             SEASONALLY ADJUSTED                                                                      SEASONALLY ADJUSTED
 AUS*            12,864
                      TAS              -3.9 237       -25.6
                                                          -0.4           -8.8 0
                        0                                                                    0
                      AUS
Source: ABS Cat. No. 8731.0                12,864         -3.9         -25.6
                              Aug-14

                                       Aug-15

                                                Aug-16

                                                         Aug-17

                                                                  Aug-18

                                                                           Aug-19

                                                                                          Source: ABS Cat. No. 8731.0

                       Commercial and Economics Branch                                      Note: The ABS excludes large irregular movements in a
                       1 October 2019                                                       seasonally adjusted series when calculating a trend
                      Public – I2 – A1                                                 1    series. This is pertinent in this brief where seasonally
                                                                                            adjusted private sector ‘other dwellings’ has recorded
                                                                                            large irregular movements in South Australia, and
                                                                                            explains why there is a large difference in the movement
2
  Other’ dwellings includes semi-detached, town houses, units, and multi-storey apartments.
                                                                                            of these series.

4    |      CITB Economic Update September 2019

                                                                                          Next release of ABS cat. no. 8731.0 is 31 October 2019
10
                                  Projects under construction,
                                    committed or completed

                    AUDbn
                            8

                            6

                            4

                            2

                            0
-23        23-24                14-15    15-16    16-17       17-18   18-19    19-20    20-21    21-22   22-23       23-24
Possible                         Under construction            Committed        Under consideration        Possible

                                                       South Australia Major Projects                                             Major Projects
                   Figure 28. SA major projects
                            5
                                                                                Potential investment
                                                                                                                                  ANZ Research – Australian Major Projects September
                                                                                      pipeline                                    2019 publication (national and state data)
                            4                                                                                                     •      ANZ expects a lull in South Australian roads
                                                                                                                                         activity as sections of the North-South Corridor
                                Projects under construction,
                                  committed or completed                                                                                 are completed but this should ramp up again from
                            3
                                                                                                                                         2022-23 when the final two sections – touted as
                   AUDbn

                                                                                                                                         the state’s biggest ever infrastructure project – get
                                                                                                                                         underway.
                            2
                                                                                                                                  •      Renewable energy is a key focus, with an estimated
                                                                                                                                         $7 billion worth of projects under construction,
                            1                                                                                                            committed or under consideration in South
                                                                                                                                         Australia. The state government plans to achieve
                                                                                                                                         net 100% renewable energy by 2030. A new $1.8
                            0
-23       23-24                 14-15    15-16        16-17   17-18    18-19   19-20    20-21    21-22   22-23       23-24               billion Women’s and Children’s Hospital is also on
ossible                           Under construction           Committed        Under consideration       Possible                       the cards.
Governments,Source: ANZAccess
             Deloitte  ResearchEconomics, company reports, ANZ Research

                   Major Projects List South Australia
                                                                                                                             19
                   Roads                                                                                                          Electrical

                                     Project                          Value        Completion                                                    Project              Value     Completion

                      North-South Corridor:                                                                                           Ceres Wind Project              1.6bn      2020-21
                      Northern Connector and                          1.5bn            2019-20
                      Darlington Interchange                                                                                      Source: ANZ Research

                      North-South Corridor:
                                                                      5.1bn            2022-23                                    Hospital
                      final two sections

                   Source: ANZ Research
                                                                                                                                                 Project              Value     Completion

                                                                                                                                      Royal Adelaide Hospital:
                                                                                                                                      New Women and                   1.8bn       2020-21
                                                                                                                                      Children’s Hospital
                                                                                                                                  Source: ANZ Research

                   Publc Infrastructure

                                                                                                                                           Cost
                                                  Company                                                   Project                                        Industry     Start        End
                                                                                                                                         (AUDbn)

                      SA Department of Planning, Transport and                             North-South Corridor: River
                                                                                                                                           2.6              Road      2022-23      2027-28
                      Infrastructure                                                       Torrens to Anzac Highway
                      SA Department of Planning, Transport and                             North-South Corridor: River
                                                                                                                                           2.4              Road      2022-23      2027-28
                      Infrastructure                                                       Torrens to Darlington
                                                                                           New Women’s and Children’s
                      SA Department for Health and Wellbeing                                                                               1.8             Hospital   2020-21      2025-26
                                                                                           Hospital
                   Source: ANZ Research

                                                                                                                                              CITB Economic Update September 2019          |   5
battery storage, is currently under construction.
               Much of the activity within the forecast horizon is concentrated in New South Wales –
               underpinned by the Snowy Hydro – but South Australia and Queensland also have particularly
               strong pipelines. Renewables projects inject economic activity into mainly regional and remote
               areas, unlike the capital city transport projects that make up the bulk of our Major Projects.
               Possible mega-projects suggest the renewables sector could continue to grow substantially in
               the mid-2020s. One such project is the proposed $20bn, 10GW solar farm and 20-30GW
               storage facility that would be constructed near Tennant Creek in the Northern Territory.
               Another is the Asian Renewable Energy Hub, proposed by a consortium for Western Australia’s
               Pilbara Region. The hybrid wind and solar project would generate up to 15GW of renewable
               energy. The capital spend is expected to be $22bn, invested over a six- to seven-year period
               from the mid-2020s.
               As well as supplying the local market, these two projects would generate exports via sub-sea
               electrical cables. Although these two projects are substantial, at this stage, only the first year
               of construction on the Tennant Creek facility is included in our forecast horizon. The two
               projects represent significant upside to the renewable project pipeline.
                                              Renewables investment, by state                                          Renewable Energy Projects
               Figure 20. Renewables investment, by state
                        10
                                                                                                                       •     Much of the activity within the forecast horizon is concen-
                                                                                                                             trated in New South Wales – underpinned by the Snowy
                                                                                                                             Hydro – but South Australia and Queensland also have
                        8
                                                                                                                             particularly strong pipelines. Renewables projects inject
                                                                                                                             economic activity into mainly regional and remote areas,
                                                                                                                             unlike the capital city transport projects that make up the
                        6
                                                                                                                             bulk of our Major Projects.
                AUDbn

                        4

                        2

                        0
                              14-15   15-16    16-17   17-18   18-19   19-20   20-21     21-22    22-23    23-24
                                      NSW       VIC      QLD      SA      WA       TAS           NT       ACT

                Source: ANZ Research
               Source: Clean Energy Council, Deloitte Access Economics, company reports, ANZ Research

                Other Commentary on Building and                                                                   •       For construction trades in 2018, only 44% of vacancies were
                                                                                                                           filled and on average there was only one suitable applicant
                Construction Indicators                                                                                    per vacancy, which is worse than at any time during the
                                                                                                                           mining boom or residential construction boom.
                ANZ Research – Australian Major Projects September 2019
                publication (national and state data)                                                              •       This tightness is not being reflected in the wage data.
                                                                                                                           Construction industry wage growth (excluding bonuses) was
                •            Capacity constraints are a material risk to the investment                                    just 1.9% year on year in quarter 2 2019, one of the slowest
Australian Major Projectspipeline.
                          | September 2019                                                                                   17
                                                                                                                           rates among the industries.
                •            The high levels of infrastructure investment over the past                            •       With the unemployment rate at a relatively low 5.2%, reduced
                             few years have coincided with reports of rising costs and                                     availability of labour is not confined to the construction
                             difficulty in sourcing labour and input materials.                                            sector.
                •            Much of the evidence so far is anecdotal and it is difficult                          •       We have actually seen construction employment trend
                             to find conclusive evidence of capacity constraints in the                                    downwards nationally as residential activity contracts, but
                             macro-level data for several reasons:                                                         skills are not always transferrable between residential and
                         •      The contraction in residential construction since                                          infrastructure construction, particularly at higher skill levels.
                                late-2018 has offset some of the impact of higher                                          As such, the level of vacancies remains relatively high.
                                infrastructure activity.                                                           •       Reports of capacity constraints appear to be on the rise.
                         •      The tightness in the labour market, despite the slowdown                                   In early September 2019, the Victorian Premier, Daniel
                                in economic growth, reduces the availability of suitable                                   Andrews, and the Prime Minister, Scott Morrison, jointly
                                labour in general.                                                                         announced a $370 million cost blowout in Stage 2 of the
                                                                                                                           Monash Freeway upgrade prior to major construction works
                         •      Downturns in construction capacity utilisation and                                         commencing, with no changes to the scope or design. They
                                profitability have largely coincided with deteriorations in                                cited labour shortages and material costs as the reasons.
                                the same measures for the wider business sector.
                                                                                                                   •       In a 2019 survey, Allens, an international commercial law firm,
                         •      Reports of constraints have mainly come from Melbourne                                     found that 43% of infrastructure leaders in Australia believed
                                and Sydney, where the biggest projects are located.                                        the industry’s biggest concern was the inability to deliver
                •            Tight labour markets are contributing to difficulty in                                        the current project pipeline. They also considered tunnels
                             sourcing skilled labour. Data from the Department of                                          and rail to be the highest risk projects. The survey identified
                             Employment, Skills, Small and Family Business’ Survey of                                      the large volume of projects in Sydney and Melbourne as a
                             Employers who have Recently Advertised supports claims of                                     contributing factor.
                             growing difficulty sourcing skilled construction labour.                              •       There are several tunnelling projects underway or in planning
                •            In 2017-18, engineering occupations saw the poorest results                                   at the same time. These require different equipment and
                             in six years, with 59% of vacancies filled and an average of                                  skills from above-ground projects.
                             2.3 suitable applicants per vacancy.                                                  •       In June 2019, The Age reported that Melbourne Metro’s
                                                                                                                           cost may have blown out by a further $2 billion, in part due to
                                                                                                                           geological issues.

                6       |      CITB Economic Update September 2019
•   S&P has raised concerns about Australia’s ability to             “Australia’s Biggest Home Builders Shrink”
    deliver projects without delays or cost escalations. S&P         Taken from Sourceable
    also highlighted the risk of a domino effect if firms and
    subcontractors booked up with multiple projects face
    delays on even one project. Increased risks of delays and        Note: This is national data based on a recent HIA Report
    cost escalations pose a threat to profit margins which may       •    Australia’s biggest home builders have seen significant
    discourage firms from bidding on projects.                            declines in revenues and new home starts as the slowdown
•   In a recent example, Acciona won $576 million in                      in new residential construction continues to bite, the latest
    compensation from the New South Wales Government over                 research has found.
    the CBD and South East Light Rail project, claiming that it      •    In its Housing 100 report prepared in conjunction with
    was misled over its complexity.                                       Colourbond Steel, the Housing Industry Association said the
•   Local content requirements in Victoria also have supply and           number of dwellings on which the nation’s 100 largest home
    cost implications. For example, on the West Gate Tunnel,              building companies broke ground dropped from 74,565 in
    92% of the estimated 110,000 tonnes of steel must be                  2017/18 to 67,694 in 2018/19.
    sourced from within Australia.                                   •    Amongst the top ten home builders, six broke ground on
•   Ultimately, without effective policy action, capacity                 fewer homes and apartments last financial year compared
    constraints pose a material risk to both public and private           with the previous financial year.
    delivery of necessary infrastructure.                            •    The slowdown in top 100 starts reflects a broader slowdown
“Adelaide Brighton reports net loss, expects construction                 in the market for new home and apartment construction.
recovery in 2021” – InDaily 29 August 2019 report                    •    The top 100 home builders actually grabbed a larger slice of
•   CEO Nick Miller said in a statement to the ASX that the               the pie, taking their share of overall housing starts from 33
    company is expecting residential construction to continue             percent in 2017/18 to 35 percent in 2018/19.
    to decline in Australia until 2021, but demand for mining and    •    This means that smaller builders are incurring a
    infrastructure construction materials to pick up in the “near         disproportionately larger share of the current downturn in
    term”.                                                                home building.
•   “Infrastructure spending is expected to remain high with a       •    In terms of rankings, Victorian home builder Metricon lead
    significant number of projects commencing or in planning for          the pack in 2018/19 with 4,473 starts.
    commencement,” the company statement says.
                                                                     •    This was followed by Meriton Apartments (3,288 starts),
•   “This increased demand is expected to flow through to the             ABN Group (2,954 starts), Dyldam Developments (2,722
    business in 2020.”                                                    starts) and Simonds Group (2,580 starts).
“Construction hits recession territory in threat to national         •    Metricon was also the largest detached house builder whilst
economy” – The Age 29 August 2019 (national data)                         Meriton was the largest multi-unit builder and Philip Usher
•   The national residential construction sector is facing its            Constructions Pty Ltd was the largest builder in semi-
    deepest contraction since the GST was introduced, dragging            detached housing.
    down the overall economy amid warnings that fast-tracking        •    Perhaps surprisingly, the report shows that larger builders
    national infrastructure has now become urgent.                        are most dominant in the detached home market.
•   The Australian Bureau of Statistics on Wednesday revealed        •    All up, Housing 100 builders soaked up 57 percent of the
    overall construction across the economy fell by 5.8 per cent          market for detached dwellings – up from 54 percent in
    through the three months to June. Over the past 12 months,            2017/18 and 45 percent in 2016/17.
    construction was down by 11.1 per cent.
                                                                     •    By contrast, the largest 100 home builders’ share of the
•   Residential construction dropped by 5.1 per cent in the               semi-detached and multi-unit markets stood at just 16
    quarter to be down 9.6 per cent over the past year - the worst        percent and 27 percent respectively.
    annual performance for the key sector since the collapse
    associated with the introduction of the GST in 2000.
•   Westpac senior economist Andrew Hanlan said with the
    construction sector accounting for 13 per cent of the
    economy, the sharp drop in activity through the June quarter
    would have a material impact on the national accounts.
•   “The housing downturn still has further to go and will weigh
    on conditions throughout 2019 and into 2020,” he said.

                                                                                        CITB Economic Update September 2019             |   7
ANZ/Property Council Survey – December Quarter 2019                                                                                                                                                     ANZ/Property Council SurveyCouncil
                                                                                                                                                                                                                        ANZ/Property - December
                                                                                                                                                                                                                                           Survey 2019
                                                                                                                                                                                                                                                                     December 2019

•       The ANZ-Property Council Survey for the December                                                                                         150
                                                                                                                                                                                                                                                                                                                                      Sep-19

        quarter shows a decline in sentiment in Australia’s                                                                                                                                                                                                                                                                  144
                                                                                                                                                                                                                                                                                                                                      Dec-19
                                                                                                                                                                                                                                                                                                                                   100 = neutral

        property sector nationally. The decline was driven by a
                                                                                                                                                                                                              144

        fall in commercial property sentiment. Sentiment in the                                                                                  140

        residential sector rose strongly for a second quarter.                                                                                                                                                                              134

                                                                                                                              Confidence Index
•       Signs of recovery in the residential property market                                                                                     130
                                                                                                                                                                                                                       127
                                                                                                                                                                                                                                                                 128

        have been emerging for some months now, with
                                                                                                                                                                                                                                                                                        126
                                                                                                                                                                                                                                 124
                                                                                                                                                                                                                                                                                                            124
                                                                                                                                                                                                      123

        sentiment turning around convincingly in May. Since                                                                                                                                                                                           122
                                                                                                                                                                                                                                                                              118
                                                                                                                                                 120
        then auction clearance rates have picked up sharply,                                                                                                                                                                                                                                          116              116

        prices have been rising strongly now in Sydney and
        Melbourne for two months, and housing finance is                                                                                         110

        starting to pick up. Interest rate cuts (both actual and
        anticipated), and regulatory easing have been key                                                                                                                                                                                                                                                                                 101

        drivers of this turnaround.                                                                                                              100
                                                                                                                                                                                                       ACT               VIC                  WA                     AUS                 NSW                 QLD               SA

•       The improvement in residential confidence was                                                                         Source: ANZ / Property Council Survey December 2019.
        concentrated in the eastern states, while confidence in                                                               Source: ANZ/Property Council

        South Australia and Western Australia fell.
                                                                                                                                                                                                                                                                 Page 2

                                                                                                                                                                                                                    Forward work schedule expectations
•       The decline in sentiment in the commercial property
        sector, while not sharp, continues the downward trend                                    Over the next 12 months in the stateForward
                                                                                                                                      you primarily operate,expectations
                                                                                                                                             work schedule   will your forward work schedule
        evident since mid-2018. Marked weakness in retail
                                                                                                                                                                                                                             Over the NEXT 12 MONTHS in the state you primarily operate, will your forward work schedule:

                                                                                                                                                                                                                                                        Mar-19       Jun-19    Sep-19        Dec-19

        is clearly weighing on the overall commercial sector,                                                                                                                                         70
                                                                                                                                                 12-month forward work schedule expectations index

        while concerns over land tax reform appear to have
                                                                                                                                                                                                      60
        dampened sentiment in South Australia.
•       In South Australia sentiment was much weaker                                                                                                                                                  50

        across all sectors (office, industrial, retail, tourism,
                                                                                                                                                                  (net balance)

                                                                                                                                                                                                      40
        retirement living), and on all metrics (construction,
        price expectations, forward orders, employment), with                                                                                                                                         30
        proposed reform of land taxes most likely impacting
        sentiment.                                                                                                                                                                                    20

•       Business confidence in South Australia is significantly                                                                                                                                       10
        lower today than it was following the 2016 statewide
        blackout.                                                                                                                                                                                       0
                                                                                                                                                                                                                 AUS               NSW                 VIC                    QLD                 WA               SA               ACT

•       According to the ANZ/Property Council Survey,                                                                         Source: ANZ / Property Council Survey December 2019.
        statewide confidence has decreased from 144 to                                                                                           Source: ANZ/Property Council

        101 for the December quarter – the largest national
                                                                                                                                                                                                                                                                     Page 4

        quarterly decrease on record.                                                                                                                                                                               State economic growth expectations
                                                                                                                                                                                                            Over the next 12 months in the state you primarily operate,
•       This represents South Australia’s lowest confidence                                                                                                                                                                State economic growth expectations
                                                                                                                                                                                                                                   will economic          growth       be:will economic growth be:
        level since 2012 and comes only 18 months after the
                                                                                                                                                                                                                Over the NEXT 12 MONTHS in the state you primarily operate,

                                                                                                                                                                                                                                            Mar-19     Jun-19        Sep-19         Dec-19

        Premier formed Government at the last State Election.                                                                40
                                                                   12-month ahead state economic growth expectations index

•       South Australia’s confidence levels have been nation-
        leading for the past six quarters, but following the
        recent State Budget, confidence has deteriorated by                                                                  20
        43 points.
•       South Australia’s quarterly deterioration of 43 points
                                                                                        (net balance)

        was the largest drop on record behind SA’s 20 point                                                                   0
        decrease in 2014 and Queensland’s 17 point drop in
        2014.
For South Australia:                                                                                                         -20

•       State economic growth expectations. Worst result
        in nation, quarterly decrease of 45 points, worst result
        since March 2014.                                                                                                    -40
                                                                                                                                                                                                     AVG             NSW                    VIC                  QLD                         WA                   SA               ACT
•       State Government performance index. Second worst                                                                      Source: ANZ / Property Council Survey December 2019.
        result on record (-27.4), worst result since March 2016         Source: ANZ/Property Council
        quarter (-27.7), quarterly decrease of 48 points.                                                                                                                                                                                                   Page 7

•       Forward work schedule expectations. Second worst
        result on record (14.7), worst result since December
        2011 quarter (13), quarterly decrease of 44 points,
        dropped from nation’s best to worst in one quarter.

8   |     CITB Economic Update September 2019
Summary of Latest Forecasting Reports                                                              •     South Australia’s commercial building sector bottomed out
                                                                                                         in 2016 and has since rebounded sharply with the volume
Available                                                                                                of work done over the year to March 2019 valued at $2.55
                                                                                                         billion, an increase of 36.4% since the trough in the cycle.
Master Builders Association (MBA) South Australia - Building                                             Ultra-low interest rates and the acceleration of employment
and Construction Industry Forecasts, August 2019                                                         growth in the state can be thanked here, and the very short-
                                                                                                         term outlook appears favourable with a further gain of 9.5%
•     The MBA forecasts are more pessimistic about all sectors of                                                                             SOUTH AUSTRALIA
                                                                                                         anticipated to take place in 2019-20. The bad news is that
                                                           BUILDING
      South Australian construction than other major forecasters.                                       &activity
                                                                                                            CONSTRUCTION                  INDUSTRY         FORECAST
                                                                                                                   is likely to revert to trend after that with particularly
•     New housing commencements in South Australia peaked                                                large declines in the pipeline of work projected for 2020-21
      at 13,005 in 2017-18 and are forecast to trough at 8,202 in                                        (-13.1%) and 2021-22 (-16.0%).
      2022-23.
                                                                      •                                  In terms of engineering construction in SA, the fruits of

SA
•     Over the year to March 2019, new home commencements                                                government infrastructure commitments are starting to show
                                                                                                         up on the ground with the volume of work done reaching

                                                                                                                                         GRAPHS &
      in South Australia fell to 10,665 – a drop of some 19% on the

                                                                                                                       2019
      record peak high reached just a year earlier. Along with weak                                                                       SOUTH
                                                                                                         $6.35 billion over the year to March         AUSTRALIA
                                                                                                                                               2019 – the highest in six
                                                                                                         years,  and up by 9.5% on a year  earlier. However, as major

                                                                                                                                         TABLES
                                                               BUILDING
      credit conditions, the local market is battling subdued house                                      &  CONSTRUCTION              INDUSTRY         FORECAST
      prices (down by 0.5%) over the year to June 2019 and weak                                          transport infrastructure projects come to a conclusion the
      rental price growth (+1.1%). These factors in particular have                                      size of the SA engineering construction sector is likely to
      dampened investor demand in the state’s housing market.                                            shrink back to size with a decline of 0.4% during 2019/20 and
                                                                                                         a further drop of 3.3% in 2020/21.
• For new home building, the most likely scenario is that

SA
  activity will continue to drift lower over the next few years.

RESIDENTIAL BUILDING                                                                                                                     GRAPHS &
  New dwelling starts are projected to decline by 6.3% to 9,945

                                                                                                                       2019
  during 2019-20 before bottoming out at 8,202 in 2022-23. A

                                                                                                                                          TABLES
  2.4% rise in 2023/24 is anticipated to bring new home starts
  back up to 8,396 – although this volume of activity is still
RESIDENTIAL
  some 20.9% lower  BUILDING         WORK DONE BY SECTOR
                       than in 2018-19.
$M, chain volume measures, constant 2016/17 prices - Year Ended June
•     While new home building is set to move lower over the next
      few years,%ch  the2009-10
                         news is2010-11
                                  a little better
                                            2011-12 for home renovations
                                                      2012-13  2013-14   2014-15 2015-16               2016-17     2017-18   2018-19    2019-20   2020-21     2021-22   2022-23   2023-24
      which are expected        to 3,104
                                   creep slightly    higher   over  the forecast

RESIDENTIAL BUILDING
Residential Building     3,014               2,764     2,341    2,712     3,046   2,955                 3,051       3,419    3,389       3,045     2,826       2,649     2,588     2,620
      horizon.
                            -0.8%     3.0%     -11.0%    -15.3%     15.8%     12.3%      -3.0%          3.2%        12.1%    -0.9%      -10.2%     -7.2%       -6.3%    -2.3%      1.3%

Houses                       2,011    2,072     1,744     1,569      1,766     2,001     1,883          1,957       2,095    2,042       1,901     1,759       1,635     1,589     1,616

Residential Building  Work 3.0%
                           Done By  Sector  - South  Australia
RESIDENTIAL          BUILDING
                   0.4%
                                    WORK
                                 -15.8%  -10.0%
                                               DONE
                                                  12.5%
                                                        BY    SECTOR
                                                          13.3%  -5.9%                                  3.9%         7.1%    -2.5%      -6.9%      -7.5%       -7.1%    -2.8%      1.7%

Other Dwellings              560      574       556       363        504       594        633           657          884      894        690       613          561      543       546
$M, chain
$M,  chainvolume
           volumemeasures,  constant
                     measures,        2016/17
                               constant        pricesprices
                                            2016/17   - Year Ended     June
                 -1.3%   2.4%   -3.1%   -34.6%  38.6%    17.9% - Year
                                                                   6.5% Ended
                                                                           3.8% June
                                                                                  34.6%                                       1.1%      -22.8%    -11.1%       -8.5%    -3.2%      0.6%

Alterations & Additions   444
                    %ch 2009-10       460
                                     2010-11    466
                                               2011-12    408
                                                         2012-13     442
                                                                    2013-14    450
                                                                              2014-15     440
                                                                                         2015-16        437
                                                                                                       2016-17      440
                                                                                                                   2017-18    453
                                                                                                                             2018-19     453
                                                                                                                                        2019-20    453
                                                                                                                                                  2020-21      453
                                                                                                                                                              2021-22    456
                                                                                                                                                                        2022-23    458
                                                                                                                                                                                  2023-24
                            -5.3%     3.6%     1.2%      -12.4%      8.2%      1.9%      -2.3%         -0.6%        0.6%      3.1%       0.0%      0.0%        0.0%      0.5%      0.5%
Residential Building        3,014     3,104    2,764      2,341      2,712     3,046     2,955          3,051       3,419     3,389      3,045     2,826       2,649     2,588     2,620
                            -0.8%     3.0%     -11.0%    -15.3%     15.8%     12.3%      -3.0%          3.2%        12.1%     -0.9%     -10.2%     -7.2%       -6.3%     -2.3%      1.3%
         Residential Building                                      Houses                                       Other Dwellings                           Alterations & Additions
Houses                      2,011    2,072      1,744     1,569      1,766     2,001      1,883         1,957       2,095     2,042      1,901     1,759       1,635     1,589      1,616

                            0.4%      3.0%     -15.8%    -10.0%     12.5%     13.3%      -5.9%          3.9%         7.1%     -2.5%      -6.9%     -7.5%        -7.1%    -2.8%      1.7%

Other Dwellings              560      574       556       363        504       594        633            657         884       894        690       613         561       543       546
                            -1.3%     2.4%     -3.1%     -34.6%     38.6%      17.9%      6.5%          3.8%        34.6%      1.1%     -22.8%     -11.1%      -8.5%     -3.2%     0.6%

Alterations & Additions      444      460       466       408        442       450        440            437         440       453        453       453         453       456       458

                            -5.3%     3.6%      1.2%     -12.4%      8.2%      1.9%      -2.3%         -0.6%        0.6%      3.1%       0.0%      0.0%        0.0%      0.5%       0.5%

Source: MBA SA
         Residential Building                                      Houses                                       Other Dwellings                            Alterations & Additions
Number of Dwelling Commencements By Sector - South Australia
NUMBER OF DWELLING COMMENCEMENTS BY SECTOR
Year Ended
Year EndedJune
           June
                       %ch 2009-10   2010-11   2011-12   2012-13    2013-14   2014-15   2015-16        2016-17     2017-18   2018-19    2019-20   2020-21     2021-22   2022-23   2023-24

Residential Building        12,314   10,967     9,148    8,992       11,153   10,628     11,279        10,834       13,005   10,618      9,945     8,937       8,304     8,202     8,396
                             1.4%    -10.9%    -16.6%     -1.7%     24.0%     -4.7%       6.1%         -3.9%        20.0%    -18.4%     -6.3%     -10.1%       -7.1%     -1.2%     2.4%

Houses                       9,681   8,258     6,939     6,529      8,307      7,780      7,687         7,656       8,204     7,465      7,067     6,435       5,993     5,920     6,050

                             3.7%    -14.7%    -16.0%    -5.9%      27.2%     -6.3%      -1.2%         -0.4%        7.2%     -9.0%      -5.3%     -8.9%        -6.9%     -1.2%     2.2%
NUMBER
Other Dwellings
                OF DWELLING
                   2,633 2,709
                                COMMENCEMENTS
                               2,209 2,463 2,846 2,848
                                                       BY
                                                       3,592
                                                             SECTOR
                                                               3,178 4,801                                                    3,153      2,878     2,502       2,311     2,282     2,346
Year Ended June-6.3%                  2.9%     -18.5%     11.5%     15.6%      0.1%      26.1%         -11.5%       51.1%    -34.3%     -8.7%     -13.1%       -7.6%     -1.3%     2.8%

Source: MBA SA%ch 2009-10            2010-11   2011-12   2012-13    2013-14   2014-15    2015-16       2016-17     2017-18   2018-19    2019-20   2020-21     2021-22   2022-23   2023-24
                  Residential Building                                                  Houses                                                    Other Dwellings
Residential Building        12,314   10,967     9,148    8,992       11,153   10,628     11,279        10,834       13,005    10,618     9,945     8,937       8,304     8,202     8,396
                             1.4%    -10.9%    -16.6%     -1.7%     24.0%     -4.7%       6.1%         -3.9%        20.0%    -18.4%      -6.3%     -10.1%       -7.1%    -1.2%     2.4%

Houses                      9,681    8,258     6,939     6,529       8,307     7,780      7,687         7,656       8,204     7,465      7,067     6,435       5,993     5,920     6,050

                            3.7%     -14.7%    -16.0%    -5.9%      27.2%     -6.3%      -1.2%         -0.4%         7.2%     -9.0%      -5.3%     -8.9%       -6.9%     -1.2%     2.2%

Other Dwellings             2,633    2,709     2,209     2,463      2,846     2,848      3,592          3,178       4,801     3,153      2,878     2,502        2,311    2,282     2,346
                            -6.3%     2.9%     -18.5%    11.5%      15.6%      0.1%      26.1%         -11.5%       51.1%     CITB
                                                                                                                             -34.3%    Economic
                                                                                                                                         -8.7%   Update -7.6%
                                                                                                                                                -13.1%  September
                                                                                                                                                              -1.3% 2019
                                                                                                                                                                       2.8%                 |   9

                  Residential Building                                                  Houses                                                    Other Dwellings
South Australia’s commercial building sector                                                                                                 In terms of engineering construction in SA, the
            bottomed out in 2016 and has since rebounded                                                                                                 fruits of government infrastructure commitments
            sharplyAustralia’s
           South     with the volume     of work
                                  commercial       done over
                                                 building       the year
                                                           sector                                                                                        are
                                                                                                                                                           In starting
                                                                                                                                                              terms oftoengineering
                                                                                                                                                                           show up onconstruction
                                                                                                                                                                                         the ground with
                                                                                                                                                                                                       in SA, thethe
            to March 2019
           bottomed           valued
                         out in  2016 at $2.55
                                       and  hasbillion,  an increase
                                                  since rebounded                                                                                        volume
                                                                                                                                                           fruits ofofgovernment
                                                                                                                                                                       work done reaching     $6.35 commitments
                                                                                                                                                                                    infrastructure   billion over
            of 36.4%with
           sharply     sincethethe troughofinwork
                                 volume       the cycle.
                                                    done Ultra   low year
                                                           over the                                                                                      the
                                                                                                                                                           areyear   to March
                                                                                                                                                                starting        2019up
                                                                                                                                                                          to show    – the  highest
                                                                                                                                                                                        on the       in six
                                                                                                                                                                                                 ground      years,
                                                                                                                                                                                                          with   the
            interest                                                                                                                                     and   up byof9.5%
                                                                                                                                                                         workon  a year earlier. $6.35
                                                                                                                                                                                                 However,    as over
           to  Marchrates
                       2019and    the acceleration
                               valued                 of employment
                                       at $2.55 billion,  an increase                                                                                      volume              done  reaching           billion
            growth                                                                                                                                       major   transport   infrastructure
                                                                                                                                                                                  2019 – theprojects
                                                                                                                                                                                              highestcome
           of  36.4%insince
                        the state
                               the can  be in
                                    trough  thanked    here,Ultra
                                               the cycle.    and lowthe                                                                                    the year    to March                         in six years,
            very short term outlook appears favourable with                                                                                              to a conclusion the size of the SA engineering
           interest rates and the acceleration of employment                                                                                               and up by 9.5% on a year earlier. However, as
            a further gain of 9.5% anticipated to take place                                                                                             construction sector is likely to shrink back to size
           growth in the state can be thanked here, and the                                                                                                major transport infrastructure projects come
            in 2019/20. The bad news is that activity is likely                                                                                          with a decline of 0.4% during 2019/20 and a further
           very short term outlook appears favourable with                                                                                                 to a conclusion the size of the SA engineering
            to revert to trend after that with particularly large                                                                                        drop of 3.3% in 2020/21.
           adeclines
              further in
                       gain                                                 construction sector is likely to shrink back to size
                          theofpipeline
                                 9.5% anticipated     to takefor
                                        of work projected      place
           in  2019/20.
            2020/21        The bad
                     (-13.1%)   and news    is that
                                      2021/22        activity is likely
                                                (-16.0%).                   with a decline of 0.4% during 2019/20 and a further
           to revert to trendMBA
                              afterForecasts
                                    that with particularly    large
                                                 of Construction            drop of 3.3%
                                                                          Activity           in 2020/21.
                                                                                     by Sector      to 2023/24
           declines in the pipeline
                                 MBAof  work projected
                                      Forecasts            for constant
                                                       ($bn,
                                                of Construction               prices)
                                                                Activity in South Australia by Sector to 2023/24
           2020/21 (-13.1%) and 2021/22 (-16.0%).            ($bn, constant prices)
                                                                        $7

                                                                                             MBA Forecasts of Construction Activity in South Australia by Sector to 2023/24
                                                                        $6                                              ($bn, constant prices)
                                                                        $7
                                               (CHAIN VOLUME MEASURE)

                                                                        $5

                                                                        $6

                                                                        $4
                                      BILLIONSMEASURE)

                                                                        $5
                                                                        $3
                   $ BILLIONS (CHAIN$VOLUME

                                                                        $4
                                                                        $2

                                                                        $3
                                                                        $1

                                                                        $2
                                                                        $0
                                                                                  2013/14       2014/15       2015/16       2016/17        2017/18      2018/19     2019/20      2020/21       2021/22       2022/23         2023/24

                                                                        $1                                 Residential Building             Commercial Building        Engineering & Civil Construction

                  Source: MBA SA
                                                                        $0                        MBA forecast Change in Activity: 2023/24 v 2018/19
                                                                                  2013/14       2014/15        2015/16         2016/17      2017/18       2018/19     2019/20       2020/21       2021/22       2022/23         2023/24

                                                                                                              Residential Building           Commercial Building         Engineering & Civil Construction

                                                                                         -22.7%
                                                                                            MBA Forecast Change -24.4%                    -33.8%
                                                                                                                in Activity: 2023/24 v 2018/19
                                                                                                   MBA forecast Change in Activity: 2023/24 v 2018/19

                                                                                         -22.7%
                                                                                         Residential
                                                                                                                                                 -24.4%
                                                                                                                                             Commercial
                                                                                                                                                                                                     -33.8%
                                                                                                                                                                                             Engineering & Civil
                                                                                          Building                                            Building                                         Construction

                                          SOUTH AUSTRALIA                    SOUTH AUSTRALIA
                                                   BUILDING & CONSTRUCTION INDUSTRY FORECAST
                BUILDING & CONSTRUCTION INDUSTRY FORECAST
           3 | Separate forecast reports available for all states and territories. To order, contact: forecasts@masterbuilders.com.au

                                                                                         Residential                                             Commercial                                     Engineering & Civil
                                                                                          Building                                                Building                                        Construction

                  Source: MBA SA

STRUCTION
   NON-RESIDENTIAL BUILDING
           3 | Separate forecast reports available for all states and territories. To order, contact: forecasts@masterbuilders.com.au

                                                                                  SA Engineering Construction Work Done 2017/18                                                                                                  SA Non-Residential Building Work Done 2017/18
2017/18                                                                                        Engineering
                                                                                      SA Non-Residential   Construction
                                                                                                         Building Work ($M)
                                                                                                                        Done 2017/18                                                                                                       Non-Residential Building ($M)

                  Source: MBA SA                                                                                                                                                                                 Source: MBA SA
             NON-RESIDENTIAL BUILDING WORK DONE BY SECTOR
WORK DONE BY SECTOR
             $M, chain volume measures, constant 2016/17 prices - Year Ended June
16/17 prices - Year Ended June
                                                                                          %ch      2009-10            2010-11         2011-12         2012-13       2013-14        2014-15         2015-16        2016-17              2017-18   2018-19   2019-20   2020-21   2021-22   2022-23   2023-24
 2013-14      2014-15                                                        2015-16        2016-17       2017-18          2018-19         2019-20      2020-21      2021-22       2022-23        2023-24
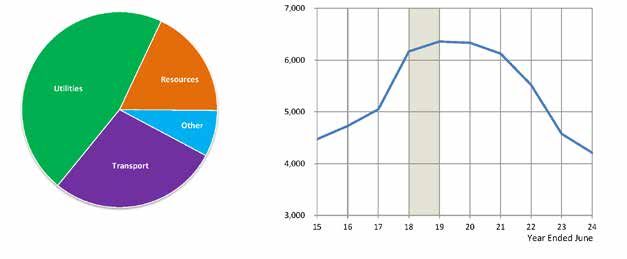
              Non-Residential                                                                         2,584           2,595              2,403         2,334         2,410          2,329            2,024         1,982               2,435      2,732     2,992     2,600     2,183     2,032     2,069
  5,657        4,473    4,728                                                                5,049            6,169         6,360           6,334         6,126       5,521          4,575          4,211
              Building                                                                                36.5%             0.4%             -7.4%        -2.9%          3.2%           -3.3%           -13.1%         -2.1%               22.9%     12.2%      9.5%     -13.1%    -16.0%    -6.9%      1.8%
  -7.4%       -20.9%                                                             5.7%        6.8%          22.2%             3.1%          -0.4%         -3.3%        -9.9%         -17.1%         -8.0%

  1,518       Retail
               1,085 &    976                                                                1,315 219 1,734            224 1,801        3321,799       299
                                                                                                                                                          1,311       310
                                                                                                                                                                       1,104          267
                                                                                                                                                                                     1,008             313
                                                                                                                                                                                                    1,143              250              283       384       328       382       336        315      329
              wholesale trade

                                                                             |
 -29.6%       -28.5%                                                         -10.1%         34.8%-35.2%
                                                                                                      31.9% 2.2%3.9% 48.2%
                                                                                                                         -0.1%                        -9.9%
                                                                                                                                                        -27.1%       3.5%
                                                                                                                                                                     -15.8%        -13.9%
                                                                                                                                                                                    -8.8%           17.5%
                                                                                                                                                                                                   13.5%          -20.2%               13.1%     35.6%     -14.4%    16.4%     -12.0%    -6.2%      4.2%

  2,067            10
               1,693                                                         2,238       CITB  Economic
                                                                                            2,440 47 2,845 Update
                                                                                                           31 3,056 September
                                                                                                                    1023,212 85   2019 2,651
                                                                                                                              3,100    33                                               7
                                                                                                                                                                                     1,902             15
                                                                                                                                                                                                    1,407              39                38        49        118       98        37        32        38
              Transport buildings
 -8.4%        -18.1%                                                         32.1%           9.0% 43.7%16.6% -33.8%
                                                                                                                  7.4% 225.9%
                                                                                                                            5.1%                         -3.5%
                                                                                                                                                      -16.2%         -14.5%
                                                                                                                                                                    -61.7%         -28.3%
                                                                                                                                                                                   -79.3%          -26.0%
                                                                                                                                                                                                    116.1%        164.7%               -1.6%     27.5%     143.0%    -17.3%    -62.0%    -12.8%     16.1%
  1,361        1,264                                                             1,139          873    186 1,119        2431,094         386992          1,385
                                                                                                                                                        254          1,428
                                                                                                                                                                     224             1,317
                                                                                                                                                                                      210           1,306
                                                                                                                                                                                                      143              105              233       239       461       495       262        188       199
Australian Construction Industry Forum (May 2019): Australian        •   While activity across the major projects sector eases, the
Construction Market Report                                               cost of building residential housing has continued to trend
                                                                         higher, albeit not quite as rapidly as previous years.
•   Australia’s pipeline of approved construction projects           •   CoreLogic’s Cost of Construction Index which tracks the
    continues to grow, but a lower proportion of projects are            rate of change in residential construction costs indicates the
    moving to the construction stage                                     divergence between the National CHIP index and growth in
                                                                         CPI that has been entrenched since 2003, may be starting to
•   The value of new projects added to the construction pipeline         ease. Heavy sustained investment in infrastructure projects
    hit a historic high of $35 billion in February 2019 before           for NSW and VIC continue to put upwards pressure on
    dropping to just $9.5 billion in March, which is approximately       construction costs while WA and SA both show a decrease in
    75% of the five-year median value of new projects and                the cost of residential construction.
    considered very low. All sectors recorded lower numbers
    except mining which recorded a 58% increase at the national
    level.
•   Projects transitioning from ‘approved’ into the construction
    phase have been subdued since September 2018 with
    results showing projects entering the build stage currently
    sitting at approximately 50% of the five-year median in terms
    of both number and value.
•   Large projects are likely facing challenges obtaining finance,
    especially in the residential multi-unit sector.

                                                                                      CITB Economic Update September 2019         |    11
EMPLOYMENT AND UNEMPLOYMENT INDICATORS
                      Workforce  SplitsConstruction
                                        Construction   Industry,
                                                              SouthSouth
                       Workforce Splits             Industry,       Australia                                   ABS Construction Sector Employment
                                         Australia
                35.0   Workforce Splits Construction Industry, South                                            - Quarterly Data, August 2019 -
                30.0                       Australia                                                            analysis by CITB
                  35.0 Workforce Splits Construction Industry, South
                25.0
                  30.0
                20.0                     Australia                                                              •   The construction sector has swapped places
                  35.0
                  25.0                                                                                              with manufacturing to become the 3rd largest
                15.0
    000s

                                                                                                                    employ in South Australia with employment
                  30.0
                  20.0
                10.0                                                                                                reaching a record high in 2018-19. The ABS data
                  25.0
                  15.0
             000s

                 5.0                                                                                                shows the sector employing 74,700 people in
                  20.0
                  10.0
                 0.0                                                                                                our state in the year to August quarter 2019.
                  15.0
             000s

                    5.0
                            Aug-87

                                       Aug-89

                                                               Aug-91

                                                               Aug-93

                                                               Aug-95

                                                               Aug-97

                                                               Aug-99

                                                               Aug-01

                                                               Aug-03

                                                               Aug-05

                                                               Aug-07

                                                               Aug-09

                                                               Aug-11

                                                               Aug-13

                                                               Aug-15

                                                               Aug-17

                                                               Aug-19
                                                                                                                •   On a 5-year comparison, year to August
                  10.0
                    0.0                                                                                             2019 compared to year to August 2014, total
                           5.0                                                                                      employment grew by 8,800 or 13.4%. The
                                 Aug-87Aug-87

                                              Aug-89Aug-89

                                                          Aug-91

                                                          Aug-93

                                                          Aug-95

                                                          Aug-97

                                                          Aug-99

                                                          Aug-01

                                                          Aug-03

                                                          Aug-05

                                                          Aug-07

                                                    Aug-11Aug-09

                                                    Aug-13Aug-11

                                                    Aug-15Aug-13

                                                    Aug-17Aug-15

                                                    Aug-19Aug-17

                                                          Aug-19
                                                                   Housing       Commercial       Civil
            0.0                                                                                                     largest contributors to this growth were Building
      Source: ABS                                                                                                   Completion Services and Residential Building
                                                         Aug-91

                                                    Aug-93

                                                    Aug-95

                                                    Aug-97

                                                    Aug-99

                                                    Aug-01

                                                    Aug-03

                                                    Aug-05

                                                    Aug-07

                                                    Aug-09

                                                                      Housing      Commercial           Civil       Construction (both +3,800), Heavy and Civil
            Share of Total Construction Employment - South                                                          Engineering Construction (+2,300).
                                  AustraliaCommercial
                               Housing                   Civil
         50.0%Share
               Share of TotalConstruction
                     of Total Construction   Employment
                                          Employment, South-Australia
                                                               South
                                     Australia
         40.0%Share of Total Construction Employment - South
           50.0%
                                   Australia
% of total

         30.0%
           40.0%
           50.0%
         20.0%
            of total

           30.0%
           40.0%
         10.0%
          total

           20.0%
           30.0%
     % of %

             0.0%
              10.0%
              20.0%
                            Aug-87

                                       Aug-89

                                                             Aug-91

                                                             Aug-93

                                                             Aug-95

                                                             Aug-97

                                                             Aug-99

                                                             Aug-01

                                                             Aug-03

                                                             Aug-05

                                                             Aug-07

                                                             Aug-09

                                                             Aug-11

                                                             Aug-13

                                                             Aug-15

                                                             Aug-17

                                                             Aug-19

                   0.0%
                  10.0%
                                     Aug-87

                                                Aug-89

                                                        Aug-91

                                                        Aug-93

                                                        Aug-95

                                                        Aug-97

                                                        Aug-99

                                                        Aug-01

                                                        Aug-03

                                                        Aug-05

                                                        Aug-07

                                                        Aug-09

                                                        Aug-11

                                                        Aug-13

                                                        Aug-15

                                                        Aug-17

                                                        Aug-19

                       0.0%                                       Housing       Commercial      Civil
                                 Aug-87

                                            Aug-89

                                                    Aug-91

                                                    Aug-93

                                                    Aug-95

                                                    Aug-97

                                                    Aug-99

                                                    Aug-01

                                                    Aug-03

                                                    Aug-05

                                                    Aug-07

                                                    Aug-09

                                                    Aug-11

                                                    Aug-13

                                                    Aug-15

                                                    Aug-17

                                                    Aug-19

                                                                    Housing       Commercial       Civil
     Source: ABS
                                     Total Employment
                                               Housing - Construction
                                                          Commercial  South
                                                                       Civil Australia

             80.0
                                         Total Employment - Construction South Australia
                                         Total Employment - Construction South Australia
                                        Total Employment - Construction, South Australia
             70.0
               80.0
             60.0
               80.0
               70.0
             50.0
               70.0
               60.0
             40.0
000s

               60.0
               50.0
             30.0
               50.0
               40.0
      000s

             20.0
               40.0
    000s

               30.0
             10.0
               30.0
               20.0
              0.0
               20.0
               10.0
                           Aug-87

                                           Aug-89

                                           Aug-91

                                           Aug-93

                                    Aug-95 Aug-95

                                    Aug-97 Aug-97

                                    Aug-99 Aug-99

                                    Aug-01 Aug-01

                                    Aug-03 Aug-03

                                    Aug-05 Aug-05

                                    Aug-07 Aug-07

                                           Aug-09

                                           Aug-11

                                           Aug-13

                                           Aug-15

                                           Aug-17

                                           Aug-19

               10.0
                 0.0
                 0.0
                                Aug-87

                                      Aug-89

                                      Aug-91

                                      Aug-93

                                      Aug-95

                                      Aug-97

                                      Aug-99

                                      Aug-01

                                      Aug-03

                                      Aug-05

                                      Aug-07

                                      Aug-09

                                      Aug-11

                                      Aug-13

                                      Aug-15

                                      Aug-17

                                      Aug-19
                              Aug-87

                                    Aug-89

                                    Aug-91

                                    Aug-93

                                    Aug-09

                                    Aug-11

                                    Aug-13

                                    Aug-15

                                    Aug-17

                                    Aug-19

     Source: ABS

      12               |         CITB Economic Update September 2019
Aug 18                          Jul 19                         Aug 19             overall trend labour force underutilisation rate
                            trend        s.a.              trend            s.a.      trend         s.a.        (those who are unemployed and those who want
             NSW             4.7         4.6                4.5             4.4             4.5     4.3         more hours) was 15.9% in August, up from 15.1%
             VIC             4.7         4.7                4.8             4.8             4.9     4.9         a year earlier. In August, the national
             QLD             6.1         6.3                6.4             6.4             6.4     6.4         underutilisation rate was 13.8%.
             SA              5.5         5.6                6.6             6.9             6.8     7.3
             WA              6.2         6.4                5.9             5.9             5.8     5.8         PARTICIPATION
             TAS             5.9         5.9                6.6             6.0             6.6     6.4
             AUST            5.2         5.3                5.2             5.2             5.3     5.3         In trend terms, the participation rate in South
             UNDEREMPLOYMENT                                                                                    Australia rose from 63.6% in July to 63.7% in
                                                                                                                August. Nationally, the participation rate rose
                                   Unemployment Rates (%)                                                                ABS Labour Force - August 2019, Cat.
                                                                                                                from 66.1% in July to 66.2% in August—see
outh         Underemployed    workers are those
                     CHART 3: UNEMPLOYMENT       who
                                             RATES (%)are                                                                No. 6202.0
              9
             employed part-time and who want, and are                                                           Chart 4.
 gust.
             available for, more hours of work than they                                                                           CHART
                                                                                                                               Analysis and4: LABOUR
                                                                                                                                            charts fromFORCE
                                                                                                                                                        Department of Treasury and
m
                                                                                                                                   PARTICIPATION     RATES (%)
                                                                                                                               Finance, Economic Briefing.
nd           currently
              8        have.                                                                                     67
                                                                                                                                      TREND
                                          SOUTH AUSTRALIA
                                                                                                                               •      SEASONALLY
                                                                                                                                      During      ADJUSTED
                                                                                                                                             August, the unemployment rate: was 6.8%
             The trend underemployment rate in South                                                             66
               7                                                                                                                      in South Australia in trend terms (5.3% nationally);
             Australia was 9.1% in August. As a result the                                                                            and was 7.3% in South Australia in seasonally
19           overall trend labour force underutilisation rate                                                                         adjusted terms (5.3% nationally).
                                                                                                                 65
  s.a.       (those
               6    who are unemployed and those who want                                                                      •      Annual trend employment growth was 1.5% for
             more hours) was 15.9% in August, up from 15.1%                                                                           South Australia and 2.5% nationally.
                                                                                                                                      AUSTRALIA
  4.3                                                                                                            64
  4.9        a year earlier. In August, the national
                       AUSTRALIA                                                                                               •      In trend terms, the unemployment rate in South
               5
             underutilisation  rate was 13.8%.                                                                                        Australia rose
                                                                                                                                            SOUTH    from 6.6% in July to 6.8% in August.
                                                                                                                                                    AUSTRALIA
  6.4                                                                                                            63                   Nationally, the unemployment rate rose from 5.2%
                                TREND
  7.3                                                                                                                                 in July to 5.3% in August.
                                SEASONALLY ADJUSTED
  5.8        PARTICIPATION
              4
                                                                                                                 62
                                                                                                                               Other commentary on employment and
                Aug-14

                              Aug-15

                                                Aug-16

                                                                                   Aug-18

                                                                                                  Aug-19
                                                                  Aug-17

  6.4
  5.3        In trend terms, the participation rate in South                                                                   unemployment indicators
                                                                                                                 61
             Australia   rose from 63.6% in July to 63.7% in
              Source: Charts reproduced from Department of Treasury and
                                                                                                                      Aug-14

                                                                                                                                                Aug-16

                                                                                                                                                         Aug-17

                                                                                                                                                                              Aug-19
                                                                                                                                   Aug-15

                                                                                                                                                                    Aug-18
             August.
             In         Nationally,
                 seasonally
              Finance.                 the participation
                                 adjusted    terms, Southrate      rose
                                                               Australia’s                                                     “Unemployment Rises Further – Data Wrap”,
             from 66.1% in July
             unemployment             torose
                                   rate   66.2%  in August—see
                                              from   6.9% in July to 7.3%                                                      South Australian Centre for Economic Studies 20
                                                                                                                               September
             Chart
             in      4. Australia’s unemployment rate rose
                 August.
                       Labour Force Participation Rates (%)                                                     In seasonally
                                                                                                                         •      adjusted
                                                                                                                              South         terms,
                                                                                                                                     Australian       the South
                                                                                                                                                 unemployment  rate confirmed as
             from 5.2% in CHARTJuly to 4:
                                        5.3%  in August.
                                          LABOUR    FORCE
                                                                                                                              highest in therate
                                                                                                                Australian participation     nation.
                                                                                                                                                   rose 0.3 of a
              67
                                   PARTICIPATION RATES (%)
                                                                                                                         • point
                                                                                                                percentage    SouthtoAustralia’s
                                                                                                                                       63.9% in  trend unemployment
                                                                                                                                                    August.          rate rose
                                                                                                                                                            Nationally,
                          TREND the youth (15-24 year old)
             In South Australia,                                                                                              by 0.2 percentage points to 6.8 per cent in August
             unemployment    rate wasADJUSTED
                          SEASONALLY  13.9% in the year to                                                      the participation rate rose 0.1 of a percentage
                                                                                                                              2019, according to ABS Labour Force Survey data.
              66
             August, up from 13.2% a year earlier and above                                                     point to 66.2%.
                                                                                                                              In comparison, the national unemployment rate
                                                                                                                                      rose by 0.1 percentage points to 5.3 per cent.
             the 11.6% rate recorded nationally (annual
              65                                                                                                               •      South Australia’s trend unemployment rate in
             average terms).
                                                                                                                                      August was the highest of any state and territory.
                                   AUSTRALIA                                                                                          The other states with relatively high unemployment
              64                                                                                                                      rates were Tasmania (6.6 per cent) and Queensland
                                                                                                                                      (6.4 per cent).
                                          SOUTH AUSTRALIA
              63                                                                                                               •      The recent increase in South Australia’s
              Commercial and Economics Branch                                                                                         unemployment rate has been primarily driven
                                                                                                                                      by more people looking for work rather a
              19 September 2019
              62                                                                                                                      deterioration in employment, and this pattern
Aug-19

              Public – I2 – A1                                                                              2                         continued in August. The trend participation rate
                                                                                                                                      rose by 0.1 percentage points to 63.7 per cent in
              61                                                                                                                      August, its highest level since February 2009.
                   Aug-14

                                                  Aug-16

                                                                   Aug-17

                                                                                                   Aug-19
                                Aug-15

                                                                                    Aug-18

 ia’s
o 7.3%
             Source: Charts reproduced from Department of Treasury and
se            Finance.
             In  seasonally adjusted terms, the South
             Australian participation rate rose 0.3 of a
 )           percentage point to 63.9% in August. Nationally,
             the participation rate rose 0.1 of a percentage
ove          point to 66.2%.

         2
                                                                                                                                            CITB Economic Update September 2019        |     13
•       However, a slowdown in the rate of employment growth has                      greater than it is today.
        also placed upward pressure on the unemployment rate. In
        the three months to August 2019 total employment barely                 •     The data is another symptom of the fallout from a consistent
        rose, whereas in the three months to May 2019 it rose by 0.5                  slide in dwelling approvals, which have seen dramatic falls in
        per cent. Hence the current rate of job creation is not enough                the 2018 and 2019 financial years.
        to keep pace with population growth.                                    •     Approvals apartment and house approvals nationally have
•       A notable feature of South Australia’s recent labour market                   slumped 47.3 per cent and 11.7 per cent respectively over
        performance is that females have fared much better than                       the past two years.
        males. This trend persisted in August, with total male                  •     The news also came as ASIC released data showing the
        employment falling by 1,200 persons, whereas total female                     downturn was sparking the failure of many more businesses,
        employment rose by 1,400 persons. The male unemployment                       with 556 construction companies going bust in 2018-19 in
        rate rose to 7.5 per cent, to be well above the female                        NSW – 101 more than in 2017-18.
        unemployment rate of 6.0 per cent, which also rose slightly.
                                                                                •     Jobs vacancy data, backed up the bad news for the
•       Despite the recent rise in unemployment for South Australia                   construction sector showing a 1.3 per cent decline in new job
        there are some positives beyond the marked improvement in                     listings over the past quarter, suggesting the growth in jobs
        labour force participation. Total employment rose solidly over                generally was also slowing.
        the past year despite the recent slowdown in job formation
        (up 1.5 per cent), while gains in full-time employment over             •     The high rate of underemployment suggests businesses
        this period (up 1.5 per cent) have also been retained. The                    were “trying to keep on good workers but are doing that by
        employment-to-population ratio (59.4 per cent) also remains                   reducing hours”, according to the article.
        near its more than six year high.                                       •     Callum Pickering (from Indeed) said the widely expected
“Construction jobless hits high, as the downturn bites”                               employment windfall of major infrastructure projects, to
Article Published in New Daily, 26 September                                          pick up the slack from falling residential construction, wasn’t
                                                                                      coming true.
Note: This is national ABS data. Underemployment is the measure
of how many of those working in a sector would like to have more                •     “What we’re seeing here is that a lot of these big infrastructure
work.                                                                                 projects are capital-intensive but not labour-intensive –
                                                                                      residential construction is labour-intensive,” he said.
•       Underemployment in construction is close to hitting an
        all-time high nationally, as the sector shows further signs of          •     Steve Jovcevski, Mozo’s property expert and a property
        the impact of the nation’s economic slowdown.                                 developer in Sydney, told The New Daily things weren’t
                                                                                      looking good for construction, but that wasn’t unexpected.
•       Data released by the Australian Bureau of Statistics found                    “We were building so many apartments in Sydney and
        underemployment in the construction sector has hit 81,100                     Melbourne it was getting to an area of oversupply,” he said. “The
        workers – or 6.9 per cent of the workforce.                                   industry is in holding mode. If things do pick up, then all well and
                                                                                      good, but if they don’t, they’ll look at sacking staff.”

•       The figure is among the highest underemployment in
        construction since the ABS began collecting the data – only
        twice since 1991 has underemployment in construction been

                                            Index    Monthly                                            Vacancy Report - August
                                                                    Yearly %         Number of job
            IVI - August 2019            (Jan ‘06         %
                                                                     change         advertisements
                                                                                                        2019, Australian Government
                                           = 100)    change                                             Department of Employment,
    New South Wales                          80.7            -0.7      -12.1                59,100      Skills, Small and Family Business
    Victoria                                 91.4            -0.2        -7.4               46,000
                                                                                                        •    Over the year to August 2019, job
    Queensland                               63.7            0.2         -2.5               31,600           advertisements decreased in three
                                                                                                             states and the Northern Territory. New
    South Australia                          59.4            0.6          3.0                7,800           South Wales recorded the strongest
                                                                                                             decline (down by 12.1%), followed
                                                                                                             by Victoria (7.4%) and the Northern
    Western Australia                        88.7            0.7          1.6               16,300
                                                                                                             Territory (4.3%). By contrast, the
                                                                                                             strongest rises in job advertisements
    Tasmania                                 67.8            1.1         11.3                2,000
                                                                                                             were recorded in the ACT (up by 11.9%)
                                                                                                             and Tasmania (11.3%).
    Northern Territory                       72.1            0.6         -4.3                1,800

    Australian Capital Territory           181.9             0.9         11.9                5,900

    Australia                                79.7            -0.1        -6.0              170,500

Source: Department of Employment, Skills, Small and Family
Business, Vacancy Report 2019.

14     |       CITB Economic Update September 2019
WA                    2,615.8              26.0             1.0
                                                                                                                          TAS                     533.3               6.4             1.2
FURTHER ANALYSIS                                                                                                          NT                      245.6              -1.1             -0.4
                                                                                                                          ACT                     425.7               6.9             1.7
South Australia’s population rose by 0.3% during                                                                          AUS*                 25,287.4            388.8              1.6
the March quarter 2019, to be 0.9% higher than a                                                                         *Includes Christmas Island, the Cocos Islands and Jervis Bay.
year ago. Nationally, population rose by 0.5% in the
                                                                                                                         In the 12 months to March 2019 the largest
March quarter 2019 and was 1.6% higher than a
                                                                                                                         contribution to South Australia’s population
year earlier—see Chart 1.
                                                                                                                         growth came from net overseas migration, which
 POPULATION ESTIMATES                                                                                                    totalled 13,700 persons, up 8.4% from the previous
                        Annual Population Growth                                                                         12 ABS   Population
                                                                                                                              months.     NaturalEstimates
                                                                                                                                                      increase - over
                                                                                                                                                                 Marchthe  Quarter
                                                                                                                                                                               period
                   CHART 1: ANNUAL POPULATION GROWTH
 2.4%
                                                                                                                            2019,5,200,
                                                                                                                         totalled    Cat. No.up3101.0
                                                                                                                                                   1.6% from the previous 12
                                                                                                                         months. In the year to March 2019, there was a net
                                                                                                                            Analysis and
                                                                                                                         interstate       Charts of
                                                                                                                                      outflow     from4,000
                                                                                                                                                        Department of Treasury
                                                                                                                                                              people    from andSouth
                                                                                                                            Finance, Economic Briefing.
 2.0%                                                                                                                    Australia, 29% lower than in the previous 12
                                                                                                                            •    During the year to March 2019, South Australia’s
                                                                                                                         months—see       Chart 2.
                                                                                                                                 Estimated Resident Population (ERP) increased 0.9% (or
                                                                                AUSTRALIA
                                                                                                                                       14,800 persons) to 1,748,630 people.
 1.6%                                                                                                                        •         Nationally, the ERP increased 1.6% to 25,287,400
                                                                                                                                       people.

 1.2%
                                                                                                                                                                   Mar 19 vs        Mar 19 vs
                                                                                                                                                      Mar 19
                                                                                                                                                                    Mar 18           Mar 18
                                                                                                                                                      (‘000)
                                                                                                                                                                    (‘000)             %

 0.8%                                                                                                                            NSW                  8,071.1        114.1             1.4

                                                                                                                                 VIC                  6,566.2        133.5             2.1
                                                                    SOUTH AUSTRALIA                                              QLD                  5,076.5         88.1             1.8
 0.4%
                                                                                                                                 SA                  1,748.6          14.8             0.9
                                                                                                                                 WA                   2,615.8         26.0             1.0
 0.0%                                                                                                                            TAS                  533.3           6.4              1.2
                                         Mar-12

                                                           Mar-14

                                                                             Mar-16
          Mar-09

                     Mar-10

                               Mar-11

                                                  Mar-13

                                                                    Mar-15

                                                                                      Mar-17

                                                                                                Mar-18

                                                                                                          Mar-19

                                                                                                                                 NT                   245.6           -1.1             -0.4
                                                                                                                                 ACT                  425.7           6.9              1.7
 Source: ABS
                                                                                                                                 AUS*                25,287.4        388.8             1.6
Population growth over the year by jurisdiction,
from highest to lowest was: Victoria (2.1%),                                                                                 *Includes Christmas Island, the Cocos Islands and Jervis Bay.
      Components  of South Australian Population Change
Queensland     (1.8%),
             CHART       the ACT (1.7%),
                     2: COMPONENTS            New
                                        OF SOUTH
                (Moving Annual Totals, ‘000s)
                                                    South                                                                    Commentary on General Economic
             AUSTRALIAN    POPULATION     CHANGE
Wales (1.4%), Tasmania (1.2%), Western Australia
              (MOVING ANNUAL TOTALS, '000s)                                                                                  Conditions (various analysis)
(1.0%),
   30   South Australia (0.9%) and the Northern
Territory (-0.4%). TOTAL                                                                                                     ABS National Accounts – June Quarter 2019, Cat. No.
                                          NATURAL INCREASE                                                                   5206.0: Analysis from Department of Treasury and
  25
                                          NET OVERSEAS MIGRATION                                                             Finance, Economic Briefing and other analyses.
                                          NET INTERSTATE MIGRATION
                                                                                                                             •         The figures show the worst annual economic growth for
  20
                                                                                                                                       18 years nationally.
Commercial and Economics Branch
                                                                                                                             •         ABS data shows the national economy grew by 0.5% in
1915
   September 2019
                                                                                                                                       the June quarter in seasonally adjusted terms and 0.4%
Public – I2 – A1                                                                                                     1                 in trend terms. Through the year the growth was 1.4%
                                                                                                                                       seasonally adjusted and 1.5% in trend terms.
  10
                                                                                                                             •         Nationally, government consumption rose by 2.7% in
                                                                                                                                       the June quarter and household consumption spending
   5                                                                                                                                   rose by 0.4%. Recording falls in the quarter were:
                                                                                                                                       dwelling investment (down 4.4%); public investment
                                                                                                                                       (down 2.3%); and new business investment (down 0.4%).
   0
                                                                                                                             •         South Australia’s state final demand contracted by 0.2
                                                                                                                                       per cent in seasonally adjusted terms, with only the
   -5                                                                                                                                  Northern Territory recording a worse performance.
                                                                                                                             •         In real trend terms, South Australian State Final Demand
  -10
                                                                                                                                       was unchanged in the quarter but was 0.8% higher than
                                                                                                                                       a year earlier.
        Mar-09

                   Mar-10

                              Mar-11

                                        Mar-12

                                                  Mar-13

                                                           Mar-14

                                                                    Mar-15

                                                                             Mar-16

                                                                                       Mar-17

                                                                                                 Mar-18

                                                                                                            Mar-19

                                                                                                                             •         The ABS said South Australia’s state final demand
                                                                                                                                       performance included weakness in non-dwelling
 Source: ABS                                                                                                                           construction (down – 6.6 per cent), which was driven by
                                                                                                                                       falls in energy-related projects.

 Next release of ABS cat. no. 3101.0 is 19 December
 2019                                                                                                                                          CITB Economic Update September 2019            |   15
You can also read