Corporate sector vulnerabilities during the Covid-19 outbreak: assessment and policy responses - Free
←
→
Page content transcription
If your browser does not render page correctly, please read the page content below
1 Corporate sector vulnerabilities during the Covid-19 outbreak: assessment and policy responses 5 May 2020 This brief investigates the financial vulnerability of non-financial firms associated with confinement measures introduced in most world economies to tackle the Coronavirus (COVID-19) epidemic. Based on empirical simulations, it evaluates the extent to which firms may run into a liquidity crisis and discusses the immediate steps that governments can take to reduce the risks and depth of such crisis, ensuring that it does not turn into a solvency crisis. CORPORATE SECTOR VULNERABILITIES DURING THE COVID-19 OUTBREAK… © OECD 2020
2 Introduction The health crisis caused by the COVID-19 outbreak has led public authorities to take unprecedented measures to contain the propagation of the virus. Administrative business shutdowns, quarantines and restrictions on mobility and social contact have brought large parts of our economies almost to a standstill (OECD, 2020a). Sales across many sectors are plummeting. Nevertheless, financial commitments with respect to suppliers, employees, lenders and investors remain, depleting liquidity buffers of firms. The sharp reversals in earnings expectations for companies has significantly weakened their projected interest coverage and profitability ratios (OECD, 2020b). The large number of firms that are simultaneously affected constitutes a major challenge. Producers of intermediate goods or services experience also a drop in sales even if confinement measures do not require them to shut down. Since many firms along supply chains face liquidity shortfalls, trade credit losses may increase, further adding to cash flow pressures. The liquidity crisis may turn into a global corporate solvency crisis. With much less or no incoming revenues for an extended period of time and fewer options to deal with this shortfall, the long-term viability of firms is impaired, and firm voluntary closure and bankruptcies may follow. Human and organisational capital would be eroded and may vanish with defaults of firms that prior to the virus outbreak were profitable and with healthy balance sheets. Global value chains will be disrupted if highly integrated firms have to exit the market. High uncertainty about the future course of the economy will reduce corporate investment and consumption demand. As a result, a corporate solvency crisis could have serious long-term negative effects on our economies by dragging down employment, productivity, growth and well-being. The risk of a financial crisis is high. In the absence of a robust policy response, corporate defaults of a significant number of firms would undermine balance sheets of banks and institutional investors. This could dry up markets for debt and equity financing, and might feed a self-reinforcing downside spiral in the corporate sector, in turn significantly increasing the likelihood of a crisis. Moreover, bankruptcies across a wide set of firms combined with bailouts by government of systemic firms might decrease competition, with consequences for productivity growth down the line. Awareness of these risks has lead governments to adopt a range of emergency measures aimed at supporting firms’ liquidity. Aside from monetary measures taken by central banks, fiscal interventions include direct and indirect financing of the wage bill (including by extending the coverage and increasing the unemployment benefit replacement rate, short-term work schemes and temporary unemployment benefits), tax deferrals, debt moratoria and extension of state loan guarantees. This note evaluates the risk of a widespread liquidity crisis using a cross-sector sample of almost one million European firms and discusses the pros and cons of different kinds of public support measures. The note focuses on the first-round effects of the containment measures induced by the crisis, abstracting from the potential cascading effects via supply chains (including global value chains), financial interconnections between firms and financial distress in the banking system – other than those implicitly assumed in the size of the sectoral shocks – as well as from the structural adjustments that will be needed in a second phase of the response to the crisis. Further work will attempt to explore more explicitly these effects in future notes. Based on illustrative assumptions regarding the evolution of sales and elasticities of costs to sales, the note sheds light on the risk of corporate insolvency.1 Comparing the share of firms that would turn illiquid under a no-policy change scenario and under policy intervention, results emphasizes the key role of policies to avoid massive unnecessary bankruptcies. 1 The methodology is similar to the one used by Schivardi and Romano (2020) for the case of Italy, and is based on a number of assumptions detailed in the remainder of the note. It is also close in spirit to De Vito and Gomez (2020). CORPORATE SECTOR VULNERABILITIES DURING THE COVID-19 OUTBREAK… © OECD 2020
3 Four main findings stand out: Without any policy intervention, 20% of the firms in our sample would run out of liquidity after one month, 30% after two months and 38% after three months. If the confinement measures lasted seven months, more than 50% of firms would face a shortfall of cash. This result is mainly driven by the impact of the confinement in the most hit sectors. Firms facing a high risk of liquidity shortfalls are mostly profitable and viable companies. However, a sizeable share of these firms do not have enough collateral to bridge a shortfall in liquidity with additional debt and/or are too highly leveraged to bridge the crisis through further bank loans. Among the wide and complementary range of measures introduced by OECD countries, direct and indirect support to wage payments seems to be the most critical policy to curb the liquidity crisis, given the high share of wage costs in total spending. Adding up different policy measures (tax deferral, debt moratorium and wage subsidies at 80% of the wage bill), our simulation suggests that after two months government interventions would decrease the share of firms running out of liquidity from 30% to 10% compared to the non-policy scenario. The risk of liquidity shortages is high for a large portion of firms Size and dynamics of the economic shocks Measures on social distancing and mobility restrictions dramatically affect services involving direct contact between customers and providers, activities gathering people in public and private places, travelling, as well as non-essential manufacturing and construction activities involving close physical contact among workers. Activities that can be undertaken remotely or automatized are relatively less affected — to the extent that the supply chain is not broken and consumer demand can be maintained, at least in part. It follows that the decline in activity is assumed to be different across sectors but identical across countries. The analysis covers all manufacturing and non-financial services sectors.2 Consistent with OECD (2020a), the following decline in output is assigned to a set of severely hit sectors: 100% in manufacturing of transport equipment (ISIC V29-30), real estate services (VL), arts, entertainment and recreation (VR) and in other service activities (VS); 75% in wholesale and retail trade (VG), air transport (V51), and accommodation and food services (VI); and 50% in construction (VF) and professional service activities (VM).3 For the other non-financial sectors a conservative 15% revenues shock is assumed, while providing sensitivity analyses assuming a larger decline (e.g., 30% shock). Three alternative scenarios are considered with respect to the duration of the shock. 2 More specifically, it covers all economic sectors except the followings (Nace Rev.2 classification): agriculture (VA), mining (VB), financial (VK), public administration (VO), education (VP), human health (VQ) and activities of households and organizations (VT and VU). 3 The assumptions on the decline in revenues in the most hit sectors are based on qualitative information from the OECD Policy Tracker. CORPORATE SECTOR VULNERABILITIES DURING THE COVID-19 OUTBREAK… © OECD 2020
4 A “prolonged confinement” scenario, which projects the evolution of firms’ liquidity positions month by month since the start of the confinement, hence being agnostic on its length and avoiding modelling the recovery. A “unimodal” scenario, which foresees a sharp drop in activity lasting two months, followed by a four-month progressive recovery and a return to pre-crisis activity levels from the seventh month after the start of the epidemic. A “bimodal” scenario, which overlaps with the unimodal scenario for the first seven months but then models a second outbreak from the eight month onwards.4 The “unimodal” and “bimodal” scenarios have the advantage of being potentially closer to the predicted evolution of the epidemic and consequent confinement over time. However, the stylised “prolonged confinement” scenario provides a neat overview of firms’ resilience in a simpler way, relying on a smaller set of assumptions on the path of the recovery and, therefore, it is used as the baseline throughout the note. Methodology to evaluate firms’ liquidity position during the COVID-19 crisis The approach relies on financial statements of non-financial corporations from the Orbis database, provided by the consulting firm Bureau Van Dijk, which collects balance sheets data on both listed and unlisted firms worldwide. To ensure firms’ comparability across countries and sectors, the data are treated according to Gal (2013) and Kalemli-Ozcan et al. (2015). The data also excludes very small firms - those having less than 3 employees - to avoid concerns related to the quality of the data. The final sample consists of 974,944 unique firms, operating in both manufacturing and business non-financial services industries.5 At present, Orbis is the largest cross-country firm-level dataset available and accessible for economic and financial research. However, it does not cover the universe of firms, and the extent of the coverage varies considerably across countries.6 To deal with these limitations, the note focuses on 16 relatively well- covered European countries, and purposely avoids in depth cross-country comparisons, as well as the provision of absolute numbers on the aggregate depth of the shortfall. 7 Moreover, firms in Orbis are on average disproportionately larger, older and more productive than in the population, even within each size class. As these firms are on average healthier than their smaller, younger and less productive counterparts, the analysis is expected to deliver a lower bound for the liquidity shortages potentially affecting non- financial corporations. The study assumes that the last available data for each firm (end of 2016) represents its financial situation in normal times with respect to its average revenue, operating expenses, debt payment and taxes. The 4 See Table A.1 for the detailed dynamic of each scenario. In line with the assumptions made in the forthcoming OECD Economic Outlook, the sectoral implications of the second outbreak characterizing the “bimodal” scenario are assumed to be smaller than those of the initial confinement period (e.g., one half), taking into consideration that the rise in infections and the death toll are assumed to be less than in the earlier outbreak (e.g., increased hospital capacity and workers protection, better targeted social distancing measures). 5 See Table A.3 for firm-level basic descriptive statistics. 6 For a detailed discussion of Orbis coverage and representativeness, see Bajgar et al. (forthcoming). 7 Due to data availability, countries included in the sample are: Belgium, Denmark, Estonia, Finland, France, Germany, Hungary, Ireland, Italy, Latvia, Portugal, Romania, Slovenia, Spain, Sweden and the United Kingdom. See Table A.2 for details on the number of firms by country. CORPORATE SECTOR VULNERABILITIES DURING THE COVID-19 OUTBREAK… © OECD 2020
5 economic shock from measures of social distancing is modelled as a change in firms’ operating cash flow, resulting from the decline in sales and firms’ limited ability to fully adjust their operating expenses. To reflect this adjustment capacity, elasticities of intermediate costs to sales and of the wage bill to sales are estimated by assuming, for simplicity, that they are identical and constant across countries and sectors. Each month, firms’ shock-adjusted cash-flow (assuming zero investment spending) is determined as follows:8 ℎ = (1 − ) ∗ − (1 − ∗ ) ∗ (1) − (1 − ∗ ) − − where , , refer, respectively, to the size of the shock in sector s in month t, the elasticity of intermediates cost to sales, and the elasticity of wage bill to sales. Firms’ sales, intermediate costs, wage bill, taxes and debt payments are annual values divided by 12 in order to obtain average monthly values. 9 The elasticities of intermediate inputs to sales and of the wage bill to sales are estimated through a panel regression analysis based on yearly data.10 The former is close to unity, while the latter is estimated around 0.4. As expected, these calculations suggest that firms have a higher ability to adjust intermediates consumption than the labour input. To take into account the fact that the ability to adjust is lower when looking at monthly rather than annual figures, in the spirit of Schivardi and Romano (2020), both elasticities are conservatively reduced to 0.8 and 0.2, respectively. Next, the liquidity available to each firm is calculated month by month as the sum of the liquidity buffer held at the beginning of the period and the shock-adjusted cash-flow, assuming zero investment spending: = ,( −1) + ℎ (2) where ,( −1) refers to the liquidity remaining from the previous month and is equal to a firm’s cash holdings in the first period. Firms face liquidity shortages when they run out of cash and are unable to cover operating expenses, taxes due and costs of existing debt. By running this exercise month by month, we evaluate the share of firms that may enter a liquidity crisis following the introduction of confinement measures.11 Importantly, this approach relies on the following assumptions: 8 The elasticity of costs to sales in the equation reflects the fact that a decrease in firm sales is partially passed over to suppliers. Therefore, the simple sum of the firms’ total fall in sales would not represent correctly their total need for liquidity. Notice that it is unclear how the inclusion of taxes may inflate or deflate the impact of the crisis. On the one side, it is likely that following a drop in sales, the amount of tax payed will be lower following the crisis. On the other side, without any policy action, firms are expected to pay taxes computed for a normal year. 9 The role played by trade credit and inventories is not taken into account in this scenario due to current data availability, although they may be important drivers of firms’ liquidity positions. The issue will be accounted for in future refinements of the analysis. However, notice that, though sizeable, the use of trade credit remains largely lower than the use of bank-based financing solutions (24% against 70% according to ECB, 2010). 10 More specifically, we regress the growth in revenues on either the growth of intermediates cost or the growth of the wage bill, controlling for all shocks at the country-sector level and for firms’ time-invariant characteristics (i.e., by including country by sector by year and firm fixed effects). 11 The exercise models liquidity shortfalls and does not allow to determine solvency of firms endogenously, i.e., within the framework of this model. Further, given that the sample also consists of non-listed firms, it is not possible to CORPORATE SECTOR VULNERABILITIES DURING THE COVID-19 OUTBREAK… © OECD 2020
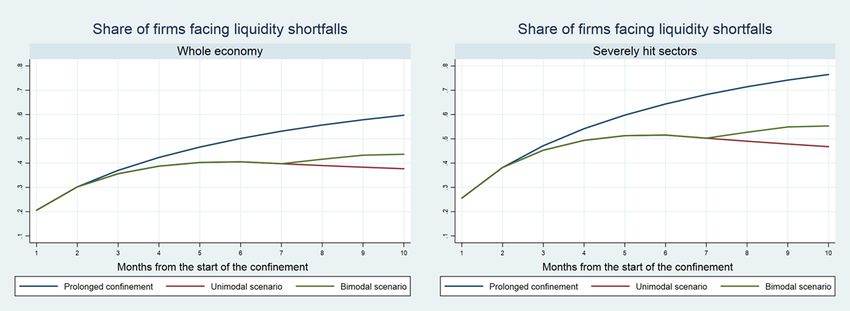
6 The sectoral distribution of the shock is assumed to be the same across countries. 12 The capacity of firms to adjust their operating expenses following an adverse shock is expected to be the same across countries, sectors and firms. Firms are not able to tap into external sources of working capital (e.g. short-term bank loans, trade credit) when facing a liquidity shortfall. Figure 1. Liquidity shortfalls without government intervention Note: The left panel shows the share of firms facing liquidity shortfalls over the whole sample, while the right panel focuses exclusively on the most severely hit sectors. Both panels consider three alternative scenarios: prolonged confinement (blue line), unimodal (red line), and bimodal (green line) scenario. The prolonged confinement scenario envisages a sharp drop in activities in each month considered, being agnostic on the length of the confinement and on the transition to normality. The unimodal scenario foresees a sharp drop in activity lasting two months, followed by a four-month progressive transition towards normality, and a return to pre-crisis activity levels from the seventh month after the start of the epidemic. The bimodal scenario overlaps with the unimodal scenario for the first seven months, but then models a second outbreak from the eight month onwards. The decline in output is assumed to be: between 50 and 100% in the most severely hit sectors -- manufacturing of transport equipment (ISIC V29-30), real estate services (VL), arts, entertainment and recreation (VR), other service activities (VS), wholesale and retail trade (VG), air transport (V51), accommodation and food services (VI), construction (VF) and professional service activities (VM); 15% in the other sectors. Source: OECD calculations based on Orbis® data. The main results (Figure 1, left panel) suggest that: in the absence of government intervention, 20% of firms in our sample would run out of liquidity after one month, 30% after two months, and around 35-38% (depending on the scenario considered) after three months. If the confinement lasted seven months, more than 50% of firms would face a liquidity shortfall in the “prolonged confinement” scenario. By contrast, assuming that the economic activity progressively resumes after three months of confinement, as in the “unimodal” and bimodal scenarios, the share of firms facing liquidity shortfall would instead amount to 40% after seven months, but would increase to 45% after 10 months in the case of a second confinement wave determine the cost of equity due to the absence of market prices for equity of non-listed firms. Subsequently, the analysis refrains from any implications on firm value, e.g. based on discounted future profits. 12 The COVID-19 crisis impact is certainly different across countries depending on the distribution of firms according to their liquidity positions, the type of social distancing measures introduced in each country, the input-output linkages and the country-specific policy responses. Looking deeper at those issues is something left for future notes. CORPORATE SECTOR VULNERABILITIES DURING THE COVID-19 OUTBREAK… © OECD 2020
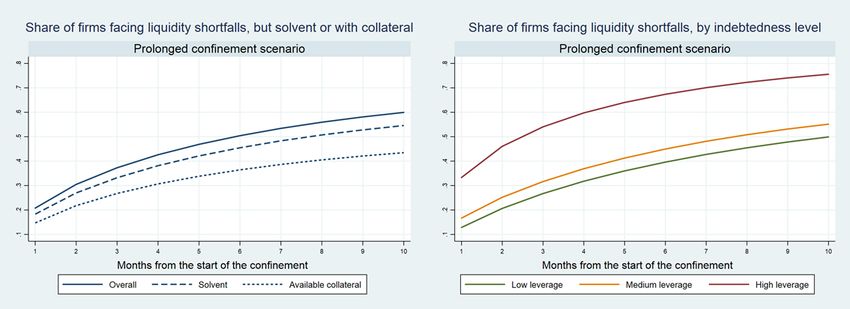
7 (“bimodal” scenario).13 The share of firms running out of liquidity is on average over time 10 percentage points higher when focusing on the most severely hit sectors (Figure 1, right panel); for instance, the share of illiquid firms would rise up to 70% (50%) in the “prolonged confinement” (“unimodal” or “bimodal”) scenario after seven months. Results are robust when allowing elasticities of costs to sales to vary at sectoral level: the highest discrepancy in terms of share of firms facing liquidity shortfalls is 2% (depending on the scenario considered) compared to the case of elasticities constant across sectors. It is important to stress again that these estimates are likely a lower bound given the sample bias towards healthier firms and the conservative assumptions made on elasticities. At the same time, to reflect the decision of most governments to provide cross-cutting support to firms in the first stage of the crisis, the simulations include also firms that would have faced liquidity shortfalls even in the absence of the COVID- 19 epidemic. After one month, the share of firms facing liquidity shortfalls in normal times ranges between 1.5% and 7%, depending on their ability to adjust when dealing with negative cash flows; it follows that, even when considering the 7% upper bound estimate, the COVID-19 crisis would imply an almost threefold increase in the share of firms experiencing liquidity shortages after one month. Overall, given that running into a liquidity shortfall may trigger bankruptcy of otherwise profitable firms, our findings emphasize that this firm-specific shock could have large and permanent adverse effects. Firms facing liquidity shortages are often solvent, but their access to additional debt financing may be limited due to low collateral Firms may run into a liquidity shortfall if their assets are not liquid enough to cover current expenses. However, they may still be solvent if the value of their assets is larger than the value of their liabilities or, equivalently, if they have collateral to pledge in order to obtain additional bank financing (Figure 2, left panel).14 Only a relatively small share of firms (around 10%) among those expected to face liquidity shortfalls would be close to insolvency when evaluating their overall net worth. At the same time, even though solvent, they might have difficulties in accessing new bank financing: around 28% of firms turning illiquid during the confinement would lack the collateral to tap into additional debt financing. Moreover, a decrease in valuations of assets during the confinement would decrease the value of firms’ potential collateral, thus further impair their ability to obtain funding. Similarly, and despite its development over the last two decades, also market-based financing from non-banks might be affected, as the price of traded debt rises in periods of acute market stress, and so does the business’ cost of financing (OECD, 2020c). Finally, highly-leveraged firms tend to have a higher probability to face liquidity shortages. Combined with the high uncertainty about sales and other incoming cash flows in the near future, this makes obtaining new loans more difficult (Figure 2, right panel). While these figures are based on several assumptions and must be interpreted with caution, they underline the merit of swift and decisive public intervention to safeguard companies and avoid potential bankruptcies of otherwise healthy companies. This intervention is crucial to avoid that the temporary shock implied by the COVID-19 crisis permanently scars the corporate landscape, with serious consequences for the shape of the recovery and long-run growth prospects. 13 The Annex also reports this additional set of results: assuming a decline in output of 30% (rather than 15%) in the other manufacturing and non-financial sectors (Figure A.1); for six countries among those with the best coverage in Orbis® (France, Hungary, Italy, Portugal, Spain, and Sweden) (Figure A.2). 14 Collateral is proxied by the difference between fixed assets and non-current liabilities. CORPORATE SECTOR VULNERABILITIES DURING THE COVID-19 OUTBREAK… © OECD 2020
8 Figure 2. Liquidity shortfalls without government intervention: solvency, collateral availability and indebtedness Note: The left panel plots the share of firms facing liquidity shortfalls: overall (solid line); but still potentially solvent, i.e., if the value of their assets is larger than the value of the liabilities (dashed line); having collateral to pledge to obtain additional bank financing, i.e., if the value of their fixed assets is larger than the value of their non-current liabilities (dotted line).The right panel plots the share of firms facing liquidity shortfalls by indebtedness level, i.e.: belonging to the lowest 1/3 of the leverage distribution within each (2-digits Nace Rev.2) sector (green line); belonging to the middle 1/3 of the leverage distribution within each sector (orange line); belonging to the highest 1/3 of the leverage distribution within each sector (red line). Leverage is measured as the ratio between financial debt (short- plus long-term debt) and total assets. The calculations are based on the prolonged confinement scenario. The prolonged confinement scenario envisages a sharp drop in activities in each month considered, being agnostic on the length of the confinement and on the transition to normality. Moreover, the decline in output is assumed to be: between 50 and 100% in the most severely hit sectors (see above the text for details); 15% in the other sectors. Source: OECD calculations based on Orbis® data. Public policies to reduce liquidity shortages and curb bankruptcy risk Countries have already introduced a wide range of measures to help firms dealing with the disruptions associated with COVID-19 (see Box 1). The simple accounting model described above is used to illustrate the expected impact of stylised policy interventions in three areas:15 Deferral of tax. To support business during the epidemic, several countries have introduced tax deferrals. The tax deferral is modelled as the moratorium of the (hypothetical) monthly tax payments.16 Financial support for debt repayment. A large number of countries have also established legislative frameworks that temporarily allow firms to postpone their debt payments or alternatively, that offer State guarantees to facilitate access to short-term debt facilities. The potential impact of such policies is modelled as a moratorium on short-term debt. Temporary support to wage payments. A critical response to avoid widespread liquidity shortfalls consists of relaxing firms’ financial commitments vis-à-vis their employees. Schemes such as a 15 Note that in many countries policy responses may depend on firms’ characteristics, such as size, and may be targeted differently according to sectoral features (e.g., exposure to the shock). However, given that governments are continuously developing their actions, at this stage it would be very difficult to quantify these heterogeneities with the information available. 16 It is worth noting that the deferral of tax might not have a large impact in a period where sales and profits are expected to be limited. Moreover, due to data availability, the analysis does not allow distinguishing different types of taxes. CORPORATE SECTOR VULNERABILITIES DURING THE COVID-19 OUTBREAK… © OECD 2020
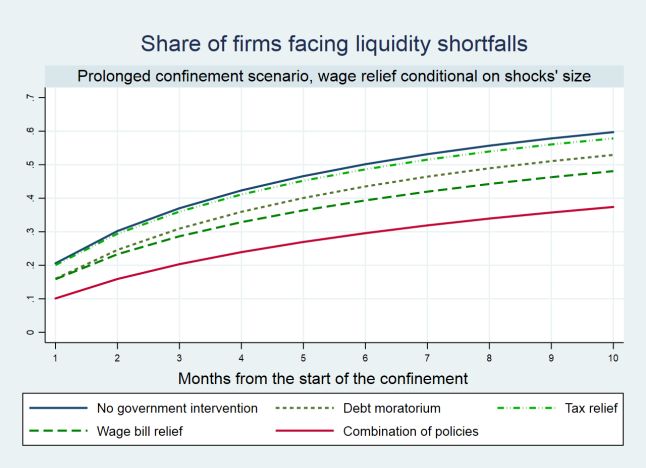
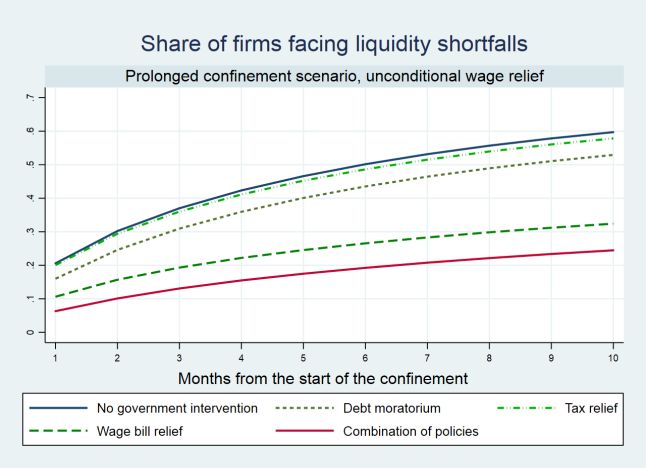
9 shortening of working time, wage subsidies, temporary lay-offs and sick leave have been introduced across countries, though in different combinations. All these measures reduce the wage bill firms have to pay. The labour support is modelled in two alternative ways: as an unconditional reduction of the wage bill by 80% in all sectors; 17 as a support adjusted to the sectoral size of the shock and modelled through an increase to 0.8 of the elasticity of wage bill to sales.18 Figure 3 and Figure 4 illustrate the extent to which each measure curbs the risk of a liquidity crisis compared to the no-policy intervention scenario. In particular, Figure 3 looks at the two alternative temporary supports to wage payments under the prolonged confinement scenario. Figure 4 further distinguishes between the unimodal and bimodal scenarios when assuming an unconditional reduction of the wage bill by 80% in all sectors.19 Tax deferral has the lowest impact on firms’ liquidity positions, followed by debt moratorium policies. Subsidies to the wage bill seem to be the most powerful measure (yet potentially costly), in line with the fact that wages and salaries are often a relevant component of operating expenses. Adding up the three different measures, public intervention after two months, for instance, would decrease the number of firms running out of liquidity from 30% to 10%. Figure 3. The impact of policies — alternative temporary supports to wage payments Note: The figure shows the share of firms facing liquidity shortfalls: in absence of policy intervention (blue solid line); in case of deferral of tax (green dash-dotted line); in case of a moratorium on short-term debt (green dotted line); in case of temporary support to wage payments (green dashed line); a combination of all the previous measures (red solid line). Short-term debt is defined as the amount of financial liabilities that are due within the year. The temporary support to wage payments (green dashed line) is assumed to be: in the left panel, an unconditional reduction of the wage bill by 80% in all sectors; in the right panel, a support adjusted to the sectoral size of the shock and modelled through an increase to 0.8 of the elasticity of wage bill to sales. The calculations are based on the prolonged confinement scenario. The prolonged confinement scenario envisages a sharp drop in activities in each month considered, being agnostic on the length of the confinement and on the transition to normality. Moreover, the decline in output is assumed to be: between 50 and 100% in the most severely hit sectors (see above the text for details); 15% in the other sectors. Source: OECD calculations based on Orbis® data. 17 According to the OECD tracker the amount of labour subsidy varies across countries between 60 to 100% of gross wage, with a great majority of countries providing a support ranging from 70% to 90%. This is the case for instance of Canada, Denmark, France, Netherland, Norway, Sweden and Japan. 18 Indeed, in some countries the support is targeted only to firms experiencing a sizeable shock in their activity. The elasticity implies that the support is ranging from 40% to 80% depending on the size of the sectoral shock. 19 Figure A.3 of the Annex shows results similar to Figure 4, but assuming a support to wage payments adjusted to the sectoral size of the shock and modelled through an increase to 0.8 of the elasticity of wage bill to sales. CORPORATE SECTOR VULNERABILITIES DURING THE COVID-19 OUTBREAK… © OECD 2020
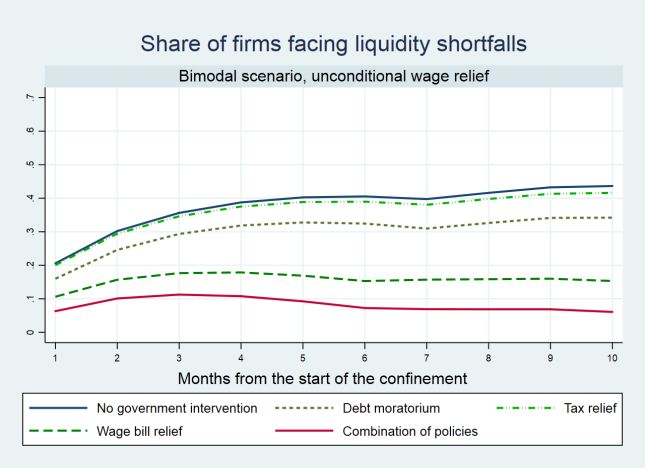
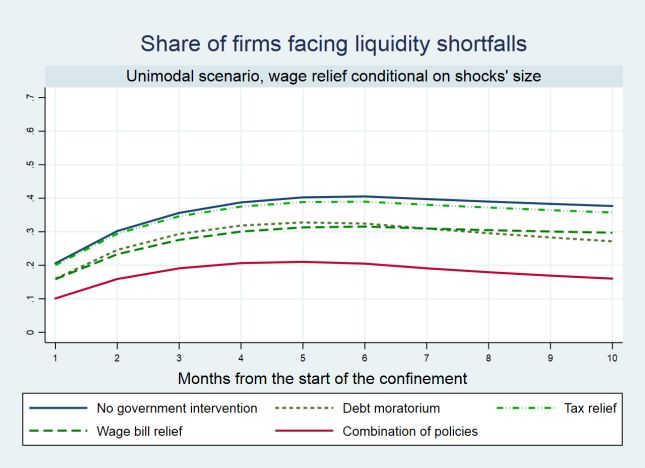
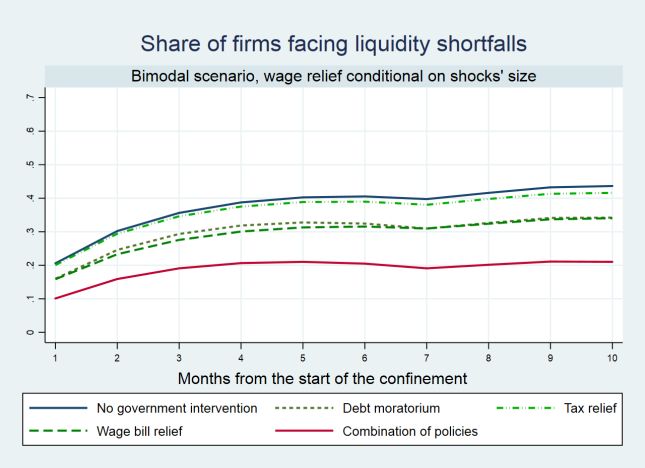
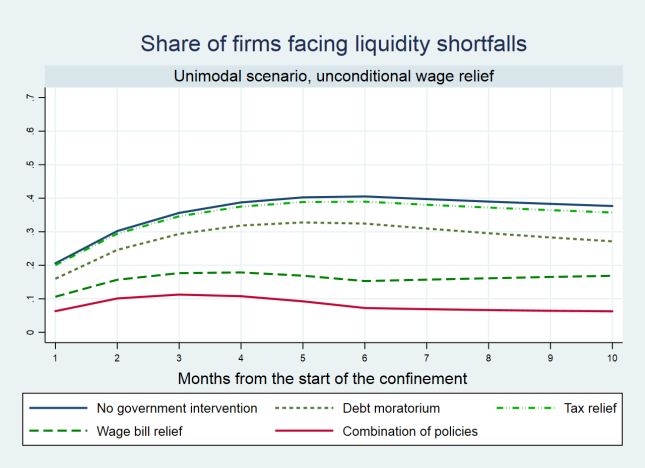
10 Figure 4. The impact of policies — alternative scenarios Note: The figure shows the share of firms facing liquidity shortfalls: in absence of policy intervention (blue solid line); in case of deferral of tax (green dah-dotted line); in case of a moratorium on short-term debt (green dotted line); in case of temporary support to wage payments, assuming an unconditional reduction of the wage bill by 80% in all sectors (green dashed line); a combination of all the previous measures (red solid line). Short-term debt is defined as the amount of financial liabilities that are due within the year. The left panel assumes a unimodal scenario, whereas the right panel a bimodal scenario. The unimodal scenario foresees a sharp drop in activity lasting two months, followed by a four-month progressive transition towards normality, and a return to pre-crisis activity levels from the seventh month after the start of the epidemic. The bimodal scenario overlaps with the unimodal scenario for the first seven months, but then models a second outbreak from the eight month onwards. The decline in output is assumed to be: between 50 and 100% in the most severely hit sectors (see above the text for details); 15% in the other sectors. Source: OECD calculations based on Orbis® data. Box 1. Measures adopted in OECD countries to support workers and firms in the wake of the COVID-19 crisis This box provides some examples of concrete measures OECD economies have implemented to support workers and companies through the COVID-19 crisis. The OECD Covid tracker gives a more detailed overview of country-level health and economic measures adopted. Tax policy measures to tackle the COVID-19 crisis are summarised in the Tax Policy Database in Response to COVID-19 Pandemic (OECD, 2020d). Additionally, several OECD economies have introduced policy responses targeted specifically at SMEs (OECD, 2020e). Many OECD countries subsidize temporary reductions of hours worked in firms impacted by confinement measures. Austrian authorities, for example, support wages of workers in all sectors (except public service) of up to 90% of the net salary. The scheme allows to temporarily reduce the number of hours worked to zero, however, workers are required to work at least 10% of the working- time calculated over the full period in which the firms receives support through the short-time working scheme. The maximum period of support through short-term work is three months (and might be extended to six months if necessary). The total amount taken over by the government varies with the gross salary. For gross salaries up to EUR 1,700, authorities pay 90% of the net salary. Workers with salaries below EUR 5,370 still receive 80% of their salary, whereas higher salaries are not subsidized. CORPORATE SECTOR VULNERABILITIES DURING THE COVID-19 OUTBREAK… © OECD 2020
11 Another set of measures consists of financial support for debt repayment. The Business Credit Availability Program (BCAP) in Canada, for example, supports access to financing during the COVID- 19 crises in various ways for firms across all sectors. Small businesses with up to CAD 1.5 million in total payroll costs in 2019 can receive interest-free loans up to CAD 40 000 to cover operating costs (e.g. utilities, payroll, rent, debt service). These loans are fully guaranteed by the public. One fourth of the loan is forgiven if it is repaid by the end of 2022. If not, the loan will be automatically converted to three year loan at 5 per cent interest. Larger businesses can tap additional bank-based debt financing up to a total loan amount of CAD 6.25 Million, guaranteed to up to 80% by the public. These loans comprise only operating costs and cannot be used to fund dividend payments, share repurchases and other shareholder payments, increases in the compensation of executives or to refinance or repay existing debt. Besides guaranteed loans, a couple of OECD countries directly subsidize firms' operating costs. Norway, for example, compensates Norwegian firms that suffered significant losses of turnover due to the COVID-19 crisis. All taxable registered companies in most sectors (except oil and gas, financial industry, utilities) in Norway are eligible for this compensation under the condition that they were not already in financial distress before the crisis. Temporary reductions in tax rate or deferrals of tax or social security payments constitute a further possibility to prevent liquidity shortfalls in the short-term. Korea has introduced a temporary special tax reduction for SMEs located in Corona-related disaster areas until the end of 2020. VAT payments by small businesses, i.e. businesses with less than KRW 80 million in annual revenues, are reduced as well until the end of 2020. Small businesses can further defer taxes up to 1 year and social security contributions up to three months. Several OECD economies have complemented subsidies, loan guarantees and tax-related measures with “soft” tools to ensure repayments and to safeguard operating cash flow. In France, for example, authorities actively support mediation over credit conflicts between private parties with a free, fast and reactive mediation service. French SMEs can also mobilise credit mediation if they experience difficulties with one or more financial institutions. Furthermore, the Ministry of Economy and Finance has set up a crisis unit dedicated at inter-company credits to monitor the use of trade credit. Conclusions This note examines the vulnerability of non-financial corporations in the context of the COVID-19 crisis. The standstill in activity implied by confinement generates a high risk of large amounts of liquidity shortfalls and potentially of defaults of otherwise viable businesses. According to the exercise performed, without policy actions, after one month, 20% of firms would face a liquidity shortage and up to 40% of them after three months. To cope with this challenge policymakers have taken a wide range of actions to mitigate the risk of a liquidity crisis, including policies aimed at smoothing financial obligations over time (e.g. tax deferral, extending loan maturities, temporarily suspending debt repayment) but also direct support involving a mutualisation of losses (e.g. liquidity injection through equity participation, direct subsidies based on past sales, subsidies for maintaining employment, grants). 20 Given the composition of firms’ expenditures, policies aimed at relieving wage bills are of paramount importance to help firms addressing the liquidity shortfall. 20 See OECD (2020f) for more details on the implications of the crisis for firm ownership and bankruptcies, and OECD (2020g) for more details on equity injections and unforeseen state ownership of enterprises during the crisis. CORPORATE SECTOR VULNERABILITIES DURING THE COVID-19 OUTBREAK… © OECD 2020
12 This note emphasizes the need for a massive public intervention but it does not discuss the several challenges related to the design of policies. In particular: Country-specific dimensions. Country-specific institutional settings may shape the extent and the efficiency of the policy response. Given the importance of labour market policies highlighted in the note, it is likely that countries with already well-developed labour market support schemes are able to provide a quick response with less distortive effects. For instance, short-time work schemes are already well-developed in many OECD countries, in particular in Germany and Austria, and have already proven to be efficient in time of crisis. Generous unemployment benefits schemes in France and Denmark can help curb the adverse effect of a shock. Conditionality. Certain countries condition loans forbearance and wage subsidies on the actual reduction in payroll, with the requirement to be used to cover fixed costs only or to rehire fired employees after the crisis. For example, in Denmark, firms only qualify for the wage compensation scheme if they promise not to lay off workers for economic reasons during the COVID-19 crisis, and if they can pay the remaining 25% of the salary not covered by public subsidies. The design of transfers and subsidized loans to corporations should ensure that firms preserve jobs and that any funds are not used to boost CEO compensation or dividend payments, either through cash dividends or stock repurchases. The loan guarantees in Canada, for example, include a condition that allows businesses only to use guaranteed loans to cover operating costs, but exclude refinancing or repayment of debt or any corporate actions related to an increase in executive compensation or shareholder remuneration. Short-term versus medium-term policy answer. In many cases, given the need of an urgent policy response during the so-called “phase one” of the crisis, policy has not been particularly targeted in the short term. The analysis above illustrates the broad challenges and the impact of stylised and cross-cutting policy responses. Going forward, short-term, cross-cutting policies might need to be refined and better targeted to ensure that public support does not contribute to resources misallocation, for instance by propping up unviable firms. Yet, such targeting may be premature at the current stage of the crisis. Heterogeneity of the shock. Policies will also need to be refined to deal with the heterogeneous impact of the shock. Indeed, even in the medium term, when the activity will slightly recover, firms will not be on the same foot to face the crisis other than for liquidity reasons; for instance, collateral availability could allow some firms to tap external finance while start-ups and intangible-intensive firms will be relatively disadvantaged. Meeting these challenges would require refining the measures over time. These are issues left for future research. New normal. The extent to which the COVID-19 crisis will disrupt the economies is still uncertain. In European countries a large set of policies, in particular in the labour market, is tailored on the principle to protect the pre-crisis allocation of resources. In other countries, like in the U.S., the adjustment largely hinges on payroll reduction via layoffs. The comparative evaluation of these approaches goes beyond the scope of this note; yet, it is worth noticing that their relative efficiency during the recovery and beyond may be related to whether economies will structurally change coming out of the COVID-19 crisis. If so, as the demand for some sectors might decline for a long period, policy design should find a balance between preserving pre-crisis job matches and allowing new matches via job reallocation. Similarly, deferring tax and debt payment will lead to a surge of corporate debt from an already record high level. Structural change and prolonged sluggish demand in some sectors will also change firms’ profitability prospects and ability to deal with those liabilities. Therefore, finding a balance between debt forbearance and bankruptcy procedures will be a critical challenge during the recovery. CORPORATE SECTOR VULNERABILITIES DURING THE COVID-19 OUTBREAK… © OECD 2020
13 References Bajgar, M., Berlingieri, G., Calligaris, S., Criscuolo, C., and J. Timmis (forthcoming), “To use or not to use (and how to use): coverage and representativeness of Orbis data”, Science, Technology and Industry Working paper. European Central Bank, (2010), “Surveying the access to finance small and medium-sized enterprises in the Euro area: second half of 2009”, Frankfurt: European Central Bank. Gal, P., (2013), “Measuring total factor productivity at the firm level using OECD-ORBIS”, OECD Economics Department Working Papers, No. 1049, OECD Publishing, Paris. Kalemli-Ozcan, S., B. Sorensen, C. Villegas-Sanchez, V. Volosovych and S. Yesiltas (2015), “How to construct nationally representative firm level data from the ORBIS global database”, NBER Working Paper, No. 21558. OECD, (2020a), “Evaluating the initial impact of COVID-19 containment measures on economic activity”, Tackling Coronavirus Series. OECD (2020b), "Initial Impact of COVID-19 Pandemic on the Non-Financial Corporate Sector and Corporate Finance", Forthcoming. OECD (2020c), "Global Financial Markets Policy Responses to COVID-19 ", Tackling Coronavirus Series OECD, (2020d),”SME Policy Responses”, Tackling Coronavirus Series. OECD, (2020e),”Italian regional SME policy responses”, Tackling Coronavirus Series. OECD, (2020f), “Implications of the Covid-19 epidemic for firm ownership and bankruptcies”, Forthcoming. OECD (2020g), "Equity injections and unforeseen state ownership of enterprises during the COVID-19 crisis", Tackling Coronavirus Series. De Vito, A., and J.P. Gomez, (2020), “Estimating the COVID-19 cash crunch: global evidence and policy”, Forthcoming Journal of Accounting and Public Policy. Schivardi, F., and G. Romano, (2020), “A simple method to compute liquidity shortfalls during the COVID-19 crisis with an application to Italy”, mimeo. CORPORATE SECTOR VULNERABILITIES DURING THE COVID-19 OUTBREAK… © OECD 2020
14 Annex 1.A. Additional tables and figures Table A.1. Detailed dynamic of the three alternative revenues shock scenarios Months from the start of the 1 2 3 4 5 6 7 8 9 10 confinement Prolonged confinement S S S S S S S S S S Size of Unimodal scenario S S S*0.8 S*0.6 S*0.4 S*0.2 0 0 0 0 the shock Bimodal scenario S S S*0.8 S*0.6 S*0.4 S*0.2 0 S*0.5 S*0.5 S*0.25 Note: The tables shows the detailed dynamic underpinning each of the alternative scenarios. The revenues shock (S) is sector specific and calculated each month with respect to normal time revenues. Source: OECD calculations based on Economic Outlook guidelines. Table A.2. Number of firms by country Country Total number of firms % of the sample BEL 14,078 1.44 DEU 11,842 1.21 DNK 2,092 0.21 ESP 207,003 21.23 EST 5,193 0.53 FIN 16,402 1.68 FRA 94,974 9.74 GBR 27,041 2.77 HUN 85,626 8.78 IRL 1,707 0.18 ITA 327,776 33.62 LVA 1,087 0.11 PRT 106,658 10.94 ROU 5,222 0.54 SVN 8,522 0.87 SWE 59,721 6.13 Total 974,944 100 Source: OECD calculations based on Orbis® data. CORPORATE SECTOR VULNERABILITIES DURING THE COVID-19 OUTBREAK… © OECD 2020
15 Table A.3. Firm-level descriptive statistics Variable p10 p25 p50 mean p75 p90 Number of employees 3 4 8 39 18 52 Gross revenues 197,185 409,609 1,070,000 13,400,000 3,591,000 14,300,000 Value added 71,856 143,010 337,696 2,965,000 997,075 3,545,000 Intermediates 87,591 214,494 640,989 10,500,000 2,407,000 10,100,000 Cash Flow (1,414) 12,428 49,182 522,115 192,141 799,938 Ebitda 565 18,101 66,593 630,363 247,616 990,748 Total Assets 122,796 300,449 877,885 7,554,000 3,125,000 11,800,000 Fixed Assets 7,856 35,410 162,270 2,763,000 749,046 3,385,000 Cash Holdings 4,179 17,949 73,427 603,805 286,231 1,042,000 Current Assets 70,575 185,738 568,590 4,346,000 2,015,000 7,523,000 Total Liabilities 63,363 169,137 522,799 4,574,000 1,868,000 6,951,000 Current Liabilities 42,182 114,888 361,992 3,010,000 1,311,000 4,902,000 Short-term financial debt 0 0 0 644,705 65,854 581,296 Non-Current Liabilities 0 3,693 69,135 1,275,000 355,331 1,455,000 Long-Term financial debt 0 0 6,951 839,317 172,442 849,229 Fixed Assets over Total Assets 0.02 0.07 0.22 0.30 0.47 0.71 Fixed Assets over Wage Bill 0.04 0.17 0.58 2.76 1.73 4.40 Cash Holdings over Total Assets 0.01 0.03 0.10 0.17 0.26 0.46 Cash Flow over Total Assets 0.00 0.03 0.07 0.09 0.14 0.24 Total Liabilities over Total Assets 0.24 0.43 0.67 0.67 0.87 0.97 Financial Debt over Total Assets 0.00 0.00 0.06 0.16 0.26 0.45 Current Liabilities over Revenues 0.10 0.16 0.28 0.43 0.48 0.83 Interest Coverage Ratio 0.48 3.80 13.32 439.90 59.01 345 Note: Monetary values are in 2005 PPP US$. Source: OECD calculations based on Orbis® data. CORPORATE SECTOR VULNERABILITIES DURING THE COVID-19 OUTBREAK… © OECD 2020
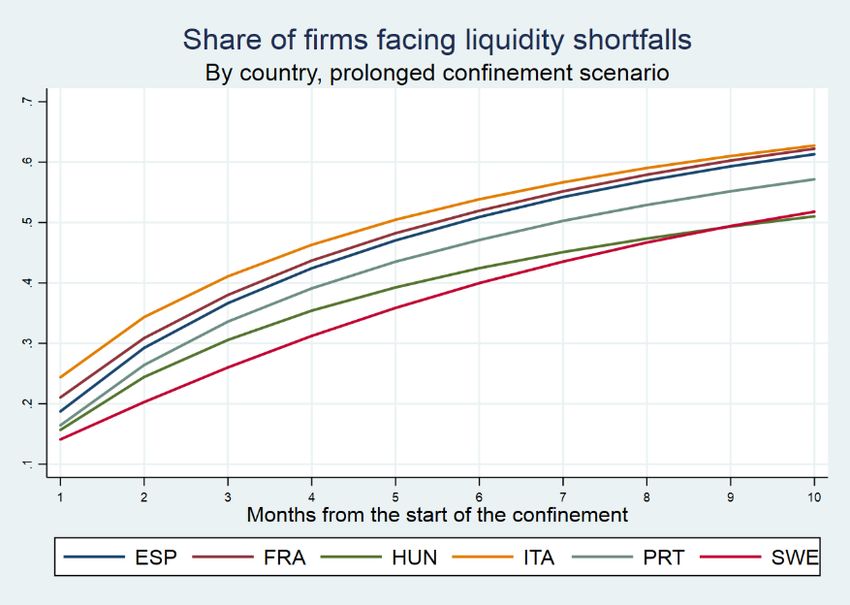
16 Figure A.1. Liquidity shortfall under no government intervention scenario, decline in output of 30% in other sectors Note: The figure shows the share of firms facing liquidity shortfalls over the whole sample, under three alternative scenarios: prolonged confinement (blue line), unimodal (green line), and bimodal (red line) scenario. The prolonged confinement scenario envisages a sharp drop in activities in each month considered, being agnostic on the length of the confinement and on the transition to normality. The unimodal scenario foresees a sharp drop in activity lasting two months, followed by a four-month progressive transition towards normality, and a return to pre-crisis activity levels from the seventh month after the start of the epidemic. The bimodal scenario overlaps with the unimodal scenario for the first seven months, but then models a second outbreak from the eight month onwards. The decline in output is assumed to be: between 50 and 100% in the most severely hit sectors (see above the text for details); 30% in the other sectors. Source: OECD calculations based on Orbis® data. Figure A.2. Liquidity shortfall under no government intervention scenario, by country (countries with best Orbis coverage of firms) Note: The figure shows the share of firms facing liquidity shortfalls for six countries among those with the best coverage in Orbis® (France, Hungary, Italy, Portugal, Spain, and Sweden). The prolonged confinement scenario is assumed. The prolonged confinement scenario envisages a sharp drop in activities in each month considered, being agnostic on the length of the lockdown and on the transition to normality. Moreover, the decline in output is assumed to be: between 50 and 100% in the most severely hit sectors (see above the text for details); 15% in the other sectors. Source: OECD calculations based on Orbis® data. CORPORATE SECTOR VULNERABILITIES DURING THE COVID-19 OUTBREAK… © OECD 2020
17 Figure A.3. The impact of policies, labour support adjusted to the size of the shock and modelled through an increase to 0.8 of the elasticity of wage bill to sales Note: The figure shows the share of firms facing liquidity shortfalls: in absence of policy intervention (blue solid line); in case of deferral of tax (green dah-dotted line); in case of a moratorium on short-term debt (green dotted line); in case of temporary support to wage payments, assuming a support adjusted to the sectoral size of the shock and modelled through an increase to 0.8 of the elasticity of wage bill to sales (green dashed line); a combination of all the previous measures (red solid line). Short-term debt is defined as the amount of financial liabilities that are due within the year. The left panel assumes a unimodal scenario, whereas the right panel a bimodal scenario. The unimodal scenario foresees a sharp drop in activity lasting two months, followed by a four-month progressive transition towards normality, and a return to pre-crisis activity levels from the seventh month after the start of the epidemic. The bimodal scenario overlaps with the unimodal scenario for the first seven months, but then models a second outbreak from the eight month onwards. The decline in output is assumed to be: between 50 and 100% in the most severely hit sectors (see above the text for details); 15% in the other sectors. Source: OECD calculations based on Orbis® data. Contacts Lilas DEMMOU ( lilas.demmou@oecd.org) Guido FRANCO ( guido.franco@oecd.org) Sara CALLIGARIS ( sara.calligaris@oecd.org) Dennis DLUGOSCH ( dennis.dlugosch@oecd.org) This paper is published under the responsibility of the Secretary-General of the OECD. The opinions expressed and arguments employed herein do not necessarily reflect the official views of OECD member countries. This document and any map included herein are without prejudice to the status of or sovereignty over any territory, to the delimitation of international frontiers and boundaries and to the name of any territory, city or area. The use of this work, whether digital or print, is governed by the Terms and Conditions to be found at http://www.oecd.org/termsandconditions CORPORATE SECTOR VULNERABILITIES DURING THE COVID-19 OUTBREAK… © OECD 2020
You can also read