Interim Results Presentation - for the Six months ended 30 September 2017 www.vukile.co.za - Vukile Property Fund
←
→
Page content transcription
If your browser does not render page correctly, please read the page content below
Interim Results Presentation
for the Six months ended 30 September 2017

www.vukile.co.za

AGENDA

         01   Introduction
              Laurence Rapp

         02   Southern African Retail Portfolio Overview
              Ina Lopion

         03   Spanish Portfolio Overview
              Alfonso Brunet

         04   Financial Performance & Treasury Management
              Mike Potts

         05   Strategic Plans & Prospects
              Laurence Rapp

         06   Q&A
Introduction
Laurence Rapp

www.vukile.co.za
Profile Who we are High quality, low risk, RETAIL REIT in South Africa with growing INTERNATIONAL EXPOSURE Strong OPERATIONAL focus Core competence in ACTIVE ASSET MANAGEMENT Prudent FINANCIAL MANAGEMENT and strong CAPITAL MARKETS EXPERTISE ENTREPRENEURIAL APPROACH to deal making Strong focus on GOVERNANCE and LEADERSHIP History of strong compounded growth and SHAREHOLDER RETURNS with CAGR of 21.9% since listing 24% of assets now focused on UK and Spain Listings on the JSE AND NSX Group Results for the 6 months ended 30 September 2017 4
Highlights
H1 FY2018 in review
7.4% INCREASE in dividends in line with guidance to 72.65 cents per share,
Concluded landmark SPANISH ACQUISITION of 11 retail parks for €193 million
− Established a strong “on-the-ground” management presence
Further investment of R407 MILLION in Atlantic Leaf to facilitate portfolio acquisition
− Shareholding increased to c.35%
24% of assets now offshore
6.1% increase in like-for-like NET PROPERTY REVENUE
− Operating metrics remain solid in a very poor market
− Southern African retail vacancies reduced to 3.4% and positive retail rent reversions of 5.2%
GEARING remains conservative at 29% with 94% of interest bearing DEBT HEDGED
Group Results for the 6 months ended 30 September 2017 5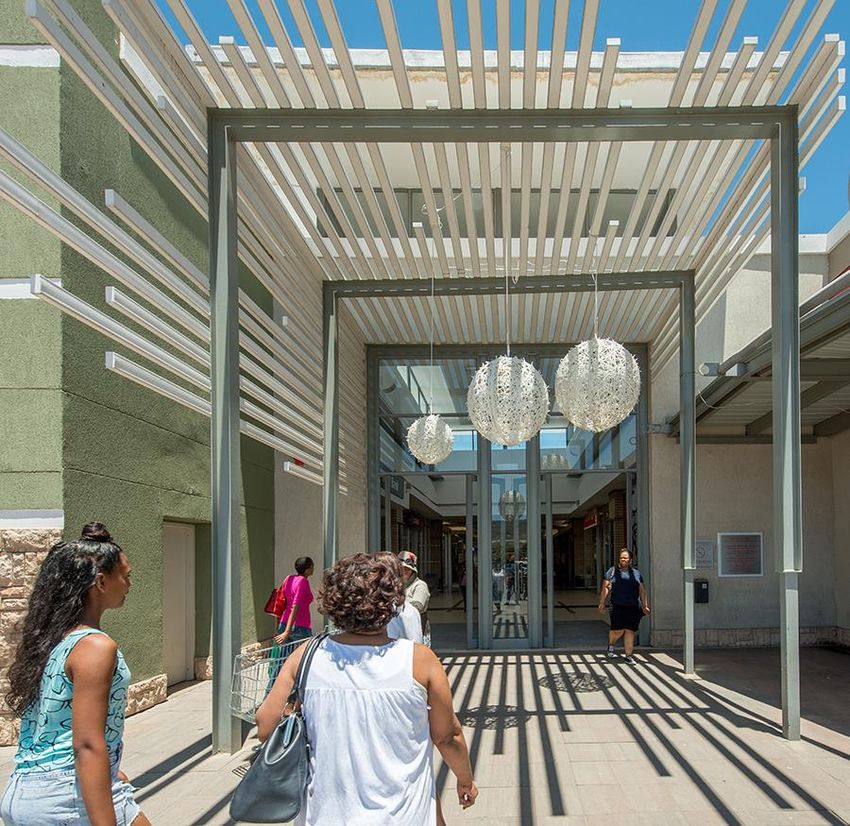
Group Overview
Focused Retail REIT in South Africa with growing international exposure

  Spain
 R3.6bn                            18%

                                                                     76%
                                                                                   Southern
                                                                                    Africa
                                                         R20.4bn          R15.5bn*
   UK
                                                                       Direct Property
  R1.3bn                               6%
                                                                      Portfolio R14.2bn*

                                                                          R521mn    R837mn
* Includes 100% consolidation of Moruleng Mall

Group Results for the 6 months ended 30 September 2017                                        6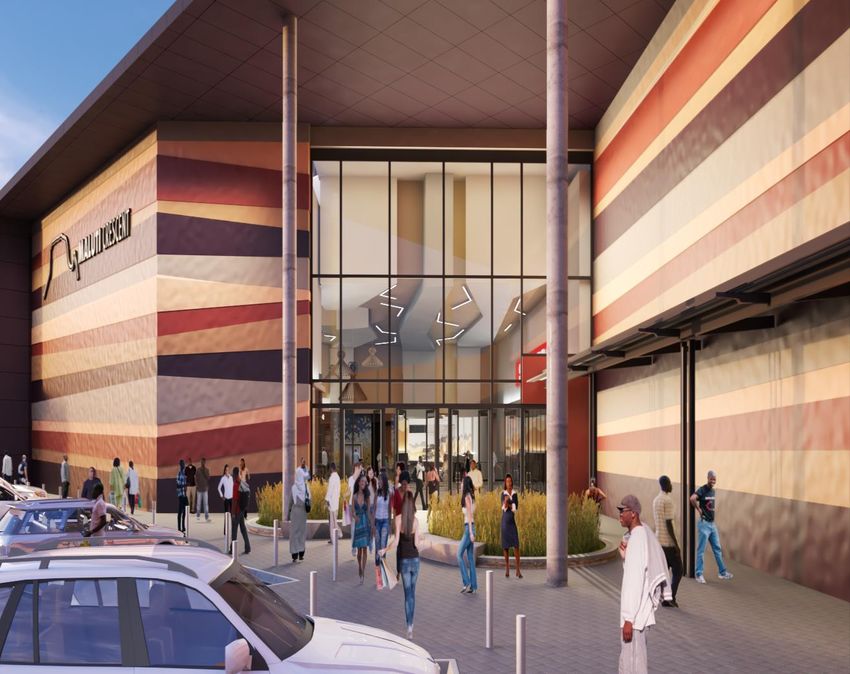
Strategic direction
Focus on capital allocation and strategic consistency
Balance
Southern Africa Spain UK
sheet management
Continued focus on Creating a holistic property Atlantic Leaf is our vehicle Disciplined and
defensive retail sector in strategy and operating on for growth in the UK conservative financial
line with our the ground with local management with stable
high-quality low market knowledge Triggered minority offer and LTV target around 35%
risk portfolio currently hold c. 35% of the
Management team now on equity Prudent interest rate policy
Further investment in our board to hedge at least 75% of
existing portfolio through Continue to invest in
Integration plan well on debt
expansions and upgrades logistics, warehousing and
track and establishing our
Ongoing investment in our corporate and governance distribution centres Foreign exchange
systems and team to structures hedging policy to minimise
Requested Atlantic Leaf adverse foreign exchange
add value through our
Predominately focused on management to start fluctuations by hedging
data-driven asset
retail but will be open to evaluating retail parks with forward on average 75% of
management approach
long lease logistics long leases and good foreign dividends by way of
Strong operational focus to covenants
Experiencing good deal flow forward currency swaps
keep delivering solid results over a 3 year period
Listing of Castellana on Plan to convert to a UK REIT
Limited local acquisition
Madrid Stock Exchange by
prospects at the right price
July 2018
Group Results for the 6 months ended 30 September 2017 7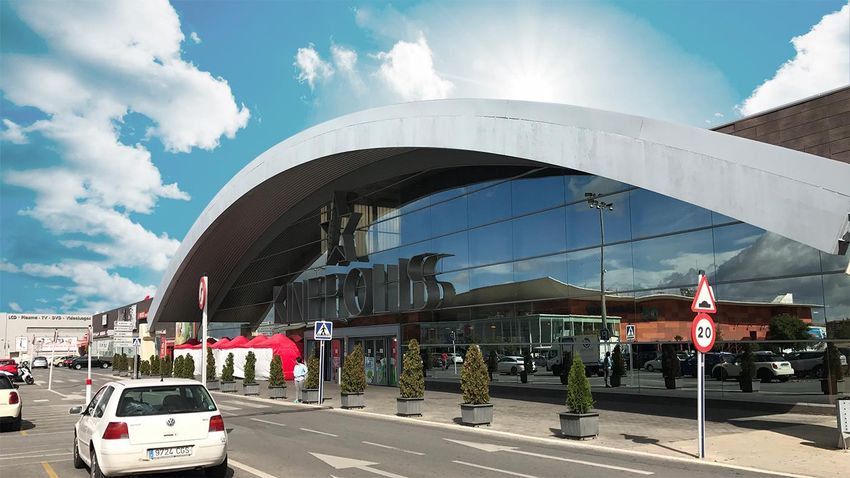
Southern African Retail
Portfolio Overview
Ina Lopion

www.vukile.co.za

Southern African Assets
Direct property comprises of 91% retail assets

                                                          Total Retail Portfolio R13.3bn

                                                                                                                                  Direct
                                                                      Oshakati                                                    Other
                                                                      Shopping
                                                                       Centre

                                                                                      Balance of Direct Retail Portfolio

                                                                                                                                             (%)   Percentage
                                                                                                                                                   of Total AUM

                                       *
                                                                                         R521mn~                                   R837mn~   Note: Image drawn
                                                                                                                                                   to scale
*   Takes into account Vukile’s 80% holding in Moruleng Mall                     ~ Based the market value of equity investments

Group Results for the 6 months ended 30 September 2017                                                                                                            9
Our retail footprint
Retail portfolio profile
Direct retail property portfolio value R12.8bn
Top 15 Assets’ percentage of direct retail portfolio 62%
Average value per retail property R272mn
7
Average discount Rate 13.9%
12
8%
Average exit capitalisation rate 9.0%
8% Number of retail properties 47
14 1 10 GLA 821 614 m2
9 4%
34% 13 5
6%
1 East Rand Mall 9 Moruleng Mall
11 2
8 3
2 Phoenix Plaza 10 Randburg Square
6%
24%
3 Pine Crest 11 Maluti Crescent
4 Gugulethu Square 12 Thavhani Mall
6
5 Dobsonville Mall 13 Meadowdale Mall
15 7%
4 3% 6 Nonesi Mall 14 Daveyton Shopping Centre
7 Oshakati Shopping Centre 15 Atlantis City Shopping Centre
Top 15 Properties
8 Durban Workshop
% Retail Geographic Profile by Market Value
Group Results for the 6 months ended 30 September 2017 10Creating a high quality low risk retail portfolio
Interrelationship of key retail metrics
Regional Tenant
Dominance Profile
Demographics National Tenant Exposure
Footfall Lease Expiry Profile
Location Vacancy Profile
Rental Sales &
Affordability Trading Metrics
Average Rental Levels Trading Densities
Rent-to- Sales Growth in
Rent Reversions Trading Densities
Group Results for the 6 months ended 30 September 2017 11Growth in net profit from Southern African property operations
Like-for-like growth of 6.1%
7.5%
7.0%
6.8%
6.8%
6.1%
5.8%
2013 2014 2015 2016 2017 2018 Interim
Note: Historic data per Company Annual Results.
Group Results for the 6 months ended 30 September 2017 12Retail tenant exposure
Low risk with c.80% national tenants
Tenant Profile - by Contractual Rent Top 10 Tenants by Rent
Other Steinhoff 7.8%
2.8% Pep Stores
2.4% Ackermans
21%
Diversified across Edcon 5.8% 3.2% Jet
997 tenants 1.6% Edgars
Shoprite 5.7%
Top 10 Foschini 5.1%
Tenants Pick n Pay
4.9%
46% Stores
Spar 4.3%
of Retail
Rent
Mr Price 3.3%
Truworths 3.2%
Nationals Massmart 3.0%
79%
First Rand
2.3%
Group
Group Results for the 6 months ended 30 September 2017 13Retail tenant expiry profile
43% of contractual rent expiring in 2021 and beyond (WALE 3.7 years)
% of Contractual Rent Cumulative
100
69
57
39
15 24 31
15 18 12
Mar-18 Mar-19 Mar-20 Mar-21 Beyond Mar-21
For the 6 months ended 30 September 2017 Retail leases were concluded with:
Total contract value R785 million
Total rentable area 75 437m²
Retail Tenant Retention 84%
Group Results for the 6 months ended 30 September 2017 14Retail tenant affordability
Consistently strong metrics
Retail Vacancy Profile (by Rent excl. developments) Retail Average Base Rentals (excl. Recoveries)
126.33
122.88
114.61
108.14
102.56
86.86
4.0%
3.9%
3.6%
3.4%
3.3%
3.3%
2013 2014 2015 2016 2017 2018 Interim 2013 2014 2015 2016 2017 2018 Interim
Retail Contractual Escalations Retail Rent Reversions
12.3%
11.6%
10.8%
8.0%
7.8%
7.8%
7.6%
7.5%
7.5%
7.3%
7.3%
6.9%
5.2%
2013 2014 2015 2016 2017 2018 Recent New 2013 2014 2015 2016 2017 2018 Interim
Interim Leases and
Renewals
Note: Historic data per Company Annual Results.
Group Results for the 6 months ended 30 September 2017 15Rent-to-sales ratio by Top 15 properties
Ahead of industry benchmarks
9.6%
7.5%
7.3%
7.3%
6.5%
6.4%
5.9%
5.8%
5.7%
5.4%
4.9%
4.7%
4.6%
4.4%
4.4%
3.3%
East Rand Mall Randburg Phoenix Plaza Thavhani Mall Durban Pine Crest Moruleng Mall Maluti Nonesi Mall Oshakati Gugulethu Atlantis City Meadowdale Daveyton Dobsonville Vukile
Square Workshop Crescent Shopping Square Shopping Mall Shopping Mall Portfolio
Centre Centre Centre Average
Group Results for the 6 months ended 30 September 2017 16Retail portfolio trading statistics by Top 15 properties
High trading density with solid growth ahead of market comparables
* Annualised trading density Trading density like-for-like Growth
9.5% 2.4%
43 302
39 721
38 929
(0.6%) 5.4%
2.9% 0.1% 2.1%
7.4%
32 819
5.5% 3.4%
31 997
3.5%
30 114
29 609
29 196
28 277
* 6.6%
27 519
27 343
26 328
13.4%
25 183
22 618
21 377
(1.4%)
15 390
Dobsonville Daveyton Phoenix Plaza Durban Atlantis City Pine Crest East Rand Mall Oshakati Maluti Gugulethu Nonesi Mall Thavhani Mall Moruleng Mall Meadowdale Randburg Vukile
Mall Shopping Workshop Shopping Shopping Crescent Square Mall Square Portfolio
Centre Centre Centre Average
Note: Annualised Trading Density calculated using Monthly Trading Density over 12 months. Trading Density like-for-like Growth calculated on stable tenants.
* Trading Density like-for-like Growth excludes Dobsonville Mall as centre was under development and Thavhani Mall as it is a recent development.
Group Results for the 6 months ended 30 September 2017 17Retail insights
Segmental allocation is key to weather the storm
Segment Focus Tenants Focus
Most of retail exposure remains in buoyant Community Shopping Centres Tenants trading densities remain under pressure with growth below
with 5.6% trading density growth and stable vacancies inflation
Rural centres within the portfolio show higher trading density growth at We have visited top 10 tenants in past 2 months to find creative,
5.9% compared to urban centres with 1.1% trading density growth dynamic and symbiotic solutions to current environment
Rent-to-sales remains low creating a drawcard for tenants as cost of
Given low CPI, rentals escalations is a topical point for most tenants
occupancy low
Average store sizes decreasing, leading to increased densities and higher Top performing categories grew at double digit levels: cell phone,
net rental opportunities superrette, sports wear, children’s wear, bottle stores and cosmetics
Although, footfall is decreasing in general, we are implementing multiple Bottom performing categories with negative growth: photography,
strategies to increase dwell time, and at selected centres have extended financial services, shoes and restaurants
trading hours
Segmental Profile - by Market Value Retail Portfolio Trading Statistics by Segment
By Market 1.7%
Value 5.6% 0.6%
0.1%
4.0%
35 301
13% Regional Shopping Centre
31 508
(0.1%)
30 422
34% Small Regional Shopping Centre
27 795
32% Community Shopping Centre
(0.8%)
23 706
9% Neighbourhood Shopping Centre
17 452
14 272
8% Namibia
2% Stand Alone Unit
2% Value Centre
Regional Shopping Small Regional Community Neighbourhood Namibia Value Centre Stand Alone Unit
Centre Shopping Centre Shopping Centre Shopping Centre
Group Results for the 6 months ended 30 September 2017 18Retail portfolio trading statistics by category
Solid growth where it matters most
16.0%
14.0% Bottle Stores 13.1%
Cell Phones 13.5%
12.0%
Trading Density like-for-like Growth
Sporting/ Outdoor Goods & Wear
10.0% Home Furnishings/ Art/ 8.4% Health & Beauty 8.2%
Antiques/ Décor 7.7% Food 7.6%
8.0%
Electronics 7.3%
6.0% Department Stores
(5k sqm) 0.5%
(4.0%)
Annualised Trading Density
Note: Annualised Trading Density calculated using Monthly Trading Density over 12 months. Trading Density like-for-like Growth calculated on stable tenants.
Group Results for the 6 months ended 30 September 2017 19Creating a high quality low risk retail portfolio
Interrelationship of key retail metrics
Regional Tenant
Dominance Profile
79% national tenants
43% of leases expiring in
Dominant in primary catchment area
2021 and beyond
In excess of 130 million customer visits
Vacancies reduced to 3.4%
per year at our top 15 centres
Contractual escalations ahead of
Customer profile aligned to South
inflation at 7.3%
African demographics
Rental Sales &
Affordability Trading Metrics
Industry leading Rent-to-Sales ratio
of 5.9% Trading densities above industry
Consistently positive Rent averages
Reversions Growth in trading density of 3.4% ahead
Scope for growth in base rentals of market comparables of 2.75%
Group Results for the 6 months ended 30 September 2017 20Asset Management
Ina Lopion
www.vukile.co.zaCompleted development
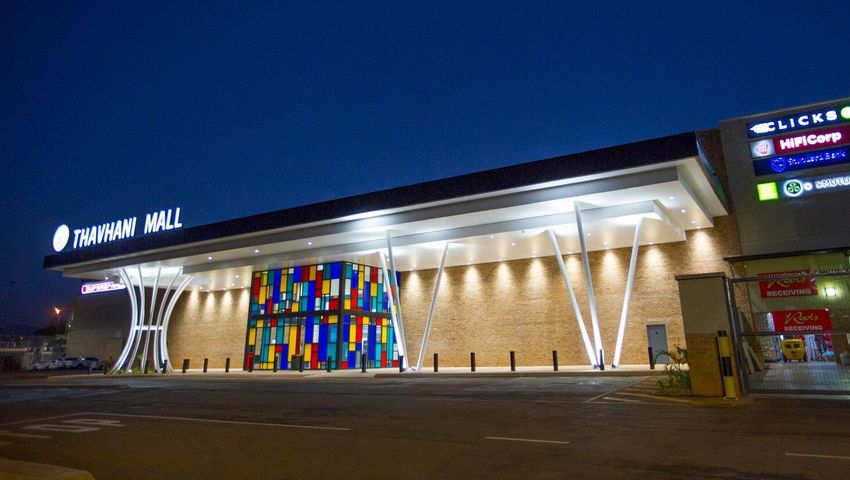
Thavhani Mall, Thohoyandou
New regional mall in the heart of Thohoyandou,
Limpopo, the largest development of its kind in the
area
Caters to a high-growth node with over 87 000
households
The opening of the centre was a resounding success
and incredibly well received by the local community
who embraced the opening of the new mall
The centre is trading exceptionally well, with many
retailers reporting first trade figures of double and
even triple their initial targets
Location GLA
Thohoyandou 50 637m²
Vukile Stake Acquisition Price
33.3% R367mn
Guaranteed Initial Yield National Tenant Component
8.0% 87%
Completion Date Vacancy
August 2017 0.9%
Group Results for the 6 months ended 30 September 2017 22Completed redevelopment
Phoenix Plaza, KwaZulu-Natal
Defensive spend to modernise Phoenix Plaza
The upgrade ensures that Phoenix Plaza remains the
shopping destination of choice for its loyal customer
base
The lighting of the mall has been significantly
improved and bright new colours have been
introduced to enhance its look and feel
The upgrade includes the addition of new public
ablution facilities, the refurbishment of the facades
and the upgrade of internal sections of the Mall
Location GLA
Phoenix, Durban 24 351m²
Scope Total Capex
Upgrading of entrances/facades R35mn
Initial Yield Commencement Date
n/a September 2016
Completion Date Vacancy
September 2017 1.2%
Group Results for the 6 months ended 30 September 2017 23Completed redevelopment
Dobsonville Shopping Centre, Soweto
Upgraded the existing centre and expanded the total AFTER
GLA to 26 655m²
A new mall, food court and an improved tenant mix
added to the centre
Tenants in the expansion include: Clicks, Foschini, Pick
n Pay, PQ Clothing, PEP Home and Legit
New & improved Tenants in existing mall – expansion
of Mr. Price & Truworths, Exact, Identity, Sport Scene,
Beaver Canoe and Food Lovers Market
BEFORE
Location Redeveloped GLA
Soweto 6 736m²
Scope Total Capex
Food court, improve tenant mix R114mn
Commencement Date Projected Yield on Capex
July 2016 9.6%
Completion Date Vacancy
August 2017 2.7% (1st Floor Conversion)
Group Results for the 6 months ended 30 September 2017 24Redevelopment in progress
Maluti Crescent, Phuthaditjhaba
An innovative redevelopment that will transform the
existing strip centre into a fully enclosed mall with
three levels of parking
This major upgrade responds to shopper and retailer
demand, and builds on the centre’s excellent trading
metrics
Pick n Pay will be introduced as a second food anchor
The existing centre will continue to trade throughout
the redevelopment process
Flanagan & Gerard have been appointed as
development managers
Location Current GLA
Phuthaditjhaba 21 538m²
Additional GLA Total Capex
12 357m² R338mn
Commencement Date Projected Yield on Capex
June 2017 >8.5%
Completion Date Letting
September 2018 75% committed by nationals
Group Results for the 6 months ended 30 September 2017 25Southern African Ratio of net cost to property revenue
Improvement in cost ratios
All expenses All expenses excluding rates & taxes and electricity
Average 18.7
Average 17.3
22.1
20.3
18.8
18.7
18.0
17.9
17.7
16.8
16.8
16.7
16.6
16.0
2013 2014 2015 2016 2017 2018 Interim
Note: Stable portfolio excluding recent acquisitions and sales
Group Results for the 6 months ended 30 September 2017 26Energy management
Achievements FY2018
3.59 million kWh sustainable electricity savings
per annum
Further R5,6mn saved through billing & metering
optimisation
To date total Installed PV capacity of 2.6 MW
50 million litres of water annually supplied via
boreholes
Targets for the next 12 months:
Energy savings of a further 1.8 million kWh
Increasing PV capacity with 1,3 MW in 2018
Water recovery and savings of 80 million litres
Group Results for the 6 months ended 30 September 2017 27Spanish Portfolio Overview
Alfonso Brunet
www.vukile.co.zaUpdate on Spanish economy and political environment
Spanish economy continues to outperform the Eurozone
Indicator Q2 2017 Forecast 2017 Forecast 2018
GDP growth 3.1% 3.1% 2.7%
Home Consumption 2.6% 2.6% 2.4%
CPI 1.6% 1.9% 1.2%
Unemployment 17.1% 17.1% 15.8%
Tourism:
3RD MOST VISITED destination in the world behind USA and France
75 MILLION INTERNATIONAL TOURISTS in 2016 (up 11% from 2015)
2ND MOST POPULAR SHOPPING DESTINATION IN EUROPE for international tourists
Politics – Catalonia:
UNILATERAL DECLARATION OF INDEPENDENCE NOT RECOGNISED by any global institutions
− Secessionists are being prosecuted – Puigdemont in Brussels
ECONOMIC IMPACT FELT PREDOMINANTLY IN CATALONIA
− > 2 500 companies moved headquarters out of the region, benefiting the rest of Spain
− tourism in Catalonia decreasing 30% and affecting retail sales in the region by 20-30% (RetailCat)
− limited impact in the rest of the country – Spanish GDP growth 2018 will not be affected (Funcas)
Regional Catalan elections to be held on the 21st December – expectation for SECESSIONISTS TO LOSE MAJORITY – progressively
back to normality
Castellana has NO EXPOSURE to Catalonia
Sources: INE, FUNCAS, GLOBAL BLUE
Group Results for the 6 months ended 30 September 2017 29Spanish retail sector update
Strong fundamentals in line with recovering economy
Retail sales growth increased by 2.2% year to date (as at September 2017)
Retail footfall index GREW BY 1.8% in September 2017 (year-on-year)
Spanish ONLINE RETAIL SALES COMPRISE 3.6% (€24.1bn) of total sales (of this, 32% pure retail sales and 68% ARE SERVICE RELATED
SALES)
Entertainment, 8%
Fashion, 7%
Leisure, 5%
Retail
Electronics, 4%
32%
Food, 2% 3.6%
Health, 2%
96.4%
Other e-commerce
Dept stores, 1%
68%
Restaurants, 1%
Services, 1%
Household, 1%
Online Retail Other Retail
Source: INE, SAVILLS, CNMC
Group Results for the 6 months ended 30 September 2017 30Spanish retail parks
The investment case
Retail warehouse density Europe - Retail Parks
Spanish retail park universe of 2.8 MILLION SQM of GLA
350
300
Spanish retail park density at 50m² GLA per 1 000 inhabitants 250
200
LOWER THAN EU AVERAGE (64m²) 150
100
50
FRAGMENTED OWNERSHIP market in Spain 0
United…
Finland
Poland
Austria
France
Latvia
Romania
Spain
Ireland
Hungary
Italy
Greece
Denmark
Slovakia
Netherlands
Luxembourg
Belgium
Germany
Portugal
Slovenia
Croatia
Lithuania
Czech Republic
Sweden
Retail parks have proven to be RESILIENT TO DOWNTURNS
Retail park sector occupiers DOMINATED BY INTERNATIONAL
BRANDS Density/1000 inhab. Average Europe
STRONG DEMAND FOR SPACE in catchments above 120,000 people Source: Savills
LIMITED AVAILABILITY of prime retail parks
Early signs of rental growth as a result of PICK-UP IN CONSUMER
CONFIDENCE
STRONG INVESTOR DEMAND for retail parks
− potential for further yield compression ahead
Retail parks best positioned for retailers’ OMNI-CHANNEL
STRATEGY
− click-and-collect, distribution hubs
Source: RPE
Retail park RENTS ARE STILL BELOW PRE-CRISIS LEVELS
Group Results for the 6 months ended 30 September 2017 31Key portfolio metrics
A low risk defensive portfolio with rental upside
Retail-dominant portfolio in Spain 134 564m² of lettable area
Market Value of €225mn Average asset value of €17.3mn
Top 10 tenants make up 74% of income Vacancy rate of 0.4%* across the portfolio
89% Retail and 11% Office by Market Value 96% of income derived from national tenants
Average discount rate of 8.4% WALE of 16.9 years~
Average exit capitalisation rate of 6.4% Average monthly rent of €9.01 per m²
* excluding development vacancy at Kinepolis Leisure Centre
~ excludes lease breaks
Note: All data represents 100% of Castellana, Vukile shareholding is 98.3%
Group Results for the 6 months ended 30 September 2017 32Spanish portfolio footprint
Spain portfolio profile
3
Direct property portfolio value €224.8mn
14%
Top 5 assets’ percentage of direct portfolio 73.3%
Average value per property €17.3m
Average discount rate 8.4%
Average exit capitalisation rate 6.4%
28%
2
5 10 Number of properties 11 (i) (ii)
8
3%
GLA 134 564 m2
4%
6 1 Kinépolis RP & LP 7 La Serena (ii)
14%
7
2 Parque Oeste (i) 8 Mejostilla
4
11 1 3 Parque Principado 9 Motril
11% 2% 24%
9
4 Marismas del Polvorin 10 Ciudad del Transporte
5 Konecta Madrid 11 Konecta Seville
Property rank by Market Value
6 La Heredad
% Geographic Profile by Market Value
(i) Parque Oetse comprises two adjacent properties that were acquired in two separate companies, but has been treated as a single combined property for reporting purposes
(ii) La Serana comprises two adjacent properties that were acquired in two separate companies, but has been treated as a single combined property for reporting purposes
Note: All data represents 100% of Castellana, Vukile shareholding is 98.3%
Group Results for the 6 months ended 30 September 2017 33Spain portfolio overview
Top 10 assets
Kinepolis Retail Park Marismas del
Parque Oeste(i) Parque Principado Konecta Madrid
and Leisure Centre Polvorin
Value €44.9mn €43.5mn €31.9mn €25.1mn €19.4mn
Province Granada Madrid Asturias Huelva Madrid
Gross Lettable
Area 25 877m² 13 604m² 16 396m² 20 000m² 11 046m²
Monthly Rental €9.2/m² €14.8/m² €9.3/m² €8.0/m² €10.3/m²
Sector Retail Retail Retail Retail Offices
Media Markt, Aki, Media Markt, Bricomart, Conforama, Media Markt,
Major Tenants Konecta
Sprinter Kiwoko, Worten Intersport Mercadona, Low Fit
WALE(ii) 13.4 years 11.9 years 13.9 years 24.7 years 13.7 years
Vacancy Fully Let(iii) Fully Let Fully Let Fully Let Fully Let
(i) Parque Oetse comprises two adjacent properties that were acquired in two separate companies, but has been treated as a single combined property for reporting purposes
(ii) excludes lease breaks
(iii) excluding development vacancy
Note: All data represents 100% of Castellana, Vukile shareholding is 98.3%
Group Results for the 6 months ended 30 September 2017 34Spain portfolio overview
Top 10 assets
Ciudad del
La Heredad La Serena(i) Mejostilla Motril
Transporte
GAV €17.8mn €14.4mn €8.1mn €8.0mn €6.4mn
Province Badajoz Badajoz Cáceres Granada Castellón
Gross Lettable
Area 13 447m² 12 405m² 7 281m² 5 559m² 3 250m²
Monthly Rental €6.5/m² €6.8/m² €6.5/m² €8.4/m² €12.4/m²
Sector Retail Retail Retail Retail Retail
Aki, Mercadona, Aki, Mercadona, Sprinter, Electrocash, Worten, Sprinter, Kiabi,
Major Tenants
Sprinter, Worten Electrocash, Sprinter Aldi Kiabi Tiendanimal.com
WALE(ii) 22.8 years 20.7 years 15.8 years 18.9 years 14.0 years
Vacancy Fully Let 4.6% Fully Let Fully Let Fully Let
(i) La Serena comprises two adjacent properties that were acquired in two separate companies, but has been treated as a single combined property for reporting purposes
(ii) excludes lease breaks
Note: All data represents 100% of Castellana, Vukile shareholding is 98.3%
Group Results for the 6 months ended 30 September 2017 35Tenant profile
74% of income is generated from the top 10 tenants
Percentage
Tenant Overview
of Income
15% Europe’s largest consumer electronics chain and second largest in the world (number 1 is Best Buy in the US).
Konecta is a global BPO and contact centre service company with 61 contact centres employing 54 000 people in 10 countries.
13%
Konecta has over 200 clients worldwide and generated €738 million in revenues in 2016.
Sprinter was founded in 1981 and is Spain’s leading sports footwear, equipment and apparel retailer. Sprinter is 50% owned by the
7%
UK listed JD Sports group.
Aki offers a wide variety of essential DIY, repair, maintenance and renovation solutions as well as home/garden consumables. There
7%
are 79 stores located across Spain and Portugal. Aki is part of the Adeo Group which owns Leroy Merlin.
Worten offers a wide range of items and brands in the areas of home appliances, consumer electronics and entertainment. Worten
6%
has over 200 stores located across Portugal and Spain. Worten is part of the Sonae Group of companies.
Bricomart was established in 2005 and specialises in the construction and renovation market as well as in DIY. Bricomart is part of
6%
the Adeo Group which owns Leroy Merlin.
Kiwoko was founded in 2007 and is the largest chain of pet care speciality stores in Spain and Portugal, Kiwoko is owned by
5%
TA Associates – a large global private equity firm.
Conforama’s core product lines comprise furniture, decoration and a range of homeware appliances and electronic goods,
5% employing a multi-style product strategy. There are currently 287 Conforama outlets located across Europe. Conforma is part of the
Steinhoff group of companies.
Kiabi is a leading French discount clothing retailer owned by the Mulliez Family Association. The family owned business operates in
5%
over 120 stores in France, Spain and Italy.
Mercadona is Spain’s leading supermarket chain by market share. Mercadona reported €21.6 billion in turnover in 2016. It has 1 614
5%
stores and 79 000 employees across Spain.
Group Results for the 6 months ended 30 September 2017 36Spain tenant expiry profile
86% of contractual rent expiring in 2027 and beyond (WALE 16.9 years) *
% of Contractual Rent Cumulative
100
84
14 14 14 14 16
7 7
5 7 2
1 1 2
Mar-18 Mar-19 Mar-20 Mar-21 Mar-22 Mar-23 Mar-24 Mar-25 Mar-26 Mar-27 Beyond Mar-27
* excludes lease breaks
Group Results for the 6 months ended 30 September 2017 37Asset Management update
Adding value with on-the-ground knowledge
Redevco will continue to property manage the portfolio until 31 December 2017 at which point there will be a
SMOOTH HANDOVER AND TRANSITION TO THE CASTELLANA MANAGEMENT TEAM
− Redevco is a pan-European investment manager specialising in retail property. They provide a full range of real estate
management capabilities along with investment management services which includes management and fund administration
Castellana has secured the services of a HIGHLY EXPERIENCED AND RESPECTED TEAM OF SPANISH RETAIL
PROPERTY EXPERTS. The majority of the team have joined Castellana from October 2017
Omar Khan, A SENIOR MANAGER FROM VUKILE WILL BE DEDICATED TO SPAIN to assist with the integration of the
business operations to further ensure a smooth handover and integration process
KEY UPDATES on the portfolio:
− The 570m² at La Serena (Villanueva) will be filled by Tedi, a multinational German general dealer. Terms have been agreed and
the lease is currently being drafted
− Mercadona have extensively upgraded their store in Marismas del Polvorin (Huelva). They are now looking to upgrade their store
in La Serena (Villanueva)
− Redevelopment at Kinepolis Leisure Centre (Granada) in progress, expected completion date April 2018
Group Results for the 6 months ended 30 September 2017 38Redevelopment in progress
Kinepolis Leisure Centre, Granada
The upgrade will improve the look and feel of the
centre by upgrading the external facades and internal
finishes
Increasing the natural light by increasing shopfront,
opening up of the facade and inserting floor to ceiling
windows in shopfronts
There is strong demand from retailers to take up
space in the improved leisure centre
Location Redeveloped GLA
Granada 6 738m²
Scope Total Capex
Façade, Interior, Tenant Mix €2.0mn
Commencement Date Projected Yield on Capex
October 2017 >15%
Completion Date Development Vacancy
April 2018 8.9% *
Group Results for the 6 months ended 30 September 2017 * Fully Let when excluding development vacancy 39Acquisition
Alameda Park, Granada
Castellana is finalising the acquisition of Alameda Park,
located in Granada, Andalusia, Spain.
The centre is a 25 456m² retail park and shopping centre
located next to Kinepolis Retail Park.
Anchor tenants include Decathlon, Mercadona and
Maisons du Monde
This acquisition will consolidate Castellana’s position as
the owner of the primary retail node in Northern Granada
The centre has a catchment area of c.586 000 people with
average incomes of c.€20 000 per person p.a.
Location GLA
Granada 25 456m²
Initial yield Acquisition price
6.4% €54.6mn
Average net monthly rent LTV
€9/m² per month 50%
National Tenant Component Occupancy
88% 98.6%
Group Results for the 6 months ended 30 September 2017 40Acquisition
Pinatar Park, San Pedro del Pinatar
Castellana is finalising the acquisition of Pinatar Park,
located in San Pedro Del Pinatar, Murcia, South-East
Spain
The centre is a 10 637m² retail park located on the
southern edge of the town
Anchor tenants include AKI, EconomyCash and Jysk
The centre is newly completed with a 5 year WAULT
to break
Castellana has the option to acquire an adjacent plot
to extend the centre by a further 2 750m²
Location GLA
San Pedro Del Pinatar 10 637m²
Initial yield Acquisition price
7.0% €10.7mn
Average net monthly rent LTV
€7/m² per month 50%
National Tenant Component Occupancy
100% 100%
Group Results for the 6 months ended 30 September 2017 41Financial Performance Mike Potts www.vukile.co.za
Distribution history
Continuing trend of unbroken growth in distributions

Cents per share

                                                                            Interim               Final               Normalised Total                             Non-recurring

                                                                                                                                                                                                                                          156.75
                                                                                                                                                                                                                   146.3
                                                                                                                                                                                             136.8
                                                                                                                                                                126.5
                                                                                                                                   120.4
                                                                                                      111.4
                                                      107.9

                                                                            109
                                   97.9

                                                                                                                                                                                                                                                   7.40%

                                                                                                                                                                                                                                   89.1
              88.3

                                                                                                                                                                                                            83.1
                                                                                                                                                                                      77.7

                                                                                                                                                                                                                                                    72.65
                                                                                                                                                         71.7

                                                                                                                                                                                                                           67.65
                                                                                                                            68.2
                                                                                               63.8

                                                                                                                                                                                                     63.2
                                                                     62.8
                                               60.9

                                                                                                                                                                               59.1
                                                                                                                                                  54.8
                            53.8

                                                                                                                     52.2
                                                                                        47.6
                                                              46.2
                     44.1
         48

                                          47
  40.3

                                                                                                                                                                        13.8
                                                                                                              13.4

                                                                                                                                           11.2
                                                                                  8.7

         2008               2009               2010                  2011                      2012                         2013                         2014                         2015                  2016                   2017                     2018
Group Results for the 6 months ended 30 September 2017                                                                                                                                                                                                             43
Simplified income statement
R578 million of distributable income for H1 FY2018
Sep-17 Sep-16 Variance
R'000 R'000 %
Property Revenue 942 840 1 087 344 (13.3)
Property Expenses (339 976) (382 111) 11.0
Net profit from property operations 602 864 705 233 (14.5)
Corporate administration expenses (56 801) (51 653) (10.0)
Investment and sundry income 158 006 61 038 >100
Operating profit before finance costs 704 069 714 618 (1.5)
Finance costs (171 601) (210 968) 18.7
Profit before taxation 532 468 503 650 5.7
Taxation (8 986) (2 510) >(100)
Profit for the period 523 482 501 140 4.5
Profit share of associate 34 358 28 228 21.7
Other capital items (248) (635) 60.9
Attributable to non controlling interests (1 654) (19 932) 91.7
Attributable to Vukile Group 555 938 508 801 9.3
Group Results for the 6 months ended 30 September 2017 44Simplified income statement (cont.)
R578 million of distributable income for H1 FY2018
Sep-17 Sep-16 Variance
R'000 R'000 %
Attributable to Vukile Group 555 938 508 801 9.3
Less: Distribution on shares issued post 31 March 2016 0 (19 675) (100)
Non-IFRS related adjustments
Shares issued cum dividend 22 588 27 366 (17.5)
Dividends accrued on investments (i) 0 5 620 (100)
Asset Management income 0 4 000 (100)
Available for distribution to Vukile shareholders 578 526 526 112 10
(i) The non-IFRS dividend accruals will be finalised at year end
Group Results for the 6 months ended 30 September 2017 45Segmented income statement
Spain increasing its contribution to property profits
Operating segment analysis for the six months ended 30 September 2017
Total United Total
Retail Other Southern Africa Kingdom Spain Group
R'000 R'000 R'000 R'000 R'000 R'000
Property revenue(i) 597 495 65 440 662 935 0 65 659(ii) 728 594
Straight-line rental income accrual 1 191 139 1,330 0 3 617 4 947
598 686 65 579 664 265 0 69 276 733 541
Property expenses (net of recoveries)(i) (112 035) (8 949) (120 984) 0 (4 746) (125 730)
Profit from property and other operations 486 651 56 630 543 281 0 64 530 607 811
Profit from associate (Atlantic Leaf) 34 358 34 358
(i) The property revenue and property expenses in the segmental report have been reflected net of recoveries, in terms of the SA REIT Association’s Best Practice Recommendations. The unaudited condensed
consolidated statement of profit and loss reflects gross property revenue and gross property expenses.
(ii) The bulk of the Spanish net property revenue is reflected only for a three month period.
Group Results for the 6 months ended 30 September 2017 46Balance at 1 April 2017 1 330
Foreign currency movement in
cash 10
Proceeds from sale of
investment properties and 20
fixed assets
Dividends received from
Atlantic Leaf
35
Investment and other income 158
Group Results for the 6 months ended 30 September 2017
Cash from operating activities 571
Borrowings
advanced/derivatives 644
Group net cash flow – (R’m)
Issue of shares 1 038
Deployment of R2.4bn in growing the asset base
Additional investment in (1 448)
Castellana net of cash acquired
Dividends paid (628)
Acquisitions of investment
properties, developments and (567)
fixed assets
Additional Investment in
Atlantic Leaf
(418)
Finance costs (168)
Long term loans granted (71)
Acquisition of financial assets
(57)
held for sale/investments
Other (6)
Balance at 30 September 2017 443
47Group balance sheet – (R’m)
Assets and liabilities
16 285
Sep-17 Sep-16
11 502
5 264
3 379
2 936
2 774
1 967
1 965
1 687
1 657
1 190
685
566
83
Investment Investment Non-current assets Current assets Non-current Current liabilities Non-controlling
properties properties for sale liabilities interest
Group Results for the 6 months ended 30 September 2017 48NAV Bridge – (Cents)
NAV of 1 917 cps
411
(1)
(38)
147
(119)
1 917
(139)
92
1 868
(304)
Opening NAV Increase in other Increase in Increase in Increase in non- Increase in Decrease in Adjusted for Increase in non Closing NAV
(1 April 2017) non-current investment investment controlling current liabilities current assets new shares in current liabilities (30 September
assets properties held properties interest issue 2017)
for sale
Group Results for the 6 months ended 30 September 2017 49Treasury Management
Mike Potts
www.vukile.co.zaKey debt and foreign exchange metrics
Well hedged and conservative balance sheet
Reduced GROUP COST OF FUNDING of 5.58% (South Africa 9.27%)
Strong balance sheet with a LOAN TO VALUE RATIO of 30.5% *, GEARING RATIO of 28.9% ~
and “SEE-THROUGH” LTV RATIO of 35.1%
93.6% ^ of Interest bearing debt hedged with a 3 YEAR fixed rate (swap) maturity profile
DIVERSIFIED SOURCES OF FUNDING with 11 FUNDERS plus DMTN programme with no funder accounting
for more than 14% of facilities
Corporate long term rating of “A” with a POSITIVE OUTLOOK and “AA+” secured long term rating
and “A1” short term rating.
73.6% of forecast EUR INCOME from Castellana hedged over the next 2.5 YEARS
* Loan-to-Value ratio calculated as a ratio of interest bearing debt divided by the sum of (i) the amount of the most recent Directors’ Valuation of all the Properties in the Vukile Group Property Portfolio, on a
consolidated basis and (ii) the market value of equity investments. Group Loan-to-Value ratio including MtM of derivatives is 31.6%.
~ Gearing ratio calculated as a ratio of interest bearing debt divided by total assets
^ Excludes development loans and Corporate Paper.
Note: Interest bearing debt adjusted to include R77mn Commercial Paper issued to Vukile subsidiary in Nambia (eliminated on consolidation). Market value of equity investments consists of Fairvest, Gemgrow
and Atlantic Leaf with a value of R2.65bn. MtM of derivatives valued at -R231mn.
Group Results for the 6 months ended 30 September 2017 51Segmental Loan-to-Value and Interest Cover Ratios
Low risk conservative balance sheet
Group DMTN * South Africa ^ Spain
Loan-to-Value Ratio ~ 30.5% 28.1% 27.4% 45.0%
LTV stress level margin (% asset value reduction to respective covenant levels) 39% 38% 45% 31%
Interest bearing debt hedged 93.6% 81.7% 103.7% 67.0%
Fixed rate (swap) maturity profile 3.0 years 2.9 years 2.8 years 3.6 years
Interest Cover Ratio 3.20 times 2.48 times 3.01 times 6.69 times
ICR stress level margin (% EBITDA reduction to respective covenant levels) 38% N/A 34% 70%
* Ratios calculated as transactional ratios based on DMTN secured portfolio (excluding DMTN unsecured debt).
^ South Africa includes DMTN secured Portfolio.
~ Loan-to-Value ratio calculated as a ratio of interest bearing debt divided by the sum of (i) the amount of the most recent Directors’ Valuation of all the Properties in the Vukile Group Property Portfolio, on a
consolidated basis and (ii) the market value of equity investments.
Group Results for the 6 months ended 30 September 2017 52Sources of funding
R6.2bn of debt from diversified sources of funding
Sources of Group Debt
R1.749bn
R1.620bn
13% Banco Popular 34%
Unsecured
14% Bankia R1.194bn
R1.141bn
7% SCM
20% BBVA 8% Nedbank
47%
Investec 38%
26% RMB
Caixabank
R0.521bn 66%
25% Secured
53% 100% ABSA
26% Standard Bank
Banco Santander ABSA 22%
Standard Bank
Foreign Funders Local Funders Local Funders Local Funders DMTN
EUR * EUR ^ GBP ~ ZAR ZAR
* EUR Debt from foreign funders comprise consolidated debt of Castellana, which in non-recourse to Vukile, amounting to €101 070 140 converted at the EURZAR Rate of 16.0316 as at 30 September 2017.
^ EUR Debt from local funders comprise Vukile debt amounting to €71 181 026 converted at the EURZAR Rate of 16.0316 as at 30 September 2017.
~ GBP Debt from local funders comprise Vukile debt amounting to £28 700 000 converted at the GBPZAR Rate of 18.1557 as at 30 September 2017.
Group Results for the 6 months ended 30 September 2017 53Cost of funding
Reduction in Group cost of finance
Group Debt by Currency
9.27% 2.12% 3.10% 5.58%
R7.bn 10. 00%
R6.225bn 9.0 0%
R6.bn
8.0 0%
R5.bn
7.0 0%
6.0 0%
R4.bn
R3.bn
R2.943bn R2.761bn
5.0 0%
4.0 0%
R2.bn
47% 44% 3.0 0%
2.0 0%
R1.bn
R0.521bn 1.0 0%
R0.bn 0.0 0%
ZAR EUR GBP Total
Debt 12M Forecast cost of Debt (incl. Hedging) (%)
Group Results for the 6 months ended 30 September 2017 54Analysis of Group loan repayment and swap expiry profile
Well hedged with low risk expiry profile
Group Loan and Swap Expiry Profile
36.5%
26.9%
27.8%
23.8%
18.0%
16.9%
94% of interest
bearing debt
12.0%
10.9%
hedged *
9.5%
6.4%
Fixed rate
3.3%
2.8%
2.4%
(swap) maturity
2.0%
0.7%
profile 3.0 years
2018 2019 2020 2021 2022 2023 2024 2025 2026 2027 2028 2029
Loan Expiry Profile R'mn 177 1 484 1 055 1 120 1 677 122 150 44 396
Swap Expiry Profile R'mn 182 659 598 1 524 2 000 523
* Excluding development loans and Corporate Paper.
Note: Loan Profile includes R77mn Commercial Paper issued to Vukile subsidiary in Nambia (eliminated on consolidation). Loan Expiry Profile excludes amortisation profile of Castellana debt.
Group Results for the 6 months ended 30 September 2017 55Analysis of Spanish loan repayment and swap expiry profile
Existing debt acquired as part of acquisition of retail parks portfolio
Castellana’s Spanish Loan and Swap Expiry Profile
72.8%
44.8%
100.0%
29.1%
26.1%
67% of interest
24.4%
bearing debt
hedged
Fixed rate
(swap) maturity
2.7%
profile 3.6 years
2018 2019 2020 2021 2022 2023 2024 2025 2026 2027 2028 2029
Loan Expiry Profile €'mn 73.6 2.8 24.7
Swap Expiry Profile €'mn 67.7
Proposed Restructured Loan €'mn 46.0 41.2 70.8
Note: Loan Expiry Profile excludes amortisation of debt. Castellana is currently restructuring its debt.
Group Results for the 6 months ended 30 September 2017 56EUR Foreign exchange hedging
Maintaining sustainable predictable income while reducing currency volatility
Mar-18 Sep-18 Mar-19 Sep-19 Mar-20
Net EUR dividends forecast ~ €3 301 702 €3 190 982 €3 317 449 €3 372 501 €3 447 917
FEC Hedge (€2 882 300) (€2 412 000) (€2 300 000) (€2 300 000) (€2 400 000)
Fixed EURZAR rate 16.0302 16.7241 17.4598 18.1406 18.8567
Unhedged EUR Income €479 402 €778 982 €1 017 449 €1 072 501 €1 047 917
Percentage EUR Income Hedged * 85% 76% 69% 68% 70%
To minimise the adverse foreign exchange fluctuations Vukile’s target is to hedge on average 75% of foreign
dividends over a 3-year period
73.6% of forecast EUR INCOME from Castellana hedged over the next 2.5 YEARS (next 5 dividend cycles)
As part of the acquisition of the Spanish retail portfolio a cross currency interest rate swap (“CCIRS”) of €93 200 000
was entered into with a 3 YEAR FIXED INTEREST RATE OF 1.00% at a EURZAR RATE OF 14.4446
Vukile has chosen to limit the utilisation of CCIRS to 55% of total international investments, reducing to 45% within
a period of 1 year. Current utilisation is 46.9% OF TOTAL INTERNATIONAL INVESTMENTS
• ~ net forecast dividend after deducting interest costs on Vukile EUR debt and CCIRS fixed interest costs.
• * Percentage of EUR income hedged calculated as FEC hedge divided by Net EUR dividend forecast.
Group Results for the 6 months ended 30 September 2017 57GBP Foreign exchange hedging
Maintaining predictable income while reducing currency volatility
Nov-17 May-18
Net GBP dividends forecast ~ £2 522 777 £2 588 728
FEC Hedge (£1 185 000) (£1 213 000)
Fixed GBPZAR rate 17.1929 17.8318
Unhedged GBP Income £1 337 777 £1 375 728
Percentage GBP Income Hedged * 47% 47%
46.9% of forecast GBP INCOME from Atlantic Leaf hedged over the next 0.67 YEARS (next 2 dividend cycles)
Vukile has chosen a shorter hedging profile given Brexit uncertainty that has negatively impacted the GBP exchange
rate. We will commence extending the hedging profile during relative GBP currency strength
~ net forecast dividend after deducting interest costs on Vukile GBP debt.
* Percentage of GBP income hedged calculated as FEC hedge divided by Net GBP dividend forecast.
Group Results for the 6 months ended 30 September 2017 58Strategic Direction
Laurence Rapp
www.vukile.co.za
59Southern Africa Continued focus on Retail Deeply concerned about worsening LOCAL POLITICAL AND ECONOMIC situation Portfolio is defensively positioned with 91% of direct property assets in RETAIL SECTOR Tenant mix very defensive with c.80% NATIONAL TENANTS and large grocery component Local activity will be focused on EXPANSIONS AND UPGRADES to existing centres Continued strong OPERATIONAL FOCUS LIMITED, if any, LOCAL DEAL FLOW De-gear the local balance sheet to CREATE CAPACITY FOR OFFSHORE opportunities Maintain a defensive stance across all VALUE DRIVERS Group Results for the 6 months ended 30 September 2017 60
Atlantic Leaf Information Update
Solid Metrics

                             Portfolio of    59 properties across                                                   Loan to value of       45.6%
                             the United Kingdom

                             Asset under management of              £335mn                                          Interest cost of     3.2%

                             78% of assets Logistic / Retail Warehousing                                            76% of Debt Hedged

                             90% of income derived from A grade tenants                                             Forecast dividend of        9.1 pence

                             WALE of 11.2 years                                                                     Forecast growth in dividend of           7.1%

                             Vacancy rate of      0% across the portfolio                                           NAV per share of         £1.07

 Note: Information from Atlantic Leaf Interim Results Investor Presentation of 13th October 2017, based on 30 September 2017 information including DFS transaction.

Group Results for the 6 months ended 30 September 2017                                                                                                                61
Atlantic Leaf Strategy
The way forward
Currently hold c.35% OF THE EQUITY
Happy with progress Atlantic Leaf management has made in building a SOLID, LOW RISK BASE of assets
Would now like to see INCREASED EXPANSION OPPORTUNITIES to leverage off the solid base
Continued investment in LOGISTICS, WAREHOUSING AND DISTRIBUTION assets
Would like Atlantic Leaf management to investigate RETAIL PARKS in more detail:
− Long leases, with good covenants
− Pricing seems attractive at 6.5% - 7.0%
− Well positioned for omni-channel strategies
Actively driving strategy with Atlantic Leaf management and seeking to ADD VALUE AS A STRATEGIC SHAREHOLDER
Support Atlantic Leaf management exploring possibility of converting to a UK REIT
Atlantic Leaf management have provided forecast growth of between 5% AND 7% FOR FY2019
Group Results for the 6 months ended 30 September 2017 62Spanish Strategy The platform is set Castellana MANAGEMENT TEAM NOW ON BOARD Approach is to “REPLICATE NOT INTEGRATE” Post deal Implementation plan WELL ON SCHEDULE Critical to our success is that we OPERATE AS LOCALS ON THE GROUND Plan to LIST CASTELLANA ON THE MAB by July 2018 FOCUSED ON THE RETAIL SECTOR but open minded to LONG LEASE LOGISTIC ASSETS Currently seeing very GOOD DEAL FLOW; Castellana presence established in the retail park market FUNDING IS IN PLACE for current acquisitions without need for Vukile to do an equity capital raise Spanish RETAIL AND ECONOMIC FUNDAMENTALS remain POSITIVE Expect Spain will be a MAJOR ENGINE OF GROWTH Planning a SITE VISIT for the week of 5 – 9 MARCH 2018 (Contact Instinctif Partners) Group Results for the 6 months ended 30 September 2017 63
Prospects
Positioned for strong long term growth
Vukile is very well POSITIONED FOR FUTURE GROWTH
− Stable, defensive Southern African retail portfolio with impressive operating metrics
− Castellana well positioned for STRONG GROWTH IN THE SPANISH MARKET
− Ability to scale Atlantic Leaf off a SOLID PORTFOLIO PLATFORM
Balance sheet management remains a CORE COMPETENCE to continue
− to keep gearing below 40%
− to hedge at least 75% of interest bearing debt
− to hedge c.75% of foreign currency denominated income
Expect full year FY2018 dividends to growth by between 7% AND 8%
Early indications are that growth in FY2019 will be AT LEAST 8%
Group Results for the 6 months ended 30 September 2017 64Acknowledgements
Board
Property managers
Service providers
Brokers and developers
Tenants
Investors
Funders
Colleagues
Group Results for the 6 months ended 30 September 2017 65Q&A
www.vukile.co.za
66Appendix A Southern African Property Overview www.vukile.co.za
High quality retail assets
Top 15 assets

                                      East Rand Mall     Phoenix Plaza     Pine Crest    Gugulethu Square   Dobsonville Mall

            GAV                       R1 330mn            R831mn          R828mn           R502mn             R492mn
           Region                        Gauteng         KwaZulu-Natal   KwaZulu-Natal    Western Cape         Gauteng
      Gross Lettable
          Area                          69 424m2           24 351m2        40 087m2         25 322m2           26 655m2

     Monthly Rental                     R259/m2            R250/m2         R155/m2          R145/m2            R131/m2
     National Tenant
        exposure                           87%               80%             94%               90%               90%

         Vukile
        Ownership                          50%               100%            100%             100%               100%

          Approx.
          Footfall                     10.4 million       9.7 million     11.0 million     5.6 million ~      8.9 million

          Vacancy                          2.8%              1.2%            3.0%             0.4%            Fully Let *
    * Excluding development vacancy      ~ Estimate

Group Results for the 6 months ended 30 September 2017                                                                         68
High quality retail assets
Top 15 assets (cont.)
Oshakati Shopping
Nonesi Mall Durban Workshop Moruleng Mall Randburg Square
Centre
GAV R436mn R416mn R405mn R403mn R394mn
Region Eastern Cape Namibia KwaZulu-Natal Northwest Gauteng
Gross Lettable
Area 28 177m2 24 632m2 20 041m2 31 421m2 40 874m2
Monthly Rental R119/m2 R129/m2 R181/m2 R112/m2 R97/m2
National Tenant
exposure 96% 94% 73% 87% 85%
Vukile
Ownership 100% 100% 100% 80% 100%
Approx.
Footfall 6.2 million ~ 11.6 million ~ 13.1 million 3.8 million 6.9 million
Vacancy Fully Let 1.2% 0.9% 5.0% 8.5%
~ Estimate
Group Results for the 6 months ended 30 September 2017 69High quality retail assets
Top 15 assets (cont.)
Daveyton Atlantis City
Maluti Crescent Thavhani Mall Meadowdale Mall
Shopping Centre Shopping Centre
GAV R393mn R374mn R372mn R363mn R323mn
Region Free State Limpopo Gauteng Gauteng Western Cape
Gross Lettable
Area 21 538m2 50 637m2 47 538m2 17 774m2 22 115m2
Monthly Rental R131/m2 R162/m2 R71/m2 R147/m2 R139/m2
National Tenant
exposure 97% 87% 78% 84% 79%
Vukile
Ownership 100% 33% 67% 100% 100%
Approx.
Footfall 10.1 million ~ 9.4 million 7.0 million ~ 7.4 million 9.5 million
Vacancy Fully Let 0.9% 2.2% 1.4% 4.4%
~ Estimate
Group Results for the 6 months ended 30 September 2017 70Company total portfolio composition
Top 15 assets make up c.56% of the total portfolio
Sectoral Profile - by Market Value Sectoral Profile - by GLA
By Market Top 15
Top 15 Value By GLA
Properties Properties
91% Retail 86%
56% 4%
3%
Offices
Industrial
6%
7%
42%
of Total 1% Motor Related 1%
of Total
Value 1% Residential 0% GLA
0.1% Vacant Land 0%
Geographic Profile - by Market Value Geographic Profile - by GLA
By Market
Value By GLA
38% Gauteng 41%
22% KwaZulu-Natal 17%
8% Western Cape 6%
7% Namibia 7%
6% Northwest 7%
5% Free State 7%
7% Limpopo 7%
4% Mpumalanga 5%
3% Eastern Cape 3%
Group Results for the 6 months ended 30 September 2017 71Company tenant exposure
Low risk with 77% national tenants
Top 10 Tenants by Contractual Rent Top 10 Tenants by GLA
Other Other
23% 23%
Diversified across Top 10 Diversified across Top 10
1318 tenants Tenants 1318 tenants Tenants
41% 46%
of Total Nationals of Total Nationals
Rent 77% GLA 77%
Tenant Profile - by Contractual Rent Tenant Profile - by GLA
7.1% 8.3%
5.3% 6.8%
2.5% Pep Stores 3.6% Jet
5.2% 6.3%
2.2% Ackermans 2.1% Edgars
4.6% 6.3%
4.5% 5.2%
3.9% 2.9% Jet 2.1% Pep Stores
3.7%
3.0% 1.4% Edgars 1.9% Ackermans
3.2%
2.9% 2.5%
2.8% 2.1%
2.1%
1.8%
Group Results for the 6 months ended 30 September 2017 72Company tenant expiry profile
43% of contractual rent expiring in 2021 and beyond (WALE 3.6 years)
% of Contractual Rent
% of Contractual Rent Cumulative
100
69
57
39 31
18 12
16
16 23
Mar-18 Mar-19 Mar-20 Mar-21 Beyond Mar-21
% of GLA
% of GLA Cumulative
100
64
55
40
15
19
15 21 9 36
4
Vacant Mar-18 Mar-19 Mar-20 Mar-21 Beyond Mar-21
For the 6 months ended 30 September 2017 leases were concluded with:
Total contract value R840 million
Total rentable area 94 444m²
Tenant Retention 85%
Group Results for the 6 months ended 30 September 2017 73Vacancy profile
Vacancy improving to 3.7% of contractual rent
12.6
7.2
Vacancy
5.8
5.2
4.2
3.7% of
3.7
3.6
3.4
Rent *
Retail Offices Industrial Total
Mar-17 Sep-17
8.4
7.3
7.2
Vacancy
4.3
4.1
4.1
3.8
4.1% of
2.7
GLA *
* Excluding development vacancy of 1725m2 Retail Offices Industrial Total
Group Results for the 6 months ended 30 September 2017 74Individual properties vacancy profile (% of GLA)
Vacancy > 500m2
Vacant Area Mar-17 Vacant Area Sep-17
Randburg Square (9%)
Retail Roodepoort Hillfox Power Centre (8%)
Vereeniging Bedworth Centre (8%)
Letlhabile Mall (10%)
Hammanskraal Renbro Shopping Centre (12%)
Mbombela Shoprite Centre (11%)
Moruleng Mall (80%) (5%)
Pinetown Pine Crest (3%)
Hillcrest Richdens Shopping Centre (11%)
KwaMashu Shopping Centre (10%)
Ermelo Game Centre (15%)
Atlantis City Shopping Centre (4%)
Boksburg East Rand Mall (50%) (3%)
Bloemfontein Plaza (2%)
Soweto Dobsonville Mall (3%)
Emalahleni Highland Mews (3%)
Office Sandton Sunninghill Sunhill Park (25%)
Sandton Linbro 7 On Mastiff Business Park (7%)
Industrial Midrand Allandale Industrial Park (4%)
Pinetown Richmond Industrial Park (0%)
0m² 500m² 1 000m² 1 500m² 2 000m² 2 500m² 3 000m² 3 500m² 4 000m²
Group Results for the 6 months ended 30 September 2017 75Lease renewals
Positive retail reversions
6.4
5.4
5.2
Lease
renewals
- percentage
escalation on
expiry
rentals
(2.9)
Retail Offices Industrial Average
* No new office leases concluded during the period
Group Results for the 6 months ended 30 September 2017 76Contracted rental escalation profile
Rental escalations still ahead of inflation
8.6
8.0
8.0
7.5
7.5
7.4
7.3
7.3
7.3
7.2
7.2
Escalation
Percentage
Retail Offices * Industrial Total
Mar-17 Sep-17 Recent New Leases and Renewals
* No new office leases concluded during the period
Group Results for the 6 months ended 30 September 2017 77Weighted average base rentals– R/m2
Excluding recoveries
2.8%
2.8%
126.33
122.88
118.62
115.42
4.3%
94.10
90.25
1.6%
52.81
51.96
Retail Offices Industrial Total
Mar-17 Sep-17
Group Results for the 6 months ended 30 September 2017 78Weighted average base rentals R/m2 (excluding recoveries)
Total Retail portfolio
Boksburg East Rand Mall (50%)
Durban Phoenix Plaza
Durban Workshop
Windhoek 269 Independence Avenue
Thohoyandou Thavhani Mall (33%)
Springs Mall (25%)
Mbombela Truworths Centre
Pinetown Pine Crest
Daveyton Shopping Centre
Gugulethu Square
Oshikango Shopping Centre
Atlantis City Shopping Centre
Hillcrest Richdens Shopping Centre
Katutura Shoprite Centre
Soweto Dobsonville Mall
Phuthaditjhaba Maluti Crescent
Oshakati Shopping Centre
Pietermaritzburg The Victoria Centre
Ga-Kgapane Modjadji Plaza (30%)
Giyani Plaza
Hammanskraal Renbro Shopping Centre
Welgedacht Van Riebeeckshof Shopping Centre
Queenstown Nonesi Mall
Piet Retief Shopping Centre
Hammarsdale Junction
KwaMashu Shopping Centre
Ondangwa Shoprite Centre
Moruleng Mall (80%)
Emalahleni Highland Mews
Makhado Nzhelele Valley Shopping Centre
Ulundi King Senzangakona Shopping Centre
Roodepoort Ruimsig Shopping Centre
Hartbeespoort Sediba Shopping Centre
Tzaneen Maake Plaza (70%)
Rustenburg Edgars Building
Monsterlus Moratiwa Crossing (94.50%)
Soshanguve Batho Plaza
Letlhabile Mall
Randburg Square
Elim Hubyeni Shopping Centre
Mbombela Shoprite Centre
Bloemfontein Plaza
Ermelo Game Centre
Vereeniging Bedworth Centre
Roodepoort Hillfox Power Centre
Germiston Meadowdale Mall (67%) Weighted average R126.33
Bloemfontein Jet
0 50 100 150 200 250 300
Group Results for the 6 months ended 30 September 2017 79Weighted average base rentals R/m2 (excluding recoveries)
Total Other portfolio
Jhb Houghton Estate Oxford Terrace
Cape Town Bellville Barons
Jhb Houghton 1 West Street
Sandton Rivonia Tuscany Section 8
Sandton Rivonia Tuscany Section 10
Sandton Rivonia Tuscany Section 7
Sandton Bryanston Ascot Offices
Sandton Sunninghill Sunhill Park
Midrand Ulwazi Building
Sandton Rivonia Tuscany Section 6
Sandton Rivonia Tuscany Section 5
Sandton Rivonia Tuscany Section 9
Midrand Sanitary City
Sandton Linbro 7 On Mastiff Business Park
Midrand Allandale Industrial Park
Pinetown Richmond Industrial Park
Kempton Park Spartan Warehouse
Sandton Linbro Galaxy Drive Showroom
Centurion Samrand N1
Pretoria Rosslyn Warehouse Weighted average R73.10
0 20 40 60 80 100 120 140 160 180
Group Results for the 6 months ended 30 September 2017 80Disposals
Transferred during FY2018
Property Location Sector Sale Price [mn] Date of Sale
Pretoria Lynnwood Erf 493 Gauteng Land R2.9 Aug-2017
Pretoria Hatfield 116 Francis Baard Street Gauteng Offices R16.5 Sep-2017
R19.4
Group Results for the 6 months ended 30 September 2017 81Acquisitions
Transferred during FY2018
Purchase Price
Property Location Sector GLA
[mn]
Kinépolis Retail Park and Leisure Centre Granada Retail 25 877 €41.5
Parque Oeste(i) Madrid Retail 13 604 €43.0
Parque Principado Asturias Retail 16 396 €30.0
Marismas Del Polvorín Huelva Retail 20 000 €25.0
La Heredad Badajoz Retail 13 447 €17.5
La Serena(ii) Badajoz Retail 12 405 €14.0
Mejostilla Cáceres Retail 7 281 €8.0
Motril Granada Retail 5 559 €7.5
Ciudad del Transporte Castellón Retail 3 250 €6.5
Total Spanish acquisitions 117 820 €193.0
Jet Bloemfontein Bloemfotein Retail 5 516 R38.3
Total South Africa acquisitions 5 516 R38.3
(i) Parque Oetse comprises two adjacent properties that were acquired in two separate companies, but has been treated as a single combined property for reporting purposes
(ii) La Serana comprises two adjacent properties that were acquired in two separate companies, but has been treated as a single combined property for reporting purposes
Note: All data represents 100% of Castellana, Vukile shareholding is 98.3%
Group Results for the 6 months ended 30 September 2017 82You can also read