Corporate Presentation - Vincom Retail
←
→
Page content transcription
If your browser does not render page correctly, please read the page content below

Corporate Presentation

                 May 2021
Disclaimer
IMPORTANT: The information contained herein is preliminary and subject to change without notice, its accuracy is not guaranteed, has not been independently verified and may not
contain all material information concerning Vincom Retail Joint Stock Company (the “Company”) and its subsidiaries (the “Group”). You should not rely upon it or use it to form the
basis for any investment decision or commitment whatsoever.

None of the Company, its shareholders, or any of their respective affiliates, directors, officers, employees, agents, advisers or any other person makes any representation or warranty
(express or implied) or accepts any responsibility or liability for the accuracy or completeness of this presentation or any or all of the information in this presentation or otherwise made
available. It is not the intention to provide, and you may not rely on these materials as providing, a complete or comprehensive analysis of the financial or trading position or prospects
of the Group. No part of this presentation shall form the basis of or be relied upon in connection with any contract or commitment whatsoever. Further, nothing in this presentation
should be construed as constituting legal, business, tax or financial advice. You should conduct such independent investigations and analysis of the Group as you deem necessary or
appropriate in order to make an independent determination of the suitability, merits and consequences of investment in the Company.

This presentation contains “forward-looking statements”. These forward-looking statements involve known and unknown risks and uncertainties, many of which are beyond the
Company’s control and all of which are based on management’s current beliefs and expectations about future events. Forward-looking statements are sometimes identified by the use
of forward-looking terminology such as “believe”, “expects”, “may”, “will”, “could”, “should”, “shall”, “risk”, “intends”, “estimates”, “aims”, “targets”, “plans”, “predicts”, “continues”,
“assumes”, “positioned” or “anticipates” or the negative thereof, other variations thereon or comparable terminology. These forward-looking statements include all matters that are not
historical facts. Forward-looking statements are not guarantees of future performance. These forward-looking statements speak only as at the date of this presentation, and none of
the company, its shareholders, or any of their respective affiliates, directors, officers, employees, agents, advisers or any other person undertakes to update or revise any forward-
looking statements as a result of new information or to reflect future events or circumstances.

                                                                                                                                                                                                1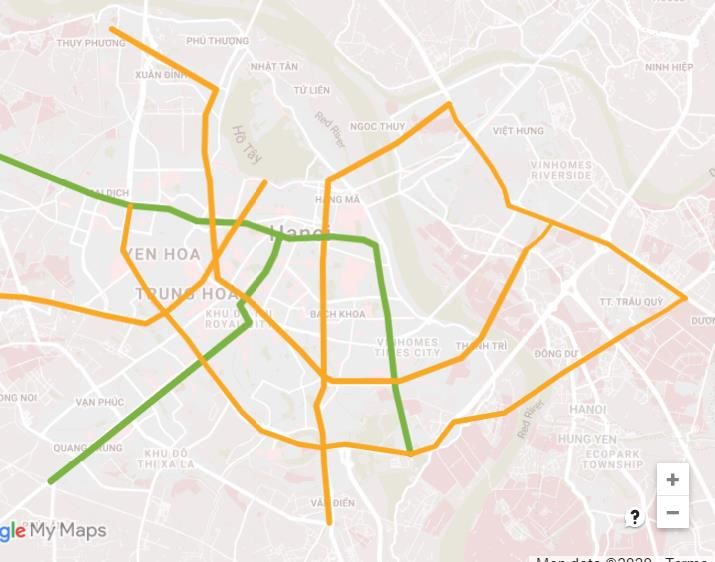
Executive Summary
Vincom Retail (“VRE”) is the largest and fastest growing retail developer, owner
and operator in Vietnam
Key investment highlights are as follows:
Vietnam Economy
Remains Resilient
Amidst Covid-19
Outbreak
Modern Retail Set to
Take Off
Largest and Most
Dominant Retail Platform
Proven Track Record of
Ability to Leverage the
Highly Scalable Platform Institutional Level
Best-in-Country
with Strong Operating Corporate Governance
Vingroup Ecosystem
Performance
Market leader in terms of the shopping mall GFA in Vietnam’s major cities…
…the direct proxy for consumer demand
The Dominant and Fastest Growing Retail Platform in Vietnam
2 2
Vingroup & Vincom Retail: Market Leaders In Vietnam
Largest Listed Company in Vietnam
Vincom Retail
A Key Subsidiary of
Largest Real Estate Developer in Vietnam
Vingroup JSC
c. 168 mm sqm of Landbank(1)
Hanoi 80
(8)
Operational
Ecosystem of Complementary Businesses Vincom Retail Malls
Largest Retail
Developer, Owner
and Operator in (9)
Vietnam Ho Chi Minh City 1.7 mn
Retail GFA
Residential Hospitality Healthcare Education Automobile Smartphone ~29% NLA leased to internal (sqm)
and affiliated tenants(2)
Premium Leading Leading Leading First Top 5
and large hospitality hospital private Vietnam- smartphone Vinhomes:
scale real operator in operator school ese smart producer in Vietnam’s largest real estate Unique Multi format Model
estate Vietnam operator and green Vietnam
developer About 750 vehicle
developer
Approx. beds under More than manufactu- 2.8 million
Largest in 17,500 operation 32,000 rer smart- VinFast:
Vietnam rooms students phones sold Flagship automobile and e-
7 full- Vincom Center Vincom Mega Mall
owned & registered 89,900 cars since motorcycle showrooms
No. of Malls: 7
1,592 units managed service at 35 and electric launch(7)
No. of Malls: 4
presold(3) general Retail GFA: 280,026 sqm Retail GFA: 444,098 sqm
facilities(5) motor- Vinschool:
(Contracted hospitals (17% total) (27% total)
cycles sold Leading private school operator
sales of and 5 since
VND 6 clinics launch(6)
trillion(4)) VinMart:
Vietnam’s largest modern grocery
retail chain by presence Vincom Plaza Vincom+
No. of Malls: 54 No. of Malls: 15
Retail GFA: 857,517 sqm Retail GFA: 71,936 sqm
VinID: ~11 mn Members, Largest Loyalty Program in Vietnam(5) (52% total) (4% total)
Vincom Retail is the Ultimate Consumer Play for Vietnam
Note:
(1) Refers to Vinhomes’ landbank (2) MSN-Vincommerce is an affiliated tenant (3) For 1QFY2021, estimated pre-sale under SPAs and pre-sale bookings under deposits, including BCC projects deposits (4) Include retail value only
(5) (6) (7) (8) (9) As of 31 March 2021
3
Emergence Of Vincom Retail As A Clear Market Leader
Establishing Platform Accelerating Growth With
Early Years & Formation For Growth Dominant Market Share
2004 – 2013 2014 2015 2016 2017 2018 2019 – 2020
Royal City launched First Vincom Vincom Mega 10 new Vincom Listed on HOSE in Launched 20 Launched 13 (2019)
shopping mall Mall Thao Dien shopping malls November shopping malls, and 1 (2020)
Times City launched outside Hanoi & launched Introduction H&M opened 2 stores including Landmark shopping malls and
US$200 million HCMC of Vincom+ format 81 expanded our
in Hanoi and Ho Chi
investment − VCP Ha Long international tenant
Minh City
“Best Retail US$100mm portfolio across key
Zara opened first store malls (Uniqlo,
Developer in follow-on
in Hanoi
Vietnam” by investment First Zara flagship Decathlon, CGV,
Euromoney in 2012 store in Vietnam Key tenants added: Signed leasing H&M, Mango, Muji,
10 new Vincom
First Robins opened at Vincom Inditex brands contracts for Pizza 4P’s, Haidilao)
shopping malls &
department store in Center Dong Khoi in (Stradivarius, Massimo
Acquisition of 5 approximately Pioneer in
Vietnam opened in HCMC Dutti, Pull & Bear), 191,000 sqm NLA
Maximark malls experiential
Royal City in April H&M and Old Navy
c.US$390mm Vingroup and over 1,200 retail-tainment in
2014 follow on investment advertising contracts Vietnam
Retail GFA (‘000 sqm) 7980
7,017
Leasing Revenue (VND bn)
2014 – 2020 CAGR:
6980
(1)
6,008
Leasing revenue: 20.1%
5,506
GFA: 22.0% 5980
1st Retail Mall 1st Integrated
in Vietnam Project in 4,455 4980
Vietnam Investment by 3,805
Warburg
3980
Pincus
IEO and
2,427 listed on 2980
1,927 HOSE
1,598 1,654
1,448
1980
Vincom Center Vincom Center
Ba Trieu Dong Khoi 1,023 1,173
851
467 499 980
42 93
-20
2004 2010 2013 2014 2015 2016 2017 2018 2019 2020
No. of
malls 1 2 5 6 23 31 46 66 79 80
17 Years of Operating Experience Achieving ~1.7 mm sqm of Retail GFA (~35x Increase Since 2004)
Note: As of 31 March 2021
Leasing revenue is based on Vietnam Accounting Standard (VAS) Audited Consolidated Financial Statements for respective years
4 (1) Leasing revenue took into account the impact of Vincom Retail’s supporting package to tenants impacted by Covid-19 in 2020, totaling VND 865bn 4
Retail Consolidates Around The Dominant Local Landlord
dominant local landlord
Global examples clearly demonstrate retail consolidation around the
Vincom Retail
Significant parallels seen between VRE and regional retail leaders
Vietnam’s largest retail developer, owner and
operator
Vietnam's
GFA (mm sqm)
current position at an early, higher growth stage of the retail
1.7
1.0 cycle translates to a stronger growth profile and a more dominant market
share
2016 2020
SM Prime
Central Pattana
Vietnam Philippines’ largest retail real estate developer
Thailand’s largest shopping mall developer arm of
GFA (mm sqm)(3) Market Share by GFA(2)
Central Group
50%
GFA (mm sqm)(1) Market Share by GFA(1) 9.8
Thailand Philippines 28%
20% 2.2
15%
4.7 Singapore
0.9 2007 2019 2007 2019
Total Market Size (GFA sqm)(2)
2013 2020 2013 2020
7.8mm 10.7mm
Total Market Size (GFA sqm)(1) Indonesia
5.6mm 18.9mm
PT. Pakuwon Jati
CapitaLand Integrated Commercial Trust
Indonesia’s largest mall owner and operator
Largest proxy for Singapore’s commercial real estate
NLA (mm sq. ft) Market Share by NLA(3) NLA (mm sqm) Market Share by NLA(4)
15.4%
10.4 0.7 20.4%
5.6% 0.3 13.3%
3.3
2011 2020 2011 2020
Total Market Size (NLA sq. ft)(3) 2012 2020 2012 2020
Total Market Size (NLA sqm)(4)
58.9mm 67.4mm ~2.5mm ~3.2mm(5)
Source: Company filings, Colliers, Statista, Urban Redevelopment Authority, Savills, Urbis.
1. Based on Central Pattana’s retail NLA in Bangkok Metropolitan Area and total shopping mall NLA in Bangkok Metropolitan Area.
2. Based on SM Prime’s retail GFA in Metro Manila and total retail GFA in Metro Manila.
3. Based on retail floor space supply in Singapore (2009-2024), extracted from Capitaland Mall Trust (CMT) Annual Report 2019
4. Based on PT. Pakuwon Jati’s retail NLA as of Dec-2012 and 3Q 2020 vs. shopping mall NLA of Jakarta
5 5
Key Investment Highlights
Key Investment Highlights
Vietnam’s Economy Remains Resilient Amidst Covid-19 Outbreak
1 ‒ Vietnam On A Rebound – The Brightest Spot In SEA’s Economies
‒ Clearer Signs Of A Speedy Recovery; Ready For A “New Normal”
2 Huge Potential for Further Expansion in Vietnam’s Retail Space
Modern Retail Set to Take Off
Only Retail Platform With Nationwide Access
Metro and Bus Infrastructure To Accelerate Retail Mall Footfall
Multi Format Model Covers a Larger Market Opportunity
3
Solidified Position as Dominant Retail Platform in Vietnam
4 Ability to Leverage the Best-in-Country Vingroup Ecosystem
5 Institutional Level Corporate Governance
7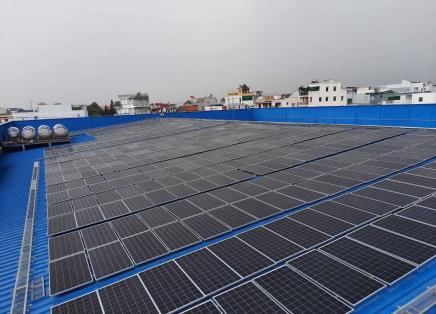
Vietnam On A Rebound – The Bright Spot In South East Asia’s Economies

Vietnam continues to maintain the highest GDP growth among Southeast Asia countries for the next three years

Estimated Real GDP growth (%)

        (9.5)                                                                                                                                                                                           7.1        7.0
                     6.5         6.3                                                 (5.8)                                                                                                                                6.5
                                                                                                                            (5.0)      5.0                                   5.0         5.2
                                                                  4.6                                                                                4.8         (1.1)
                                                                              4.2                3.8
                                                    (7.2)
                                                                                                           2.6

                Philippines                                 Thailand                         Singapore                              Malaysia                             Indonesia                             Vietnam

                                                                                                         2021        2022            2023

      Vietnam GDP continues strong growth in 2021 due to domestic consumption rebound, strong FDI inflow due to supply chain shift and accelerated public investment

          Forecasted domestic consumption grows                                           Vietnam to become the new center of                                            Highest level of public investment in terms
  1       at top level of Southeast Asia
                                                                                     2    global supply chain
                                                                                                                                                                 3       of GDP % to boost domestic economy
   Domestic consumption growth (%)                                                   Constant FDI disbursement despite ongoing Covid pandemic                        Public investment as % of GDP (2021 Target)
                                                                                     (USD billion)
                                                                              10.6                                                                                                                                          6.8
                                                                                                                         20.4       20.0
                                        8.8                                                                      19.1
                           8.2                                                                            17.5                                                                                                      5.7
                                                                                                 15.8
                                                    7.0                                  14.5
                                                                                                                                                                                               4.0      4.1
                                                                                                                                                                                   3.6
              4.6                                                       4.4
                                                                                                                                                                       2.4
                                                                  3.0
                                                                                                                                              3.8          4.1
                                              0.5           0.5

                                                                                         2015   2016     2017    2018    2019       2020     Q1/20    Q1/21

                                 -2.1                                                     Global corporations continue to relocate and expand factories
                    -3.6                                                                                           in Vietnam
       -4.7

                                 2020         2021F                                  Free Trade Agreements such as CPTPP, EVFTA and RCEP will                    Public investment is expected to keep increasing during the
                                                                                                 boost Vietnam’s international trades                                   first half of 2021, with suitable monetary policy

Source: GDP consensus from Bloomberg, GSO, CEIC, IMF and BMI

                                                                                                                                                                                                                                  8
Promising Retail Outlook, Ready For A “New Normal"
Mobility to retail malls and entertainment activities in major
cities has returned to pre – Covid level                                                                  Vietnam posts solid retail sales throughout the pandemic
                 Mobility to retail malls and entertainment activities has rebounded                       Nominal Retail sales change YoY (%)

                                                                                                                                                                                                            12.0
              Vietnam                             Hanoi                           HCMC                                                                                                          10.0
                                                                                                                                                                                     7.0
                                                                                                            5.7 6.5                                           4.0          3.7
                                                                                                                      2.0         1.4 1.4        1.8
                                                          -1%                           0%                                  1.5

                                                                                                                                            -0.14
                                                                                                                                                       -2.9
                                                                                                                                                                    -8.4         -10.0
                     -9%
                                                                                                                                                                                            -15.7

                                              -13%                            -13%                                                                                                                      -24.4
          -16%

                                         Dec-20             Mar-21
                                                                                                                                                2020           2021F

Rental outlook in Vietnam remains positive compared to regional countries
 % change in rental rate forecast

    Shanghai      Guangzhou         Beijing          Taiwan      Singapore      Tokyo        Hong Kong   Brisbane     Sydney           Perth        Melbourne       Auckland             HCMC          Hanoi

                                                                               2020            2021F          2019 - 2021 Cumulative

Source: Google Mobility Index, CBRE Research, eMarketer

                                                                                                                                                                                                                   9
2 Huge Potential For Further Expansion In Vietnam’s Retail Space
Low and fast growing disposable income per capita compared to neighboring countries, coupled with low
mall NLA, presents an opportunity to enlarge Vietnam’s retail mall space to close the regional gap.
Modern Retail is still at a Nascent Stage… …With the Growing Middle Class Set to Drive
Next Wave of Consumption
Vietnam has a Low Mall NLA compared to Thailand and Philippines(1) Vietnam’s Disposable Income per Capita is similar to Philippines in
2004 and Thailand in 1990, implying huge growth potential (1)
NLA (mm sqm) Disposable income per capita (US$)
7.9
7.3 2,796
2,554
1,808
3.6x 950 1,018
3.3x Vietnam
2.9x
2.2
2017 2018 2019 2023 2024
Hanoi/ HCMC Bangkok Metro Manila 3,818
3,547
2,824
Strong supply which validates the market’s potential, backed by
stable rental rate(2)
Philippines 930
Rental rate (USD/sqm/month) Future Supply (sqm NLA)
150.0 Hanoi 156
120.0 73 29
2004 2019 2023 2024
90.0
60.0 1,054 1,054 1,127 1,209
30.0 6,902 7,246
- 6,221
1Q20 2Q20 3Q20 4Q20 1Q21 2020 2021F 2022F 2023F
HCMC
150.0
70
120.0 114
57 Thailand 999
90.0
60.0 1,106 1,220
1,049 1,049
30.0
1990 2019 2023 2024
-
1Q20 2Q20 3Q20 4Q20 1Q21 2020 2021F 2022F 2023F
Rent rate (CBD) Rent rate (Non CBD) Current Future
Source: EIU, Colliers, CBRE Market Report in Hanoi and HCMC in 2020 and 1Q2021
10 Note: (1) Includes NLA pipeline 2020-2021 (2) As of 31 March 2021 102 Modern Retail Set to Take Off
Vietnam is Starved for Modern Retail Format E-Commerce More Catalyst Than Threat
Significantly Underpenetrated Modern Non-Discretionary Retail Remains E-Commerce Penetration(2)
2020/21(1) NLA per capita (sqm) (%) 2019A 2024E
1.8 40%
1.4
1.1
28%
0.5 0.5 0.5 0.5
21%
0.1 0.1 Low Penetration
15% vs Peers
13%
HCMC Hanoi Beijing Jakarta Shanghai Manila Singapore Bangkok Kuala 11% 11% 10%
9%
Lumpur
4% 5% 4%
Modern Retail Format an Attractive Solution in Vietnam 2% 3%
Attractiveness of Modern
Attractiveness of Modern China Indonesia Singapore Philippines Malaysia Thailand Vietnam
Retail to Consumers Retail to Tenants
Vincom Retail Further Consolidates Leadership
Limited alternatives for Significantly higher footfall and sales Position
entertainment and social activities psm achieved compared to
unorganized retail Malls: A Key Providing the Digital
One stop platform for discretionary + Activity Hub Infrastructure transformation
non-discretionary consumption Provides quality control with
guaranteed infrastructure and logistics
that helps to build brand equity Leading the service quality and customer experience
Stand-alone Department Store Formats have Lost Out Destination for and a trustworthy partner of major international brands to be
present in Vietnam for the first time
Lotte Vietnam on losing streak Progressively applying digital transformation to enhance customers’
Parkson Vietnam shutters store experience via improved service quality
since operations began
…However, during its ten years of
operation in Vietnam, Lotte Mart has
…Parkson Vietnam has closed another
of its stores as it continues to struggle Close and flexible connection between retail malls and e-commerce to support
shoppers and tenants via a network of credible e-commerce partners
never closed a year with profit… to make its business profitable…
Utilize the readily available customer base from VinID
Vincom Retail’s Disruption Has Already Leapfrogged the “Department Store” Phase
Source: EIU, Euromonitor, Vietnam Investment Review, Inside Retail Asia, CBRE Vietnam
(1) Includes NLA pipeline 2020-2021 (2) % E-commerce penetration represented by internet retailing over retailing.
112 Only Retail Platform With Nationwide Access
Portfolio Leasing Creates Significant Bargaining Power… … and Ability to Attract Best-in-Class Tenant Portfolio, with
more than 1,000 Unique Tenants(1)
HANOI HAI • 80 malls across 43
PHONG
cities and
provinces(1)
Fashion & Beauty
DA
NANG
• 4 retail formats for
specific areas
DONG • Proven and
NAI
scalable retail
CAN HCMC
THO development
platform
Vietnam
First stores in
Entertainment
Vietnam for Zara,
F&B and
H&M
First stores in
Hanoi for Uniqlo
First store in retail
(1)
malls of Decathlon
Anchor
VRE’s dominant position and nationwide scale makes it Vietnam’s “Go-to” platform
for international and established local brands
Source: Company information as of 31 March 2021
(1) Non-controlling interest in a subsidiary of Masan Group which owns MasanConsumerHoldings, the largest manufacturer of consumer products by revenue, and VinCommerce, the largest consumer retail network in terms of number of grocery retail stores
12 122 Metro And Bus Infrastructure To Accelerate Retail Mall Footfall
Most of VRE malls are covered by the upcoming metro lines in Ho Chi Minh City and Hanoi, and major VRE megamalls such as
VMM Ocean Park, Smart City and Grand Park have extra cover of VinBus routes – significant boost in connectivity and footfall
expected
Metro Lines Under Construction Planned Lines Bus routes
Ho Chi Minh City Hanoi
District 9
1 4
VINCOM PLAZA Go Vap District Tay Ho VINCOM CENTER
SAIGON RES VINCOM CENTER PHAM NGOC THACH
District NGUYEN CHI THANH
4
VINCOM MEGA MALL
1
VINCOM MEGA MALL
Ho Chi Minh THAO DIEN GRAND PARK
City Airport 5
VINCOM CENTER
TRAN DUY HUNG
3 1 2 3 4
CBD
1
Long Bien
5 District 1 VINCOM CENTER
3 Distirct Trau Quy
BA TRIEU
2 District 2 VINCOM MEGA MALL
SMART CITY 8
CBD VINCOM MEGA MALL
VINCOM MEGA MALL OCEAN PARK
VINCOM PLAZA TIMES CITY
3/2 1 2 3 4 5
VINCOM CENTER Ha Dong
DONG KHOI District VINCOM MEGA MALL 6 7 8 9 10
ROYAL CITY
2 Hung Yen
District 10 Province
Hoang Mai
Van Dien District
Tan Phu District
Preliminary VinBus routes as of 31 Dec 2020 (*)
1 Grand Park - Emart 2 Grand Park – Tan Son Nhat airport 1 Long Bien – Tran Phu – Smart City 2 Long Bien – Cau Giay – Smart City 3 Giap Bat – Smart City
3 Grand Park – Sai Gon bus station 4 Grand Park- Mien Dong bus station 4 Ho Tay water park – Smart City 5 VCP Long Bien – Smart City
5 Mien Dong bus station – National University NUA 6 Hao Nam – Ocean Park 7 My Dinh – Ocean Park 8 Ham Nghi – Ocean Park
9 Interconnected Complex – Ocean Park 10 Noi Bai – Ocean Park
Vingroup’s mixed use and VRE’s mall models are suited to tap
With urban metro lines opening for the first time in Ho Chi Minh
City and Hanoi and extra coverage of VinBus routes, the shift on this trend, given their targeted positioning and proximity to
from street retail to organized retail (malls) will accelerate the stations
Note: (*) Business plan which is subject to change 133 Multi Format Model Covers A Larger Market Opportunity
Annual Income
Distribution Holistic Segment Coverage Across Formats Competitors
(% of population
in Vietnam)(1) Vincom Center Vincom Mega Mall Vincom Plaza Vincom+
Target Segment:
Affluent Target Segment:
City Center/
(6%) CBD consumers Integrated Lotte
Middle & upper development Target
middle income catchment area AEON
Segment:
Targets families Target
Upper middle
Middle across all Segment:
income
Income income segments Middle
Focus on income /
(24%) shopping – Upper middle
experience based Target Segment: income
shopping to Heart of provincial
enhance customer town plus urban
experience non-CBD
Emerging
consumers of
(32%) key cities
Family & BIG C GO
activity hub Target
Middle income Segment:
Mass to
Aspiring middle income
(17%)
Target Segment:
Regional &
non-CBD Vincom Retail has access
catchment areas to addressable market
Mass Mass to segment of over US$176bn
(21%) middle income
of retail revenue
Source: BCG population and wealth models
(1) MAC (Middle income and affluent customers)
14 143 Solidified Position As Dominant Retail Platform In Vietnam
Distinguished retail formats and focused on wide range of lifestyle oriented consumers
Prime Urban and High Growth Areas in Key Cities Unique Multi – Format Retail Model
(Segmentation by GFA)
43 80 ~1.7mm Vincom Center
Location: City-center, CBD
Vincom Mega Mall
Location: In integrated,
Cities/ Operational Retail GFA Retail GFA: 40,000 – mixed-use projects
60,000 sqm Retail GFA: 60,000 –
Provinces Malls (sqm) No. of Malls: 7 150,000+ sqm
Total GFA: 280,026 sqm No. of Malls: 4
Total GFA: 444,098 sqm
Key Cities
North Vietnam (ex. Hanoi)
19 Vincom Malls
16.9%
16 Vincom Plazas 4.4% 26.9%
3 Vincom+
Hanoi
11 Vincom Malls
5 Vincom Centers
3 Vincom Mega Malls Central Vietnam 51.9%
20 Vincom Malls
3 Vincom Plazas
13 Vincom Plazas
7 Vincom+
Vincom+ Vincom Plaza
Ho Chi Minh City Location: Medium-density, Location: High-density,
13 Vincom Malls non-CBD CDB of cities
2 Vincom Center South Vietnam (ex. HCMC) Retail GFA: 3,000 – 5,000 ex. Hanoi and HCMC
sqm Retail GFA: 10,000 –
1 Vincom Mega Mall 17 Vincom Malls
No. of Malls: 15 40,000 sqm
7 Vincom Plazas 15 Vincom Plazas Total GFA: 71,936 sqm No. of Malls: 54
2 Vincom+ Total GFA: 857,517 sqm
3 Vincom+
Proven and scalable retail
4 retail mall formats
development platform
Note: As at 31 March 2021
154 Ability To Leverage The Best-in-Country Vingroup Ecosystem
c.168mm Access to Landbank from
29% Market Leading Retail Brands Form
NLA leased to
sqm of Vietnam’s Biggest Developer internal and Immediate Tenant Foundations
Landbank(1)
affiliated tenants(2)
Vinhomes’s Landbank Breakdown
c.30 years
worth for mn sqm
development Accelerates concept
to completion
155
pipeline for
Vinhomes Drives consumer
footfall (3)
Unparalleled
land sourcing 13
expertise
Launched Pipeline projects
Up to Largest Loyalty Programme in
Integrated Developments Provide 11m Vietnam Reinforces
100,000 Mega Malls with Natural Catchment Members(2) Captive Spending
Residents(2)
Times City
(opened: 4Q2013)
Ocean Park
(opened 12.2020) Single card,
nationwide access
Guaranteed
Footfall for
Malls Benefits lock in
repeat spending
Note:
1. Refers to Vinhomes’ landbank
2. As of 31 March 2021
3. Non-controlling interest in a subsidiary of Masan Group which owns MasanConsumerHoldings, the largest manufacturer of consumer products by revenue, and VinCommerce,
16 the largest consumer retail network in terms of number of grocery retail stores
165 Institutional Level Corporate Governance
Conflict Area Description Control
• All transactions must be entered into on commercially reasonable
basis as a statutory requirement.
• Vingroup will continue to be VRE’s majority
Decision Making • Significant related party transactions must be approved by the Board
shareholder following the Offering
of Directors or the general meeting of shareholders
• Interested parties must abstain from voting
• Non-compete from Vingroup on retail; VRE has a clear Right of First
• Both Vingroup and VRE are in the business of property
Competition Refusal (“ROFR”) for all stand-alone retail projects, retail
development
components and select mixed-use projects with well-defined criteria
• The ROFR above gives VRE economies of scale in land sourcing,
and delaying early-stage development costs
Land Bank Access • Vingroup holds much larger land bank than VRE • VRE has ROFR on land that can be used for retail, at cost
• VRE has an independent land sourcing team and primarily focuses
on different types of projects than Vingroup
• Allows VRE to expand faster with the key anchor tenants in place in
advance of commencing construction
Related Party Tenants • VRE has related party-tenants (Vingroup entities)
• Leases are negotiated on an arms’ length commercial terms
• Governed by related party rules under “Decision Making”
• Fees are calculated based on comparable third-party service
• VRE has contracts with Vingroup entities such as providers and Vingroup fees are allocated based on number of man
Vinpearl and Vinmec for non-core services such as hours and assets under management
Management Services
lodging rental and periodic health check for
Contracts • Helps VRE to manage expansion with minimum overhead as it can
employees, and Vingroup for headquarters services
share resources and costs with the rest of Vingroup
such as marketing, treasury and corporate HR
17 • Governed by related party rules
171Q2021 Key Highlights
Financial Performance – 1Q2021

                                                Revenue from leasing continued its recovery momentum from the 3rd quarter of 2020

Total revenue                                                                                                                                    Leasing revenue
VND billion                                                                                                                                       VND billion
                                             % of previous year level                                                                                                                            % of previous year level

         73.8%                   82.2%                     79.7%                    116.8%                     132.1%                                     90.6%                      78.8%                     88.9%                    84.3%                     118.1%

               (3.3%)                                                     84.4%
                                                                                                   (2)
                                                                                                                                                                  (9.8%)                                                                       4.1%

                                                                                      3,253
                                                                                                                 2,226                                                                                                                   1,645                     1,712
        1,686                     1,630                     1,760                                                                                           1,449                     1,307                    1,608

        1Q20                      2Q20                      3Q20                      4Q20                       1Q21                                       1Q20                      2Q20                      3Q20                     4Q20                      1Q21

Gross profit                                                                                    Leasing NOI (1)                                                                                EBITDA
VND billion                                                                                      VND billion                                                                                    VND billion
                          % of previous year level                                                                       % of previous year level                                                                        % of previous year level

      78.1%            67.3%           78.4%           112.7%            154.0%                          86.1%         81.1%           91.3%           86.5%            132.1%                        88.9%           73.1%            94.0%          110.5%           141.2%

                                                                                                              (6.3%)                                      11.5%                                                                       43.3%
                                                                                                                                                                                                                                                                 (2)
                                       86.1%                       (2)                                                                                                                                        (14.8%)
           (14.9%)

                                                        1,572                                                                                                                                                                                           1,746
                                                                                                                                                                        1,313                                                                                           1,508
                                                                         1,168                                                          1,174           1,178                                                                          1,218
                                                                                                         998             930                                                                          1,068             910
        759                              845
                        646

       1Q20            2Q20             3Q20            4Q20             1Q21                            1Q20          2Q20             3Q20            4Q20             1Q21                         1Q20             2Q20            3Q20             4Q20            1Q21

Note: Based on VAS Consolidated Quarterly Financial Statements of 2020 and 1Q2021
These financial metrics took into account the impact of the rental support (VND300bn in 1Q, VND375bn in 2Q, VND145bn in 3Q and VND 46bn in 4Q). There was no rental support recorded in 1Q2021
(1)    NOI for leasing of investment properties and rendering of related services is calculated by taking total income from leasing activities and from other property-related services less any property-related operating expenses which include land lease costs but exclude
       management expenses allocated from parent company
(2)    Total revenue, Gross profit, and EBITDA 4Q2020 surged due to revenue from delivery of shophouses
                                                                                                                                                                                                                                                                                  19
Key Operational Metrics
Retail GFA Occupancy rate
Change Change Change
(‘000 m2) 1Q2020 1Q2021 1Q2020 1Q2021 4Q2020
(%) (ppts) (ppts)
Vincom Center 280 280 - Vincom Center 92.1% 95.0% 2.3 93.1% 1.9%
Vincom Mega Mall 388 444 14.4 Vincom Mega Mall 87.6% 87.3% 0.3 86.0% 1.3%
Vincom Plaza 858 858 - Vincom Plaza 82.2% 80.4% 1.8 80.2% 0.2%
Vincom+ 72 72 - Vincom+ 76.5% 74.4% 2.1 73.8% 0.6%
Total 1,598 1,654 3.5 Total 84.9% 84.4% 0.5 83.8% 0.6%
Note: As at March 31, 2021
20Footfall Recovery Post Pandemic
1 Footfall
Hanoi HCMC
Million visitors Million visitors
5 2020 2021 5
2020 2021
4 4
3 3
2 2
1 1
0 0
Jan Feb Mar April May Jun July Aug Sep Oct Nov Dec Jan Feb Mar April May Jun July Aug Sep Oct Nov Dec
Other Provinces
Million visitors
● 1Q2021’s footfall stabilized versus 4Q2020, while footfall in March 12 2020 2021
bounced back to reach 90% of the footfall in March 2019
10
● Hanoi experienced a good recovery thanks to tenant upgrade in 8
VCC Pham Ngoc Thach and Tran Duy Hung, which continued to
attract visitors 6
4
● Retail malls in HCMC were still affected due to a lack of
international visitors. However, improvement is expected by the 2
end of 2021 with adoption of “vaccine passport”
0
Jan Feb Mar April May Jun July Aug Sep Oct Nov Dec
21Tenants’ Sale On Track For Recovery
1 Food & Beverage Fashion Enterntainment Cinema
(1) (2)
Covid-19 relative impact in 2020
(1) (2)
Least impact Least impact Medium impact Most impact
Recovery in 1Q2021
Very strong
Gradual recovery Gradual recovery Strong recovery
recovery
Entertainment and Cinema recovery marks a success in our commitment to support tenants overcoming
2
challenges posed by the pandemic
● In 2021, support package comes in the form of shopping vouchers
● The program has been activated since 1Q2021, and will be implemented and disbursed from 2Q2021
Source: Company report as of 31 March 2021
22Business Highlights in 1Q2021
ANCHOR TENANTS COMMIT TO ACCOMPANY AND EXPAND THEIR NETWORKS IN NEW RETAIL MALLS, HIGHLIGHTS FOR
RESIDENTIAL PROJECTS AND SUROUNDING AREAS
FLAGSHIP BRANDS
VMM SMART CITY
Plan to launch in 3Q2021
LEASING PLAN AND TENANT GROWTH
CHAIN TENANTS EXPANSION
Area Achieved
7% 28% leasing target for 2021
23Marketing Activities in 1Q2021
Spring Festival 2021
Lunar New Year International Women’s Day
(15 Jan – 28 Feb 2021) (01 – 08 Mar 2021)
Featured event “Secret Gift For Her” with participation of
Lunar New Year Fair offering a variety of regional specialties, was
held across Vincom malls including VCP Long Bien with “Happy famous singers namely Rapper G.Ducky, singer Hoang Dung,
Tet” Fair, VCP Sky Lake with “Spring Book Festival” singer S.T Son Thach
Retail malls were gorgeously decorated with colorful spring Dating and a surprise gift from a handsome man for first
themes and landscapes
female guest on International Women’s Day
Series of traditional games for families and children: DIY Couple challenge and lucky drawing with vouchers and
lucky money envelope, making toy figurines from sticky rice
gifts by Vincom. Gifts for female customers (cosmetics,
jewelry, accessories) from retail tenants
Footfall in 1Q2021: Over 36.8 million
24Apply Environmental Initiatives To Optimize Operational Activities
“Sustainable Development” is the underlying principle throughout business operations of Vincom Retail. Operation is optimized as a results of:
Energy saving and environmental protection initiatives (using clean energy, recycling waste, reducing chemical use)
Technology application to standardize and automate processes and optimize operations
Environmental protection initiatives Technology application in operation
1 2 1 2
Solar panels Cooling water treatment Optimize air- Automated
technology for air- conditioning parking system
conditioning system system
Finish installing and deployment Replace chemical water Test – drive intelligent algorithm Complete trial of automated car
of solar panels for 50 retail malls treatment system with E-water to control the air-conditioning parking system at Royal City.
cooling technology for all retail system with a Singaporean Plan for implementation across
malls partner large retail malls such as Times
City, Đong Khoi, Ba Trieu
Save nearly 9% of energy costs Eliminate the environmental Minimize human errors in Reduce headcount to operate
of the entire retail malls system chemical pollutants used operation Reduce cash frauds
Reduce carbon emission by Save costs by minimizing errors Improve customers’ experience
7,157 tons/ year and automating processes at retail malls
252021 Strategy Plan
2021 Strategies And Plan
Continue to develop Vincom Center (VCC)/Vincom Mega Mall
(VMM)/Vincom Plaza (VCP) in the big and Tier-1 cities to offer a dynamic
and engaging experience to the residential community in Vinhomes’ 5 new shopping malls
Product mega projects and surrounding areas New malls’ occupancy target: VMM 85%,
Strategy Enhance customer experience, embrace digital technologies, and VCP and VC+ 95% (including committed
ascertain the number one destination for customers by expanding and tenants)
diversifying tenants’ portfolio with international and Vietnamese brands
Expand the group of international, large, chain and anchor tenants
(Fashion, F&B, Furniture, Home accessories, Supermarket, etc.) in Upgrade tenant mix at VCC Metropolis
Tenant existing shopping malls (Hanoi), VCP Phan Van Tri (HCMC), VCP
Strategy Pioneer in reaching and bringing international, prestigious brands Hung Vuong (Can Tho)
and attractive retail models to Vietnam for the first time
Accompany and support Vietnamese tenant groups
Roll out Tenant Portal
Digital
Build data warehouse system
Transform- Apply digital transformation initiatives to create a dynamic, engaging Enhance Vincom web/ Vincom app to
ation customer experience and maximize operational efficiency facilitate customer experience to and at
Vincom malls
Implement marketing and communication
Marketing Solidify Vincom Retail’s leading position for effective cooperation and plans for the grand openings of major
consumers’ trust
Strategy projects namely Grand World and Vincom
Expand channels for brand communication: Web/App Mega Mall Smart City
Enhance a quality service program to offer
Customer Provide a safe shopping environment with quality products and services impressive shopping experience for the
Optimize operating costs and energy costs
Services continuously increasing end-users and
customers
Note: Company information 27Sale Goals And Action Plan
Goals
Leading shopping malls Shopping malls of Vietnamese
Pioneer in bringing shopping experiences from
with presence across Vietnam
prestigious domestic and international brands
Action Plan
3 projects, including 1 Vincom Mega Mall 2 Vincom Plaza
New opening
100,000 sqm GFA Increase nationwide
retail GFA to
~1.8mn sqm
Upgrade
tenant mix 3 projects, including 1 Vincom Center 2 Vincom Plaza
Number of stores Target tenants for finalizing
Chain and 20%
anchor
tenants Area
development
>20%
Note: Company information
28Financial Update
Financial Performance In 1Q2021 vs 1Q2020

Figures in VND billion                                              1Q20                 1Q21       YoY (%)   Commentary
Leasing of Investment
                                                                                                              Given the strong recovery of retail market in 1Q2021, no more support
Properties and Rendering of                                        1,449                 1,712        18.2
                                                                                                              package in the form of rental rebates in the quarter
Related Services

                                                                                                              Handed over 111 units from Bac Lieu, My Tho, Uong Bi in 1Q21
Sale of Inventory Properties                                         201                  452         124.9
                                                                                                              compared to 54 units in 1Q20

                                                                                                              Mainly from commission fee for real estate brokerage at Grand World –
Other Revenue                                                         36                   62         72.2    approx. VND 20 billion (no similar transaction in 1Q20), the rest was an
                                                                                                              increase in management fee of Condotels

Total Revenue                                                      1,686                 2,226        32.0

Gross Profit(1)                                                      759                 1,168        53.9

Operating Profit / (Loss)                                            575                  960         67.0

Profit / (Loss) before Tax                                           619                  980         58.3

Profit / (Loss) after Tax for the
                                                                     492                  781         58.7
Period

Profit / (Loss) after Tax and
                                                                     492                  781         58.7
Minority Interest

Note: VAS Consolidated Quarterly Financial Statements in 2020, 2021
(1) Gross profit already subtracted D&A relating to investment properties accounted for under VAS

                                                                                                                                                                                      30
Financial Performance
Total revenue Gross Profit (1)
VNDbn VNDbn
Gross Profit Margin (%)
50.8% 39.9% 47.6% 45.9% 45.0% 52.5%
9,124 9,259
185 215 8,329
172 4,404
2,027 (84) 3,825 (164)
3,433 2,149 3,641 (47) 735
5,518
2,801 806 1,034
951 112 48
2,226 411
7,017 6,008 62 3,752 1,169 (20)
5,506 1,686 36 2,882 2,954
4,455 452 2,342 759 (44)
201
1,449 1,712 668 135 1,002 187
2017 2018 2019 2020 1Q20 1Q21 2017 2018 2019 2020 1Q20 1Q21
Leasing of Investment Properties Sale of Inventory Properties Other Revenue Leasing of Investment Properties Sale of Inventory Properties Other Revenue
Depreciation & amortization of Investment properties (VNDbn)
829 1,042 1,331 1,357 339 346
Leasing Net Operating Income (NOI) (2) Profit After Tax and Minority Interest
VNDbn VNDbn
Leasing NOI Margin (%)
69.3% 69.5% 70.6% 71.3% 69,2% 76.9%
2,851
4,955 2,404 2,385
4,274
3,829 1,905
3,089
492 781
998 1,313
2017 2018 2019 2020 1Q20 1Q21 2017 2018 2019 2020 1Q20 1Q21
Note: Based on VAS Audited Consolidated Financial Statements for respective years and VAS Consolidated Financial Statements for 1Q2021
(1) Depreciation and amortization relating to investment properties is below the graph and should be added back (to Gross Profit) under IFRS. Since 2018, “Other” segment includes results from management of Da Nang condotels which was incurring loss as the property
was still ramping up after launch in May 2018.
(2) NOI for leasing investment properties and rendering of related services is calculated by taking total income from leasing activities and from other property-related services less any property-related operating expenses which include land lease costs but exclude
management expenses allocated from parent company. 31Balance Sheet
Total Assets Total Borrowings, Cash and Cash Equivalents
VNDbn VNDbn
5,726 5,686
38,684 39,816 39,780
35,839 4,945
10,911 11,125 11,423 4,122
7,121
3,133
2,780 2,785
2,177
27,773 28,718 28,691 28,357
31/12/2018 31/12/2019 31/12/2020 (2) 31/03/2021 31/12/2018 31/12/2019 31/12/2020 (2) 31/03/2021
(1)
Investment Properties and Investment Properties Under Construction Other Assets Borrowings Cash & equivalent
(3)
Total Equity (Net Debt / (Net Cash)) / Equity
VNDbn VNDbn
28,509 26,954 29,336 30,117
2.7%
2.3%
1.0%
31/12/2018
(2) (2)
31/12/2018 31/12/2019 31/12/2020 31/03/2021 31/12/2019 31/12/2020 31/03/2021
Net cash
Note: Based on VAS Audited Consolidated Financial Statements for respective years and VAS Consolidated Financial Statements for 1Q2021
(1) Investment Properties and Investment Properties Under Construction (IP/IPUC) are valued at development cost minus depreci ation and amortization and are not fair valued
(2) Decline in other assets, cash and cash equivalents, total equity as well as increase in gearing ratio as of 31 December 2019 was due to the payment of cash dividends of VND 2,445bn in April 2019 and buy back 56.5 mil treasury shares completed in November 2019
(3) Net Debt / (Cash) = (Short-term Borrowings + Long-term Borrowings) – (Cash & Cash Equivalents + ST Investments).
32Appendix
Updated Mall Openings Plan Until 2026

 No.                                Model                  Number of projects                 Location                 Retail GFA (sqm)

             To be developed 2021 – 2026

     1       VCC                                                   2                            Hanoi                           95,000

                                                                                Hanoi, HCMC, Hung Yen, Dong Anh, Can
     2       VMM                                                  27                                                          2,413,000
                                                                                           Gio, Cam Ranh

                                                                                    Hanoi, HCMC, My Tho, Bac lieu,
     3       VCP                                                  19                                                           489,000
                                                                                            Hai Phong, etc.

     4       VC+                                                   1                         Thanh Hoa                           3,000

             TOTAL                                                49                                                          3,000,000

● 49 new shopping malls, increasing GFA retail floor from nearly 1.7 million sqm to approx. 4.7 million sqm
● Land bank for retail mall development is sourced from Vincom Retail self-developed projects and through Vingroup and its
  subsidiaries
● Depending on the pandemic situation, Vincom Retail can be flexible in development progress and openings of new retail malls

Note: Numbers are rounded to the nearest thousand ('000)

                                                                                                                                          34
Bridging VAS to IFRS
Unit: VND Billion
VAS Adj. IFRS Commentary on Adjustments
1Q2021 1Q2021
Leasing revenue and other related Realized unearned revenue of deposit from customer in relation to
1,712 45 1,757
services amortization of deposit
Sale of inventory properties 452 452
Other revenue 62
Total revenue 2,226 45 2,271
Cost of leasing activities and other related
(710) 367 (343) Mostly depreciation of malls included in VAS; excluded under IFRS
services
Cost of inventory properties sold (266) (266)
Others (82) (82)
Cost of goods & services (1,058) 367 (691)
Gross profit 1,168 412 1,580
Selling expenses (92) (92)
General and administrative expenses (64) 18 (46) Amortization of Goodwill included in VAS; excluded under IFRS
Other income 21 21
Other expense (1) (1)
Finance expense (154) (44) (198) Amortization of Deposit from customer
Finance income 102 15 117 Amortisation of Deposit under BCC
Profit before tax 980 402 1,382
Tax expense (199) (80) (279) Deferred tax arising from above adjustments
Profit after tax 781 322 1,103
Note: Based on VAS Consolidated Financial Statements for 1Q2021 and conversion to IFRS by management, excluding impact from Investment Property and Investment Property Under Construction (IP/IPUC) revaluation gain/loss
35Vietnam Swiftly Controlled Covid-19
More than 511,000 people have been vaccinated against Covid – 19 as of May 2nd, 2021(1). The Vietnamese Government plans
to vaccinate 30 million people (~ 30% of its population) by the end of this year
1st wave of Covid-19 2nd wave of Covid-19 3rd wave of Covid-19
40% growth within 2 Visitors to shopping centers Pandemic was well under controlled
months after social +40% 15 grew 32% after social by the end of March. Retail malls’
distancing was lifted distancing was lifted visitors are expected to grow
14
strongly from Q2
2nd Outbreak 13 13
(Jul 28 – Sep 20) 14 14
+40%
12
+32%
12
667
10
1st Outbreak 11
(Mar 5 – Apr 30) 10
9
Million visitors
433
317
4
155
109
59
30
0 0 1 0 0 3
Mar-20 Apr-20 May-20 Jun-20 Jul-20 Aug-20 Sep-20 Oct-20 Nov-20 Dec-20 Jan-21 Feb-21 Mar-21
Community cases Shopping mall visitors
Source: Minitry of Health, Company report as of March 31, 2021, (1) Our World in Data
36Investor Relations Department Vincom Retail JSC 7 Bang Lang 1, Vinhomes Riverside, Viet Hung Ward Long Bien District, Hanoi, Vietnam Tel: +84 (24) 3974 9999 ext. 9545 Fax: +84 (24) 3974 8888 Website: ir.vincom.com.vn/en E-mail: ir@vincom.com.vn
You can also read