HY2020 RESULTS PRESENTATION - FOR THE SIX MONTHS ENDED 31 DECEMBER 2019
←
→
Page content transcription
If your browser does not render page correctly, please read the page content below
HY2020 RESULTS
PRESENTATION
FOR THE SIX MONTHS ENDED
31 DECEMBER 2019           COMMODITY HOUSE II
Proceedings

 Introduction         BRONWYN CORBETT
                      Chief Executive Officer
                      BCom (Acc), CA(SA)
 Existing Portfolio
                      •   2019 EY Entrepreneur of the Year Award
                          Winner (Exceptional Category, Southern
                          Africa)
 Financial Review     •   2015 Top CA(SA) under 35 Award Winner

 Growth & Pipeline

 Outlook
                      LEON VAN DE MOORTELE
                      Chief Finance Officer
 Q&A                  Bcompt (Hons), CA(SA)

 Annexures

             Ι 2
Introduction
Grit is a leading pan-African (excluding South Africa) real estate company
focused on investing in and actively managing a diversified portfolio of assets
underpinned by predominantly US$ and Euro denominated long-term leases
                    with high quality multi-national tenants

Grit has a full suite of on-the-ground capabilities and has a proven ability to
generate attractive African returns for a sound risk profile given the quality
                      of tenants and security of cash flows

           Ι 4
The African Opportunity

                 1.2 Bn+                                 2.4 Bn+                                     54                               50%                                 3.6%                                   2nd
Why Africa                                                                                                                         urbanisation                      SSA GDP Growth                    largest continent in
                    population                        population by 2050                          countries
                                                                                                                                     by 2030                             2020(e)                            the World

                                                                                                                                                                                                                     RISING
                                   STRONG POPULATION                                             INCREASING                                                 GROWING
Key Trends                                   GROWTH                                        ECONOMIC GROWTH                                               MIDDLE CLASS
                                                                                                                                                                                                           INFRASTRUCTURAL
                                                                                                                                                                                                               DEVELOPMENT

                            Urban Growth Rates                                       Rapidly Increasing Urbanisation                                Supply of Grade A Real Estate: Africa vs. Rest of the World1

Key Insights

                   Source:
                   McKinsey & Company. 2010. Lions on the move, The Progress and Potential of African Economies, Executive Summary. [ONLINE] Available at: https://www.mckinsey.com/featured-insights/middle-east-and-
                   africa/lions-on-the-move. [Accessed 10 February 2020].
               Ι 5 IMF. 2019. Real GDP Growth, Annual percent change. [ONLINE] Available at: https://www.imf.org/external/datamapper/NGDP_RPCH@WEO/OEMDC/ADVEC/WEOWORLD/AFQ. [Accessed 7 February 2020].
                   PWC. 2019. Real Estate 2020: Building the future. [ONLINE] Available at: https://www.pwc.com/realestate. [Accessed 7 February 2020].
Grit Group Strategy
De-risked approach to capturing significant parts of the value chain

   TENANT                                    PROPERTY INVESTMENT
                                             Targeted 12% US$ total return* underpinned by hard currency leases, guarantees
   QUALITY                                   and contracted rental escalations with multinational tenants.

 DIVERSIFIED                                  PROPERTY DEVELOPMENT
 AFRICA                                       Up to 20% of GAV** in property development and development prefunding.

HARD CURRENCY                                   ASSET MANAGEMENT & CO-INVESTMENT
                                                Opportunities to co invest into direct real estate portfolios with Asset Management
LEASES                                          fees charged on full asset value.
                                               * Only a target and not a profit forecast and there can be no assurance that it will be met. forward-looking statements and the assumptions underlying
                                               such statements are the responsibility of the Board of directors and have not been reviewed or reported on by the Company’s external auditors.
                                               ** Measured at time of investment.

                  Ι 6
Our High-quality
Grit Real Estate Income Group at a glance                                                                      FINANCIAL               INVESTMENT
                                                                                                                                                           Tenants
Geographic & sectoral diversification                                                                         HIGHLIGHTS #              HIGHLIGHTS

                                        Mozambique
                                                            Geographic Split (HY2020)1
                                                                                                               41.9%                    c8.5%
                                                                                                                                       current US$
                                        Mauritius*                                                            PROPERTY LTV
                                                                                                                                      dividend yield
                                                                  6.4%
                                        Morocco*

                                        Zambia                          *36% of Grit’s     38.6%
                                        Ghana
                                                           14.0%        portfolio is in
                                                                         Investment                            6.07%                     12%
                                                                        Grade African                                                  US$ targeted
                                        Kenya                             countries
                                                                                                                 WACD
                                                                                                                                        total return
                                        Botswana*            13.5%
                                        Other
                                        Investments                           20.6%
                                                                                                                 PORTFOLIO HIGHLIGHTS #

                                                                Sectoral Split (HY2020)1
                                                                                                              US$860.1m                92.8%
                                                                        3.4%                                    assets2               Multinational
                                                                                                                                        tenants
                                                                17.2%                      32.1%
                                                                         1 Split
                                                                               by Asset
                                                                         Value, Grit                           94.1%                   97.4%
                                                                         proportionate                        income hard                 EPRA
                                                                         ownership
                                                                                                                currency                Occupancy
                                                             18.8%

                                                                                   25.1%
                                                                                                                 4.7                     2.7%
                                                                                                                 years                   weighted
                                                          Retail                      Office                  WALE (by GLA)            average lease
                                                          Hospitality                 Corp. Accomm                                       escalation
                                                          Light Industrial            LLR
                                                                                                                    #   as at 31 December 2019
                                                          Other Investments
                  Ι 7                                 1 split  by Asset Value, Grit proportionate ownership
                                                      2   total income-producing assets
Business Approach
Strong relationships combined with comprehensive risk control

        talented people                                             risk mitigants
    • Internal, strong & experienced executive                  •   Sustainable hard currency income
      management                                                •   Political Risk Insurance
    • High quality new hires                                    •   Margins of safety
    • Continuous staff development                              •   Proven ability to raise capital

                                                        v

        quality portfolio                                            relationships
    •   Geographic & sector diversification                     •   Multi-bank strategy
    •   Low vacancy & long-term leases                          •   Supportive anchor shareholders
    •   Target 50% in investment grade countries                •   Ability to access pipeline
    •   In-country asset & property management                  •   Blue-chip multinational tenants

                     Ι 8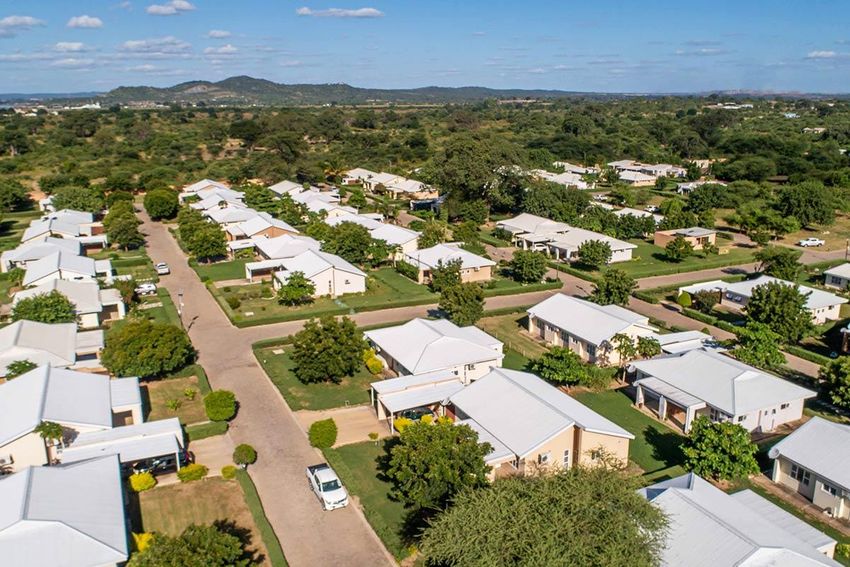
De-risked Investment Strategy

  01 02                                      03                                Margins                                          04                         05                           06
                                                 Political risk
                                                                                 of
                          Repatriation                                                                                                             Ability to
   Hard currency
                            of funds
                                                   & macro-
                                                  economics
                                                                               Safety                               Land tenure
                                                                                                                                                   raise debt
                                                                                                                                                                                 Counterparty

   CURRENCY               TENANCY                    REPATRIATION                      COUNTRY                      OPERATIONAL                    OVEREXPOSURE                         POLITICAL
     RISK                   RISK                         RISK                            RISK                           RISK                           RISK                               RISK

                    Prioritisation of                   Robust                      Target stable                   Reputable
Prioritisation of      long-term                    relations with                                                experienced in-                     Defined                    Comprehensive
                                                                                    jurisdictions
assets with USD       leases with                    the Central                                                     country                       diversification                 Political Risk
                                                                                   that satisfy our
  or USD/Euro           blue chip                   Bank, hedging                                                  partners and                      strategy in                 Insurance (PRI)
                                                                                   key investment
 denominated         multinational                  & monitoring                                                     property                          place2                     cover in place
                                                                                      criteria1
     leases              tenants                       policies                                                     managers

                           Notes:
                           1 – i.e. stable governance/political maturity, strong USD/FDI inflows, USD-based economies, high growth rates, acceptable sovereign ratings and outlook by
                    Ι 9    ratings agencies, solid economic fundamentals, clear tax regime
                           2 – i.e. target not more than 25% of the GAV Group in any single investment; target not more than 25% of the GAV of the Group in any single country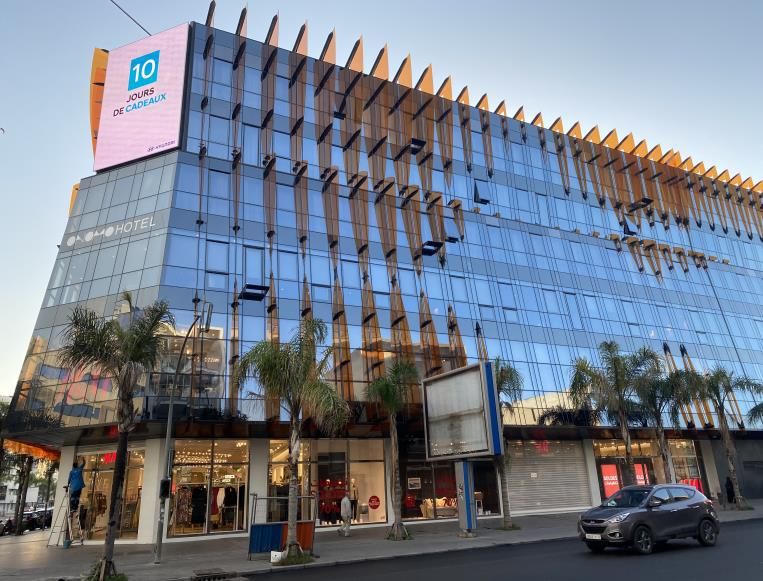
HY2020 Highlights (31 December 2019)
Robust financial and operational performance.

       Total Income                                                                                                            Growth in Profit from
                                                   EPRA NAV2                            Dividend Yield3
     Producing Assets1                                                                                                             operations4

                                                                                           SEM – 9.6%
      US$ 860.1 mln                                US$1.447                                                                               +47.3%
                                                                                           JSE – 10.3%
       HY2019: US$796.4mln                        HY2019: US$1.431                                                                      HY2019: +75.7%
                                                                                            LSE – 9.6%
1. A 7.9% increase with the property   2. EPRA NAV excludes deferred tax on       3. Based on minimum dividend target of      4. US$10.7m (HY2019) vs. US$7.3m
Portfolio increasing to 45 assets      Property                                   US$12.25cps, 31 Dec 2019 exchange rates     (HY2018) driven by escalations &
                                                                                  and share prices on respective exchanges    acquisitions

                                                                                         Adjusted EPRA
                                              First Prefunding
        Property LTV5                                                                  Earnings per share                                 WACD8
                                                   Project6
                                                                                            growth7
                                            Additional VDE units
               41.9%                           delivered profit                                 +5.8%                                      6.07%
                                          attributable to Group of
            HY2019: 40.5%                            $6.1mln                                 HY2019: +20.6%                              FY2019: 6.44%

5. Excluding corporate facilities      6. Inclusive of development profit share   7. Includes adjustments for deferred tax,   8. Driven by reductions in Libor post
                                       and property revaluation growth            unrealised FX movements and straight line   Refinance. WACD has dropped to 5.98% by
                                                                                  leasing adjustments                         December 2019
                                Ι 10
Strategic Objectives
1. Operational cost efficiency improvement
2. Pipeline Conversion & Funding
3. Redomicile & Premium Listing
4. Review of Listing Locations
5. Morocco REIT (Anfa)
6. Advancement of AM Strategy (LLR)/Paradise
Ι 11Existing Portfolio
Portfolio Characteristics
KEY METRICS
Geographic Split (HY2020)1 Sectoral Split (HY2020)1
EPRA Occupancy
2.6% 2.6% 0.8%
0.8% 97.4%
3.5% 3.4%
6.4% Multinational Tenants1
92.8% 17.2% 32.1%
14.0% *36% of portfolio 38.6% 1. Forbes 2000, Other Global & pan African tenant
is in Investment (by revenue)
Grade African Contracted Escalation2
countries
2.7%
13.5% 2. Weighted average annual escalation
18.8%
Hard Currency3 25.1%
20.6%
94.1%
3. Hard or pegged currency rental income
Mozambique Mauritius* Retail Office
Morocco* Zambia WALE4 Hospitality Corp. Accomm
Ghana Kenya Light Industrial LLR
Botswana* Other Investments 4.7 years Other Investments
1 Split by Asset Value, Grit proportionate ownership 4. Weighted Average Lease Expiry (by GLA) 1 Split by Asset Value, Grit proportionate ownership
Ι 13Portfolio Key Metrics – Geographic * at 31 December 2019
Botswana Other
Morocco Mozambique Ghana Mauritius Kenya Zambia Total
(LLR) 5 Investments6
Number of Properties/ Investments 1 9 3 5 2 3 20 3 46
Grit attributed Asset Value (USD '000) 1 109,201 312,028 51,503 166,245 27,965 113,275 21,112 6,393 807,722
Weighted Average Property Cap rate 8.3% 8.0% 7.6% 7.1% 8.3% 7.7% 9.0% - 7.8%
WALE *by GLA (years) 3.7 3.4 3.6 10.8 7.7 1.5 2.1 - 4.73
Weighted Average Lease Escalations (income) 3.3% 3.0% 2.8% 0.7% 4.0% 2.2% 6.8% - 2.7%
GRIT attributed Weighted Avg US$ Rental per
$39.30 $25.09 $33.25 $13.21 $11.87 $19.11 $7.07 - $23.39
m2 per month
Full GLA (m2) 33,280 91,693 16,971 120,046 19,860 65,958 151,452 - 499,260
Grit attributed GLA (m2) 33,280 91,693 10,905 69,907 16,781 47,097 45,436 - 315,098
EPRA Operating Cost to Income Ratio2 74.0% 22.2% 13.1% 2.9% 19.6% 17.2% 10.1% - 18.6%
EPRA Vacancies3 (%) 11.7% 1.3% 1.6% 0.0% 0.2% 2.4% 2.1% - 2.6%
Weighted average cost of property debt (%) 5.1% 7.5% 8.3% 4.0% 7.0% 6.3% 7.0% - 6.3%
4
Debt to Property Value (%) 40.8% 44.6% 38.1% 41.9% 34.2% 41.6% 29.8% - 41.9%
1. Value as at 31 December 2019 at Grit proportionate ownership. Portfolio value includes land values for Imperial Ph2 and Buffalo Mall Ph2.
2. Based on EPRA cost to income ratio calculation methodology
3. Vacancy is measured as a percentage of Total Estimated Rental Value, excludes those units under rental guarantee
Ι 14 4. Excluding corporate facilities
5. LLR reflected separately to enable comparable analysis of portfolio against prior reporting period
6. Includes land owned by Grit (Imperial Ph 2) and associate properties owned by our development associate – Gateway DeltaPortfolio Key Metrics – Sectoral * at 31 December 2019
Corporate Other
Retail Office Light Industrial Hospitality LLR5 Total
Accommodation Investments6
Number of Properties/ Investments 7 8 2 4 2 20 3 46
Grit attributed Asset Value (USD '000) 1 `259,622 201,980 27,839 151,543 139,233 21,112 6,393 807,722
Weighted Average Property Cap rate 8.0% 7.7% 8.1% 7.0% 8.3% 9.0% - 7.8%
WALE *by GLA (years) 2.6 4.3 5.7 11.0 3.7 2.1 -
4.73
Weighted Average Lease Escalations (income) 2.8% 3.6% 3.2% 0.6% 2.1% 6.8% - 2.7%
GRIT attributed Weighted Avg US$ Rental per m2 per
$27.49 $30.14 $10.57 $13.39 $22.23 $7.07 - $23.39
month
Full GLA (m2) 121,748 51,646 18,519 111,777 44,117 151,452 - 499,260
Grit attributed GLA (m2) 99,808 45,580 18,519 61,638 44,117 45,436 - 315,098
EPRA Operating Cost to Income Ratio2 33.2% 7.1% 9.3% 3.4% 16.9% 10.1% - 18.6%
EPRA Vacancies3 (%) 6.2% 1.2% 0.6% 0.0% 0.1% 2.1% - 2.6%
Weighted average cost of property debt (%) 6.1% 7.4% 6.7% 4.0% 7.4% 7.0% - 6.3%
Debt to Property Value4 (%) 42.1% 42.5% 34.5% 41.4% 43.7% 28.9% - 41.9%
1. Value as at 31 December 2019 at Grit proportionate ownership. Portfolio value includes land values for Imperial Ph2 and Buffalo Mall Ph2.
2. Based on EPRA cost to income ratio calculation methodology
3. Vacancy is measured as a percentage of Total Estimated Rental Value, excludes those units under rental guarantee
Ι 15 4. Excluding corporate facilities
5. LLR reflected separately to enable comparable analysis of portfolio against prior reporting period
6. Includes land owned by Grit (Imperial Ph 2) and associate properties owned by our development associate – Gateway DeltaTop 15 Tenants (as at 31 December 2019)
Majority of portfolio income generated from strength of multinational tenancies
Rank1 Key Tenant Industry Income (% of Group Total) Tenant Grading Lease Covenant Lease Currency
1 Beachcomber Hospitality 11.4% Other Global Triple Net EUR
2 Vodacom Telecommunications 10.9% Forbes 2000 Double Net USD
3 Total Oil & Gas Exploration 7.5% Forbes 2000 Traditional USD
4 Vale Mining 7.3% Forbes 2000 Traditional USD
5 Lux Tamassa Hospitality 5.8% Other Global Triple Net EUR
6 US Embassy Consular 5.0% Other Global Traditional USD
7 Shoprite Retail 3.3% Forbes 2000 Gross USD/ZMW
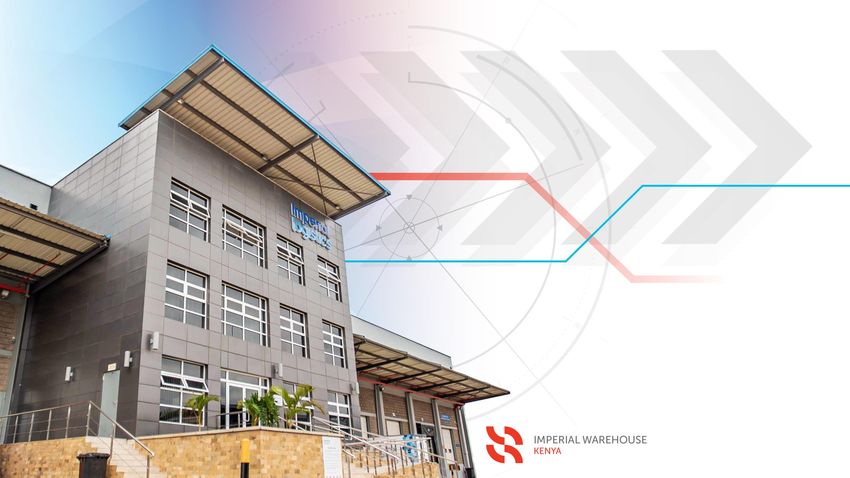
8 Imperial Health Sciences Kenya Logistics 2.8% Pan African Triple Net USD
9 Tullow Ghana limited Oil & Gas Exploration 2.7% Other Global Traditional USD
10 Game / Massmart Retail 2.4% Forbes 2000 Gross USD
11 Barclays (ABSA Group) Financial Services 2.1% Forbes 2000 Traditional USD/MUR
12 International Retail Morocco Retail 1.9% Other Global Traditional MAD
13 Hollard Insurance 1.8% Other Global Traditional USD
14 Exxon Mobil Oil & Gas Exploration 1.7% Forbes 2000 Traditional USD
15 GCNET IT/Communication 1.4% Other Global Traditional USD
Total 67.8%
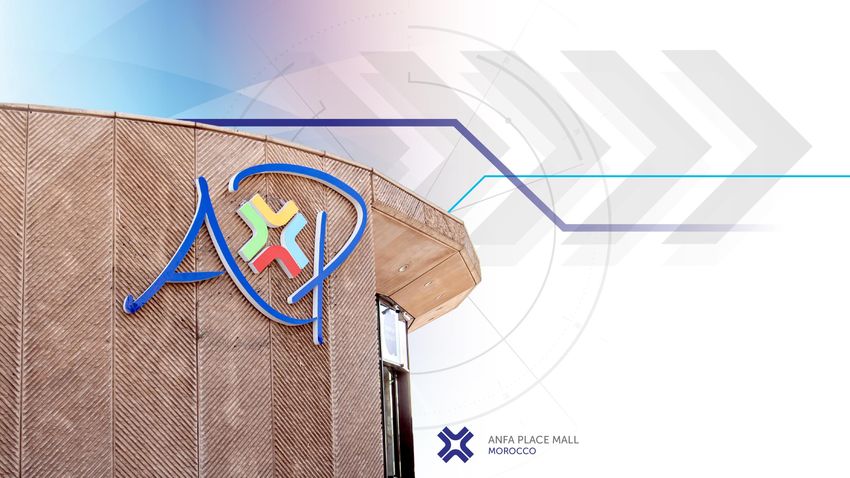
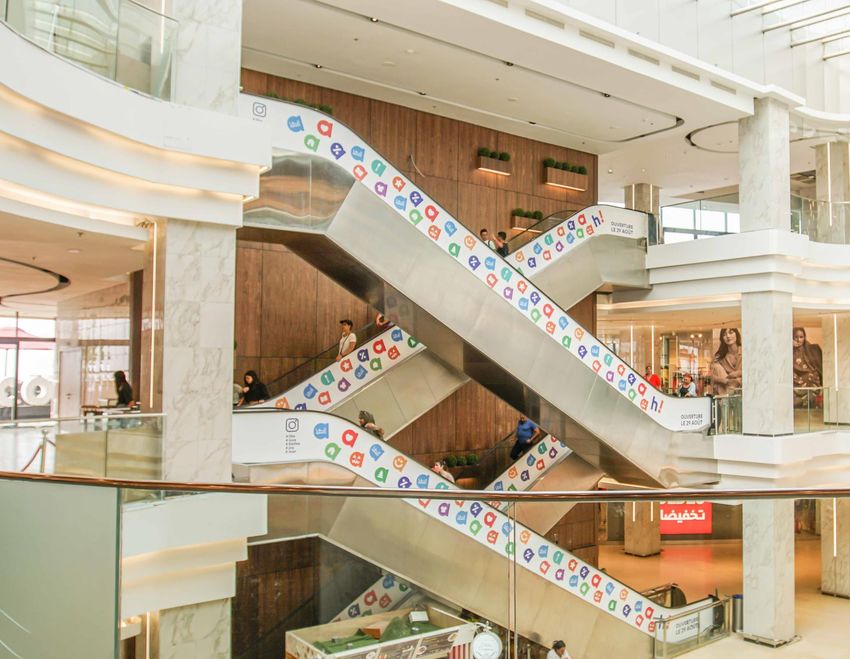
Ι 16 1. Ranked by incomePortfolio Update – AnfaPlace Mall (Morocco)
OPERATIONAL UPDATE
➢ Repositioning and tenant mix well-received, mall stabilising and trading in line with expectations
➢ Increasing average rents, WALE, GLA and valuation, continually reducing vacancies
➢ Exit of problematic tenant underway, freeing up 1,893m2 of lettable space
➢ Single tenant occupies 5 street retail outlets (Pizza Pino, Meat Co, Little Bartons, Paradis du Fruit, Okku / Kasai)
➢ Principal driver of the US$1.3m bad debt impact in HY2020
OPERATIONAL KEY METRICS
Dec 2019 Dec 2018 Change Comment
USD Rent per m2 per Premier retail space commanding higher
US$39.30 US$35.38 +11.1%
month rentals
WALE (years) (GLA) 3.71 3.52 +0.19 yr Longer lease terms signed
GLA (m2) 33,280m2 31,934m2 +4.2% Optimized GLA, more rentable space
Vacancy (%) 11.7%* 20.1% -8.4% Positive letting activity
Valuation (US$m) $109,200,793 $92,167,535 +18.5% Positive valuation uptick
*Vacancy comprises of 6.2% retail area and the remaining 5.5% is storage area.
Ι 17Portfolio Update – Moroccan REIT
MOROCCAN REIT STRATEGY
➢ Conditional agreement for the acquisition of a Moroccan-REIT (OPCI) vehicle that owns the
Massira Corner mixed use property
➢ OPCI’s to target further acquisitions of between EUR300m to EUR400m starting with:
• Exclusivity over an A-grade industrial asset in Meknes Industrial zone let to Aptiv Plc
• Memorandum of understanding for the development of a 350 key Club Med resort in Essaouira
• AnfaPlace Mall strategically positioned for inclusion to the OPCI
➢ Key cornerstone investors to take up shares alongside Grit in the OPCI structure.
ANNOUNCED ACQUISITION - MASSIRA CORNER (post-period)
➢ Prime corner site 16 500m2 mixed-use asset located in the center of Casablanca (flagship acquisition)
➢ Anchor tenants: Onomo Hotels (201 keys, 9 year triple net lease), H&M, Starbucks, Charles & Keith
➢ 69% hospitality / 31% retail (by area) – unlocks new strategic partnership with Onomo Hotels
Ι 18Portfolio Update – VDE Housing Estate (Mozambique)
PORTFOLIO UPDATE – FIRST PRE-FUNDING DEVELOPMENT
➢ Grit contracted, on a turnkey basis, for the delivery of 60 additional units to the scheme
➢ Grit provided forward funding to the developer in exchange for profit-share participation and a
mechanism to boost NAV growth
OUTCOME OF FIRST PRE-FUNDING DEVELOPMENT AND PROFIT SHARE
➢ 60 additional units completed and handed over from October through
December 2019, leased to Vale on a newly executed five-year US$ lease.
➢ Development completed on time and on budget.
➢ Total construction costs amounted to US$9.3m (exclusive of VAT), profit share
amounted to US$4.6m & the 60 specific units were valued at US$17.4m.
➢ Overall increase in the value of the accommodation complex attributable to the
Group for the period was US$6.1m.
Ι 19Portfolio Update: Club Med Senegal (post-period)
ACQUISITION UPDATE
➢ Transfer of shares and ownership taken on 27 January 2020
➢ Large-scale renovation project will re-position the resort
➢ Lease term is renewed on a 12-year triple net Euro lease*
REDEVELOPMENT PROJECT OVERVIEW
➢ Construction of 122 new GM rooms (Suites, Deluxe, Club)
➢ Renovation & Reconfiguration to 195 GM rooms (from 204) - Club, PMR
➢ Creation of a Gourmet Lounge, a Zen swimming pool, a Passworld, spa
➢ Extension and renovation of existing facilities (GO accommodation, cardio,
discovery area, swimming pool, bar, main restaurant, club house, etc.)
➢ Re-development budget capped at EUR28M
➢ Renovation and development works expected to commence by end of Q1 2020
*Current lease & new development lease underpinned by a Club Med parent company guarantee
Ι 20Asset Management Opportunity – LLR (Botswana)
LLR CURRENT STATUS QUO
➢ Grit now owns 30% stake in LLR (up 23.75% from 6.25% initial stake)
➢ LLR Portfolio includes 20 assets, with an LTV ofFinancial Review
HY2020 Highlights (at 31 December 2019)
Robust performance
Adjusted EPRA
EPRA NAV growth2 WACD3 Debt refinance4
earnings1
US$5.67 cps +1.1% 6.07% US$140 million
Mozambique facility
HY2019: US$5.36 cps (+5.8%) HY2020: US$1.447 FY2019: 6.44%
HY2019: US$1.431
1. Includes adjustments for deferred 2. EPRA NAV excludes deferred tax on 3. As a result of movements in LIBOR and 4. On Mozambique portfolio, effective
tax, unrealised FX movements and Property Mozambique refinance. At 31 Dec, WACD is interest rate reduced by 1.14%
straight line leasing adjustments at 5.98%
Gross Rental income Admin cost to Total EPRA Property cost to
Dividend
growth Asset Value5 income6
+29.9% US$5.25cps 2.1% 18.6%
HY2020: US$24.3m HY2019: US$5.25cps FY2019: 1.7% HY2019: 15.6%
HY2020: US$18.7m
5. Increased headcount and 6. EPRA cost ratio incl associates
Ι 23
increase in professional fees, costs
weighted in first halfEPRA NAV Bridge – HY20
Portfolio Performance
* EPRA NAV cum dividend
Ι 24
# Other non-cash items include non-distributable profits/(loss), non-controlling interest share in profit, movement in foreign currency translation reserve & treasury sharesDistributable Income
14
31 December 2019 +2.7% +1.0% +0.1%
US$’000 12.20
12.07 1 12.19
Basic Earnings attributable to the owners of the parent 13,130 12 11.75
6.12 6.95
Add Back non-cash items: 6.17
6.12
- Straight-line leasing (non-cash rental) & right of use amortization 1867
- Total fair value adjustment on investment properties owned (486) 10
US$ Cents per share (CPS)
- Fair value adjustments included under income from associates (2,535)
- Fair value adjustment on other investments (591)
- ECL Provision 218 8
- Unrealised foreign exchange gains or losses (non-cash) 403
- Fair value adjustment on other financial asset & instruments 416
- Impairment of loan 904 6 5.48
- Share based payments 90 5.95 6.07
5.58
- Movement in deferred tax 2,419 5.25 5.25
- Depreciation and amortization 259 4
Items added back
- Acquisition costs not capitalized 1,131
- Anfa costs not capitalised 324 2
- LLR day one gain (2,066)
Other cash generation
- VAT and tax credits utilized 304 0
- Antecedent dividend 418 FY16 FY17 FY18 FY19 HY20
TOTAL DISTRIBUTABLE EARNINGS 16,203
Distributable earnings per share (US$ cps) 5.48 Interim Dividend Final Dividend
2
Earnings Held Back
Weighted average shares in issue (‘000) 297,581
Final Distribution declared per share US$5.25 cps 1. Includes special dividend for FY17
2. Distribution flat on prior year, with a portion of earnings held
Ι 25 back for 2H2020Loan to Value
LTV impacted by acquisition of the additional VDE units which were debt funded. LTV is expected to reduce towards
the targeted 40% by the end of the financial year.
60.0%
51.0%
49.2%
50.0%
43.4% 43.9%
35.0% - 40.0%
40.0%
TARGET LTV
30.0%
20.0%
35-40%
10.0%
0.0%
HY17 HY18 HY19 HY20 Post HY20
Ι 26Weighted Average Cost of Debt
WACD declined to 6.07% (June 2019: 6.44%) as a result of active treasury management activities and downward
movements in LIBOR over the reporting period.
7.0%
6.8% % Interest Rate
6.6% Hedged
6.4% 6.31%
68.80%
6.2%
6.07%
6.0%
5.80%
5.8% 5.69%
HEDGE MATURITY
5.6%
3.79
5.4%
years
5.2%
5.0%
HY17 HY18 HY19 HY20 Post HY20 (Target)
Ι 27Key Financial Metrics
INTEREST COVER OPEX TO INCOME INCL. ASSOCIATES
3.0
19.0% 18.6%
2.3
2.5
1.8 2.1 18.0%
2.0 17.0%
1.6
17.0%
1.5 15.6%
1.0 16.0%
0.5 15.0%
0.0 14.0%
HY17 HY18 HY19 HY20 HY19 FY19 HY20
NET EUR EXPOSURE ADMIN COST TO ASSET VALUE
70.0 62.3 66.3 2.5% 1
60.0 54.9 2.1%
43.9 2.0%
50.0 1.6% 1.5%
EUR (‘000s)
40.0 1.5% 1.3%
30.0 21.7 1.0%
20.0 0.5%
10.0
0.0%
0.0 HY17 HY18 HY19 HY20
FY16 FY17 FY18 FY19 HY20
1. Impacted by one off professional costs and increased staff compliment
Ι 28 ahead of acquisitions and premium listingDebt Financing Overview
The Group has continued to develop strong relationships with financiers. The multi-bank approach adopted by Grit has
continued, with the main banking partners being Bank of China, Standard Bank, ABSA Bank and SBM (Mauritius) Ltd.
DEBT EXPIRY PROFILE (HY2020) MULTI BANK STRATEGY (HY2020)
300.0
258.10 33.0%
250.0
200.0
25.3%
US$ (‘000s)
150.0
15.1%
100.0
11.6%
11.0%
50.0 38.9
29.6 24.9Statement of Comprehensive Income
GROUP
31 Dec 2019 31 Dec 2018
Condensed consolidated statement of comprehensive income - For the 6 months ended 31 Dec 2019
(US$’m) (US$’m)
Gross rental income 24.3 18.7
Straight-line rental income accrual (0.2) 0.6
Revenue 24.1 19.4
Property operating expenses (6.3) (4.0)
Net property income 17.8 15.4
Other income 3.0 0.1
Administrative expenses (including corporate structuring costs) (10.0) (8.2)
Profit from operations 10.8 7.3
Total fair value adjustment on investment properties 3.0 15.1
Total other fair value adjustment on other investments 0.0 0.0
Impairment of loan / financial asset (1.0) 0.0
Share-based payment expense 0.0 (0.1)
Share of profits from associates 12.6 7.7
Foreign currency gains / (losses) 0.1 (1.1)
Profit before interest and taxation 25.3 28.9
Interest income 2.4 6.7
Finance costs (12.6) (11.0)
Profit for the period before tax 15.1 24.6
Taxation (3.4) (3.6)
Profit for the period after tax 11.7 21.0
Gain / (loss) on translation of functional currency (1.4) (1.3)
Total comprehensive income 10.3 19.7
Ι 30Condensed Statement of Financial Position INCOME PRODUCING ASSETS
Condensed consolidated statement of financial position 30 Dec 2019 31 Dec 2018 30 Dec 2019 31 Dec 2018 Movement
As at 31 Dec 2018 (US$’m) (US$’m) (US$’m) (US$’m)
Assets
Non-current assets
Investment properties 596.0 552.8 596.0 552.8 44.3%
Deposits paid on investment properties 8.5 15.4 8.5 15.4 38.7%
Other investments 0 4.2 0 4.2 0.0%
Investments in associates 171.4 135.7 208.2 174.0 -13.6%
Other loans receivable 29.3 42.9 29.3 42.1 0.0%
Related Party loans receivable 12.5 0.1 14.6
Other non-current assets 26.6 13.1 0.5 0.5 9.1%
Total non-current assets 844.3 764.2 857.1 789.0 23.1%
Total current assets 68.4 69.7 3.0 7.4 100.0%
Total assets 912.7 833.9 860.1 796.6 28.0%
Equity and liabilities
Total equity attributable to ordinary shareholders
Ordinary share capital 454.1 443.2
Treasury shares reserve (18.4) (14.8)
Reserves (43.3) (27.4)
Equity attributable to owners of the Company 392.4 401.0
Non-Controlling interests 2.6 16.7
Total equity 395.0 417.7
Liabilities
Redeemable preference shares 12.8 12.8
Interest-bearing borrowings 369.1 201.5
Other non-current liabilities 59.5 44.9
Total non-current liabilities 441.4 259.2
Interest-bearing borrowings 15.0 123.4
Other current liabilities 61.2 33.6
Total current liabilities 76.2 157.0
Total liabilities 517.6 416.2
Total equity and liabilities 912.7 833.9
Ι 31Growth & Pipeline
Asset Value Update
Total Income Producing Asset Value3
• Total Income Producing Asset Value 1000
• US$860.13 million (+4.2%) 950
900 2
• Acquisitions completed: 2
860.1
850 825.2
• Additional 23.75% interest in Letlole
800
La Rona (LLR) (Botswana) Nov 2019
750
• 60 additional units at VDE Housing
Estate (Mozambique) Dec 2019 700
642.3
650
• Like for Like valuation increase:
US$m
600
• +2.9% with the independent portfolio
550
was valuation at 31 December 2019 488.5
1
500
450
400
350
1. FY17 includes restated figures as per financials
2. Includes property loans receivable 300
250
200
FY17 FY18 FY19 HY2020
Ι 33Pipeline - Summary
Medium term pipeline in excess of US$470 million, spread across multiple sectors with existing and new global tenants.
ANNOUNCED PIPELINE ACQUISITION SUMMARY
Property Provisional * NAV
Name Sector Country Type Anchor Tenant Deal Value Share %
Yield Valuation increase
PwC Head Office Office Ghana Asset Acquisition PWC Ghana 8.50% US$ 20.3m US$ 20.5m US$0.2m 50.0%
Huawei Head Office Office Ghana Asset Acquisition Huawei 9.00% US$ 13.6m US$ 13.6m 50.0%
Grit Urban Logistics Industrial Kenya Greenfield To be confirmed 9.20% US$ 11.8m 100.0%
Orbit Africa (Ph I) Industrial Kenya Asset Acquisition Orbit Products Africa 9.24% US$ 32.2m US$ 32.4m US$0.2m 100.0%
Orbit Africa (Ph II) Industrial Kenya Greenfield Orbit Products Africa 11.20% US$ 9.11m US$ 16.3m US$7.2m 100.0%
St Helene Hospital Healthcare Mauritius Greenfield PDL (Artemis) 10.50% US$ 13.3m US$ 15.5m US$2.2m 86.6%
Coromandel Hospital Healthcare Mauritius Greenfield PDL (Artemis) 10.50% US$ 23.4m US$ 27.3m US$3.9m 86.6%
Massira Corner Mixed use Morocco Asset Acquisition Onomo Hotels, H&M 7.70% US$80.4m 100.0%
Cap Skirring development Hospitality Senegal Greenfield Club Med 7.5% - 8% EUR28m 100.0%
Club Med Essaouira Hospitality Morocco Greenfield Club Med 7.00% US$95.7m 100.0%
* Indicative estimates only using currently available indicative valuations and should not be relied upon as a forecast
Ι 34Announced Pipeline Acquisitions Update
Target Closing
April 2020 Size (GLA): 5,176m2 Property Yield: 8.5%
Date:
PWC Location: Accra, Ghana
Acquisition
$20.3m Avg Annual Escalation: 1.64%
Costs
BUILDING PwC - (79% of GLA);
Anchor Tenant lease
Sector: Office WALE: 12.93 years 15years; Triple Net,
terms
USD
Target Closing
April 2020 Size (GLA): 3,913m2 Property Yield: 9.0%
Date:
HUAWEI Location: Accra, Ghana
Acquisition
$13.6m Avg Annual Escalation: 2.38%
Costs
BUILDING Huawei – (73% of GLA);
Anchor Tenant lease
Sector: Office WALE: 4.39 years 3.9 years (5+5 years);
terms
Triple Net, USD
Target Closing Ph 1 - 29,243m2 Ph 1 – 9.24%
April 2020 Size (GLA): Property Yield:
Date: Ph 2 - 15,185m2 Ph 2 – 11.20%
ORBIT Mlolongo, Acquisition Ph 1 - $32.2m Ph 1 - 2.0%
Location: Avg Annual Escalation:
AFRICA Nairobi, Kenya Costs Ph 2 - $9.11m Ph 2 – 2.0%
(PHASE 1 & 2) Ph 1 - 25 years
Anchor Tenant lease
Orbit Products Africa;
Sector: Industrial WALE: Ph 2 – c.23 25 years; Triple Net
terms
years Lease; USD lease
Ι 35Announced Pipeline Acquisitions Update
Target Closing
April 2020 Size (GLA): 5,727m2 Property Yield: 10.5%
Date:
ST. HELENE
Development US$13.3m European Harmonised
HOSPITAL Location: Floréal, Mauritius
Costs Development
Avg Annual Escalation:
CPI, min. of 2.0%
(DEVELOPMENT)
Anchor Tenant lease PDL (Artemis), 15 years;
Sector: Industrial WALE: 15 years Triple Net, EUR-linked
terms
Target Closing
June 2021 Size (GLA): 9,961m2 Property Yield: 10.5%
Date:
COROMANDEL
Coromandel, Development US$23.4m European Harmonised
HOSPITAL Location:
Mauritius Costs Development
Avg Annual Escalation:
CPI, min. of 2.0%
(DEVELOPMENT)
Anchor Tenant lease PDL (Artemis), 15 years;
Sector: Healthcare WALE: 15 years Triple Net, EUR-linked
terms
Target Closing
July 2020 Size (GLA): 16, 539m2 Property Yield: 7.7%
Date:
MASSIRA Location:
Casablanca, Acquistion
c.US$83.6m Avg Annual Escalation: 2.58%
Morocco Costs
CORNER Mixed-Use Onomo Hotels, 7.4 years,
Anchor Tenant lease
Sector: (Hospitality & WALE: 3.43 years renewable for a further 6
terms
Retail) years, Triple Net, MAD
Ι 36Pipeline Characteristics
Near term acquisition targets spread across multiple sectors with existing and new global tenants.
Sector Exposure (%)
35.0% 33.1%
30.0%
25.8% 26.5%
25.0% 23.2%
20.5%
19.4%
20.0%
17.8%
15.0%
12.4%
10.0%
7.4% 7.2%
5.0% 4.0%
2.8%
0.0% 0.0%
0.0%
Industrial Office Corporate Accommodation Hospitality Retail Specialised Mixed Use
Existing Existing + Secured + Target
Ι 37Outlook
Summary
Key Takeaways
Progressive
Existing Portfolio Robust Platform
Dividend
11 Performing Strongly Substantial investment
consecutive distribution and expected to continue in in market-leading team and
payments made FY2020 platform
Listing Structure Economies of Scale Pipeline
Premium Listing In-country expertise Extensive pipeline
intended in 2020, JSE listing potential to leverage existing of over US$470m1 of near-
being reviewed infrastructure term opportunities
1. These are targets only and are not guaranteed. These targets are based on a number of bases and assumptions which may or may not materialize.
Ι 39Medium Term Policies & Guidance
Group focus areas
Target Total Return
Dividends Payout Ratio
Focus
12%¹ Progressive Dividend Target a reduced ratio to
Minimum with the potential for below 90% over the
incremental development returns Policy medium term
over medium term
Share Buyback Development
LTV target
policy exposures
Up to 4.9% of issued Up to 20% of
Between 35% and 40% Group GAV
share capital
at the time of investment
1. These are targets only and are not guaranteed. These targets are based on a number of bases and assumptions which may or may not materialize.
Ι 40Annexures
Peer Performance
Target of 12% total USD return for Grit for FY20

                                                        Dividend Yield (%)
12.0

10.0                                                                                                                              9.6

                                                                                                                   8.5

 8.0

 6.0

                  3.9                  3.9                          3.8
 4.0                                                                                       3.6

 2.0

 0.0
       Global
         Global            Americas
                            Americas                Asia/Pacific
                                                      AsiaPacific                Europe
                                                                                  Europe           Middle
                                                                                                     MiddleEast  /Africa
                                                                                                            East Africa    Grit
                                                                                                                           GRIT

                                             2015     2016   2017         2018   2019   2020 YTD

                        Ι 42           Grit dividend yield calculated using USD-equivalent SEM price as at 31 December 2019. * Based on last issue price of US$1.27.
                                       Source: National Association of Real Estate Investment Trusts (as at 03 February 2020) - Returns in USD terms
ESG Grit is actively managing its Environmental, Social and Governance risks and opportunities
Environmental Social Governance
National Code of Corporate
Governance for Mauritius 2016
Aligning strategies and operations Empowering the female working King IV Report (South Africa)
to UNGC standards community through WWG networking
events and talks.
GRIT STAFF IN NUMBERS
75% UK Corporate Governance Code*
Reduction of paper usage, committed to 47%
local are women
recycling and reducing carbon footprint at employees Upcoming Projects:
all assets.
of women employed ISO 45001 compliments the
fundamental concepts of King IV
43% occupy managerial
positions and above *Full compliance to be achieved in 2020 corporate governance by focussing
on risks and opportunities in terms
Supporting All Life Matters, an NGO that of Occupational Health & Safety.
board members Board composition:
provides a low-cost veterinary clinic, free 33% are women 83% Independent Non- Executive
Grit has started the process and
aims to be fully compliant during the
sterilization, a home for many stray animals, Directors
creates jobs for the local community. first quarter of 2021.
Other CSR
actions
relate to:Executive Members of the Board
Bronwyn Corbett Bronwyn is a founding member and CEO of Grit Real Estate Income Group, the largest pan-African focused real
estate group listed on the LSE, JSE and SEM (stock exchanges in London (UK), Johannesburg (South Africa) and
Chief Executive Officer Port Louis (Mauritius) respectively). Bronwyn has over 14 years’ experience in the real estate investment sector.
& Co-founder She worked in a real estate investment firm for 4 years as Financial Director before joining Motseng Investment
B.Comm (Acc) Holdings in April 2009 as CFO. Together with the CEO, she was instrumental in growing the company’s direct real
(Univ. of Natal, PMB), CA(SA) estate exposure to ZAR2 billion within 3 years, before listing the portfolio on the JSE as Delta Property Fund –
where she held the positions of CFO and CIO. Bronwyn was part of the executive team that grew Delta Property
Appointed to the board
Fund to a portfolio valued at ZAR12 billion in 4 years and converted the structure to a REIT. In 2014, she co-
on 12 May 2014 founded Delta International Property where she was appointed CEO. Under Bronwyn’s leadership, Grit has
consistently achieved Dollar-based distribution exceeding 7%. She has driven the growth of the portfolio from
US$140 million and two assets, to c.US$800 million and 46 assets across seven jurisdictions.
Leon van de Moortele Leon joined Grit in April 2015 as CFO, where he has utilised his tax structuring knowledge and experience in
operating in Africa to expand the asset base of the group. After completing articles with PwC, Leon moved to
Chief Finance Officer the Global Risk Management Services within PwC, where he become the Senior Manager in charge of Data
BCompt (Hons), CA(SA) Management. In 2004, he moved to Solenta Aviation where he became Group Finance Director within 18
Appointed to the board months. During his tenure as Group Finance Director, the group expanded from 12 aircraft to 48 aircraft,
on 30 June 2015 operating in 8 African countries (South Africa, Mozambique, Algeria, Ghana, Gabon, Kenya, Tanzania and Cote
d’Ivoire).
Ι 44Non-Executive Members of the Board
Peter Todd Peter is a qualified attorney and began his career as the senior tax manager at Arthur Andersen and Associates
in Johannesburg. He joined TWS Rubin Ferguson in 1993 as a tax partner and was instrumental in listing several
Independent Non-Executive companies on the JSE.
Chairman
Other Listed Directorships: 1 In 2000, Peter established Osiris Group in the British Virgin Islands and Mauritius to provide international
Appointed to the board corporate finance and administrative services to global clients. Peter has significant understanding of the
on 14 August 2014 property industry in the UK, South Africa and the rest of Africa.
Appointed as chairman
on 13 April 2018
Ian Macleod Ian holds a BCom (Honours) in Real Estate Investment, Valuation and Development and has over 46 years of
experience with financial institutions, including Standard Bank of South Africa and Nedbank with a specific
Senior Independent focus on Real Estate Credit Risk.
Non-Executive Director
Other Listed Directorships: 2 He has extensive knowledge of the real estate sector’s key role players, business sector and geographic nodes.
Appointed to the board Ian has managed portfolios in excess of ZAR80 billion during changing economic cycles and managing
on 30 June 2015 problematic properties in economic downturns. Ian is a former Head of Credit for Real Estate for Standard Bank
South Africa Limited.
Ι 45Non-Executive Members of the Board
David Love David Love is a Fellow Chartered Accountant, qualifying with Deloitte, and holds a BCom and LLB (Hons First) in
Land Law, Equity and Trusts. He has over 19 years’ experience in the real estate investment sector.
Independent Non-Executive
Director
He has been instrumental in the completion of a number of high profile European real estate transactions
Other Listed Directorships: 0 including the listing of Picton Property Income Limited on the LSE and the formation of a £1.4b UK Property
Appointed to the board Authorised Investment Fund. David is currently the CFO of Knight Frank Investment Management.
on 4 December 2018
Catherine McIlraith Catherine holds a Bachelor of Accountancy has been a member of the South African Institute of Chartered
Accountants since 1992. She served her articles at Ernst & Young in Johannesburg and then joined the
Independent Non-Executive Investment Banking industry. Catherine has held senior positions at Ridge Corporate Finance, BoE NatWest and
Director BoE Merchant Bank in Johannesburg. In 2004 she joined Investec Bank Mauritius where she was Head of
Other Listed Directorships: 7 Banking until 2010.
Appointed to the board
on 24 November 2017 Catherine held various independent non-executive board positions in Mauritius including AfrAsia Bank Ltd, Les
Gaz Industriels Ltd and The Mauritius Development Investment Trust Co Ltd. She has also been a member of
the Financial Reporting Council (FRC) and is a Fellow Member of the Mauritius Institute of Directors.
Ι 46Non-Executive Members of the Board
Sir Samuel Esson Sir Samuel Jonah is one of Africa’s leading businessmen and internationally recognised as a leading business
executive. He obtained a Master’s degree in Management from Imperial College, London following which he
Jonah, KBE, OSG
worked for Ashanti Goldfields and became CEO of the company in 1986.
Independent Non-Executive
Director Sir Samuel Jonah was elected Foreign Member of the United States National Academy of Engineering in 2018.
Other Listed Directorships: 1
Appointed to the board An Honorary Knighthood was conferred on him by Her Majesty the Queen in 2003 and in 2006 he was awarded
on 21 February 2019 Ghana’s highest national award, the Companion of the Order of the Star.
Nomfundo Nomkosi Nomzamo Radebe is a qualified Chartered Accountant who has furthered her studies in real estate, with a
successful career spanning over 20 years.
Nomzamo Radebe
Non-Executive Director
Nomzamo is the Chief Executive Officer of Excellerate Real Estate Services. She is a former Chief Investment
Other Listed Directorships: 1 Officer of Pareto Limited, and prior to this, she worked as a Director and in the Sasol Group treasury unit as a
Appointed to the board Treasury Operations Manager. Nomzamo was awarded the IPM Business Leader of the year 2016 and the Five
on 24 November 2017 Star Woman award by the Women Property Network in 2009.
Ι 47Non-Executive Members of the Board
Bright Laaka Bright has 16 years’ experience in Business Development, Sales and Marketing. He holds a BSc (Agric), MSC
Production Physiology and an MBA in Entrepreneurship.
Independent Non-Executive
Director
Bright is the founder and CEO of Rural Development Alliance Group in South Africa. He is a member of the SA
(Permanent Alternate) BRICS Agribusiness, a technical advisory and business development working group, as well as Alpha Africa
Other Listed Directorships: 0 Foundation, a non-profit organisation that primarily works in rural areas to improve the livelihood of
Appointed to the board community members.
on 29 November 2018
Bright is also a former New Business Development Manager for two multinational companies listed on the New
York Stock Exchange.
Ι 48Disclaimer
This report has been prepared by Grit Real Estate Income Group Limited ("Grit" or the “Company”) solely for your information and should not be considered to be an offer or solicitation of an offer to buy or sell or subscribe
for any securities, financial instruments or any rights attaching to such securities or financial instruments. In particular, this report does not constitute an offer to sell, or the solicitation of an offer to acquire or subscribe for,
securities in any jurisdiction where such offer or solicitation is unlawful.
All information and statistics provided in this presentation relating to targeted acquisitions or post-targeted acquisitions status is predicated on information available to the Company at the time of printing of this
presentation. Such information may be subject to change depending on final negotiations and documentation related to such targeted acquisition.
None of the directors, officers or employees of Grit make any representation or warranty, express or implied, as to the accuracy or completeness of the information or opinions contained in this report.
This report is a summary only, and does not include all material information about Grit. This report contains certain statements which are, or may be deemed to be, 'forward-looking statements'. By their nature, these
forward-looking statements and the facts contained therein are subject to a number of known and unknown risks, uncertainties and contingencies, many of which are beyond Grit’s control or influence, and actual results and
events could differ materially from those currently being anticipated as reflected in such statements. These forward-looking statements speak only as of the date of this publication. Past performance should not be taken as
an indication or guarantee of future results and no representation or warranty, express or implied, is made regarding future performance. Except as required by any applicable law or regulation, the Company expressly
disclaims any obligation or undertaking to release publicly any updates or revisions to any forward-looking statements contained in this publication to reflect any change in Grit's expectations or any change in events,
conditions or circumstances on which any such statement is based. Accordingly, undue reliance should not be placed on any such forward-looking statements.
Forward-looking statements have not been reviewed by external auditors and are the responsibility of the Board of Directors of the Company.
All targets mentioned in this presentation are targets only and are not guaranteed. These targets are based on a number of bases and assumptions. which may or may not materialize and have not been assessed or validated
by the auditors. Nothing in this presentation should be construed as a profit forecast.
Nothing in this report should be viewed, or construed, as "advice", as that term is used in the South African Financial Markets Act, 2012, and/or Financial Advisory and Intermediary Services Act, 2002 and/or the equivalent
legislation in the United Kingdom, United States of America or in the Republic of Mauritius.Thank You
Grit Real Estate Income Group
Reg. No. C128881
T +230 269 7090 3rd floor, La Croisette Shopping Centre, Grand Baie 30517, Mauritius
E ir@grit.group Level 3, Alexander House, 35 Cybercity Ebene 72201, MauritiusYou can also read