2nd QUARTER Supplemental Information Package - SmartCentres
←
→
Page content transcription
If your browser does not render page correctly, please read the page content below
SM A RTCE N T R ES R EI T
smart t o d ay smart t o m o rr o w

2nd QUARTER
Supplemental Information Package
FOR THE THREE AND SIX MONTHS ENDED JUNE 30, 2018
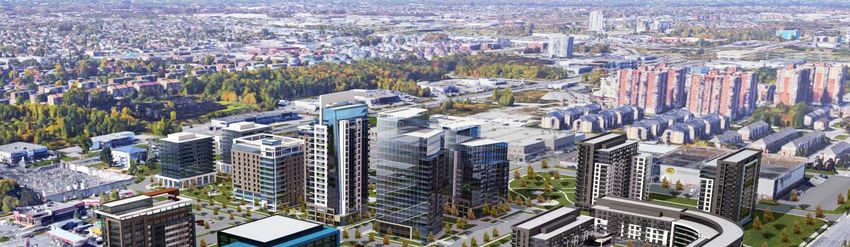
TABLE OF CONTENTS

Notice to Reader …………………………………………………………………………........………….... 2
Conference Call Highlights ………….……..………………………………………………………………. 3
Looking Beyond ……………………………………………………..…………………………………… 10
Portfolio Highlights ……………………………...……………...…………………………………………. 12
Distribution Reinvestment Plan ……………………………………………...…………………………… 13
           Distribution History …………………………………………..………………….…………..... 13
Performance of SmartCentres Units ………………………………………………………………......... 14
           Average Unit Trading Price …………………………………………………………….…….. 14
           Average Daily Volume of Units Traded ………………………………………..……………. 14
           Market Capitalization Summary ………………………………………………..……………. 14
Gross Revenue and Area by Province ………………………………………………………………….. 15
Top 25 Tenants ……………………………………………………………………………………............. 16
Lease Expiration Schedule ……………………………………………………………………………..… 17
Area by Age …………………………………………………………………………………………….….. 18
Future Earnouts and Developments ………………………………………………………………......… 19
Major Mixed-Use Real Estate Initiatives ……….……………………………………………………...… 20
Recourse Loans to Developers ………………………………………………………………………….. 22
Individual Property Summary ………………………………………………………………………..…… 23
General Information ………………………………………………………………………........................ 36
.

SMARTCENTRES REAL ESTATE INVESTMENT TRUST
JUNE 2018 SUPPLEMENTAL INFORMATION PACKAGE                               1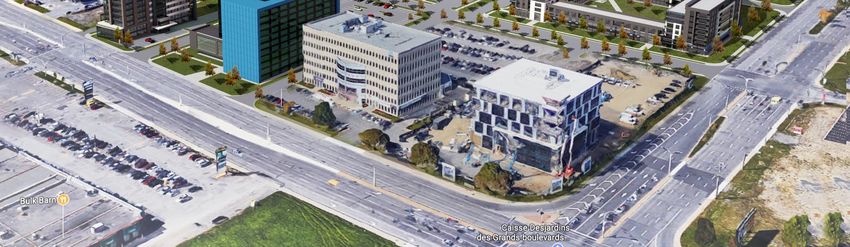
NOTICE TO READER

Readers are cautioned that certain terms used in this Supplemental Information Package
(“Supplement”) such as Funds From Operations ("FFO"), Adjusted Cashflow From Operations
("ACFO"), "Gross Book Value", "Payout Ratio", "Interest Coverage", "Total Debt to Adjusted EBITDA"
and any related per Unit amounts used by management to measure, compare and explain the
operating results and financial performance of the Trust do not have any standardized meaning
prescribed under IFRS and, therefore, should not be construed as alternatives to net income or cash
flow from operating activities calculated in accordance with IFRS. These terms are defined in this
Supplement and reconciled to the consolidated financial information of the Trust in the
Management’s Discussion and Analysis (“MD&A”) for the three and six months ended June 30,
2018. Such terms do not have a standardized meaning prescribed by IFRS and may not be
comparable to similarly titled measures presented by other publicly traded entities.

Certain statements in this Supplement are "forward-looking statements" that reflect management's
expectations regarding the Trust's future growth, results of operations, performance and business
prospects and opportunities. More specifically, certain statements contained in this Supplement,
including statements related to the Trust's maintenance of productive capacity, estimated future
development plans and costs, view of term mortgage renewals including rates and upfinancing
amounts, timing of future payments of obligations, intentions to secure additional financing and
potential financing sources, and vacancy and leasing assumptions, and statements that contain
words such as "could", "should", "can", "anticipate", "expect", "believe", "will", "may" and similar
expressions and statements relating to matters that are not historical facts, constitute "forward-
looking statements". These forward-looking statements are presented for the purpose of assisting
the Trust's Unitholders and financial analysts in understanding the Trust's operating environment,
and may not be appropriate for other purposes. Such forward-looking statements reflect
management's current beliefs and are based on information currently available to management.
However, such forward-looking statements involve significant risks and uncertainties. A number of
factors could cause actual results to differ materially from the results discussed in the forward-looking
statements. Although the forward`looking statements contained in this Supplement are based on
what management believes to be reasonable assumptions, the Trust cannot assure investors that
actual results will be consistent with these forward-looking statements. The forward-looking
statements contained herein are expressly qualified in their entirety by this cautionary statement.
These forward-looking statements are made as at the date of this Supplement and the Trust
assumes no obligation to update or revise them to reflect new events or circumstances unless
otherwise required by applicable securities legislation.

SMARTCENTRES REAL ESTATE INVESTMENT TRUST
JUNE 2018 SUPPLEMENTAL INFORMATION PACKAGE                                                              2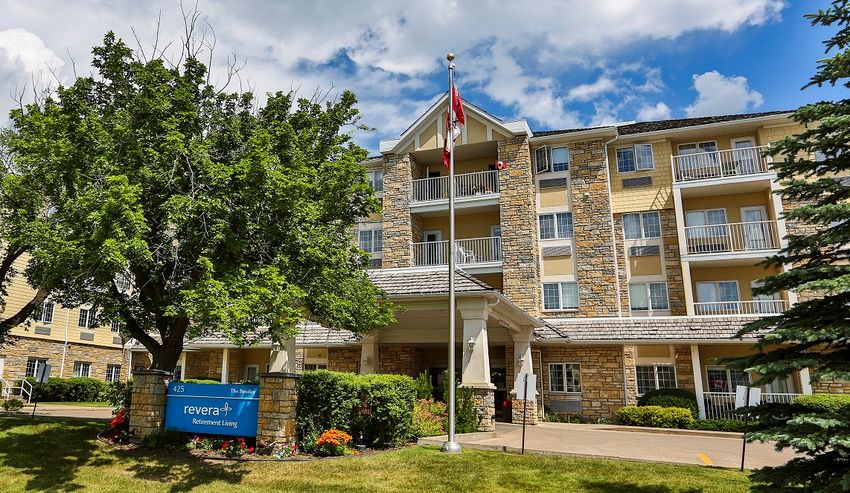
CONFERENCE CALL
HIGHLIGHTS

OPERATIONS – FOR THE QUARTER
     FFO with one time adjustment and Transactional FFO increased by $6.1 million or 6.8% to
     $95.0 million, and by $0.02 or 3.5% to $0.59 on a per Unit basis for the quarter compared to Q2
     2017
     ACFO with one time adjustment increased by $3.2 million or 3.7% to $88.4 million compared to
     the same quarter in 2017
     Payout ratio to ACFO with one time adjustment increased by 1.5% to 79.9% compared to the
     same quarter of 2017
     Occupancy level at 98.0% at the end of the quarter (98.4% in Q2 2017) and 98.2% including
     executed leases (98.5% in Q2 2017)
     Renewed 1,742,683 square feet, representing 73.8% of lease maturities for 2018, with average
     face rents increase of 3.5%
     Average cap rate of investment properties at 5.82% (5.82% in Q2 2017)

TENANT ACTIVITY
     No Sears exposure in any format
     Approximately 1,000 square feet of retail and office tenancies were completed and transferred
     this quarter via earnouts and development, providing an unleveraged yield of 15.08%
     SmartCentres' occupancy at 98.0% (98.2% including executed deals), remains strong
     Dollar store growth principally through Dollarama continues to absorb surplus space. Total
     number of stores is now 79 (Dollarama – 52, and Dollar Tree – 27)
     Purchase of Toys "R" Us (Canada) by Fairfax Financial Holdings Limited stabilizes this tenant
     and may provide upside potential if business grows
     Continued good interest from tenants for various size properties based on quality of locations
     Overall, SmartCentres continues to monitor closely those tenants in certain markets where
     some rationalizing is taking place

SMARTCENTRES REAL ESTATE INVESTMENT TRUST
JUNE 2018 SUPPLEMENTAL INFORMATION PACKAGE                                                            3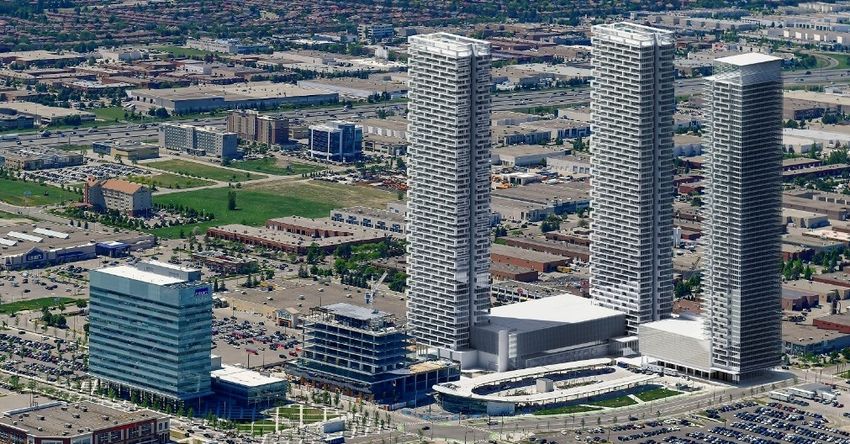
CONFERENCE CALL
HIGHLIGHTS

GROWTH
     Same properties’ NOI increased by $1.3 million or 1.1% for the quarter compared to 2017
     Premium Outlets
       -   Toronto
                     o the 145,000 square foot expansion scheduled to open in November 2018 is
                       on track and on budget. Expected to open virtually full
                     o tenant sales continuing to perform well, with average sales of $1,153 psf on a
                       rolling 12 month basis
                     o Q2 2018 sales ahead of Q2 2017 by 1.2%
                     o virtually all temporary tenants replaced with long term leases and quality
                       tenants, and site is 100% occupied
                     o the new parking facility, providing 1,800 parking spots as part of the 145,000
                       square foot expansion of the shopping centre, opened at the end of
                       November 2017
       -   Montreal
                     o tenancy of long and short term tenants currently at 100%
                     o Salvatore Ferragamo and Gucci continue as key traffic drivers with respect to
                       luxury brands, and driving strong sales
                     o tenant sales averaging $691 psf on a rolling 12 month basis
                     o Q2 2018 sales up by 10.6% over Q2 2017
                     o 75-acre site adjacent to the centre under consideration for various uses
                       including residential and hotel
       -   SmartCentres actively working with Simon to develop two potential additional sites

SMARTCENTRES REAL ESTATE INVESTMENT TRUST
JUNE 2018 SUPPLEMENTAL INFORMATION PACKAGE                                                          4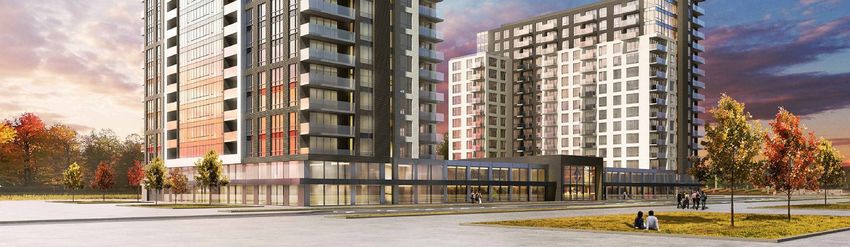
CONFERENCE CALL
HIGHLIGHTS

GROWTH (CONT’D)
     Vaughan Metropolitan Centre
       -   second mixed-use tower topping off ceremony took place in April 2018 with PwC as lead
           tenant as well as YMCA, a library and other community space, tenant fit-out to begin in Q1
           2019
       -   subway opened in December 2017
       -   project progressing very well and the KPMG Tower is now complete
       -   the KPMG Tower won the 16th Annual Real Estate Excellence (REX) Award for Office
           Development of the Year for the GTA
       -   minimal office space left now in the KPMG Tower based on executed leases. FM Global, a
           global insurance company, now operating on the 2nd floor of the tower and all of the
           additional podium space
       -   project coming in well below budget for construction costs
       -   extremely successful launch for first residential developments in a joint venture with
           Mitchell Goldhar and CentreCourt Developments Inc. with three condominium towers,
           which will be 55 storeys each and have a total of 1,716 units. All three towers sold out at
           significantly increased pricing versus original proformas. Construction of all three towers
           has started
       -   north condominium tower will include new BUCA-branded restaurant and BAR BUCA at
           the lobby level
       -   design work commenced on next phase, with two additional condominium towers, third
           office tower and first residential rental tower under consideration
       -   SmartCentres Place Bus Terminal (York Regional Transit) finalizing construction and
           expected to be ready later in 2018
       -   significant internal road infrastructure now completed, improving internal access
       -   surface parking for 900 cars now available for subway commuters in two lots on the site
           and these are generally fully occupied Monday to Friday
       -   TD Canada Trust retail branch now open in the KPMG Tower

SMARTCENTRES REAL ESTATE INVESTMENT TRUST
JUNE 2018 SUPPLEMENTAL INFORMATION PACKAGE                                                           5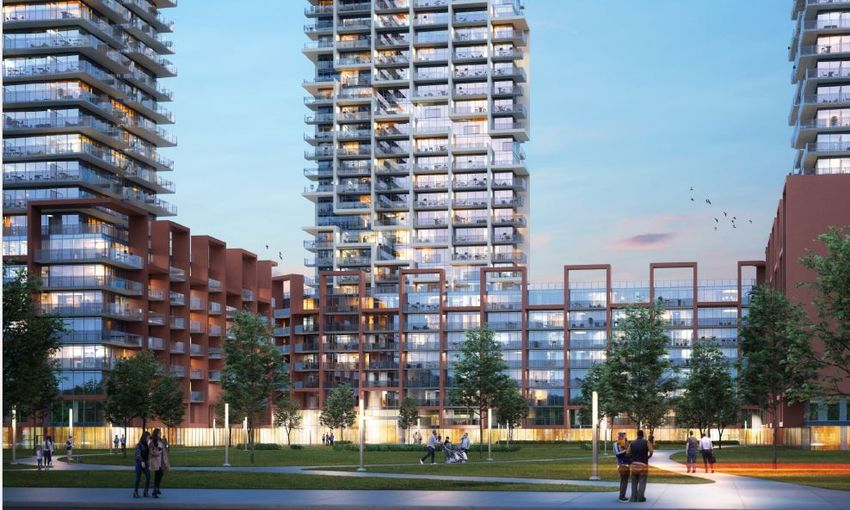
CONFERENCE CALL
HIGHLIGHTS

GROWTH (CONT’D)
     Future Opportunities
       -   sale of land to the JV with SmartStop in Q2 2018 at Leaside SmartCentre for a new 1,000-
           unit self storage facility
       -   residential single family home project at Vaughan NW moving forward in a JV with
           Fieldgate, a well known home developer, with up to 230 freehold townhomes now
           expected on an approximately 16-acre site, and initial occupancy planned for early 2020.
           Expected return of 20% to 25% on costs of approximately $152 million of which our share
           is 50%
       -   earnouts and developments – committed pipeline of approximately 343,000 square feet in
           place at a yield of 7.0%
       -   the initial phase of development of office and retail space for the StudioCentre at
           Lakeshore Boulevard East has now begun. The film studios are fully booked close to the
           end of 2018 and new sound stage is now open
       -   Westside Mall – mixed-use opportunity for 2 million to 2.5 million square feet resulting from
           Eglinton LRT line station and proposed GO interchange integrated with existing retail
           property moving forward with strong council support
       -   Vaughan (400 & 7) SmartCentre – 20-acre site along Hwy 7 is now slated for
           approximately 2.5 million square feet of redevelopment, including residential, office, retail
           and entertainment. The site under the Vaughan Official Plan is permitted one of the
           highest densities in Vaughan, second only to the Vaughan Metropolitan Centre
       -   Laval Centre
                    o proposed mixed-use development, including office, residential, seniors
                      housing and further retail, now underway
                    o JV with Jadco progressing well and construction starting in September for first
                      rental tower
       -   Pointe-Claire SmartCentre acquired in 2016 now identified for significant intensification,
           with zoning now approved for up to 1.5 million square feet of residential, in various forms,
           and retirement homes.
       -   South Oakville Centre now in active planning and discussion for redevelopment, including
           residential and senior home uses on part of the site

SMARTCENTRES REAL ESTATE INVESTMENT TRUST
JUNE 2018 SUPPLEMENTAL INFORMATION PACKAGE                                                             6
CONFERENCE CALL
HIGHLIGHTS

GROWTH (CONT’D)
     Intensification / Redevelopment
       -   JV with SmartStop Asset Management progressing for self storage sites. Five sites in the
           GTA now moving forward with more sites to follow. First site closed in Q2 2018 (Leaside
           SmartCentre)
       -   agreements with Revera for a multi-site retirement homes development program moving
           forward. Additional sites with other organizations also under negotiation
       -   discussions with a number of potential partners to consider residential (including
           condominium, rental and single family homes), and other potential uses on existing retail
           sites underway
       -   first six Tesla charging stations now open, with a further 15 sites being planned, as part of
           a comprehensive strategy to incorporate value-added services to many of the properties in
           the retail portfolio
       -   in excess of 56 sites now under consideration for development / intensification (up from
           initial 30), with initial planning for others underway
     Acquisitions
       -   the acquisition of a property in June 2018 located in Valleyfield, Quebec, totalling 54,000
           square feet of leasable area for a total purchase price of $15.7 million
       -   the acquisition of 12 properties as part of the OneREIT transaction in October 2017
           continues to deliver the expected benefits

SMARTCENTRES REAL ESTATE INVESTMENT TRUST
JUNE 2018 SUPPLEMENTAL INFORMATION PACKAGE                                                             7
CONFERENCE CALL
HIGHLIGHTS

CAPITAL ACTIVITIES
     Leverage at 44.7% of FMV, increased from 43.9% in 2017 as a result of the OneREIT
     transaction
     Total debt weighted average interest rate of 3.75% (3.78% in 2017)
     Interest coverage at 3.1X (3.1X in 2017)
     Unencumbered asset pool in excess of $3.9 billion, providing significant future flexibility. Pool
     contains high quality assets
     Rebalancing between unsecured and secured debt continues and expected to be at
     approximately 50:50 by year-end based on current financing strategy
     Announced annual distribution increase for October 2018 to $1.80 from $1.75, representing a
     2.9% increase
     Completed construction financing for:
       - Transit City condos (first three residential towers) - joint venture with Mitchell Goldhar and
           CentreCourt
       - Transit City parkade (commercial portion) - joint venture with Mitchell Goldhar
       - PwC-YMCA tower (second office tower) - joint venture with Mitchell Goldhar
       - Orleans II (Phase I retail) - joint venture with Mitchell Goldhar
     Actively pursuing financing for:
       - Laval Centre (two residential rental towers) - joint venture with Jadco
       - Self storage facilities (multiple locations) - joint venture with SmartStop
       - Permanent long-term mortgage financing for the KPMG Tower

SMARTCENTRES REAL ESTATE INVESTMENT TRUST
JUNE 2018 SUPPLEMENTAL INFORMATION PACKAGE                                                            8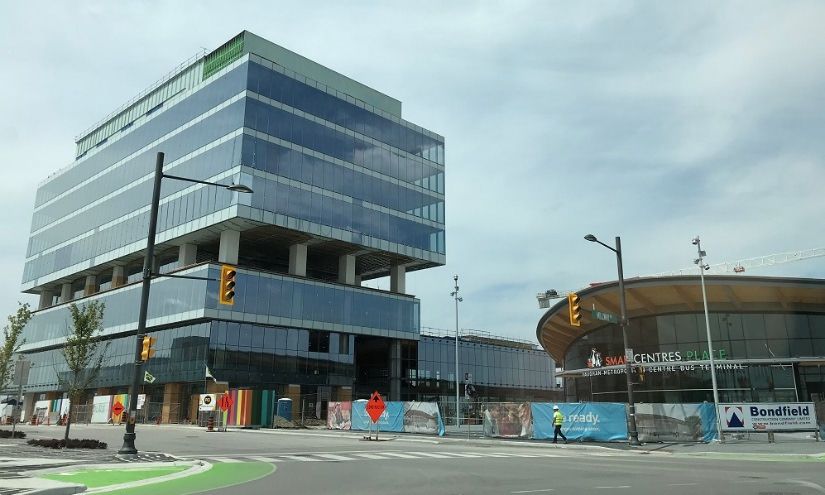
CONFERENCE CALL
HIGHLIGHTS

2018 OUTLOOK
     2018 operating FFO expected to grow by approximately 7 cents, based on:
      - same property growth
      - full year of NOI from 2017 acquisitions and partial year from any potential 2018
         acquisitions
      - full year of refinancing benefits from 2017 and further 2018 benefits
      - developments and earnouts including completion of the Toronto Premium Outlets
         expansion
      - ongoing settlement of long-standing tenant issues
      - 2018 transactional activities expected to add a further 3 cents of FFO
      - expenditures on acquisitions in the $100 million - $125 million range

LONG TERM OUTLOOK
     FFO growth rate expected to increase in 2019 to 4% - 5%, reflecting the benefit of a full year of
     the Toronto Premium Outlets expansion, additional leasing at VMC, and other initiatives as well
     as further transactional FFO
     For 2020, FFO growth rate expected to accelerate to in excess of 10% as initial benefits of
     significant development in townhomes and condominiums are realized

SMARTCENTRES REAL ESTATE INVESTMENT TRUST
JUNE 2018 SUPPLEMENTAL INFORMATION PACKAGE                                                           9
VAUGHAN METROPOLITAN CENTRE
LOOKING BEYOND
Vaughan Metropolitan Centre
- aerial overlaid with a
rendering of the first three
Transit City condominiums
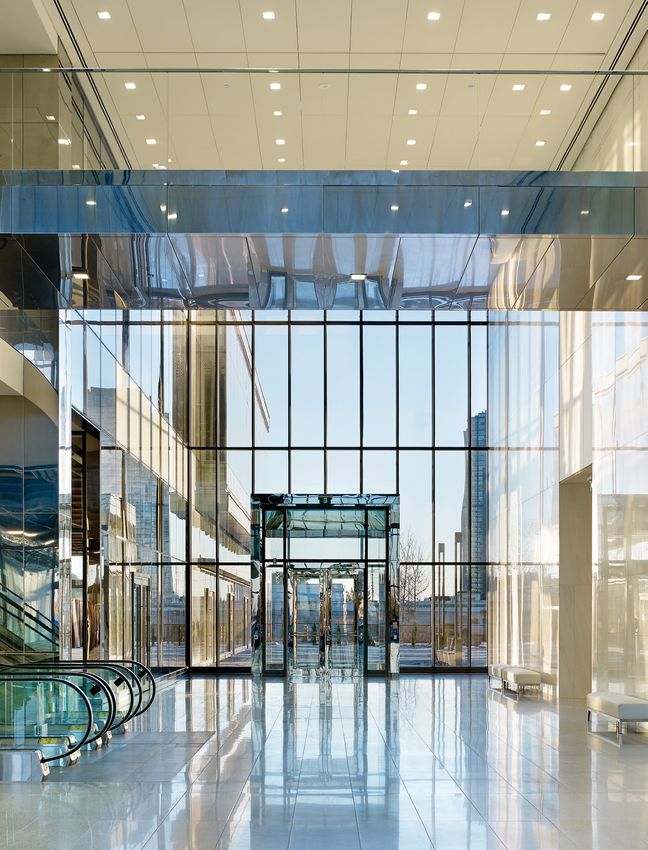
VMC - Artist’s rendering of VMC - construction of the PwC-
the PwC-YMCA Tower to YMCA Tower
open Fall 2019
Artist's rendering of Transit City from the east block of VMC
SMARTCENTRES REAL ESTATE INVESTMENT TRUST
JUNE 2018 SUPPLEMENTAL INFORMATION PACKAGE 10LOOKING BEYOND
Toronto Premium Outlets - Expansion Opening in November 2018
Potential Single Family
Development in Vaughan NW
Pointe-Claire – Concept Plan
SMARTCENTRES REAL ESTATE INVESTMENT TRUST
JUNE 2018 SUPPLEMENTAL INFORMATION PACKAGE 11LOOKING BEYOND
Laval Centre – Concept Plan
Laval Centre - Artist's rendering of the Apartment Buildings
SMARTCENTRES REAL ESTATE INVESTMENT TRUST
JUNE 2018 SUPPLEMENTAL INFORMATION PACKAGE 12LOOKING BEYOND
Retirement Homes with Revera
Self Storage with SmartStop
SMARTCENTRES REAL ESTATE INVESTMENT TRUST
JUNE 2018 SUPPLEMENTAL INFORMATION PACKAGE 13PORTFOLIO HIGHLIGHTS
As at As at
June 30, 2018 June 30, 2017
in $000s, except for Unit and other non-financial data)
Number of retail and other properties 154 143
Number of properties under development 7 7
Number of office properties 1 1
Number of mixed-use properties 2 1
Total number of properties owned 164 152
Number of Walmarts / Supercentres 101 / 96 95 / 90
Number of Walmarts / Supercentres (including shadows) 115 / 109 109 / 103
Gross leasable area (sq. ft.) 34,207,341 31,940,116
Total GLA in Walmart anchored centres (sq. ft.) 28,540,589 27,362,648
Future estimated development area (sq. ft.) 4,045,563 4,089,000
Occupancy 98.0% 98.4%
Occupancy including executed leases 98.2% 98.5%
Average lease term to maturity 5.7 years 6.0 years
Net rental rate (per occupied sq. ft.) $15.29 $15.24
Net rental rate excluding anchors (per occupied sq. ft.) (1) $21.62 $21.80
Investment properties (2) 9,046,739 8,453,702
Total assets 9,513,881 8,843,016
Debt (2) 4,296,836 3,909,966
Total debt – Weighted average interest rate (3) 3.75% 3.78%
Secured debt – Weighted average contractual interest rate (4) 3.82% 3.77%
Secured debt – Weighted average maturity 4.4 years 4.8 years
Debt to aggregate assets 44.7% 43.9%
Debt to gross book value (5) 51.4% 51.5%
Secured debt to aggregate assets 23.6% 27.6%
Unencumbered assets to unsecured debt 1.9X 2.0X
Interest coverage (6) 3.1X 3.1X
Debt to adjusted EBITDA (7) 8.5X 8.4X
Equity (book value) 4,921,463 4,739,552
Units outstanding (8) 160,704,177 156,455,314
Three months ended Three months ended
June 30, 2018 June 30, 2017
FFO with one-time adjustment and before transactional FFO (2)(9)(10) $0.57 $0.55
FFO with one-time adjustment and transactional FFO (2)(9)(10) $0.59 $0.57
Payout ratio to ACFO (2)(9)(10) 79.9% 78.6%
Payout ratio to ACFO with one-time adjustment (2)(9)(10)(11) 79.9% 78.4%
Surplus of ACFO with one-time adjustment over distributions declared 17,721 18,372
(1) Anchors are defined as tenants within a property with leasable area greater than 30,000 square feet.
(2) Includes the Trust’s share of equity accounted investments.
(3) Includes convertible debentures and acquisition date fair value adjustments.
(4) Excludes acquisition date fair value adjustments.
(5) Calculated as debt divided by Aggregate Assets plus accumulated amortization less cumulative unrealized fair value gain or loss with respect to investment
property. The ratio is used by the Trust to manage an acceptable level of leverage and is not considered a measure in accordance with IFRS.
(6) Defined as Adjusted EBITDA over interest expense, where interest expense excludes the distributions on deferred units and LP Class D Units classified as
liabilities and adjustments relating to the early redemption of unsecured debentures. The ratio is used by the Trust to manage an acceptable level of interest
expense relative to available earnings and is not considered a measure in accordance with IFRS.
(7) Defined as debt divided by Adjusted EBITDA. The ratio of total debt to Adjusted EBITDA is included and calculated each period to provide information on the
level of the Trust’s debt versus the Trust’s ability to service that debt. Adjusted EBITDA is used as part of this calculation because the fair value changes and
gains and losses on investment property dispositions do not have an impact on cash flow, which is a critical part of this measure (see “Financial Covenants”
section).
(8) Total Units outstanding include Trust Units and LP Units, including Units classified as liabilities. LP Units classified as equity in the consolidated financial
statements are presented as non-controlling interests.
(9) Represents a non-GAAP measure. The Trust’s method of calculating non-GAAP measures may differ from other reporting issuers’ methods and accordingly
may not be comparable. For definitions and basis of presentation of the Trust’s non-GAAP measures, refer to the “Presentation of Non-GAAP Measures”
section in the MD&A.
(10) See “Other Measures of Performance” in the MD&A for the three and six months ended June 30, 2018 for a reconciliation of these measures to the nearest
consolidated financial statement measure.
(11) The calculation of the Trust’s ACFO and related ACFO payout ratio, including comparative amounts, is a new financial metric pursuant to the February 2018
REALpac White Paper on ACFO. Comparison with other reporting issuers may not be appropriate. Payout ratio is calculated as declared distributions divided
by ACFO.
SMARTCENTRES REAL ESTATE INVESTMENT TRUST
JUNE 2018 SUPPLEMENTAL INFORMATION PACKAGE 14DISTRIBUTION REINVESTMENT PLAN
Unitholders who elect to participate will have their monthly cash distributions automatically
reinvested in units of SmartCentres at a price equal to 97% of the average TSX market price
over the 10 business days preceding the monthly distribution date.
SmartCentres' DRIP will be administered by Computershare Trust Company of Canada.
Interested unitholders can also obtain an information package and the necessary registration
forms from, or direct any inquiries/concerns regarding the DRIP to, Computershare Trust
Company of Canada via telephone at 1-800-564-6253 or via mail at:
SmartCentres Real Estate Investment Trust
c/o Computershare Trust Company of Canada
100 University Avenue, 9th Floor
Toronto, ON, M5J 2Y1
Canada
Attention: Dividend Reinvestment Department
DISTRIBUTION HISTORY
Per unit, paid monthly
2018 2017 2016 2015 2014
($) ($) ($) ($) ($)
January 0.14583 0.14167 0.13750 0.13340 0.12900
February 0.14583 0.14167 0.13750 0.13340 0.12900
March 0.14583 0.14167 0.13750 0.13340 0.12900
April 0.14583 0.14167 0.13750 0.13340 0.12900
May 0.14583 0.14167 0.13750 0.13340 0.12900
June 0.14583 0.14167 0.13750 0.13340 0.12900
July 0.14167 0.13750 0.13340 0.12900
August 0.14167 0.13750 0.13340 0.12900
September 0.14167 0.13750 0.13340 0.12900
October 0.14583 0.14167 0.13750 0.13340
November 0.14583 0.14167 0.13750 0.13340
December 0.14583 0.14167 0.13750 0.13340
Total 0.87498 1.71252 1.66251 1.61310 1.56120
SMARTCENTRES REAL ESTATE INVESTMENT TRUST
JUNE 2018 SUPPLEMENTAL INFORMATION PACKAGE 15PERFORMANCE OF SMARTCENTRES UNITS
AVERAGE UNIT TRADING PRICE
Per unit
2018 2017 2016 2015 2014
($) ($) ($) ($) ($)
1st Quarter 29.76 32.47 31.33 30.17 25.37
2nd Quarter 29.35 32.22 34.78 29.45 26.52
3rd Quarter 30.66 36.59 29.75 26.23
4th Quarter 29.81 31.96 31.33 27.14
YTD / Annual 29.57 31.39 33.42 30.29 26.31
Closing trading
price at end of 30.53 30.91 32.29 30.19 27.30
period
AVERAGE DAILY VOLUME OF UNITS TRADED
2018 2017 2016 2015 2014
($) ($) ($) ($) ($)
1st Quarter 237,282 221,865 288,045 200,374 199,418
2nd Quarter 193,917 274,092 198,964 242,372 185,756
3rd Quarter 181,862 226,367 218,051 156,254
4th Quarter 215,099 278,983 334,127 184,375
Annual 215,256 223,428 247,612 248,924 181,379
MARKET CAPITALIZATION SUMMARY
Date Total Units Outstanding (1) Share price per Unit Market Capitalization
($) ($)
June 30, 2018 160,704,177 30.53 4,906,298,524
December 31, 2017 159,720,126 30.91 4,936,949,095
December 31, 2016 155,686,295 32.29 5,027,110,466
December 31, 2015 154,088,207 30.19 4,651,922,969
December 31, 2014 136,315,194 27.30 3,721,404,796
(1) Total Units outstanding include Trust Units and LP Units, including LP Units classified as liabilities. LP Units classified as equity in the
consolidated financial statements are presented as non-controlling interests.
SMARTCENTRES REAL ESTATE INVESTMENT TRUST
JUNE 2018 SUPPLEMENTAL INFORMATION PACKAGE 16GROSS REVENUE AND AREA BY PROVINCE
GROSS REVENUE BY PROVINCE
1 - Ontario - 61.9%
2 - Quebec - 14.3%
3 - British Columbia - 8.4%
4 - Saskatchewan - 3.9%
5 - Manitoba - 3.4%
6 - Alberta - 3.3%
7 - Newfoundland and Labrador - 2.8%
8 - Nova Scotia - 0.9%
9 - New Brunswick - 0.7%
10 - Prince Edward Island - 0.4%
GROSS AREA BY PROVINCE
1 - Ontario - 58.3%
2 - Quebec - 15.3%
3 - British Columbia - 9.1%
4 - Alberta - 4.3%
5 - Saskatchewan - 4.3%
6 - Manitoba - 3.3%
7 - Newfoundland and Labrador - 3.0%
8 - Nova Scotia - 0.9%
9 - New Brunswick - 0.8%
10 - Prince Edward Island - 0.7%
SMARTCENTRES REAL ESTATE INVESTMENT TRUST
JUNE 2018 SUPPLEMENTAL INFORMATION PACKAGE 17TOP 25 TENANTS
Average
Number of Gross Rental Remaining
Rank Tenant Stores Revenues Lease Term
(%) (years)
1 Walmart 101 25.8 6.7
2 Canadian Tire, Mark's and FGL Sports 71 4.5 5.2
3 Winners, HomeSense, Marshalls 53 4.1 4.9
4 Loblaws and Shoppers Drug Mart 24 2.8 7.4
5 Lowe's, RONA 9 2.4 5.9
6 Sobeys 18 2.3 4.8
7 Reitmans 94 2.1 2.7
8 Best Buy 22 1.8 2.4
9 Dollarama 52 1.7 4.1
10 Michaels 25 1.5 3.8
11 LCBO 34 1.5 7.2
12 Recipe Unlimited (formerly Cara Restaurants) 51 1.3 5.9
13 Staples 21 1.3 3.4
14 Bonnie Togs 46 1.1 4.6
15 Bulk Barn 52 1.0 5.9
16 Gap Inc. 23 1.0 2.8
17 The Brick 9 1.0 3.2
18 Toys R Us 7 0.9 6.9
19 CIBC 27 0.9 2.8
20 Dollar Tree and Dollar Giant 27 0.8 4.5
21 Metro 8 0.8 3.9
22 Sail 4 0.8 8.3
23 GoodLife Fitness Clubs 11 0.8 8.1
24 Sleep Country 35 0.8 4.1
25 Pacific West 37 0.8 4.9
Total 861 63.8 5.9
SMARTCENTRES REAL ESTATE INVESTMENT TRUST
JUNE 2018 SUPPLEMENTAL INFORMATION PACKAGE 18LEASE EXPIRATION SCHEDULE
Number Annualized Average
Year of Expiry of Stores Area Area Base Rent Rent
(sq. ft.) (%) ($) ($ psf)
Month-to-month and holdovers 106 370,857 1.1 6,844,935 18.46
2018 (remainder of year) 157 639,725 1.9 13,172,252 20.59
2019 442 3,052,962 8.9 45,537,799 14.92
2020 425 3,764,953 11.0 54,991,330 14.61
2021 415 3,804,009 11.1 54,706,721 14.38
2022 409 4,364,713 12.8 62,673,173 14.36
2023 471 4,148,452 12.1 69,261,990 16.70
2024 245 2,475,020 7.2 41,691,176 16.84
2025 141 1,582,924 4.6 21,719,175 13.72
2026 156 1,486,152 4.3 26,093,662 17.56
2027 139 2,254,683 6.6 33,291,361 14.77
2028 103 1,245,840 3.6 21,255,285 17.06
2029 28 1,601,544 4.7 19,828,366 12.38
2030 14 639,254 1.9 10,421,256 16.30
2031 15 480,449 1.4 8,190,515 17.05
2032 8 844,086 2.5 12,401,109 14.69
2033 6 228,456 0.7 3,084,764 13.50
Beyond 6 554,760 1.6 7,566,525 13.64
Vacant 204 668,502 2.0 — —
Total 3,490 34,207,341 100.0 512,731,394 15.29
Weighted Average Lease Expiry by area = 5.6 years
SMARTCENTRES REAL ESTATE INVESTMENT TRUST
JUNE 2018 SUPPLEMENTAL INFORMATION PACKAGE 19AREA BY AGE
Age Area Area
(sq. ft.) (%)
2002 - present 25,235,426 73.8
1995 - 2001 7,466,346 21.8
Before 1995 1,505,569 4.4
Total 34,207,341 100
Portfolio of high quality, newly developed assets with an
average age of 14.3 years and minimal capital expenditure
requirements.
SMARTCENTRES REAL ESTATE INVESTMENT TRUST
JUNE 2018 SUPPLEMENTAL INFORMATION PACKAGE 20FUTURE EARNOUTS AND DEVELOPMENTS
Total Gross Invested Net Yield /
Year Area Area Income Commitment To-date Commitment Cap Rate
(sq. ft.) (%) ($000s) ($000s) ($000s) ($000s) (%)
EARNOUTS
Committed Earnouts
2018 18,950 0.5% 294 4,170 365 3,805 7.1%
2019 and beyond 26,913 0.6% 723 10,066 2,314 7,752 7.2%
Subtotal Committed Earnouts 45,863 1.1% 1,017 14,236 2,679 11,557 7.1%
Uncommitted Earnouts
2018 - 0.0% - - - - 0.0%
2019 and beyond 470,270 11.6% 9,307 139,621 5,296 134,325 6.7%
Subtotal Uncommitted Earnouts 470,270 11.6% 9,307 139,621 5,296 134,325 6.7%
Total Earnouts 516,133 12.7% 10,324 153,857 7,975(1) 145,882 6.7%
DEVELOPMENTS
Committed Developments
2018 184,880 4.6% 7,542 98,952(2) 55,454(2) 43,498 7.6%(3)
2019 and beyond 112,399 2.7% 2,485 45,352(2) 28,657(2) 16,695 5.5%(3)
Subtotal Committed Developments 297,279 7.3% 10,027 144,304 84,111 60,193 6.9%
Uncommitted Developments
2018 65,936 1.6% 1,895 29,518(2) 22,741(2) 6,777 6.4%(3)
2019 and beyond 3,166,215 78.3% 61,571 1,069,494(2) 453,216(2) 616,278 5.8%(3)
Subtotal Uncommitted Developments 3,232,151 79.9% 63,466 1,099,012 475,957 623,055 5.8%
Total Developments (4) 3,529,430 87.2% 73,493 1,243,316 560,068(1) 683,248 5.9%
Total Earnouts and Developments 4,045,563 100.0% 83,817 1,397,173 568,043 829,130 6.0%
Non-cash Development Cost (5) 14,229
Land / Parcel Sales 9,282
Vaughan Metropolitan Centre (“VMC”) (6) 57,717(1)
Total before Mezzanine Financing 4,045,563 100.0% 83,817 1,397,173 649,271(1) 829,130 6.0%
(7)
Options through Mezzanine Financing 614,711
Total Potential Pipeline 4,660,274
(1) Under “Properties Under Development” in the MD&A for the three and six months ended June 30, 2018, Earnouts of $49,802, Developments of $498,478 and Investments in
associates relating to VMC of $100,991 comprise the total amount of $649,271. The amounts in the chart above have been adjusted for i) Earnouts that are expected to be
completed after the expiry of the Earnout options being reclassified as Developments and ii) the first phases of VMC relating to the office complexes referred to in Note 4 have been
included as Developments.
(2) Includes fair value adjustment for land.
(3) On a cost basis, the yield would be 7.4%, 5.5%, 5.8%, and 5.2%, respectively.
(4) Includes the Trust’s 50% ownership of the office complex in VMC with KPMG as lead tenant and a second office complex with PwC as lead tenant, scheduled to be completed by
2019.
(5) Represents net liability currently recorded.
(6) Future development lands relating to the Trust’s 50% ownership of the VMC, but excluding the office complexes in Note 4.
SMARTCENTRES REAL ESTATE INVESTMENT TRUST
JUNE 2018 SUPPLEMENTAL INFORMATION PACKAGE 21MAJOR MIXED-USE REAL ESTATE INITIATIVES
Estimated Costs ($M) Estimated Gain on Final Sale
GLA SRU 100% SRU NOI at NOI at Completion SRU
Site Project Type ('000sf) / % Share Share Share 100% SRU Share Year Yield Profit % Share Timing
Units ($M) ($M)
(1)
1. VMC (Office Towers) a. KPMG (T#1) Office 360sf 50% $180.0 $90.0 $10.2 $5.1 2016 5.7% — — —
b. PWC (T#2) Office 105sf 50% $65.0 $32.5 $3.0 $1.5 2019 4.5%-5.5% — — —
c. Office (T#3) Office 600sf 50% $310.0 $155.0 $17.4 $8.7 2023 5.0%-6.0% — — —
d. Office (T#4) Office 300sf 50% $175.0 $87.5 $9.6 $4.8 2025 5.0%-6.0% — — —
2. Toronto Premium Phase II (JV) Retail 144sf 50% $133.0 $66.5 $10.9 $5.4 Nov 2018 8.0%-8.5% — — —
(2)
Outlets
3. Montreal Premium Phase II (JV) Retail 140sf 50% $56.0 $28.0 $5.6 $2.7 2022-2023 9%-10% — — —
(2)
Outlets
4. New Premium Outlets Premium (JV) Retail 360sf 50% $136.0 $68.0 $11.7 $5.9 2020 8.0%-8.5% — — —
(4)
5. Laval Centre Jadco (2 Bldgs) Apartments 338 Units 50% $76.5 $38.3 $4.3 $2.2 2019-2020 5.6% — — —
(4)
6. VMC (Condos) CentreCourt Condo #1 551 Units 25% $181 $45.25 N/A N/A 2020 N/A 25%-30% 25% 2020
CentreCourt Condo #2 559 Units 25% $189 $47.25 N/A N/A 2020 N/A 25%-30% 25% 2020
CentreCourt Condo #3 606 Units 25% $190 $47.5 N/A N/A 2021 N/A 20%-25% 25% 2021
Condo Condo #4 & 5 1,100 Units 25% $380 $95.0 N/A N/A 2023 N/A 20%-25% 25% 2023
7. Vaughan NW Fieldgate Townhomes 229 Units 50% $152.0 $76.0 N/A N/A 2020-2021 N/A 20%-25% 50% 2020-2021
(4)
8. Ottawa Laurentian JV Partner (2 Apartments 300 Units 25% $86.0 $21.5 $4.9 $1.23 2020-2021 5.5%-6.5% — — —
Bldgs)
(4)
9. Multiple Locations Self Storage (JV) Self Storage 500sf built 50% $52M per $26M per $4.8M net $2.4M net 2019-2023 7.0%-8.5% — — —
(4 to 5 new per year in year in year in new NOI new NOI
facilities each each of each of each of commences commences
year) years 1-5 years 1-5 years 1-5 annually on annually on
(3) (3)
stabilization stabilization
10. StudioCentre SRU-Penguin JV Mixed-Use 150sf 50% $53.0 $26.5 $3.4 $1.71 2019-2022 6.0%-7.0% — — —
(Toronto) (Office, Studio,
Hotel)
SMARTCENTRES REAL ESTATE INVESTMENT TRUST
JUNE 2018 SUPPLEMENTAL INFORMATION PACKAGE 22MAJOR MIXED-USE REAL ESTATE INITIATIVES
Estimated Costs ($M) Estimated Gain on Final Sale
GLA SRU 100% SRU NOI at NOI at Completion SRU
Site Project Type ('000sf) / % Share Share Share 100% SRU Share Year Yield Profit % Share Timing
Units ($M) ($M)
(4)
11. VMC (Apartments) VMC Rental Apartments 221 Units 25% $113.6 $28.4 $5.6 $1.4 2021-2022 4.9% — — —
Apartments
12. Pointe-Claire Rental Apartments Apartments 486 Units 50% $154.8 $77.4 $7.2 $3.6 2023-2024 4.7% — — —
(4)
(Apartments) (2 Bldgs)
13. Pointe-Claire Condo Condo 194 Units 50% $54.8 $27.4 N/A N/A 2021 N/A 10%-15% 50% 2021
(4)
(Condo)
(4)
14 Multiple Locations Retirement Retirement 600sf built 50% $70M per $35M per $4.2M-$5.6M $2.1M-$2.8M 2022-2024 6.0%-8.0% — — —
Homes (JV) Homes per year in year per year per net new NOI net new NOI
(3 to 5 new each of site in site in commences commences
facilities each years 1-5 each of each of annually on annually on
(3) (3)
year) years 1-5 years 1-5 stabilization stabilization
Notes:
(1) KPMG and PwC-YMCA towers are included in the future development pipeline as Developments.
(2) The Phase II expansions for both the Toronto Premium Outlets and the Montreal Premium Outlets are included in the future development pipeline as Developments.
(3) Stabilization is estimated to be 2 to 3 years after completion.
(4) Estimated Transactional FFO Gains on Sale related to parcel sales of land into Joint Ventures estimated at 1%-2% of annual FFO at SmartCentres' ownership share.
In addition to the projects set out in the table above (with the exception of the projects listed in Notes 1 and 2), SmartCentres' pipeline also includes approximately 4.0 million square feet of future
developments as set out in the table shown on the “Future Earnouts and Developments” section . Also in addition to the above, SmartCentres has a further mixed-use development pipeline estimated at 4
million square feet in projects that are underway or active. Further, SmartCentres will initiate activities in the short-term to work towards development of a further estimated 12.5 million to 15 million square
feet in mixed-use initiatives that will be completed in the longer-term.
SMARTCENTRES REAL ESTATE INVESTMENT TRUST
JUNE 2018 SUPPLEMENTAL INFORMATION PACKAGE 23RECOURSE LOANS TO DEVELOPERS
Total
Leasable Potential Area
Loan Interest Area upon Upon Exercising
Project Outstanding Committed Maturity Date Rate Option Completion Purchase Option
($000s) ($000s) (%) (%) (7) (sq. ft.) (sq. ft.) (7)
Salmon Arm, BC (1)(2) 15,051 20,907 August 2018 4.82% — 215,431 —
Innisfil, ON (1)(3) 19,745 27,077 December 2020 3.65% — 139,744 —
(4)
Aurora (South), ON 15,809 30,543 March 2022 4.48% 50% 192,000 —
Mirabel (Shopping Centre), QC
(5) — 18,262 December 2022 7.50% — 256,000 96,500
Mirabel (Option Lands), QC (6) — 5,721 December 2022 7.50% — 178,068 —
Pitt Meadows, BC (4) 27,146 68,664 November 2023 4.92% 50% 75,000 —
Vaughan (7 & 427), ON 17,182 53,127 December 2023 6.06% 50% 302,029 37,500
Caledon (Mayfield), ON (4) 9,206 14,033 April 2024 4.77% 50% 203,730 101,865
Toronto (StudioCentre), ON (1)(4) 26,557 43,759 June 2024 4.74% 25% 911,322 227,831
Total 130,696 282,093 4.77%(8) 2,473,324 614,711
(1) The Trust owns a 50% interest in these properties, with the other 50% interest owned by Penguin. These loans are secured against Penguin's interest in the property.
(2) Monthly variable rate based on a fixed rate of 6.35% on loans outstanding up to $7.2 million and banker's acceptance rate plus 1.75% on any additional loans above $7.2 million.
(3) The monthly variable rate is based on the banker's acceptance rate plus 2.00%. The interest rate on this mortgage will reset in 2018 to the four-year Government of Canada bond
rate plus 4.0%, subject to a lower limit of 6.75% and an upper limit of 7.75%.
(4) These loans were amended during the three months ended March 31, 2017. See the "Loan Amendments" section below for details.
(5) The Trust owns a 33.3% interest in this property. The loan is secured against a 33.3% interest owned by Penguin, as well as a guarantee by Penguin.
(6) The Trust owns a 25% interest in this property. The loan is secured against a 25% interest owned by Penguin, as well as a guarantee by Penguin.
(7) The Trust has an option to purchase an additional purchase option percentage from the borrower in these properties upon a certain level of development and leasing being
achieved. As at December 31, 2017, it is management's expectation that the Trust will exercise these purchase options.
(8) Represents the weighted average effective interest rate.
Note: Of the $151.4 million of remaining loan advances available, $74.5 million is set aside as interest accrual reserve.
SMARTCENTRES REAL ESTATE INVESTMENT TRUST
JUNE 2018 SUPPLEMENTAL INFORMATION PACKAGE 24INDIVIDUAL PROPERTY SUMMARY
Owned Rentable Owned Rentable Non-Owned
Property Location Occupancy Area Anchor Area (1) Anchor Area (1) Anchors and Major Tenants
(%) (sq. ft.) (sq. ft.) (sq. ft.)
RETAIL PROPERTIES
BRITISH COLUMBIA
Chilliwack Mall Chilliwack, BC 98.6 126,625 46,544 — Safeway, Winners, Sport Chek
Walmart Supercentre, Winners,
Courtenay SmartCentre Courtenay, BC 98.6 273,289 135,899 — Staples, Best Buy, Sport Chek,
Mark's, Reitmans
Walmart Supercentre, Real
Canadian Superstore*, Home
Cranbrook SmartCentre Cranbrook, BC 100.0 164,025 107,158 185,556
Hardware*, Sport Chek, Dollar
Tree
Walmart Supercentre*, RONA*,
Cowichan Commons East Duncan, BC 93.7 249,677 188,680 235,732 Canadian Tire, Home Depot, Best
Buy, Bulk Barn
Walmart Supercentre, Michaels,
Kamloops SmartCentre Kamloops, BC 96.7 232,800 143,619 — Lordco Auto Parts, Pier 1 Imports,
Sleep Country
Walmart Supercentre, Home
Langley SmartCentre Langley, BC 99.3 351,225 255,527 172,161 Depot*, Save-on-Foods*, London
Drugs, Home Outfitters, Best Buy
Walmart Supercentre, Thrifty
Maple Ridge SmartCentre Maple Ridge, BC 94.7 226,874 146,521 — Foods, Westminster Savings
Credit Union, Dollar Tree, Rexall
Walmart Supercentre, Home
New Westminster
New Westminster, BC 89.3 409,249 159,449 — Outfitters, Tommy Hilfiger, The
SmartCentre
Gap, Carter's OshKosh
Walmart Supercentre*, Sport
Peachtree Square Penticton, BC 95.0 54,915 — 175,000 Chek, Dollar Tree, Valley First
Credit Union, Bulk Barn
Real Canadian Superstore,
Penticton Power Centre Penticton, BC 98.6 202,322 110,795 — Staples, Winners, PetSmart,
Sleep Country, TD Canada Trust
Walmart Supercentre, Home
Prince George
Prince George, BC 96.5 313,390 165,350 204,247 Depot*, Canadian Tire*, Michaels,
SmartCentre
Old Navy, Mark's, Petland
Salmon Arm Walmart Supercentre, Winners,
Salmon Arm, BC 100.0 67,324 48,345 —
SmartCentre** Dollarama, Bulk Barn
Walmart Supercentre, Dollar Tree,
Surrey West SmartCentre Surrey, BC 99.4 188,264 133,943 — Ardene, Sleep Country, Reitmans,
Carter's OshKosh
Walmart Supercentre, RONA*,
Vernon SmartCentre Vernon, BC 100.0 246,552 144,782 50,300 Best Buy, Value Village, Mark's,
Petland, Sleep Country
Subtotal British Columbia 96.6 3,106,531 1,786,612 1,022,996
SMARTCENTRES REAL ESTATE INVESTMENT TRUST
JUNE 2018 SUPPLEMENTAL INFORMATION PACKAGE 25INDIVIDUAL PROPERTY SUMMARY
Owned Rentable Owned Rentable Non-Owned
Property Location Occupancy Area Anchor Area (1) Anchor Area (1) Anchors and Major Tenants
(%) (sq. ft.) (sq. ft.) (sq. ft.)
ALBERTA
Walmart Supercentre, London
Calgary Southeast
Calgary, AB 100.0 246,085 199,758 — Drugs, Mark's, Reitmans, Carter's
SmartCentre
OshKosh, Bulk Barn
Walmart Supercentre, Safeway,
Edmonton East
Edmonton, AB 100.0 180,100 94,835 — Winners, Fit4Less, Petland,
SmartCentre**
Dollarama
Walmart Supercentre, Your Dollar
Edmonton Northeast
Edmonton, AB 98.4 274,353 161,925 — Store With More, Michaels, Bulk
SmartCentre
Barn, Moores, Penningtons
Lethbridge II SmartCentre Lethbridge, AB 100.0 53,392 40,373 — Sobeys
Walmart Supercentre, Home
Lethbridge SmartCentre Lethbridge, AB 98.5 333,092 194,564 95,000 Depot*, Best Buy, Ashley
Furniture, Mark's, Gap Outlet
Walmart Supercentre, Save-on-
St. Albert SmartCentre St. Albert, AB 98.8 251,329 197,101 91,737 Foods*, RONA*, Dollarama,
Canadian Western Bank
Walmart Supercentre, Canadian
Sylvan Lake SmartCentre Sylvan Lake, AB 100.0 131,983 115,829 68,947
Tire*, Dollarama
Subtotal Alberta 99.2 1,470,334 1,004,385 255,684
SASKATCHEWAN
Loblaws, GoodLife Fitness,
Golden Mile Shopping
Regina, SK 93.9 259,242 93,938 — Rainbow Cinemas, Dollarama,
Centre
Bison Liquor, RBC
Walmart Supercentre,
Regina East SmartCentre
Regina, SK 100.0 364,681 249,523 — HomeSense, London Drugs, Best
(I)
Buy, Michaels, Pier 1 Imports
RONA, Real Canadian
Regina East SmartCentre
Regina, SK 98.6 198,134 107,608 130,000 Superstore*, Wholesale Sports,
(II)
PetSmart, Old Navy, Petland
Walmart Supercentre, IGA,
Regina North SmartCentre Regina, SK 98.3 276,251 206,339 — Mark's, Dollarama, TD Canada
Trust, Reitmans, Bulk Barn
Walmart Supercentre, Home
Saskatoon South
Saskatoon, SK 100.0 380,642 194,210 109,084 Depot*, HomeSense, The Brick,
SmartCentre
Ashley Furniture, Golf Town
Subtotal Saskatchewan 98.4 1,478,950 851,618 239,084
SMARTCENTRES REAL ESTATE INVESTMENT TRUST
JUNE 2018 SUPPLEMENTAL INFORMATION PACKAGE 26INDIVIDUAL PROPERTY SUMMARY
Owned Rentable Owned Rentable Non-Owned
Property Location Occupancy Area Anchor Area (1) Anchor Area (1) Anchors and Major Tenants
(%) (sq. ft.) (sq. ft.) (sq. ft.)
MANITOBA
RONA, Costco*, Indigo Books,
Kenaston Common
Winnipeg, MB 100.0 257,222 98,570 143,613 Golf Town, Petland, Nygard, CIBC,
SmartCentre
HSBC, RBC
Walmart Supercentre, Home
Winnipeg Southwest
Winnipeg, MB 95.9 528,192 281,606 95,000 Depot*, Safeway, Home Outfitters,
SmartCentre
HomeSense, Urban Planet
Walmart Supercentre, Canadian
Winnipeg West
Winnipeg, MB 98.0 354,679 171,146 75,240 Tire*, Sobeys, Winners, Value
SmartCentre
Village, Sport Chek, Staples
Subtotal Manitoba 97.5 1,140,093 551,322 313,853
ONTARIO
Walmart Supercentre, Dollarama,
Alliston SmartCentre Alliston, ON 100.0 170,770 151,709 —
Tim Hortons
Walmart Supercentre, Canadian
Ancaster SmartCentre Ancaster, ON 99.2 264,785 163,794 74,018 Tire*, Winners, GoodLife Fitness,
Bouclair, Dollar Tree
Walmart Supercentre, RONA, Best
Aurora North
Aurora, ON 99.0 509,325 313,637 — Buy, Golf Town, LCBO, Dollarama,
SmartCentre(2)
RBC, TD Canada Trust
Winners, Healthy Planet, Bank of
Aurora SmartCentre Aurora, ON 100.0 51,186 — —
Nova Scotia
Food Basics, Pharma Plus,
Barrie Essa Road
Barrie, ON 92.3 104,926 35,152 — Dollarama, Anytime Fitness, Pet
Shopping Centre(2)
Valu, Tim Hortons
Walmart Supercentre, Loblaws*,
Barrie North SmartCentre Barrie, ON 97.6 234,700 160,727 81,373 Old Navy, Carter's OshKosh,
Addition-Elle, Reitmans
Walmart Supercentre, Sobeys,
Barrie South
Barrie, ON 98.5 389,561 243,629 — Winners, La-Z-Boy, PetSmart,
SmartCentre(2)
Stitches, Dollar Tree
Walmart Supercentre, LCBO,
Bolton SmartCentre Bolton, ON 99.2 242,444 161,864 —
Mark's, The Beer Store, Reitmans
Walmart Supercentre, Home
Bracebridge SmartCentre Bracebridge, ON 100.0 142,501 115,779 90,000 Depot*, Dollar Tree, Boston Pizza,
Bulk Barn
SMARTCENTRES REAL ESTATE INVESTMENT TRUST
JUNE 2018 SUPPLEMENTAL INFORMATION PACKAGE 27INDIVIDUAL PROPERTY SUMMARY
Owned Rentable Owned Rentable Non-Owned
Property Location Occupancy Area Anchor Area (1) Anchor Area (1) Anchors and Major Tenants
(%) (sq. ft.) (sq. ft.) (sq. ft.)
Walmart Supercentre, GoodLife
Bradford SmartCentre Bradford, ON 100.0 241,701 168,571 — Fitness, Dollarama, Bulk Barn,
CIBC, RBC
LA Fitness, Value Village, LCBO,
Bramport SmartCentre Brampton, ON 98.7 163,450 45,877 37,082 Dollarama, Swiss Chalet, CIBC,
Bank of Montreal
Bramport SmartCentre (II) Brampton, ON 100.0 37,857 37,857 — No Frills
Walmart Supercentre, The Brick,
Brampton East
Brampton, ON 100.0 360,695 243,610 — Winners, Staples, Mark's, Dollar
SmartCentre
Tree, Carter's OshKosh
Brampton North Fortinos*, Shoppers Drug Mart,
Brampton, ON 77.1 58,794 — 62,496
SmartCentre RBC
Walmart Supercentre, GoodLife
Brampton Northeast
Brampton, ON 100.0 233,197 153,455 — Fitness, LCBO, Dollarama, CIBC,
SmartCentre
Bank of Nova Scotia, RBC
Giant Tiger, GoodLife Fitness,
Kingspoint Shopping
Brampton, ON 98.2 204,113 78,307 — Shoppers Drug Mart, The Beer
Centre
Store
Walmart Supercentre*, Real
Brockville SmartCentre Brockville, ON 100.0 144,084 — 322,054 Canadian Superstore*, Home
Depot*, Winners, Michaels, LCBO
Toys R Us, LA Fitness, Shoppers
Burlington (Appleby)
Burlington, ON 100.0 151,115 100,646 — Drug Mart, Golf Town, Bank of
SmartCentre
Montreal
Walmart Supercentre, Dollar Tree,
Burlington North
Burlington, ON 100.0 226,451 161,127 — Reitmans, Moores, Bank of Nova
SmartCentre
Scotia
Walmart Supercentre, RONA, LA
Cambridge SmartCentre
Cambridge, ON 93.9 744,334 323,394 — Fitness, Best Buy, Staples, Bed
(I)(2)
Bath & Beyond, Michaels
Canadian Tire*, Home Depot*,
Cambridge SmartCentre
Cambridge, ON 66.6 23,938 — 224,695 Henry's Photography, Allstate
(II)
Insurance
Carleton Place Walmart Supercentre, Dollarama,
Carleton Place, ON 97.9 148,885 115,811 —
SmartCentre Mark's, Bulk Barn
Walmart Supercentre, Real
Canadian Superstore*, Winners,
Chatham SmartCentre** Chatham, ON 99.3 154,545 101,053 91,275
Mark's, PetSmart, Dollarama,
LCBO
Walmart Supercentre, Home
Cobourg SmartCentre Cobourg, ON 99.0 197,928 142,634 85,433 Depot*, Winners, Dollar Tree,
Swiss Chalet
SMARTCENTRES REAL ESTATE INVESTMENT TRUST
JUNE 2018 SUPPLEMENTAL INFORMATION PACKAGE 28INDIVIDUAL PROPERTY SUMMARY
Owned Rentable Owned Rentable Non-Owned
Property Location Occupancy Area Anchor Area (1) Anchor Area (1) Anchors and Major Tenants
(%) (sq. ft.) (sq. ft.) (sq. ft.)
Walmart Supercentre, Dollar Tree,
Cornwall SmartCentre Cornwall, ON 100.0 171,176 154,510 —
Bank of Montreal
Home Depot*, Winners, Sobeys,
Leaside SmartCentre(2) East York, ON 98.0 257,919 108,632 113,000 Sport Chek, Best Buy, LCBO, Golf
Town, RBC
Sail, Marshalls, PetSmart, Party
Etobicoke (Index)
Etobicoke, ON 100.0 188,059 107,838 — Packagers, Structube, Bouclair,
SmartCentre
Penningtons
Walmart Supercentre, Home
Etobicoke SmartCentre(2) Etobicoke, ON 100.0 294,734 199,824 135,000 Depot*, Best Buy, Winners, Old
Navy, Mark's, Urban Barn
Walmart Supercentre*, Dollarama,
Rexdale SmartCentre Etobicoke, ON 100.0 35,174 — 126,083
Bank of Nova Scotia
Fergus SmartCentre Fergus, ON 100.0 109,652 95,035 — Walmart Supercentre, LCBO
Walmart Supercentre*, No Frills*,
Fort Erie SmartCentre Fort Erie, ON 100.0 12,738 — 140,142
LCBO, Bank of Nova Scotia
Walmart Supercentre, Home
Guelph SmartCentre Guelph, ON 99.5 296,116 171,396 110,000 Depot*, HomeSense, Michaels,
Dollarama, CIBC, RBC
Saks Fifth Avenue OFF 5TH, Polo
Toronto Premium Outlets** Halton Hills, ON 99.6 180,332 — — Ralph Lauren, Restoration
Hardware, Nike, Columbia, Coach
Walmart Supercentre, Shoppers
Hamilton South
Hamilton, ON 100.0 241,795 124,524 — Drug Mart, LCBO, Dollarama, The
SmartCentre
Beer Store, CIBC
Walmart Supercentre, Your
Huntsville SmartCentre Huntsville, ON 100.0 126,436 84,861 68,837 Independent Grocer*, Dollar Tree,
Mark's, Reitmans
Walmart Supercentre, Dollarama,
Kanata SmartCentre Kanata, ON 99.2 201,548 155,739 —
Bulk Barn, CIBC, RBC
Laurentian Power Centre Kitchener, ON 100.0 35,200 — 220,978 RONA*, Zehrs*, Staples, CIBC
Walmart Supercentre, Toys R Us,
London East Argyle Mall(2) London, ON 99.0 424,934 224,281 — No Frills, Winners, Staples, Sport
Chek, GoodLife Fitness
SMARTCENTRES REAL ESTATE INVESTMENT TRUST
JUNE 2018 SUPPLEMENTAL INFORMATION PACKAGE 29INDIVIDUAL PROPERTY SUMMARY
Owned Rentable Owned Rentable Non-Owned
Property Location Occupancy Area Anchor Area (1) Anchor Area (1) Anchors and Major Tenants
(%) (sq. ft.) (sq. ft.) (sq. ft.)
Walmart Supercentre, Canadian
London North
London, ON 99.3 250,118 131,671 108,262 Tire*, Marshalls, Winners, Sport
SmartCentre**
Chek, HomeSense, Old Navy
Lowe's*, Boston Pizza, Bank of
London Northwest
London, ON 100.0 36,214 — 137,316 Montreal, Montana's, Kelsey's,
SmartCentre
RBC
Markham East Walmart Supercentre, Dollar Tree,
Markham, ON 100.0 69,008 61,207 —
SmartCentre** CIBC
Home Depot, Longo's*, Winners,
Markham Woodside
Markham, ON 100.0 179,950 80,385 — Staples, Chapters, Michaels, La-Z-
SmartCentre**
Boy, LCBO
Walmart Supercentre*, Canadian
Milton Walmart Centre** Milton, ON 94.1 116,602 — 227,896 Tire*, Sport Chek, Indigo,
Michaels, Mark's, Staples, RBC
Burnhamthorpe
Mississauga, ON 87.1 199,970 — — Government, Swiss Chalet, Remax
SmartCentre
Walmart Supercentre, Costco,
Creekside Crossing** Mississauga, ON 100.0 120,017 91,385 — LCBO, Dollarama, The Beer Store,
CIBC, TD Canada Trust, RBC
Walmart Supercentre, No Frills,
Mississauga (Erin Mills)
Mississauga, ON 96.3 290,562 171,973 — GoodLife Fitness, Shoppers Drug
SmartCentre(2)
Mart, Dollarama
Real Canadian Superstore*, Toys
Mississauga (Go Lands)
Mississauga, ON 100.0 113,005 50,696 115,000 R Us, Marshalls, Dollarama, TD
SmartCentre
Canada Trust
Walmart Supercentre, RONA,
Mississauga (Meadowvale)
Mississauga, ON 93.5 557,845 319,275 — Winners, Staples, Michaels,
SmartCentre(2)
Mark's, PetSmart, LCBO
Walmart Supercentre, PetSmart,
Niagara Falls SmartCentre Niagara Falls, ON 100.0 249,745 183,698 — Penningtons, Dollarama, LCBO,
Sleep Country, Bulk Barn
Real Canadian Superstore*,
401 & Weston Power
North York, ON 100.0 108,662 58,071 180,000 Canadian Tire, The Brick, Best
Centre**
Buy, LCBO, Mark's, Dollar Tree
Walmart Supercentre, Real
Oakville SmartCentre(2) Oakville, ON 100.0 461,226 314,588 — Canadian Superstore, LCBO, The
Beer Store, The Keg, CIBC, RBC
Metro, Winners, Shoppers Drug
South Oakville Centre Oakville, ON 100.0 179,386 41,289 — Mart, LCBO, The Beer Store,
CIBC, TD Canada Trust
SMARTCENTRES REAL ESTATE INVESTMENT TRUST
JUNE 2018 SUPPLEMENTAL INFORMATION PACKAGE 30INDIVIDUAL PROPERTY SUMMARY
Owned Rentable Owned Rentable Non-Owned
Property Location Occupancy Area Anchor Area (1) Anchor Area (1) Anchors and Major Tenants
(%) (sq. ft.) (sq. ft.) (sq. ft.)
Walmart Supercentre, Winners,
Orillia SmartCentre Orillia, ON 100.0 241,659 165,902 —
Staples, Michaels, Dollarama
Walmart Supercentre, Canadian
Orleans SmartCentre (I) Orleans, ON 97.4 384,015 232,635 117,136 Tire*, Home Outfitters, Best Buy,
Shoppers Drug Mart
Orleans SmartCentre (II)** Orleans, ON 100.0 27,306 — — Indigo Books, Marshalls
Walmart Supercentre, Real
Oshawa North Canadian Superstore, Home
Oshawa, ON 100.0 558,159 341,156 116,348
SmartCentre(2) Depot*, Marshalls, Sport Chek,
Best Buy, Michaels
Home Outfitters, Winners,
Oshawa North
Oshawa, ON 100.0 163,259 34,109 — PetSmart, Party Packagers,
SmartCentre (II)
Boston Pizza, TD Canada Trust
Walmart Supercentre, Lowe's, Sail,
Oshawa South
Oshawa, ON 99.4 536,707 430,536 — CIBC, Dollarama, Moores,
SmartCentre(2)
Reitmans, RBC
Ottawa (Laurentian Place) Walmart Supercentre, Stantec,
Ottawa, ON 97.4 128,939 112,391 —
SmartCentre** CIBC
Walmart Supercentre, Loblaws,
Ottawa South
Ottawa, ON 93.9 261,569 156,471 — Cineplex Odeon, Marshalls,
SmartCentre**
Winners, Chapters
Walmart Supercentre, Home
Owen Sound SmartCentre Owen Sound, ON 100.0 163,101 105,963 130,000 Depot*, Penningtons, Dollarama,
Carter's OshKosh, Reitmans
Walmart Supercentre, Lowe's,
Pickering SmartCentre(2) Pickering, ON 97.7 546,194 403,289 82,000 Sobeys, Canadian Tire*, Toys R
Us, Winners, PetSmart, LCBO
Port Elgin SmartCentre Port Elgin, ON 100.0 115,524 115,524 — Walmart Supercentre
Walmart Supercentre, LCBO,
Port Perry SmartCentre Port Perry, ON 100.0 138,789 92,473 — Dollarama, Mark's, Bulk Barn,
Bank of Nova Scotia
Walmart Supercentre, Food
Richmond Hill
Richmond Hill, ON 99.3 136,306 94,458 — Basics, Shoppers Drug Mart,
SmartCentre**
HSBC, Bank of Montreal
Walmart Supercentre, Rona*,
Rockland SmartCentre Rockland, ON 99.0 147,592 115,890 24,253
Dollarama, LCBO, Boston Pizza
SMARTCENTRES REAL ESTATE INVESTMENT TRUST
JUNE 2018 SUPPLEMENTAL INFORMATION PACKAGE 31You can also read