FIRSTQUARTER Supplemental Information Package - SmartCentres
←
→
Page content transcription
If your browser does not render page correctly, please read the page content below

FIRSTQUARTER
Supplemental Information Package
FO R THE THREE MO NTHS EN D ED M ARCH 31, 2017
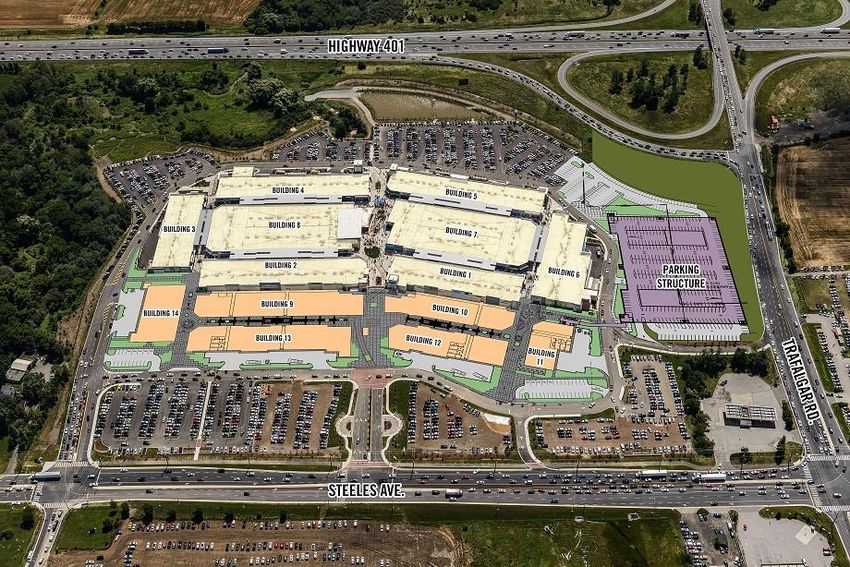
Table of Contents

Notice to Reader …………………………………………………………………………........……….             2
Conference Call Highlights ………….……..…………………………………………………………..          3
Looking Beyond ……………………………………………………..………………………………….                   7
Portfolio Highlights ……………………………………………..……………………………………….              9
Distribution Reinvestment Plan ……………………………………………...………………………..       10
     Distribution History ………………………………………………….……………………….....         10
Performance of SmartREIT Units ……………………………………………………………..……...        11
     Average Unit Trading Price …………………………………………………………….……...        11
     Average Daily Volume of Units Traded ……………………………………………………….     11
     Market Capitalization Summary ……………………………………………………………….         11
Gross Revenue and Area by Province ……………………………………………………………….         12
Top 25 Tenants ……………………………………………………………………………………........              13
Lease Expiration Schedule …………………………………………………………………………….             14
Area by Age ……………………………………………………………………………………………..                    15
Future Earnouts and Developments ………………………………………………………………….          16
Major Mixed-Use Real Estate Initiatives ……….…………………………………………………….    17
Recourse Loans to Developers ……………………………………………………………………….            18
Individual Property Summary ………………………………………………………………………….            19
General Information ………………………………………………………………………...................   31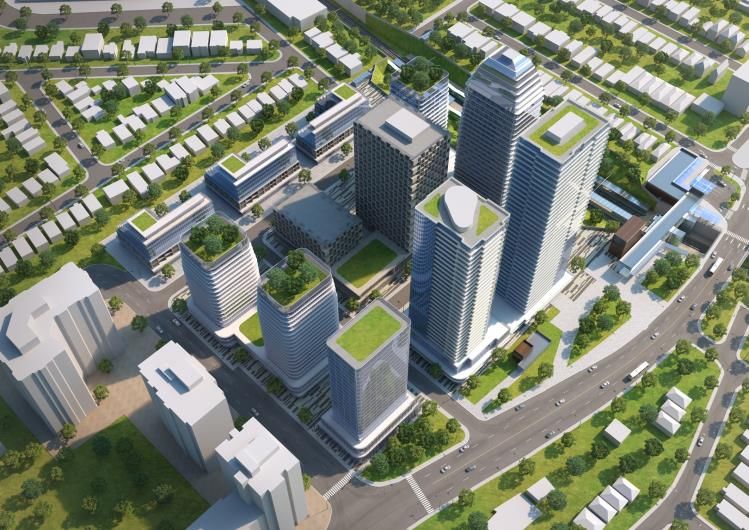
Notice to Reader

Readers are cautioned that certain terms used in this Supplemental Information Package (“Supplement”) such as Funds
From Operations ("FFO"), Adjusted Funds From Operations ("AFFO"), Adjusted Cashflow From Operations ("ACFO"),
"Gross Book Value", "Payout Ratio", "Interest Coverage", "Total Debt to Adjusted EBITDA" and any related per Unit
amounts used by management to measure, compare and explain the operating results and financial performance of the
Trust do not have any standardized meaning prescribed under IFRS and, therefore, should not be construed as
alternatives to net income or cash flow from operating activities calculated in accordance with IFRS. These terms are
defined in this Supplement and reconciled to the consolidated financial information of the Trust in the Management’s
Discussion and Analysis (“MD&A”) for the three months ended March 31, 2017. Such terms do not have a standardized
meaning prescribed by IFRS and may not be comparable to similarly titled measures presented by other publicly traded
entities.

Certain statements in this Supplement are "forward-looking statements" that reflect management's expectations regarding
the Trust's future growth, results of operations, performance and business prospects and opportunities. More specifically,
certain statements contained in this Supplement, including statements related to the Trust's maintenance of productive
capacity, estimated future development plans and costs, view of term mortgage renewals including rates and upfinancing
amounts, timing of future payments of obligations, intentions to secure additional financing and potential financing sources,
and vacancy and leasing assumptions, and statements that contain words such as "could", "should", "can", "anticipate",
"expect", "believe", "will", "may" and similar expressions and statements relating to matters that are not historical facts,
constitute "forward-looking statements". These forward-looking statements are presented for the purpose of assisting the
Trust's Unitholders and financial analysts in understanding the Trust's operating environment, and may not be appropriate
for other purposes. Such forward-looking statements reflect management's current beliefs and are based on information
currently available to management. However, such forward-looking statements involve significant risks and uncertainties.
A number of factors could cause actual results to differ materially from the results discussed in the forward-looking
statements. Although the forward-looking statements contained in this Supplement are based on what management
believes to be reasonable assumptions, the Trust cannot assure investors that actual results will be consistent with these
forward-looking statements. The forward-looking statements contained herein are expressly qualified in their entirety by
this cautionary statement. These forward-looking statements are made as at the date of this Supplement and the Trust
assumes no obligation to update or revise them to reflect new events or circumstances unless otherwise required by
applicable securities legislation.

S M A R T R E A L E S TAT E I N V E S T M E N T T R U S T
M A R C H 2 0 1 7 S U P P L E M E N TA L I N F O R M AT I O N PA C K A G E                                                 2
Conference Call Highlights
Operations – for the quarter
FFO per unit remained the same for the quarter compared to Q1 2016
AFFO(1) per unit decreased 3.8% for the quarter compared to Q1 2016
AFFO(1) payout ratio at 85.0% (79.4% in 2016)
Timing difference on revenues and general and administrative expenses negatively impacts FFO per unit by
approximately $0.01
Reduction in mezzanine loan and other interest impact of approximately $0.5 million year over year offset by benefit
of approximately same amount due to settlement of old tenant issues
Occupancy level at 98.1% at the end of the quarter (98.5% in 2016) and 98.4% including executed leases
Renewed 1,146,245 square feet, representing 56.0% of lease maturities for 2017, with average face rents increase
of 1.9%
Average cap rate of investment properties at 5.84%, (5.91% in 2016)
(1) The calculation of the Trust’s AFFO and related AFFO payout ratio, including comparative amounts, has changed pursuant to the February 2017 REALpac White
Paper on FFO and AFFO. As a result, comparability against previously reported AFFO and AFFO payout ratios may be inappropriate.
Tenant Activity
Approximately 74,000 square feet of tenancies were completed and transferred this quarter via earnouts and
development, providing an unleveraged yield of 5.3%
SmartREIT’s occupancy at 98.1% (98.4% including executed deals), remains strong. Had we treated the two former
Target anchored locations, which are now being developed, as vacant, our occupancy would have been 97.4%
Dollar store growth principally through Dollarama continues to absorb surplus space. Total number of stores is now
72 (Dollarama – 46, and Dollar Tree – 26)
No store closures due to Golf Town and only 1 store relating to the Grafton Fraser restructuring
No Sears exposure in any format
Overall, SmartREIT continues to monitor closely those tenants in certain markets where some rationalizing is taking
place
S M A R T R E A L E S TAT E I N V E S T M E N T T R U S T
M A R C H 2 0 1 7 S U P P L E M E N TA L I N F O R M AT I O N PA C K A G E 3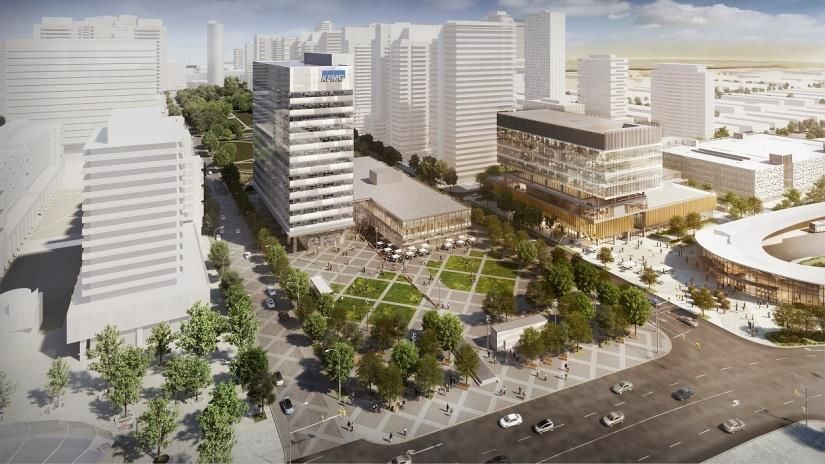
Conference Call Highlights
Growth
Same properties’ net operating income increased by 1.1% for the quarter compared to 2016
Premium Outlets
- Toronto
o tenant sales continuing to outperform expectations and are now over $1,100 psf
o virtually all temporary tenants replaced with long term leases and quality tenants, and site is
97.4% occupied
o stabilized yield continues to be in the double digits
o new tenants opening soon include Carter's and Soft Moc, and a variety of potential high quality
tenants are looking at the last available unit
o construction well underway on a new parking facility to provide a net new 900 parking spots as
part of the 140,000 square foot expansion of the shopping centre
o temporary parking facility created for up to 600 vehicles to support building activity
- Montreal
o tenancy of long and short term tenants currently at 98.1%, leaving only two stores to be leased
o Salvatore Ferragamo opened subsequent to quarter-end and joins Gucci as key traffic drivers
with respect to luxury brands
o 2016 sales grew 21.4% over 2015 and are now over $560 psf
o recent new tenants include Laura, Thread & Copper and Moose Knuckles's only retail outlet
- SmartREIT actively working with Simon to develop two potential additional sites
Vaughan Metropolitan Centre
- construction progressing very well and the KPMG tower is now complete
- KPMG office opened on October 3rd, 2016 and now has approximately 500 staff in place
- the KPMG Tower won the 16th Annual Real Estate Excellence (REX) Award for Office Development of the
Year for the GTA
- marginal office space left now in the KPMG tower based on executed leases and those under negotiation.
New retail and office tenants include TD Bank and BMO, and a global insurance company is finalizing a lease
for the 2nd floor in the tower and all of the additional podium space
- project coming in well below budget for construction costs
- second mixed-use tower now finalized with PWC as lead tenant as well as YMCA, a library and other
community space - will break ground this month
- planning process continuing for first residential development in a joint venture with CentreCourt Developments
Inc. on two condominium towers, now projected to be 53-55 storeys each and approximately 1,200 units.
Sales office will open in the next few weeks for the first tower
- condominium tower will include new BUCA-branded restaurant and BAR BUCA at the lobby level
S M A R T R E A L E S TAT E I N V E S T M E N T T R U S T
M A R C H 2 0 1 7 S U P P L E M E N TA L I N F O R M AT I O N PA C K A G E 4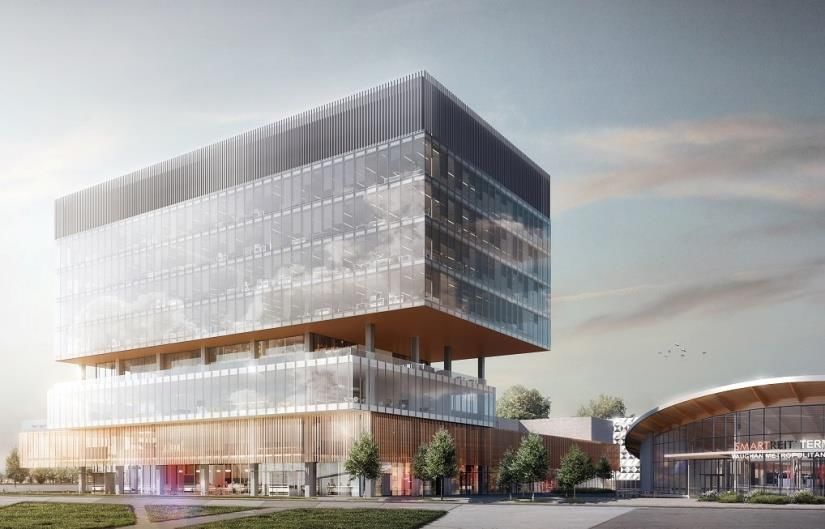
Conference Call Highlights
Growth (cont’d)
Vaughan Metropolitan Centre (cont’d)
- design work commenced on next phase, with over 2 million square feet of mixed-use complex fronting on
Hwy 7
- subway opening in late 2017 remains on target
- York Regional bus terminal has broken ground and expected to be ready by late 2017
- significant internal road infrastructure to be completed during 2017 to improve internal access
Future Opportunities
- residential single family home project at Vaughan NW moving forward in a JV with Fieldgate, a well known
home developer, with up to 300 freehold townhomes expected on an approximately 16-acre site, and initial
occupancy planned for 2019. Expected return of 20% to 25% on costs of $185 million of which our share is
50%
- earnouts and developments – committed pipeline of approximately 109,000 square feet in place at a yield of
6.7%
- the initial phase of development of office and retail space for the StudioCentre at Lakeshore Boulevard East
has now begun. The film studios are fully booked until at least the end of 2017
- Westside Mall – mixed-use opportunity for 2 million to 2.5 million square feet resulting from Eglinton LRT line
station and proposed GO interchange integrated with existing retail property moving forward with strong
council support
- Laval Centre
o proposed mixed-use development, including office, residential, seniors housing and further
retail, now underway
o JV with Jadco progressing well and construction expected to start in early fall for first rental
tower
Intensification / Redevelopment
- JV with SmartStop Asset Management progressing for self-storage sites. Five sites in the GTA now moving
forward with more sites to follow
- begun discussions with a number of potential partners to consider residential (including condominium, rental
and single family homes), seniors housing and other potential uses on existing retail sites
Acquisitions
- market activity with respect to SmartREIT quality property continues to be very limited, but various
opportunities under consideration
See chart on page 17 for a summary of the financial benefits of each of these opportunities and others not specifically
discussed.
S M A R T R E A L E S TAT E I N V E S T M E N T T R U S T
M A R C H 2 0 1 7 S U P P L E M E N TA L I N F O R M AT I O N PA C K A G E 5
Conference Call Highlights
Capital Activities
Leverage at 45.0% of FMV, up from 44.6% in 2016. Subsequent to quarter-end, on April 13, 2017, $150.0 million
aggregate principal amount of 3.385% Series J senior unsecured debentures were redeemed. Including the
repayment of these debentures, leverage reduced to 44.1%
Total debt weighted average interest rate of 3.71% (4.01% in 2016)
Interest coverage at 3.1X (3.0X in 2016)
Unencumbered asset pool in excess of $2.7 billion, providing significant future flexibility. Pool contains high quality
assets
On March 13, 2017, $150.0 million of 5-year 2.876% Series Q senior unsecured debentures was issued for net
proceeds including issuance costs totaling $149.1 million
Secured debt of $21.5 million with a weighted average interest rate of 4.35% was repaid
Annual distributions increased in October 2016 to $1.70 from $1.65, representing a 3.0% increase
2017 Outlook
2017 Operating FFO still expected to grow in the 2% - 3% range, based on:
- same property growth
- full year of NOI from 2016 acquisitions
- full year of refinancing benefits from 2016 and further 2017 benefits
- developments and earnouts
- lease buyouts and guarantee payments
- continued G&A costs associated with the development platform
- ongoing settlement of long-standing tenant issues
2017 Transactional FFO from land sales to new Joint Ventures still expected to be in the 1% - 2% range based on
various JV relationships in place
Payout ratio expected to continue to stay in the mid to low 80% range by the end of the year
Adoption of the new REALpac guidelines on AFFO and ACFO has led management to consider the appropriate
measurement going forward
Adjusted payout ratio at Q1 was 85.0%, reflecting somewhat higher sustaining capex and leasing costs in Q1 2017
due to portfolio leasing activity
Acquisitions targeted in the $150 million range
Occupancy expected to remain in excess of 98%, assuming no material retailer challenges, with some fluctuations in
the balance of the year based on known projected vacancies
S M A R T R E A L E S TAT E I N V E S T M E N T T R U S T
M A R C H 2 0 1 7 S U P P L E M E N TA L I N F O R M AT I O N PA C K A G E 6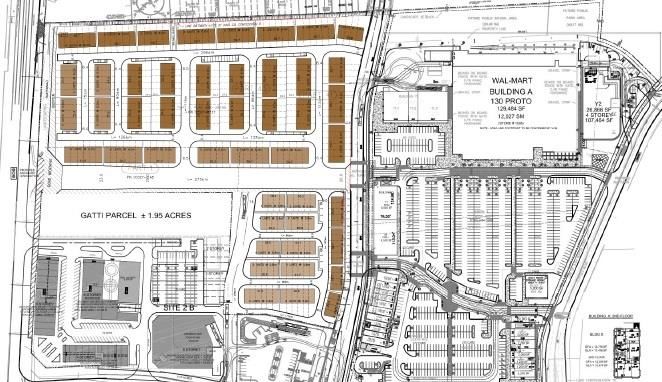
Looking Beyond

        Vaughan Metropolitan Centre – Concept Plan

                                                                             Vaughan Metropolitan Centre
                                                                             See Vaughan’s new downtown vision on YouTube:
                                                                             http://www.youtube.com/watch?v=m3uO9eU8SwI

        VMC - Artist's Rendering of the PWC Tower

                                                                             Westside Mall – Concept Plan

S M A R T R E A L E S TAT E I N V E S T M E N T T R U S T
M A R C H 2 0 1 7 S U P P L E M E N TA L I N F O R M AT I O N PA C K A G E                                                   7
Looking Beyond
Toronto Premium Outlets – Expansion Plan
Potential Single Family Development in
Vaughan NW
Laval Centre – Concept Plan
S M A R T R E A L E S TAT E I N V E S T M E N T T R U S T
M A R C H 2 0 1 7 S U P P L E M E N TA L I N F O R M AT I O N PA C K A G E 8Portfolio Highlights
As at As at
March 31, 2017 March 31, 2016
in $000s, except for Unit and other non-financial data)
Number of retail and other properties 142 139
Number of properties under development 8 11
Number of office properties 1 0
Number of mixed-use properties 1 0
Total number of properties owned 152 150
Number of Walmarts / Supercentres 95 / 90 94 / 89
Number of Walmarts / Supercentres (including shadows) 109 / 103 108 / 102
Gross leasable area (sq. ft.) 32,024,887 31,033,583
Total GLA in Walmart anchored centres (sq. ft.) 27,362,648 26,451,035
Future estimated development area (sq. ft.) 4,068,361 5,016,641
Occupancy 98.1% 98.5%
Occupancy including executed leases 98.4% 98.5%
Average lease term to maturity 6.1 years 6.7 years
Net rental rate (per occupied sq. ft.) $15.24 $15.22
Net rental rate excluding anchors (per occupied sq. ft.) (1) $21.83 $21.97
Investment properties(2) 8,202,187 8,215,538
Total assets 8,886,478 8,562,488
Debt(2) 4,031,172 3,838,553
Total debt – Weighted average interest rate (3) 3.71% 4.01%
Secured debt – Weighted average contractual interest rate (4) 3.78% 3.86%
Secured debt – Weighted average maturity 4.6 years 5.3 years
Debt to gross book value (5) 52.5% 52.1%
Debt to gross book value, excluding $150M Series J debentures (5) 51.6% 52.1%
Debt to aggregate assets 45.0% 44.6%
Debt to aggregate assets, excluding $150M Series J debentures 44.1% 44.6%
Secured debt to aggregate assets 28.5% 31.1%
Unencumbered assets to unsecured debt 1.9X 2.1X
Unencumbered assets to unsecured debt, excluding $150M Series J debentures 2.1X 2.1X
Interest coverage (6) 3.1X 3.0X
Debt to adjusted EBITDA (7) 8.4X 8.4X
Equity (book value) 4,669,726 4,532,177
Units outstanding (8) 156,072,260 154,608,575
Three months ended Three months ended
March 31, 2017 March 31, 2016
FFO excluding adjustments (9) $0.54 $0.54
AFFO (9) $0.50 $0.52
Payout ratio (to AFFO) (10) 85.0% 79.4%
Surplus of cash provided by operating activities over distributions paid 1,937 3,788
(1) Anchors are defined as tenants within a property with leasable area greater than 30,000 square feet.
(2) Includes the Trust's share of investment in associate.
(3) Includes convertible debentures and acquisition date fair value adjustments.
(4) Excludes acquisition date fair value adjustments.
(5) Defined as debt divided by Aggregate Assets plus accumulated amortization less cumulative unrealized fair value gain or loss with respect to investment
property. Refer to “Financial Covenants” in the MD&A for the three months ended March 31, 2017 for a reconciliation of this ratio.
(6) Defined as Adjusted EBITDA over interest expense, where interest expense excludes the distributions on deferred units and LP Units classified as
liabilities and adjustments relating to the early redemption of unsecured debentures. Refer to “Financial Covenants” in the MD&A for the three months
ended March 31, 2017 for a reconciliation of this ratio.
(7) Defined as debt divided by Adjusted EBITDA.
(8) Total Units outstanding include Trust Units and LP Units, including LP Units classified as liabilities. LP Units classified as equity in the consolidated
financial statements are presented as noncontrolling interests.
(9) See “Other Measures of Performance” in the MD&A for the three months ended March 31, 2017 for a reconciliation of these measures to the nearest
consolidated financial statement measure.
(10) Payout ratio is calculated as distributions per Unit divided by Adjusted Funds From Operations per Unit.
S M A R T R E A L E S TAT E I N V E S T M E N T T R U S T
M A R C H 2 0 1 7 S U P P L E M E N TA L I N F O R M AT I O N PA C K A G E 9Distribution Reinvestment Plan
Unitholders who elect to participate will have their monthly cash distributions automatically reinvested in units of
SmartREIT at a price equal to 97% of the average TSX market price over the 10 business days preceding the monthly
distribution date.
SmartREIT’s DRIP will be administered by Computershare Trust Company of Canada. Interested unitholders can also
obtain an information package and the necessary registration forms from, or direct any inquiries/concerns regarding the
DRIP to, Computershare Trust Company of Canada via telephone at 1-800-564-6253 or via mail at:
Smart Real Estate Investment Trust
c/o Computershare Trust Company of Canada
100 University Avenue, 9th Floor
Toronto, ON, M5J 2Y1
Canada
Attention: Dividend Reinvestment Department
Distribution History
Per unit, paid monthly
2017 2016 2015 2014 2013
($) ($) ($) ($) ($)
January 0.14167 0.13750 0.13340 0.12900 0.12900
February 0.14167 0.13750 0.13340 0.12900 0.12900
March 0.14167 0.13750 0.13340 0.12900 0.12900
April 0.13750 0.13340 0.12900 0.12900
May 0.13750 0.13340 0.12900 0.12900
June 0.13750 0.13340 0.12900 0.12900
July 0.13750 0.13340 0.12900 0.12900
August 0.13750 0.13340 0.12900 0.12900
September 0.13750 0.13340 0.12900 0.12900
October 0.14167 0.13750 0.13340 0.12900
November 0.14167 0.13750 0.13340 0.12900
December 0.14167 0.13750 0.13340 0.12900
Total 0.42501 1.66251 1.61310 1.56120 1.54800
S M A R T R E A L E S TAT E I N V E S T M E N T T R U S T
M A R C H 2 0 1 7 S U P P L E M E N TA L I N F O R M AT I O N PA C K A G E 10Performance of SmartREIT Units
Average Unit Trading Price
Per unit
2017 2016 2015 2014 2013
($) ($) ($) ($) ($)
1st Quarter 32.47 31.33 30.17 25.37 29.35
2nd Quarter 34.78 29.45 26.52 27.71
3rd Quarter 36.59 29.75 26.23 24.99
4th Quarter 31.96 31.33 27.14 24.91
YTD / Annual 32.47 33.42 30.29 26.31 26.68
Closing trading
price at end of 32.67 32.29 30.19 27.30 25.16
period
Average Daily Volume of Units Traded
2017 2016 2015 2014 2013
($) ($) ($) ($) ($)
1st Quarter 221,865 288,045 200,374 199,418 201,657
2nd Quarter 198,964 242,372 185,756 205,188
3rd Quarter 226,367 218,051 156,254 224,222
4th Quarter 278,983 334,127 184,375 200,424
Annual 221,865 247,612 248,924 181,379 207,912
Market Capitalization Summary
Date Total Units Outstanding (1) Share price per Unit Market Capitalization
($) ($)
March 31, 2017 156,072,260 32.67 5,098,880,734
December 31, 2016 155,686,295 32.29 5,027,110,466
December 31, 2015 154,088,207 30.19 4,651,922,983
December 31, 2014 136,315,194 27.30 3,721,404,809
December 31, 2013 134,381,155 25.16 3,381,029,860
(1) Total Units outstanding include Trust Units and LP Units, including LP Units classified as liabilities. LP Units classified as equity in the consolidated
financial statements are presented as non-controlling interests.
S M A R T R E A L E S TAT E I N V E S T M E N T T R U S T
M A R C H 2 0 1 7 S U P P L E M E N TA L I N F O R M AT I O N PA C K A G E 11Gross Revenue and Area by Province
Gross Revenue by Province
1 – Ontario – 60.2%
2 – Quebec – 15.1%
3 – British Columbia – 8.8%
4 – Manitoba – 3.7%
5 – Alberta – 3.7%
6 – Saskatchewan – 3.4%
7 – Newfoundland and Labrador – 3.0%
8 – Nova Scotia – 0.9%
9 – New Brunswick – 0.7%
10 – Prince Edward Island – 0.5%
Gross Area by Province
1 – Ontario – 56.6%
2 – Quebec – 16.1%
3 – British Columbia – 9.3%
4 – Alberta – 4.7%
5 – Saskatchewan – 3.9%
6 – Manitoba – 3.6%
7 – Newfoundland and Labrador – 3.2%
8 – Nova Scotia – 1.0%
9 – New Brunswick – 0.9%
10 – Prince Edward Island – 0.7%
S M A R T R E A L E S TAT E I N V E S T M E N T T R U S T
M A R C H 2 0 1 7 S U P P L E M E N TA L I N F O R M AT I O N PA C K A G E 12Top 25 Tenants
Number Gross Remaining
Rank Tenant of Stores Rental Revenue Lease Term
(%) (years)
1 Walmart 95 26.3 7.6
2 Canadian Tire, Mark's and FGL Sports 67 4.5 6.0
3 Winners, HomeSense, Marshalls 49 4.0 5.3
4 Lowe's, RONA 9 2.6 7.2
5 Sobeys 17 2.4 6.2
6 Reitmans 100 2.3 3.3
7 Loblaws and Shoppers Drug Mart 20 2.3 7.2
8 Best Buy 23 1.9 2.6
9 Dollarama 46 1.6 4.5
10 Michaels 24 1.6 4.6
11 Staples 23 1.5 2.9
12 LCBO 29 1.4 7.9
13 Cara Restaurants 48 1.3 5.1
14 Hudson's Bay Company 14 1.2 3.4
15 Gap Inc. 23 1.1 2.8
16 The Brick 9 1.1 4.4
17 Bonnie Togs 42 1.0 5.3
18 Bulk Barn 48 1.0 5.9
19 Toys R Us 7 1.0 6.2
20 CIBC 26 0.9 3.3
21 Dollar Tree and Dollar Giant 26 0.9 4.8
22 Pacific West 37 0.8 4.7
23 Sail 4 0.8 9.6
24 Metro 7 0.8 5.5
25 Home Depot 3 0.8 6.5
Total 796 65.1 6.6
S M A R T R E A L E S TAT E I N V E S T M E N T T R U S T
M A R C H 2 0 1 7 S U P P L E M E N TA L I N F O R M AT I O N PA C K A G E 13Lease Expiration Schedule
Number Annualized Base Average
Year of Expiry of Stores Area Area Rent Rent psf
(sq. ft.) (%) ($) ($)
Month-to-month and holdovers 59 233,921 0.7 4,118,063 17.60
2017 (remainder of year) 176 938,454 2.9 17,170,551 18.30
2018 473 2,356,183 7.4 49,510,100 21.01
2019 394 3,106,947 9.7 47,504,715 15.29
2020 331 3,368,510 10.5 49,602,100 14.73
2021 357 3,540,893 11.1 50,624,287 14.30
2022 289 3,928,655 12.3 52,254,370 13.30
2023 240 2,809,343 8.8 40,953,970 14.58
2024 208 2,014,223 6.3 33,865,395 16.81
2025 130 1,393,871 4.4 19,518,694 14.00
2026 145 1,452,982 4.5 25,327,232 17.43
2027 79 1,738,918 5.4 24,223,201 13.93
2028 26 880,723 2.8 13,242,340 15.04
2029 21 1,401,290 4.4 17,109,325 12.21
2030 11 604,448 1.9 9,726,569 16.09
2031 13 455,049 1.4 7,479,315 16.44
2032 5 700,744 2.2 9,944,887 14.19
Beyond 4 487,847 1.4 6,557,681 13.44
Vacant 197 611,886 1.9 - -
Total 3,158 32,024,887 100.0 478,732,794 15.24
Weighted Average Lease Expiry by area = 6.1 years
S M A R T R E A L E S TAT E I N V E S T M E N T T R U S T
M A R C H 2 0 1 7 S U P P L E M E N TA L I N F O R M AT I O N PA C K A G E 14Area by Age
Age Area Area
(sq. ft.) (%)
2002 – present 24,033,758 75.1
1995 – 2001 7,220,597 22.5
Before 1995 770,532 2.4
Total 32,024,887 100.0
Portfolio of high quality, newly developed assets with an average age
of 13.3 years and minimal capital expenditure requirements.
S M A R T R E A L E S TAT E I N V E S T M E N T T R U S T
M A R C H 2 0 1 7 S U P P L E M E N TA L I N F O R M AT I O N PA C K A G E 15Future Earnouts and Developments
Total Gross Invested Net Yield /
Year Area Area Income Commitment To-date Commitment Cap Rate
(sq. ft.) (%) ($000s) ($000s) ($000s) ($000s) (%)
Earnouts
Committed Earnouts
2017 4,878 0.1% 197 2,871 583 2,288 6.9%
2018 and beyond 6,950 0.2% 176 2,692 27 2,665 6.5%
Sub-total Committed Earnouts 11,828 0.3% 373 5,563 610 4,953 6.7%
Uncommitted Earnouts
2017 18,436 0.5% 355 5,409 376 5,033 6.6%
2018 and beyond 534,558 13.1% 10,968 164,540 4,519 160,021 6.7%
Sub-total Uncommitted Earnouts 552,994 13.6% 11,323 169,949 4,895 165,054 6.7%
(1)
Total Earnouts 564,822 13.9% 11,696 175,512 5,505 170,007 6.7%
Developments
Committed Developments
(2) (2)
2017 32,502 0.8% 700 10,676 4,239 6,437 6.6%(3)
(2) (2)
2018 and beyond 64,252 1.6% 1,389 20,610 7,450 13,160 6.7%(3)
Sub-total Committed Developments 96,754 2.4% 2,089 31,286 11,689 19,597 6.7%
Uncommitted Developments
(2) (2)
2017 106,016 2.6% 1,871 20,996 20,344 652 8.9%(3)
(2) (2)
2018 and beyond 3,300,769 81.1% 71,586 1,170,071 470,899 699,172 6.1%(3)
Sub-total Uncommitted Developments 3,406,785 83.7% 73,457 1,191,067 491,243 699,824 6.2%
Total Developments (4) 3,503,539 86.1% 75,546 1,222,353 502,932 (1)
719,421 6.2%
Total Earnouts and Developments 4,068,361 100.0% 87,242 1,397,865 508,437 889,428 6.2%
Non-cash Development Cost (5) 4,956
Vaughan Metropolitan Centre (“VMC”) (6) 72,620 (1)
(1)
Total before Mezzanine Financing 4,068,361 100.0% 87,242 1,397,865 586,013 889,428 6.2%
(7)
Options through Mezzanine Financing 700,667
Total Potential Pipeline 4,769,028
(1) Under “Properties Under Development” in the MD&A for the three months ended March 31, 2017, Earnouts of $71,900, Developments of $417,544 and Investments in
associates relating to VMC of $101,096 comprise the total amount of $590,540. The amounts in the chart above have been adjusted for i) Earnouts that are expected to be
completed after the expiry of the Earnout options being reclassified as Developments and ii) the first phases of VMC relating to the office complexes referred to in Note 4 have
been included as Developments.
(2) Includes fair value adjustment for land.
(3) On a cost basis, the yield would be 6.0%, 6.6%, 7.5%, and 5.6%, respectively.
(4) Includes the Trust’s 50% ownership of the office complex in VMC with KPMG as lead tenant and a second office complex with PWC as lead tenant, scheduled to be completed
by 2019.
(5) Represents net liability currently recorded.
(6) Future development lands relating to the Trust’s 50% ownership of the VMC, but excluding the office complexes in Note 4.
(7) See “Recourse Loans to Developers”.
S M A R T R E A L E S TAT E I N V E S T M E N T T R U S T
M A R C H 2 0 1 7 S U P P L E M E N TA L I N F O R M AT I O N PA C K A G E 16Major Mixed-Use Real Estate Initiatives
Estimated Costs ($M) Estimated Gain on Final Sale
GLA ('000sf) SRU NOI at 100% NOI at SRU Completion
Site Project Type / Units % Share 100% SRU Share ($M) Share ($M) Year Yield Profit % SRU Share Timing
a. KPMG (T#1) Office 360sf 50% $184 $92 $10.5 $5.25 2016 5.8% - - -
b. PWC (T#2) Office 105sf 50% $70.6 $35.3 $2.8 $1.4 2019 4.5%-5.5% - - -
c. Office (T#3) Office 450sf 50% $140 $70 $8.4 $4.2 2021 5.5%-6.5% - - -
(1)
1. VMC (Office Towers) d. Office (T#4) Office 450sf 50% $140 $70 $8.4 $4.2 2023 5.5%-6.5% - - -
2018
(2)
2. Toronto Premium Outlets Phase II (JV) Retail 144sf 50% $118.80 $59.4 $10.9 $5.4 NOV 2018 9.0%-9.5% - - -
(2)
3. Montreal Premium Outlets Phase II (JV) Retail 140sf 50% $56 $28 $5.6 $2.7 2021-2022 9%-10% - - -
4. New Premium Outlets Premium (JV) Retail 260sf 50% $114 $57 $8.7 $4.4 2020 7.5%-8.0% - - -
(3)
5. Laval Centre Jadco (2 Bldgs) Apartments 300 Units 50% $75 $37.5 $4.3 $2.2 2019-2020 5.7% - - -
CentreCourt Condo #1 553 Units 25% $162 $40.5 N/A N/A 2020 N/A 15%-20% 25% 2020
CentreCourt Condo #2 570 Units 25% $203 $50.75 N/A N/A 2021 N/A 15%-20% 25% 2021
Condo Condo #3 550 Units 25% $160 $40 N/A N/A 2022 N/A 15%-20% 25% 2022
(3)
6. VMC (Condos) Condo Condo #4 & 5 1,100 Units 25% $320 $80 N/A N/A 2023 N/A 15%-20% 25% 2023
(3)
7. Vaughan NW Fieldgate Townhomes 296 Units 50% $186.7 $93 N/A N/A 2019-2020 N/A 15%-25% 50% 2019-2020
8. Ottawa Laurentian JV Partner (2 Bldgs) Apartments 300 Units 25% $86 $21.5 $4.9 $1.23 2020-2021 5.5%-6.5% - - -
400sf built $4.1M net $2.0M net
Self Storage per Year in $52M per yr $26M per yr new NOI new NOI
(4 new facilities each of in each of in each of commences commences
9. Multiple Locations Self Storage (JV) each year) years 1-5 50% years 1-5 years 1-5 annually annually 2019-2023 7.5%-8.5% - - -
Mixed-Use
(Office, Studio,
10. StudioCentre (Toronto) SRU-Penguin JV Hotel) 150sf 50% $53 $26.3 $3.4 $1.71 2019-2022 6.0%-7.0% - - -
Notes:
(1) KPMG and PWC towers are included in the future development pipeline as Developments (see “Future Earnouts and Developments”).
(2) The Phase II expansions for both the Toronto Premium Outlets and the Montreal Premium Outlets are included in the future development pipeline as Developments (see “Future Earnouts and Developments”).
(3) Estimated Incremental FFO Gain on Sale in 2017 related to Laval Centre, VMC (Condo's) and Vaughan NW parcels, collectively are in the range of 1-2% of annual FFO at SmartREIT's ownership share. Further land sale
gains are expected to occur in future years as sales of land into JV's continue.
In addition to the projects set out in the table above (with the exception of the projects listed in Notes 1 and 2), SmartREIT's pipeline also includes approximately 4.1 million sf of future developments
as set out in the table shown on the “Future Earnouts and Developments” section . Also in addition to the above, over the longer term, SmartREIT has a further mixed-use development pipeline
estimated at 4-4.5M sf in projects such as Ottawa South SmartCentre, Westside Mall (Toronto), Vaughan (400 & 7) SmartCentre and Richmond Hill SmartCentre.
S M A R T R E A L E S TAT E I N V E S T M E N T T R U S T
M A R C H 2 0 1 7 S U P P L E M E N TA L I N F O R M AT I O N PA C K A G E 17Recourse Loans to Developers
Total
Leasable Potential Area
Loan Interest Area upon Upon Exercising
Project Outstanding Committed Maturity Date Rate Option Completion Purchase Option
($000s) ($000s) (%) (%) (8) (sq. ft.) (sq. ft.) (8)
Salmon Arm, BC(1)(2) 16,536 23,264 October 2017 4.28% - 215,431 -
(1)(3)
Innisfil, ON 18,947 27,077 December 2020 2.91% - 139,744 -
Aurora (South), ON(4) 15,020 30,543 March 2022 3.67% 50% 193,035 96,518
(5)
Mirabel (Retail Centre I), QC - 18,262 December 2022 7.50% - 256,000 -
(6)
Mirabel (Retail Centre II), QC - 5,721 December 2022 7.50% - 178,068 -
(1)(4)
Toronto (Eastern), ON 25,150 43,759 November 2023 3.94% 25% 911,322 227,831
Vaughan (7 & 427), ON 16,014 53,127 December 2023 4.97% 50% 302,029 151,015
(4)
Pitt Meadows, BC 25,648 68,664 April 2024 4.13% 50% 450,605 225,303
(4)
Caledon (Mayfield), ON 8,715 14,034 June 2024 3.97% 50% - -
Total 126,031 284,452 3.97% 2,646,234 700,667
(1) The Trust owns a 50% interest in these properties, with the other 50% interest owned by Penguin. These loans are secured against Penguin's interest in the property.
(2) Monthly variable rate based on a fixed rate of 6.35% on loans outstanding up to $7,200 and banker's acceptance rate plus 1.75% on any additional loans above $7,200.
(3) The monthly variable rate is based on the banker's acceptance rate plus 2.00%. The interest rate on this mortgage will reset in 2018 to the four-year Government of Canada bond
rate plus 4.0%, subject to a lower limit of 6.75% and an upper limit of 7.75%.
(4) These loans were amended during the three months ended March 31, 2017. See Loan Amendments section in the MD&A for the three months ended March 31, 2017.
(5) The Trust owns a 33.3% interest in this property. The loan is secured against a 33.3% interest owned by Penguin, as well as a guarantee by Penguin.
(6) The Trust owns a 25% interest in this property. The loan is secured against a 25% interest owned by Penguin, as well as a guarantee by Penguin.
(7) The Trust has an option to purchase an additional purchase option percentage from the borrower in these properties. As at March 31, 2017, it is management's expectation that
the Trust will exercise these purchase options.
Note: Of the $158.4 million of remaining loan advances available, $81.6 million is set aside as interest accrual reserve.
S M A R T R E A L E S TAT E I N V E S T M E N T T R U S T
M A R C H 2 0 1 7 S U P P L E M E N TA L I N F O R M AT I O N PA C K A G E 18Individual Property Summary
Owned Rentable Owned Rentable Non-Owned
Property Location Occupancy Area Anchor Area (1) Anchor Area (1) Anchors and Major Tenants
(%) (sq. ft.) (sq. ft.) (sq. ft.)
Retail Properties
British Columbia
Walmart Supercentre, Winners,
Courtenay SmartCentre Courtenay, BC 97.2 273,289 135,899 - Staples, Best Buy, Sport Chek,
Mark's, Reitmans, RBC
Walmart Supercentre, Real
Canadian Superstore*, Home
Cranbrook SmartCentre Cranbrook, BC 100.0 164,025 107,158 185,556
Hardware*, Sport Chek, Dollar
Tree
Walmart Supercentre*, RONA*,
Cowichan Commons East Duncan, BC 96.5 247,954 188,680 235,732 Canadian Tire, Home Depot, Best
Buy, Bulk Barn
Walmart Supercentre, Michaels,
Kamloops SmartCentre Kamloops, BC 97.3 232,800 143,619 - Lordco Auto Parts, Pier 1 Imports,
Sleep Country
Walmart Supercentre, Home
Langley SmartCentre Langley, BC 98.7 351,224 261,497 172,161 Depot*, Save-on-Foods*, Home
Outfitters, London Drugs, Best Buy
Walmart Supercentre, Thrifty
Maple Ridge SmartCentre Maple Ridge, BC 100.0 215,684 146,521 - Foods, Westminster Savings Credit
Union, Dollar Tree, Rexall
Walmart Supercentre, Home
New Westminster
New Westminster, BC 95.7 407,577 159,449 - Outfitters, Tommy Hilfiger, Carter's
SmartCentre
OshKosh, The Gap
Walmart Supercentre*, Sport Chek,
Peachtree Square Penticton, BC 95.0 54,915 - 175,000 Dollar Tree, Valley First Credit
Union, Bulk Barn
Real Canadian Superstore,
Penticton Power Centre Penticton, BC 98.6 202,322 110,795 - Staples, Winners, Sleep Country,
TD Canada Trust
Walmart Supercentre, Home
Prince George SmartCentre Prince George, BC 97.3 313,390 165,350 204,247 Depot*, Canadian Tire*, Michaels,
Old Navy, Mark's, Petland
Walmart Supercentre, Winners,
Salmon Arm SmartCentre** Salmon Arm, BC 100.0 67,324 48,345 -
Dollarama, Bulk Barn
Walmart Supercentre, Dollar Tree,
Surrey West SmartCentre Surrey, BC 100.0 187,156 133,943 - Ardene, Sleep Country, Reitmans,
Carter's OshKosh
Walmart Supercentre, RONA*,
Vernon SmartCentre Vernon, BC 94.3 259,302 144,782 50,300 Best Buy, Value Village, Mark's,
Petland, Sleep Country
Subtotal British Columbia 97.5 2,976,962 1,746,038 1,022,996
S M A R T R E A L E S TAT E I N V E S T M E N T T R U S T
M A R C H 2 0 1 7 S U P P L E M E N TA L I N F O R M AT I O N PA C K A G E 19Individual Property Summary
Owned Rentable Owned Rentable Non-Owned
Property Location Occupancy Area Anchor Area (1) Anchor Area (1) Anchors and Major Tenants
(%) (sq. ft.) (sq. ft.) (sq. ft.)
Alberta
Walmart Supercentre, London
Calgary Southeast
Calgary, AB 100.0 246,085 199,758 - Drugs, Mark's, Reitmans, Carter's
SmartCentre
OshKosh, Bulk Barn
Re/Max, Respiratory Homecare
Crowchild Corner Calgary, AB 100.0 23,377 - -
Solutions Inc.
Walmart Supercentre, Safeway,
Edmonton East
Edmonton, AB 100.0 180,100 94,835 - Winners, Petland, Dollarama, TD
SmartCentre**
Canada Trust
Walmart Supercentre, Michaels,
Edmonton Northeast
Edmonton, AB 97.5 274,353 161,925 - Bulk Barn, Moores, Penningtons,
SmartCentre
Reitmans
Lethbridge II SmartCentre Lethbridge, AB 100.0 53,392 40,373 - Sobeys
Walmart Supercentre, Home
Lethbridge SmartCentre Lethbridge, AB 100.0 333,092 194,564 95,000 Depot*, Ashley Furniture, Best
Buy, Mark's, Gap Outlet
Walmart Supercentre, Save-on-
St. Albert SmartCentre St. Albert, AB 100.0 251,329 197,101 91,737 Foods*, RONA*, Mark's, Canadian
Western Bank
Walmart Supercentre, Canadian
Sylvan Lake SmartCentre Sylvan Lake, AB 100.0 131,983 115,829 68,947
Tire*, Dollarama
Subtotal Alberta 99.5 1,493,711 1,004,385 255,684
Saskatchewan
Walmart Supercentre,
Regina East SmartCentre (I) Regina, SK 100.0 398,003 282,845 - HomeSense, London Drugs, Home
Outfitters, Best Buy, Michaels
RONA, Real Canadian
Regina East SmartCentre
Regina, SK 99.4 198,134 107,608 130,000 Superstore*, Wholesale Sports,
(II)
Old Navy, Petland
Walmart Supercentre, IGA, Mark's,
Regina North SmartCentre Regina, SK 99.5 276,251 206,339 - Dollarama, Bulk Barn, Reitmans,
TD Canada Trust
Walmart Supercentre, Home
Saskatoon South
Saskatoon, SK 100.0 374,722 194,210 109,084 Depot*, HomeSense, The Brick,
SmartCentre
Ashley Furniture, Golf Town
Subtotal Saskatchewan 99.8 1,247,110 791,002 239,084
S M A R T R E A L E S TAT E I N V E S T M E N T T R U S T
M A R C H 2 0 1 7 S U P P L E M E N TA L I N F O R M AT I O N PA C K A G E 20Individual Property Summary
Owned Rentable Owned Rentable Non-Owned
Property Location Occupancy Area Anchor Area (1) Anchor Area (1) Anchors and Major Tenants
(%) (sq. ft.) (sq. ft.) (sq. ft.)
Manitoba
RONA, Costco*, Indigo Books,
Kenaston Common
Winnipeg, MB 100.0 257,222 98,570 143,613 Golf Town, Petland, Nygard, CIBC,
SmartCentre
HSBC, RBC
Walmart Supercentre, Home
Winnipeg Southwest
Winnipeg, MB 98.1 528,180 281,606 95,000 Depot*, Safeway, Home Outfitters,
SmartCentre
HomeSense, Urban Planet
Walmart Supercentre, Canadian
Winnipeg West SmartCentre Winnipeg, MB 97.0 354,679 171,146 75,240 Tire*, Sobeys, Winners, Value
Village, Sport Chek, Staples
Subtotal Manitoba 98.2 1,140,081 551,322 313,853
Ontario
Walmart Supercentre, Dollarama,
Alliston SmartCentre Alliston, ON 100.0 170,770 151,709 -
Tim Hortons
Walmart Supercentre, Canadian
Ancaster SmartCentre Ancaster, ON 99.0 264,833 163,794 74,018 Tire*, Winners, GoodLife Fitness,
Bouclair, Dollar Tree
Walmart Supercentre, RONA, Best
Aurora North SmartCentre Aurora, ON 99.2 508,567 313,637 - Buy, Golf Town, LCBO, Dollarama,
RBC, TD Canada Trust
Aurora SmartCentre Aurora, ON 85.1 51,186 - - Winners, Bank of Nova Scotia
Food Basics, Pharma Plus,
Barrie Essa Road Shopping
Barrie, ON 88.8 104,916 35,152 - Dollarama, Anytime Fitness, Pet
Centre
Valu, Tim Hortons
Walmart Supercentre, Loblaws*,
Barrie North SmartCentre Barrie, ON 98.3 234,700 160,727 81,373 Old Navy, Carter's OshKosh,
Addition-Elle, Reitmans
Walmart Supercentre, Sobeys,
Barrie South SmartCentre Barrie, ON 93.6 409,884 243,629 - Winners, La-Z-Boy, PetSmart,
Stitches, Dollar Tree
Walmart Supercentre, LCBO,
Bolton SmartCentre Bolton, ON 99.2 242,444 161,864 -
Mark's, The Beer Store, Reitmans
Walmart Supercentre, Home
Bracebridge SmartCentre Bracebridge, ON 100.0 142,501 115,779 90,000 Depot*, Dollar Tree, Boston Pizza,
Bulk Barn
S M A R T R E A L E S TAT E I N V E S T M E N T T R U S T
M A R C H 2 0 1 7 S U P P L E M E N TA L I N F O R M AT I O N PA C K A G E 21Individual Property Summary
Owned Rentable Owned Rentable Non-Owned
Property Location Occupancy Area Anchor Area (1) Anchor Area (1) Anchors and Major Tenants
(%) (sq. ft.) (sq. ft.) (sq. ft.)
Walmart Supercentre, GoodLife
Bradford SmartCentre Bradford, ON 100.0 241,701 168,571 - Fitness, Dollarama, Bulk Barn,
CIBC, RBC
LA Fitness, Value Village, LCBO,
Bramport SmartCentre Brampton, ON 100.0 153,237 45,877 37,082 Dollarama, Swiss Chalet, CIBC,
Bank of Montreal
Bramport SmartCentre (II) Brampton, ON 100.0 37,857 37,857 - No Frills
Walmart Supercentre, The Brick,
Brampton East SmartCentre Brampton, ON 99.4 360,695 243,610 - Winners, Staples, Mark's, Carter's
OshKosh, Sleep Country
Fortinos*, Shoppers Drug Mart,
Brampton North
Brampton, ON 83.4 58,794 - 62,496 RBC, Synergy Performing Arts
SmartCentre
Academy
Walmart Supercentre, LCBO,
Brampton Northeast
Brampton, ON 100.0 227,242 153,455 - Dollarama, CIBC, Bank of Nova
SmartCentre
Scotia, RBC
Walmart Supercentre*, Real
Brockville SmartCentre Brockville, ON 100.0 144,084 - 322,054 Canadian Superstore*, Home
Depot*, Winners, Michaels, LCBO
Toys R Us, LA Fitness, Shoppers
Burlington (Appleby)
Burlington, ON 100.0 151,115 100,646 - Drug Mart, Golf Town, Bank of
SmartCentre
Montreal
Walmart Supercentre, Dollar Tree,
Burlington North
Burlington, ON 100.0 226,451 161,127 - Reitmans, Moores, Bank of Nova
SmartCentre
Scotia
Walmart Supercentre, RONA, LA
Cambridge SmartCentre (I) Cambridge, ON 96.3 738,034 323,394 - Fitness, Best Buy, Staples, Bed
Bath & Beyond, Michaels
Canadian Tire*, Home Depot*,
Cambridge SmartCentre (II) Cambridge, ON 53.4 23,938 - 224,695 2001 Audio Video, Henry's
Photography
Walmart Supercentre, Dollarama,
Carleton Place SmartCentre Carleton Place, ON 100.0 148,885 115,811 -
Mark's, Bulk Barn
Walmart Supercentre, Real
Canadian Superstore*, Winners,
Chatham SmartCentre** Chatham, ON 98.4 154,545 101,053 91,275
Mark's, PetSmart, Dollarama,
LCBO
Walmart Supercentre, Home
Cobourg SmartCentre Cobourg, ON 97.9 197,935 142,634 85,433 Depot*, Winners, Dollar Tree,
Swiss Chalet
Cornwall SmartCentre Cornwall, ON 100.0 165,954 154,510 - Walmart Supercentre, Dollar Tree
S M A R T R E A L E S TAT E I N V E S T M E N T T R U S T
M A R C H 2 0 1 7 S U P P L E M E N TA L I N F O R M AT I O N PA C K A G E 22Individual Property Summary
Owned Rentable Owned Rentable Non-Owned
Property Location Occupancy Area Anchor Area (1) Anchor Area (1) Anchors and Major Tenants
(%) (sq. ft.) (sq. ft.) (sq. ft.)
Home Depot*, Winners, Sobeys,
Leaside SmartCentre East York, ON 95.4 258,136 108,632 113,000 Sport Chek, Best Buy, LCBO, Golf
Town, RBC
Etobicoke (Index) Sail, Marshalls, PetSmart, Party
Etobicoke, ON 100.0 188,059 107,838 -
SmartCentre Packagers, Structube, Bouclair
Walmart Supercentre, Home
Etobicoke SmartCentre Etobicoke, ON 100.0 294,734 199,824 135,000 Depot*, Best Buy, Old Navy,
Mark's, Urban Barn
Walmart Supercentre*, Dollarama,
Rexdale SmartCentre Etobicoke, ON 100.0 35,174 - 126,083
Bank of Nova Scotia
Walmart Supercentre*, No Frills*,
Fort Erie SmartCentre Fort Erie, ON 100.0 12,738 - 140,142
LCBO, Bank of Nova Scotia
Walmart Supercentre, Home
Guelph SmartCentre Guelph, ON 99.5 296,116 171,396 110,000 Depot*, HomeSense, Michaels,
Dollarama, CIBC, RBC
Saks Fifth Avenue OFF 5TH, Polo
Toronto Premium Outlets** Halton Hills, ON 100.0 179,333 - - Ralph Lauren, Restoration
Hardware, Nike, Columbia, Coach
Walmart Supercentre, Shoppers
Hamilton South
Hamilton, ON 99.1 239,519 124,524 - Drug Mart, LCBO, Dollarama, The
SmartCentre
Beer Store, CIBC
Walmart Supercentre, Your
Huntsville SmartCentre Huntsville, ON 100.0 126,436 84,861 68,837 Independent Grocer*, Dollar Tree,
Mark's, Reitmans
Walmart Supercentre, Dollarama,
Kanata SmartCentre Kanata, ON 99.2 201,548 155,739 -
Bulk Barn, CIBC, RBC
RONA*, Zehrs*, Home Outfitters,
Laurentian Power Centre Kitchener, ON 100.0 69,223 34,023 220,978
Staples, CIBC
Walmart Supercentre, Toys R Us,
London East Argyle Mall London, ON 98.4 424,986 224,281 - No Frills, Winners, Staples, Sport
Chek, GoodLife Fitness
Walmart Supercentre, Canadian
London North
London, ON 97.8 250,118 131,671 108,262 Tire*, Winners, Sport Chek,
SmartCentre**
HomeSense, Old Navy, LCBO
Lowe's*, Boston Pizza, Montana's,
London Northwest
London, ON 88.1 36,214 - 137,316 Bank of Montreal, TD Canada
SmartCentre
Trust, RBC
Markham East Walmart Supercentre, Dollar Tree,
Markham, ON 100.0 69,008 61,207 -
SmartCentre** CIBC
S M A R T R E A L E S TAT E I N V E S T M E N T T R U S T
M A R C H 2 0 1 7 S U P P L E M E N TA L I N F O R M AT I O N PA C K A G E 23Individual Property Summary
Owned Rentable Owned Rentable Non-Owned
Property Location Occupancy Area Anchor Area (1) Anchor Area (1) Anchors and Major Tenants
(%) (sq. ft.) (sq. ft.) (sq. ft.)
Home Depot, Longo's*, Winners,
Markham Woodside
Markham, ON 98.6 179,950 80,385 - Staples, Chapters, Michaels, La-Z-
SmartCentre**
Boy, LCBO
Walmart Supercentre*, Canadian
Milton Walmart Centre** Milton, ON 94.1 116,602 - 227,896 Tire*, Sport Chek, Indigo,
Michaels, Mark's, Staples, RBC
Walmart Supercentre, No Frills,
Mississauga (Erin Mills)
Mississauga, ON 97.0 287,034 171,973 - GoodLife Fitness, Shoppers Drug
SmartCentre
Mart, Dollarama
Real Canadian Superstore*, Toys
Mississauga (Go Lands)
Mississauga, ON 100.0 113,005 50,696 115,000 R Us, Marshalls, Dollarama, TD
SmartCentre
Canada Trust
Walmart Supercentre, RONA,
Mississauga (Meadowvale)
Mississauga, ON 99.8 557,902 325,691 - Home Outfitters, Winners, Staples,
SmartCentre
Michaels, Mark's, PetSmart
Walmart Supercentre, PetSmart,
Niagara Falls SmartCentre Niagara Falls, ON 100.0 249,745 183,698 - Penningtons, Dollarama, LCBO,
Bulk Barn, Sleep Country
Real Canadian Superstore*,
401 & Weston Power
North York, ON 99.2 128,991 74,712 180,000 Canadian Tire, The Brick, Home
Centre**
Outfitters, Best Buy, LCBO
Walmart Supercentre, Real
Oakville SmartCentre Oakville, ON 99.0 461,226 314,588 - Canadian Superstore, LCBO, The
Beer Store, The Keg, CIBC, RBC
Metro, Shoppers Drug Mart, LCBO,
South Oakville Centre Oakville, ON 98.5 188,337 41,289 - The Beer Store, CIBC, TD Canada
Trust
Walmart Supercentre, Canadian
Orleans SmartCentre (I) Orleans, ON 95.8 384,015 232,635 117,136 Tire*, Home Outfitters, Best Buy,
Shoppers Drug Mart
Walmart Supercentre, Real
Canadian Superstore, Home
Oshawa North SmartCentre Oshawa, ON 99.6 558,157 341,156 116,348
Depot*, Marshalls, Sport Chek,
Best Buy, Michaels
Home Outfitters, Winners,
Oshawa North SmartCentre
Oshawa, ON 100.0 163,259 34,109 - PetSmart, Party Packagers,
(II)
Boston Pizza, TD Canada Trust
Walmart Supercentre, Lowe's, Sail,
Oshawa South SmartCentre Oshawa, ON 100.0 536,707 430,536 - Dollarama, Urban Barn, Moores,
Reitmans, CIBC, RBC
Ottawa (Laurentian Place) Walmart Supercentre, Stantec,
Ottawa, ON 100.0 127,585 112,391 -
SmartCentre** CIBC
Walmart Supercentre, Loblaws,
Ottawa South
Ottawa, ON 96.3 261,551 156,471 - Cineplex Odeon, Winners, Staples,
SmartCentre**
Chapters
S M A R T R E A L E S TAT E I N V E S T M E N T T R U S T
M A R C H 2 0 1 7 S U P P L E M E N TA L I N F O R M AT I O N PA C K A G E 24Individual Property Summary
Owned Rentable Owned Rentable Non-Owned
Property Location Occupancy Area Anchor Area (1) Anchor Area (1) Anchors and Major Tenants
(%) (sq. ft.) (sq. ft.) (sq. ft.)
Walmart Supercentre, Home
Owen Sound SmartCentre Owen Sound, ON 100.0 158,074 105,963 130,000 Depot*, Penningtons, Dollarama,
Carter's OshKosh, Reitmans
Walmart Supercentre, Lowe's,
Pickering SmartCentre Pickering, ON 96.1 546,194 393,572 82,000 Sobeys, Canadian Tire*, Toys R
Us, Winners, PetSmart, LCBO
Port Elgin SmartCentre Port Elgin, ON 100.0 115,524 115,524 - Walmart Supercentre
Walmart Supercentre, LCBO,
Port Perry SmartCentre Port Perry, ON 100.0 138,789 92,473 - Mark's, Dollarama, Bulk Barn,
Bank of Nova Scotia
Walmart Supercentre, Food
Richmond Hill
Richmond Hill, ON 97.8 136,306 94,458 - Basics, Shoppers Drug Mart,
SmartCentre**
HSBC, Bank of Montreal
Walmart Supercentre, Winners,
Sarnia SmartCentre Sarnia, ON 99.4 342,617 214,513 - Michaels, PetSmart, LCBO,
Penningtons, Dollarama
Walmart Supercentre, Winners,
Scarborough (1900
Scarborough, ON 99.2 380,090 254,693 - Mark's, LCBO, David's Bridal, Bank
Eglinton) SmartCentre
of Montreal
Walmart Supercentre, Cineplex
Scarborough East
Scarborough, ON 100.0 282,156 225,385 - Odeon, LCBO, Reitmans, Boston
SmartCentre
Pizza, Sleep Country
Walmart Supercentre, Real
St. Catharines West
St. Catharines, ON 98.6 370,106 230,513 182,132 Canadian Superstore*, Canadian
SmartCentre (I)
Tire*, Home Outfitters, Best Buy
St. Catharines West The Brick, Michaels, Shoppers
St. Catharines, ON 94.8 120,438 35,108 -
SmartCentre (II) Drug Mart, Golf Town, Bouclair
Walmart Supercentre, Real
St. Thomas SmartCentre St. Thomas, ON 92.6 224,382 138,567 196,212 Canadian Superstore*, Canadian
Tire*, Staples, Dollar Tree
Food Basics, JYSK, King's Buffet,
Centennial Parkway Plaza Stoney Creek, ON 91.5 133,748 39,271 -
Salvation Army Thrift Store
Walmart Supercentre, Toys R Us,
Stoney Creek SmartCentre Stoney Creek, ON 99.0 257,064 228,795 -
Dollar Tree
Walmart Supercentre*, Canadian
Stouffville SmartCentre Stouffville, ON 100.0 162,968 69,283 162,633 Tire, Winners, Staples, Dollarama,
Bouclair, Bulk Barn
Walmart Supercentre, LCBO,
Sudbury South SmartCentre Sudbury, ON 100.0 233,046 183,708 -
Mark's, Dollarama, Bouclair
S M A R T R E A L E S TAT E I N V E S T M E N T T R U S T
M A R C H 2 0 1 7 S U P P L E M E N TA L I N F O R M AT I O N PA C K A G E 25Individual Property Summary
Owned Rentable Owned Rentable Non-Owned
Property Location Occupancy Area Anchor Area (1) Anchor Area (1) Anchors and Major Tenants
(%) (sq. ft.) (sq. ft.) (sq. ft.)
Toronto Stockyards Walmart Supercentre*, Bank of
Toronto, ON 100.0 8,615 - 128,194
SmartCentre Montreal, CitiFinancial
Canadian Tire, FreshCo., Dollar
Westside Mall Toronto, ON 95.0 144,405 110,019 -
Tree, Rogers, CIBC
Rutherford Village Shopping Sobeys, TD Canada Trust, Rogers
Vaughan, ON 95.5 104,307 48,890 -
Centre Video, Tim Hortons
Sail, The Brick, Home Depot*,
Vaughan (400 & 7)
Vaughan, ON 100.0 229,557 124,989 100,000 Staples, Value Village, GoodLife
SmartCentre
Fitness
Vaughan Northwest
Vaughan, ON 100.0 164,298 128,791 - Walmart Supercentre, CIBC
SmartCentre
Walmart Supercentre, Value
Waterloo SmartCentre Waterloo, ON 100.0 181,623 128,005 -
Village, Mark's, Dollarama
Walmart Supercentre, Canadian
Welland SmartCentre Welland, ON 100.0 240,663 221,327 100,667
Tire*, RONA, Mark's, Dollar Tree
Walmart Supercentre, Real
Whitby North SmartCentre Whitby, ON 97.5 279,153 178,841 148,571 Canadian Superstore*, Mark's,
LCBO, Bank of Nova Scotia
Whitby Northeast Boston Pizza, Swiss Chalet,
Whitby, ON 97.5 39,249 - -
SmartCentre Popeyes, Bell World, RBC
Metro, LCBO, Bank of Nova
Whitby Shores Shopping
Whitby, ON 100.0 85,470 39,919 - Scotia, Lovell Drugs, Pet Valu, Tim
Centre
Hortons
Walmart Supercentre, Part Source,
Windsor South SmartCentre Windsor, ON 95.4 231,402 129,121 - Dollarama, PetSmart, Moores, The
Beer Store, CIBC
Canadian Tire*, Fortinos*,
Woodbridge SmartCentre** Woodbridge, ON 96.8 216,983 32,630 142,073 Winners, Best Buy, Toys R Us,
Chapters, Michaels, Sport Chek
Walmart Supercentre, Canadian
Woodstock SmartCentre Woodstock, ON 97.9 257,220 170,764 91,254 Tire*, Staples, Mark's, Carter's
OshKosh, Reitmans, Dollar Tree
Subtotal Ontario 98.2 18,167,278 10,881,907 4,448,160
S M A R T R E A L E S TAT E I N V E S T M E N T T R U S T
M A R C H 2 0 1 7 S U P P L E M E N TA L I N F O R M AT I O N PA C K A G E 26Individual Property Summary
Owned Rentable Owned Rentable Non-Owned
Property Location Occupancy Area Anchor Area (1) Anchor Area (1) Anchors and Major Tenants
(%) (sq. ft.) (sq. ft.) (sq. ft.)
Quebec
Walmart Supercentre, Winners,
Blainville SmartCentre Blainville, QC 100.0 197,812 131,537 - Dollarama, Bulk Barn, Bank of
Nova Scotia, RBC
Walmart Supercentre, Loblaws*,
Hull SmartCentre** Hull, QC 97.6 161,239 80,824 326,717 RONA*, Famous Players*, Super
C*, Winners, Staples
Kirkland SmartCentre Kirkland, QC 100.0 207,216 202,271 - Walmart Supercentre, The Brick
Walmart Supercentre,
Lachenaie SmartCentre** Lachenaie, QC 100.0 141,292 78,432 - HomeSense, Value Village,
Michaels, SAQ, Bouclair, Structube
Laval Centre Laval, QC 100.0 159,779 159,779 130,000 Walmart Supercentre, Leon's*
Walmart Supercentre, Canadian
Laval East SmartCentre Laval, QC 98.0 540,056 340,736 - Tire, IGA, Winners, Michaels,
Bouclair, Dollarama, SAQ
Walmart Supercentre, RONA,
Laval West SmartCentre Laval, QC 91.2 586,201 314,461 124,000 Canadian Tire*, IGA*, Michaels,
Staples
Mascouche North RONA*, Jean Coutu, Structube,
Mascouche, QC 97.4 59,228 - 120,000
SmartCentre SAQ, McDonald's, Bulk Barn
Walmart Supercentre, IGA, Home
Mascouche SmartCentre Mascouche, QC 97.7 407,799 261,834 - Outfitters, Winners, Staples, Best
Buy, Bouclair, Mark's
The Bay Outlet, Polo Ralph
Montreal Premium Outlets** Mirabel, QC 97.8 182,975 - - Lauren, Old Navy, Nike, Urban
Planet, Tommy Hilfiger, Coach
Walmart, Toys R Us, Baton Rouge,
Montreal (Decarie)
Montreal, QC 100.0 132,434 83,858 - Suzy Shier, P.F. Chang's, Bulk
SmartCentre**
Barn, Carter's OshKosh
Walmart Supercentre, IGA,
Montreal North SmartCentre Montreal, QC 98.8 267,713 173,668 - Winners, Dollarama, Le Chateau,
Sleep Country, TD Canada Trust
Canadian Tire, Super C,
Place Bourassa Mall Montreal, QC 96.5 219,748 130,323 - Pharmaprix, L'Aubainerie, SAQ,
Yellow
Walmart Supercentre, Home
Pointe Claire SmartCentre Pointe Claire, QC 97.5 381,966 234,402 - Depot, Marks, Dollarama, Baron
Sports, Pier 1 Imports
Walmart Supercentre, Tanguay*,
Rimouski SmartCentre Rimouski, QC 100.0 243,740 127,087 104,973 Super C*, Winners, Best Buy,
SAQ, Dollarama, Clement, Scores
S M A R T R E A L E S TAT E I N V E S T M E N T T R U S T
M A R C H 2 0 1 7 S U P P L E M E N TA L I N F O R M AT I O N PA C K A G E 27You can also read