RESEARCH TREND VISUALIZATION BY MESH TERMS FROM PUBMED - MDPI
←
→
Page content transcription
If your browser does not render page correctly, please read the page content below
International Journal of
           Environmental Research
           and Public Health

Article
Research Trend Visualization by MeSH Terms
from PubMed
Heyoung Yang * and Hyuck Jai Lee
 Kore Institute of Science and Technology Information, 66, Hoegi-ro, Dongdaemun-gu, Seoul 02456, Korea;
 hlee@kisti.re.kr
 * Correspondence: hyyang@kisti.re.kr; Tel.: +82-2-3299-6069

 Received: 17 April 2018; Accepted: 29 May 2018; Published: 30 May 2018

 Abstract: Motivation: PubMed is a primary source of biomedical information comprising search
 tool function and the biomedical literature from MEDLINE which is the US National Library of
 Medicine premier bibliographic database, life science journals and online books. Complimentary
 tools to PubMed have been developed to help the users search for literature and acquire knowledge.
 However, these tools are insufficient to overcome the difficulties of the users due to the proliferation
 of biomedical literature. A new method is needed for searching the knowledge in biomedical
 field. Methods: A new method is proposed in this study for visualizing the recent research trends
 based on the retrieved documents corresponding to a search query given by the user. The Medical
 Subject Headings (MeSH) are used as the primary analytical element. MeSH terms are extracted
 from the literature and the correlations between them are calculated. A MeSH network, called
 MeSH Net, is generated as the final result based on the Pathfinder Network algorithm. Results:
 A case study for the verification of proposed method was carried out on a research area defined
 by the search query (immunotherapy and cancer and “tumor microenvironment”). The MeSH Net
 generated by the method is in good agreement with the actual research activities in the research
 area (immunotherapy). Conclusion: A prototype application generating MeSH Net was developed.
 The application, which could be used as a “guide map for travelers”, allows the users to quickly
 and easily acquire the knowledge of research trends. Combination of PubMed and MeSH Net is
 expected to be an effective complementary system for the researchers in biomedical field experiencing
 difficulties with search and information analysis.

 Keywords: PubMed; medical subject headings; keyword network; MeSH correlations; MeSH Net

1. Introduction
     The size of the literature in biomedical domain grows exponentially [1]. Some of the reasons
for the growth are the ease of the Internet access, breakdown of interdisciplinary boundaries due to
genome-scale instruments, and increasingly interdisciplinary nature of research and development [1–3].
Professionals such as researchers and educators experience difficulties keeping abreast of the literature
in their research areas because of the massive amount of literature [4].
     PubMed, provided by the National Center for Biotechnology Information (NCBI), has served
as the primary information source based on search tool and the literature in biomedical domain.
As of 2017, PubMed comprises more than 27 million publications in the broad and up-to-date sources
such as biomedical literature from MEDLINE, life science journals, and online books according to
the website (https://www.ncbi.nlm.nih.gov/pubmed/). The total number of publications indexed
by PubMed is continuously on the rise; the annual average growth rate was reported to be 4% [2].
Owing to the ever-growing size of the literature in PubMed, users often confront with long lists of
search results, which make it challenging to find the information and knowledge they want.

Int. J. Environ. Res. Public Health 2018, 15, 1113; doi:10.3390/ijerph15061113   www.mdpi.com/journal/ijerph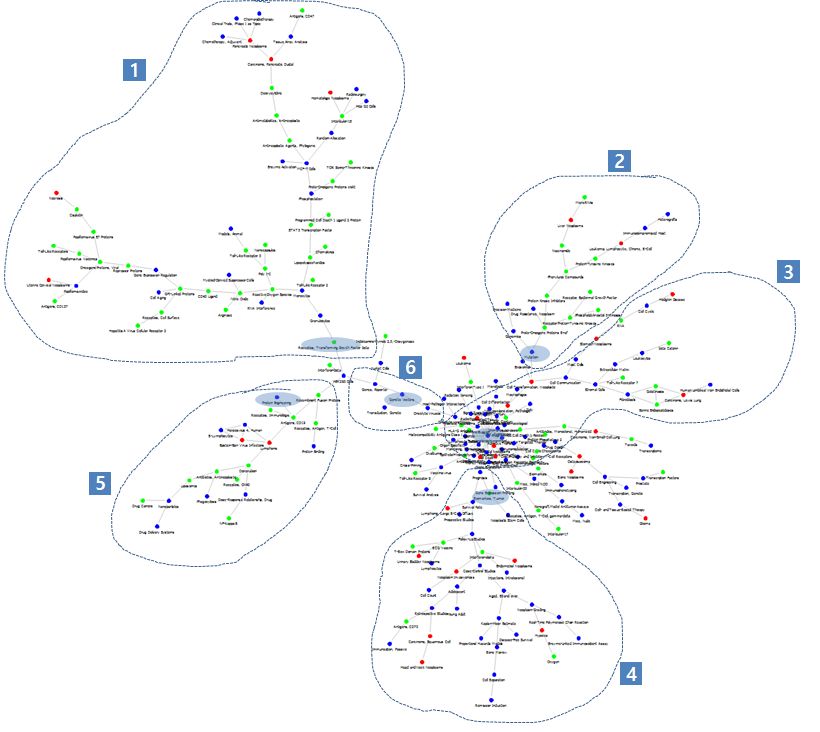
Int. J. Environ. Res. Public Health 2018, 15, 1113                                                    2 of 14

      To overcome this difficulty, PubMed complementary tools, often called “PubMed derivatives”,
have been developed. Lu (2011) [2] and NCBI (2012) [5] surveyed “PubMed derivatives” and typified
the characteristics of each. They showed 37 tools and categorized those into five groups: ranking search
results, clustering results into topics, extracting and displaying semantics and relations, improving
search interface and retrieval experience [2,5]. Most of these tools provide search results in the format
of “publication list”. A few give the result in “graph” or “wordcloud”. Besides the tools mentioned
above, other tools were also developed: MeSHmap [3], MeSHy [6] and Meshable [7]. These give
the search result in the list of keywords and the list of keyword categories, the list of keyword pairs,
and keyword list interacting with search results pages, respectively.
      The development history of PubMed derivatives spans from 2001 to 2016. A long history of
development reflects various user needs on the one hand. On the other hand, it could also mean that
there has not been a “killer application” as if Google made many services extinct since its appearance
in the web search market. Another implication can be found from the current operability of the tools.
We checked the current status of the aforementioned tools, only 18 of them were found to be currently
operable considering some of the commercial services operable by the existence of their website.
Maintenance of the tools is another important issue regarding the validity of tools. The last update of
the 18 operable tools goes back several years, which indicates that the maintenance is not supported
by the developers anymore. The links to their websites provided by NCBI seem to be broken and the
latest information on them cannot be found on the Internet.
      The current status of the PubMed derivatives reflects that they did not gain much popularity
from the users; PubMed users do not seem to be fully satisfied with these derivatives in other words.
The reason for this dissatisfaction could be attributed to two facts: the format and insufficient utility
of the output. Many of the PubMed derivatives give the output in the format of “publication list”.
When a user is given a long list of publications from the tool, the user will have to use a line-by-line
approach to find a specific publication or to extract knowledge from the list depending on the purpose
of the search. Even though the tools use different ranking algorithms, and hence the order of the articles
in the list is different, from that of PubMed, the user’s task remains basically the same. It should also be
noted that the utility of the tools’ outputs may not be sufficient. Even though many of the tools provide
statistical analysis and clustering (or grouping) results in addition to the simple list, they may not be
able to give the users much more benefits than PubMed because PubMed also provides analytical
features such as yearly statistics with several kinds of filters. Hence, the users would not choose the
“new tools” at the expense of the effort learning how to use them unless they provide more benefits
than the already accustomed tool, PubMed, does.
      The very basic function of PubMed is to provide the list of publications corresponding to a user’s
search query defining a research area (or a research topic). The user reviews the list in a line-by-line
approach to acquire the knowledge structure of the research area. The overall knowledge structure of
the research area is built by combining every bit of knowledge. This is often referred to as a cognitive
process. If the search result is given as a science map, which is one of the information visualization
techniques intended to provide a geography of a research area so that the search and retrieval of
desired information out of large collection of information can be carried out via a user-friendly
way, an intuitive process so to speak, it could be a good PubMed derivative. [8]. A good PubMed
derivative is also required to selectively deliver information on emerging research areas needed by
researchers. This requires the removal of information that is not part of the emerging research area, i.e.,
noise removal.
      We have studied how to generate essence of knowledge structure by applying Social Network
Analysis (SNA) to PubMed literature. SNA started from sociometric analysis and Graph Theory,
and was applied to a wide range of social phenomena, psychology, and economics, and recently its
use has expanded to include research into the characteristics very complex networks in neurobiology,
statistical physics, etc. [9–11]. Otte and Rousseau (2002) [12] stated that SNA is more a strategy to
provide a viewpoint to explore the structure of social networks, rather than a methodology used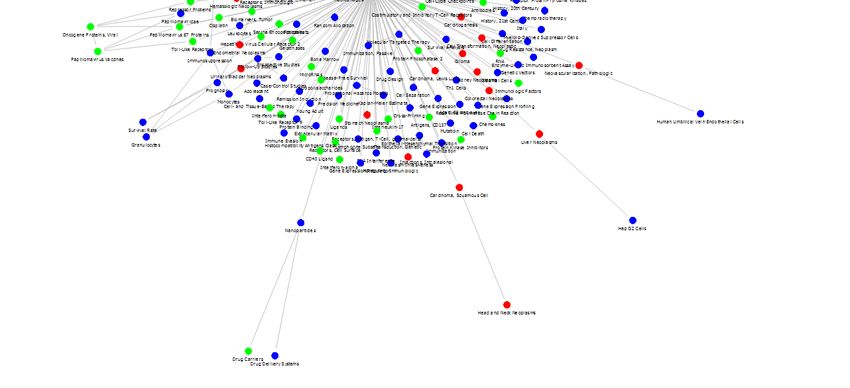
Int. J. Environ. Res. Public Health 2018, 15, 1113                                                 3 of 14

in a specific field, and explained some examples in the information science. SNA is applied to not
only the analysis of relationship between people, institutions and journals, but also the analysis of
relationship between keywords [13,14]. We noted the relationship of medical keywords in the PubMed
literature. To understand the latest research trends, it is necessary to analyze which medical keywords
are emerging, but the keyword alone is not enough to explain the research topic. Knowing how
the keywords are related to each other and how they are connected helps better understand the
research topic. We studied a methodology to visualize a social network composed of emerging medical
keywords in PubMed literature, and introduced an application using this method.
      A prototype application is proposed in this paper as a new PubMed derivative including a new
method for research trend visualization of a specific research topic. The application starts in quite
a similar way to the conventional PubMed search. The user simply enters a search query, and then
the application retrieves corresponding publications from PubMed using the Entrez Programming
Utility, an API provided by NCBI. Based on the bibliography of the publications, the research trend
is visualized by the method proposed in this study. In the following sections of this article, a review
is given on selected PubMed derivatives providing the output in a format other than “publication
list”, that is, a graph of keyword relation, etc., to help the users acquire the knowledge structure of a
specified research area. Then, the research visualization process proposed is given. A research area
defined by the search query (immunotherapy and cancer and “tumor microenvironment”) is applied
to our process as a case study. The query is a simple sequence of typical keywords in the research area,
which is composed without any “tuning” by the field experts or analysts. In the final section of this
article, the implication, possible applications, limitations of the proposed process and the future plan
are mentioned.

2. Review for Selected PubMed Derivatives

2.1. GoPubMed
     GoPubMed [15] utilizes Gene Ontology (GO) terms, which are structured, controlled vocabularies
and classifications for the annotation of genes, gene products and sequences [16]. GO terms are
comprised of over 19,000 terms organized in three sub-ontologies for cellular location, molecular
function and biological process. GoPubMed extracts GO terms from the abstracts of the publications
in PubMed search result, and groups the publications according to the GO terms. The users are given
the PubMed search result as a list in which the publications are categorized according to the GO
terms. Such a grouping can provide the users an easy way to identify publications with research theme
(or concept), and the search can be refined using the sub-theme. The original version of GoPubMed
provided the hierarchy of GO terms, which is not available in the current version. Instead, the current
version provides Medical Subject Heading (MeSH) terms together with the GO terms. These terms are
referred to as “concepts” in GoPubMed, where the details are available at http://help.gopubmed.com/.
The advantage of GoPubMed is that the users can overview the search result more easily by using
the “concepts”. However, GoPubMed provides the concepts as a list without giving any relationship
between them, and hence the users have to go line-by-line to find the knowledge structure.

2.2. Semantic MEDLINE
     Semantic MEDLINE [17] is a web application using two existing tools: SemRep [18] based
on Unified Medical Language System (UMLS) [19] and automatic summarizer [20]. SemRep is a
general knowledge-based semantic interpreter, based on Unified Medical Language System (UMLS).
Semantic MEDLINE extracts predications based on UMLS concepts from the publications in the
PubMed search result. The list of predications is entered into the automatic summarizer and then
assorted to the list of semantic condensate (list of UMLS concepts), which is provided to the users.
In other words, each publication in the PubMed search result is matched with UMLS concept.
This matching is carried out in sentence-based way, and hence multiple UMLS concepts are matched to
Int. J. Environ. Res. Public Health 2018, 15, 1113 4 of 14
a single publication. Semantic MEDLINE, as a result, gives lists of multiple interlinked UMLS concepts
per publication. When the user clicks one UMLS concept, Semantic UMLS shows the elements that
comprises the UMLS and their relationships in graphical way. The user can understand the knowledge
structure from the UMLS concept and can find the publication. The advantage of Semantic MEDLINE
is the easy literature search and knowledge exploration by the summarization of semantic condensate
of biomedical information. Because the SemRep process, extracting the UMLS concepts from the
publications, is a slow process, it is carried out in off-line and the predications extracted are stored in a
separate database. This could yield the problem such that the result may not be up-to-date and the
knowledge structure not pre-defined in UMLS cannot be found.
2.3. MeSHy
Most of the previous PubMed derivatives deal with the occurrence (or simple count)-based
statistical information. Theodosiou et al. pointed that the tools for discovering unusual and
unanticipated information have never been developed, and proposed MeSHy based on the statistical
characteristics of co-occurrence of MeSH term pairs [6]. MeSHy calculates the score of MeSH term
pairs, which is a kind of relationship between the probabilities of MeSH term pairs. Each of the MeSH
terms is extracted from the publications in the PubMed search result and its probability within the
body of the search result is calculated from its occurrence count. Comparing the score of MeSH term
pairs with the probability of co-occurrence MeSH term pairs could provide unanticipated MeSH term
pairs in statistical point of view. MeSHy then provides the list of MeSH term pairs sorted by the
score accompanied by popularity (or rareness) of each MeSH. Links to the publications where each
of the MeSH term pair occurs are provided as well. MeSHy is specifically designed to provide the
unanticipated knowledge domains that might have implications to the users so that they can explore
the novel and promising research areas. Even though this does not fit the purpose of looking at the
whole when general researchers explore the domain of knowledge, this can be helpful in terms of
finding research ideas that come to the researchers as serendipity.
3. Methodology
This study aimed to propose a new method for generating the most recent knowledge structure
of a research area which is defined by a user’s search query to PubMed. The output format is to be in
a visualized manner not a simple list of search result, more specifically a network graph consisting of
biomedical terms, because the former is a more appropriate way in assisting the users with exploring
the knowledge structure intuitively. Providing the most up-to-date information is crucial, and hence
the method will gather bibliographic information from PubMed every time the user specifies a search
query. The primary biomedical terms to be analyzed are MeSH, and the reason for selecting MeSH
is given in the following section together with the detailed process on preparing the dataset and
generating the MeSH network.
3.1. About MeSH
Medical Subject Headings (MeSH) is a controlled vocabulary thesaurus provided by US National
Library of Medicine (NLM). MeSH consists of sets of biomedical terms in a hierarchical structure
helping the literature search at various levels of biomedical domains. According to the 2017 MeSH
data file, which is available at NLM’s web page (https://www.nlm.nih.gov/mesh/filelist.html),
MeSH consists of about 57,800 biomedical terms for MeSH Descriptors (Main Headings) and 82
Qualifiers (Subheadings), where the former is used to index publications in MEDLINE for topical
headings and the latter to confine the subject to a particular aspect of Main Headings. Both terms are
searchable in PubMed, and updated by NLM on an annual basis. In general, the publication indexed
by PubMed contains several lines of MeSH terms, each of which is in the format of combining one Main
Heading and one or multiple Qualifiers. MeSH can be used without additional cleansing, while the
conventional keywords, such as author keywords, requires massive amount of cleansing for properInt. J. Environ. Res. Public Health 2018, 15, 1113 5 of 14
Int. J. Environ. Res. Public Health 2018, 15, x FOR PEER REVIEW 5 of 14
valuable
usage. Formaterial for identifying
these reasons, MeSH is aresearch
valuable trend from
material for biomedical publications,
identifying research trend and
fromused as the
biomedical
primary biomedical
publications, terms
and used forprimary
as the the method proposed
biomedical in this
terms for study.
the method proposed in this study.
3.2.
3.2. MeSH
MeSH Dataset
Dataset
Every
Every publication
publication indexed
indexed in in the
the MEDLINE database which
MEDLINE database which is is primary
primary component
component of of PubMed
PubMed
literature
literature has at least one, very often multiple, MeSH terms. Collecting all the MeSH terms in in
has at least one, very often multiple, MeSH terms. Collecting all the MeSH terms a set
a set of
of publications
publications corresponding
corresponding to to
a asearch
searchquery
querytotoPubMed
PubMedmay may generate
generate “information
“information overload”
overload”
depending
depending on on thethe size
size of
of the
the set.
set. Therefore,
Therefore, selecting
selecting only
only the
the MeSH
MeSH terms
terms which
which are
are considered
considered
“noteworthy”
“noteworthy” is is aa key
keytotosuccessful
successfulanalysis
analysis and
and identifying
identifying thethe knowledge
knowledge structure
structure in them.
in them. The
The application
application proposed
proposed in this
in this study
study includes
includes several
several steps
steps forfor thispurpose,
this purpose,asasshown
shownin in Figure
Figure 1.1.
Since this application focuses on the most recent knowledge structure of a research
Since this application focuses on the most recent knowledge structure of a research field, the final field, the final
MeSH terms are collected from the publications of the most recent three years years (time period is an
adjustable variable in the application). The following section gives
adjustable variable in the application). The following section gives the detailedthe detailed information
informationononeach of
each
the steps mentioned above.
of the steps mentioned above.
Figure 1.
Figure 1. Flowchart
Flowchart for
for MeSH
MeSH term
term dataset
dataset preparation.
preparation.
3.2.1. PubMed
3.2.1. PubMed Search
Search and
and Initial
Initial MeSH
MeSH Terms
Terms
Using the
Using the Entrez
Entrez Programming
Programming UtilityUtility provided
provided by by NCBI,
NCBI, aa search
search query
query (immunotherapy
(immunotherapy and and
cancer and “tumor microenvironment”) is submitted to PubMed and
cancer and “tumor microenvironment”) is submitted to PubMed and corresponding publications corresponding publications are
collected
are for the
collected for case study
the case on the
study on research
the research area.area.
Preparation
Preparationof theofinitial MeSH
the initial termsterms
MeSH startsstarts
from
defining the lifetime of the research area using the annual publication
from defining the lifetime of the research area using the annual publication count. The most recent count. The most recent
calendar year
calendar yearin inthe
thepublication
publicationset setisisset
settotoY Ylastwhile
whilethetherolling
rollingyear
year
cancan also
also bebeusedused alternatively
alternatively to
last
to emphasize the recent publications in the set. Every three-year period starting
emphasize the recent publications in the set. Every three-year period starting from Ylast backwards is from Y last backwards
is grouped
grouped to form
to form TimeTime Periods,
Periods, andandonlyonlythosethose
withwith the annual
the annual average
average publication
publication countcountgreatergreater
than
than 10 are selected, which is because we think that the average publication
10 are selected, which is because we think that the average publication count should be at least count should be at least
10,
10, indicating that research has begun in the field. Each of the Time Periods
indicating that research has begun in the field. Each of the Time Periods is given as T1 , . . . TN , where is given as T1, … TN,
where
N is theNtotal
is the totalofcount
count of the
the Time Time Periods.
Periods. All theterms
All the MeSH MeSHare terms are extracted
extracted from each from each Periods
of Time of Time
Periods
and theyand
arethey are referred
referred to as thetoinitial
as theMeSHinitial terms.
MeSH The terms. The occurrence
occurrence count of count of initial
initial MeSHMeSH term M term
i is
M i is measured for each of Time Periods, and given as ( )
measured for each of Time Periods, and given as C ( M ) , C ( M ) , . . . C ( M ) . , ( ) , … ( ) .
i T1 i T2 i TNInt. J. Environ. Res. Public Health 2018, 15, 1113 6 of 14
3.2.2. Removal of Routine MeSH Terms
Some of the MeSH terms must be removed from the initial MeSH term set to prepare the
“noteworthy” MeSH terms. The first type of MeSH terms to be considered is the “Routine MeSH
terms” which appear dominantly throughout the lifetime of the research area because it is so broad
and routine. The term “Cancer” is a good example of the Routine MeSH term in the research field
“Targeted Therapy for Cancer”. Most publications in this area contain the term Cancer, which cannot
attract the professionals in this area. The professionals would be more interested in new emerging
terms with small frequencies rather than Routine MeSH terms with large frequencies. Moreover,
it could bring a serious bias, acting as a “strong hub”, to the MeSH term network, especially when the
correlations between the terms are measured on occurrence count basis (see Section 3.2.3 for detail).
The impact of the strong hub to a network is so great that the other characteristics of the network may
become relatively small and difficult to be observed. Thus, for any MeSH term Mi in the initial MeSH
term set, if the occurrence counts as C ( Mi ) T1 , C ( Mi ) T2 , . . . C ( Mi ) TN for all of the time period 1, 2, . . .
N are positive, it is considered as the Routine MeSH term and removed from the dataset.
3.2.3. Selection of Emerging MeSH Terms
Growth pattern is another aspect of MeSH terms to be considered to prepare the “noteworthy”
MeSH terms. Users would be interested in the recent terms, and they would be most interested
in the recent terms of increasing occurrence counts. Therefore, the method proposed in this study
focuses on “Emerging MeSH terms”. By doing so, the users would be able to identify the knowledge
structure of an emerging area more intuitively, otherwise they would have to deal with overall status
of the research area. The Emerging MeSH terms are defined as the MeSH terms that have positive
MeSH term count increment in the Time Period TN from the previous TN−1 , which is written as
C ( Mi ) TN − C ( Mi ) TN −1 > 0 and C ( Mi ) TN ≥ 3 for the condition of average count at least once a year.
3.3. Measurement of the MeSH Term Correlations
Two MeSH terms comprising a pair are said to co-occur in a set of publications when there is
at least one publication containing both. Based on the principle of co-word analysis, the strength
of their relationship is interpreted [21]; the more these two words (or terms) co-occur, the stronger
the relationship between them is. In a conventional way, the correlation is measured based on the
co-occurrence count of the terms. A correlation matrix is given by repeating this measurement over all
of the pairs in the dataset and presenting the result in the format of matrix. Then, a network structure
is generated based on the correlation matrix.
The structure of the network, however, could be seriously biased by the dominating terms,
the Routine MeSH Terms for instance, in the term list when the correlation matrix is measured based
on the conventional way. Beside the Routine MeSH terms, other terms such as “Trendy Terms” and
“Query Terms” could also bias the network in the same way as the routine terms do. The Trendy Terms,
which are very popular, and thus frequently used by the researchers in the research area in a given
time period, may appear in a large portion of the publications creating many connections to other
terms and acting as the “strong hub”. Query Terms, the terms used in a search query, are another type
of the candidate for the strong hub. Although the Query Terms may not “literally” be expressed as
MeSH term, there is a high possibility that they could be found in the MeSH term inventory if they are
biomedical terms. In such a case, they will be included in the network acting as the strong hub.
To remedy these problems, an alternative method to prepare the correlation matrix is proposed in
this study; the similarities of the titles of the publications containing the MeSH terms in a pair is used
instead of co-occurrence count of the terms. The titles are the essence of the research topic enclosed
in the publications, and generally the most recent terms in the research area are selected. The title
similarities have nothing to do with the co-occurrence count of MeSH terms, and thus the bias by the
dominant terms aforementioned, such as the Routine, Trendy and Query terms, acting as the strongInt. J. Environ. Res. Public Health 2018, 15, 1113 7 of 14
hubs can be avoided. The following shows how the title similarities are used to measure the correlation
between the MeSH terms.
Title Keywords (TK) (both words and noun phrases) are extracted from the titles of the
publications by applying Natural Language Processing (NLP). A bibliometric data management
tool, the VantagePoint provided by the Search Technology, Inc. (www.thevantagepoint.com), is used to
apply the text mining processes: NLP, extracting and cleansing the keywords. For the time period TN ,
MeSH-TK co-occurrence matrix is generated as shown in Table 1. For the two MeSH terms Mi and M j ,
−−−−→ −−−−→
the vector V ( Mi ) , V M j , and cosine similarity Sim Mi , M j are given as follows:
−−−−→
V ( Mi ) = vector (C ( TK1 | Mi ), C ( TK2 | Mi ), C ( TK3 | Mi ), . . . , C ( TKK | Mi )) (1)
−−−−→
V M j = vector C TK1 M j , C TK2 M j , C TK3 M j , . . . , C TKK M j (2)
−−−−→ −−−−→
V ( Mi ) · V M j
Sim Mi , M j = , (3)
−−−−→ −−−−→
V ( Mi ) V M j
where C ( TKk | Mi ) is the occurrence count of the title keyword TKk in the publication set to which the
MeSH term Mi is assigned. K is the number of title keywords extracted by text mining on the whole
literature set retrieved from PubMed by the search query.
Table 1. MeSH-TK co-occurrence matrix for a time period TN .
TK MeSH TK1 TK2 TK3 ... TKK
M1 C ( TK1 | M1 ) C ( TK2 | M1 ) C ( TK3 | M1 ) ... C ( TKK | M1 )
M2 C ( TK1 | M2 ) C ( TK2 | M2 ) C ( TK2 | M2 ) C ( TKK | M2 )
M3 C ( TK1 | M3 ) C ( TK2 | M3 ) C ( TK3 | M3 ) C ( TKK | M3 )
... ... ... ... ... ...
MM C ( TK1 | M M ) C ( TK2 | M M ) C ( TK3 | M M ) C ( TK3 | M M )
3.4. MeSH Net by Pathfinder Network Algorithm
When a network contains many nodes and links to be depicted, a “complex network” so to
speak, it often becomes over-crowded leaving the readers hindered from identifying the salient
structure of the network. A practical solution is to reduce the number of links in the network.
There are several algorithms developed for the link reduction. The key issue is whether the algorithm
preserves the underlying topological properties. The link reduction algorithm used in this study is a
Pathfinder Network (PFNET) [22,23], which is one of the two most popular link reduction algorithms in
information visualization together with the Minimum Spanning Tree (MST). Some studies suggest that
PFNET, which is originally developed to depict the salient network consisting of “concepts”, is more
suited to knowledge structuring [24–26] because MST has the potential to eliminate links that may be
significant. Eliminating potentially significant links can lower the accuracy of knowledge structuring.
PFNET (PFNET has two parameters, q and r. PFNET (r = ∞, q = n − 1) is the minimal PFNET which has
the fewest number of links among all possible PFNETs. PFNET (r = ∞, q = n − 1) also include all links
that are in any MST networks) includes all of potentially significant links, and hence is a better way for
effective link reduction without losing important information. Several studies have used to explore
the structure of knowledge, research trends or research fronts using the PFNET [27–31]. The PFNET
algorithm is applied to the MeSH term correlation matrix obtained from both the conventional way
and the one proposed in this study for comparison. Figure 2 shows the pseudo-code for measurement
of the MeSH term correlations and the adoption of PFNET algorithm.Int. J. Environ. Res. Public Health 2018, 15, 1113 8 of 14
Int. J. Environ. Res. Public Health 2018, 15, x FOR PEER REVIEW 8 of 14
1. Define a tree = ∅.
2. Define the final MeSH set ={ , ,…, }.
3. Define the Title Keyword set ={ , ,…, }.
4. For each MeSH ∈
5. For each Title Keyword ∈
6. Calculate MeSH-TK co-occurrence count ).
7. Create MeSH-TK co-occurrence vector ( ) = vector( ( | ), … , ( | ) ).
8. For each pair of two MeSH terms , ∈
9. Calculate cosine similarity Sim , = ( ) ∙ ( )/[| ( )| | ( )| ].
10. Put cosine similarity Sim , into Weight_of_Link , .
11. For each link Link ,
12. IF pass PFNET algorithm, THEN
13. = ∪ { Link , }.
14. Return .
Figure 2. The pseudo-code for measurement of the Medical Subject Headings (MeSH) term
Figure 2. The pseudo-code for measurement of the Medical Subject Headings (MeSH) term correlations
correlations and the adoption of Pathfinder Network (PFNET) algorithm.
and the adoption of Pathfinder Network (PFNET) algorithm.
4. Results and Discussion
4. ResultsAs and Discussion
mentioned in Section 3.2.1, a search query (immunotherapy and cancer and “tumor
microenvironment”)
As mentioned in Sectionwas submitted
3.2.1, a tosearch
PubMed,query and(immunotherapy
the bibliographic and information
cancer and on 1935“tumor
publications returned was collected. This publication set was treated as the research
microenvironment”) was submitted to PubMed, and the bibliographic information on 1935 publications area for the case
study of the method proposed in this study. The time span of the research area is 1993–2017.
returned was collected. This publication set was treated as the research area for the case study of
Complete calendar year was used to build the Time Periods, and hence Ylast was set to 2016. The
the method proposed in this study. The time span of the research area is 1993–2017. Complete
second column in Table 2 shows the annual publication count based on which the lifetime of the
calendar yeararea
research wasisused to build
measured. Wethe Time
repeat Periods,
the and hence
Time Period Ylast was
composition everysetthree
to 2016.
yearsThe fromsecond column
Ylast, 2016,
in Table 2 shows the annual publication count based on which the lifetime
to the past, e.g. 2016–2014, 2013–2011, …, 1995–1993. In the Time Periods 2016–2014, 2013–2011, of the research area is
measured. We repeat the Time Period composition every three years
2010–2008, 2007–2005, and 2004–2002, the average publication count is greater than from Y last10 according to past,
, 2016, to the
e.g., 2016–2014, 2013–2011,
the third column of Table. . 2.
. ,Although
1995–1993. thereInwere
the Time Periods
publications 2016–2014,
from 1993, the 2013–2011,
annual publication2010–2008,
count does
2007–2005, and not exceed 10the
2004–2002, in average
the time periods of 2001–1999,
publication count is1998–1996,
greater than and101995–1993.
according Therefore,
to the third
columnfiveofperiods were
Table 2. found tothere
Although satisfy
werethepublications
criterion for the
fromTime Period,
1993, i.e. average
the annual annual publication
publication count does not
count greater than 10, resulting in the lifetime of 15 years for the given research
exceed 10 in the time periods of 2001–1999, 1998–1996, and 1995–1993. Therefore, five periods area. Then, the timewere
period of 2004–2002 was set as Time Period 1 (T1) for the starting point of this research field, and
found to satisfy the criterion for the Time Period, i.e., average annual publication count greater than
2007–2005, 2010–2008, 2013–2011, and 2016–2014 were set as Time Periods 2–5, respectively. The
10, resulting in the lifetime of 15 years for the given research area. Then, the time period of 2004–2002
number of the initial MeSH terms extracted from the lifetime range of Time Periods 1–5 is 1758 in
was set as Time Period 1 (T1 ) for the starting point of this research field, and 2007–2005, 2010–2008,
total.
2013–2011, and 2016–2014 were set as Time Periods 2–5, respectively. The number of the initial MeSH
terms extracted from the lifetime
Table rangethe
2. Measuring of lifetime
Time Periods 1–5 area
of a research is 1758 in case
for the total.
study.
Year (Y) Publication Count Average Publication Count Time Period (T)
Table 2. Measuring the lifetime of a research area for the case study.
2017 186 NA NA
2016 395
Year (Y) Publication Count Average Publication Count Time Period (T)
2015 325 318.3 5
2017 2014 186
235 NA NA
2016 2013 197
395
2015 2012 163
325 156.7 318.3 4 5
2014 2011 235
110
2013 2010 68
197
2012 2009 48
163 53.7 156.7 3 4
2011 2008 45
110
2010 68
2009 48 53.7 3
2008 45Int. J. Environ. Res. Public Health 2018, 15, 1113 9 of 14
Table 2. Cont.
Year (Y) Publication Count Average Publication Count Time Period (T)
2007 54
2006 27 31.7 2
2005 14
2004 12
2003 14 11.3 1
2002 8
2001 4
2000 4 4.3 *
1999 5
1998 10
1997 0 *
*
1996 1
1995 2
1994 5 *
1993 3
* Not eligible for Time Periods.
The Routine MeSH terms, defined in Section 3.2.2 as the MeSH terms appearing in all of the
Time Periods, were removed from the initial MeSH term set, resulting 1644 terms. After removing
the Routine MeSH terms, the Emerging MeSH terms, defined in Section 3.2.3 as the MeSH terms
with the occurrence count in TN greater than TN-1 and greater than or equal to 3 (in this case T5 > T4
and T5 ≥ 3) were selected and used as the final MeSH terms for the case study. By following these
processes, the number of the MeSH terms was reduced to 266, 15.1% of the initial MeSH terms.
Figure 3 is a MeSH PFNET network based on the MeSH term correlation matrix prepared
from the MeSH term co-occurrence count. Figure 3 is illustrated through the Fruchterman and
Reingold algorithm (one of the network visualization algorithms [32]) using the SNA software
Netminer, by Cyram, Inc, (www.cyram.com). This network has a structure that the term “tumor
microenvironment”, which is located in the center of the graph, acts as a strong hub. This term is a
part of the search query, and thus classified as a Query Term. At the same time, it is a Trendy Term
according to the experts in the research field. In such a network (Figure 3), it is very difficult to capture
the salient knowledge structure because the impact of the strong hub is so great that the remaining
part of the connections in the network is buried underneath. This term is directly connected to 74.4%
of the terms in the network (198 out of 266 MeSH terms).
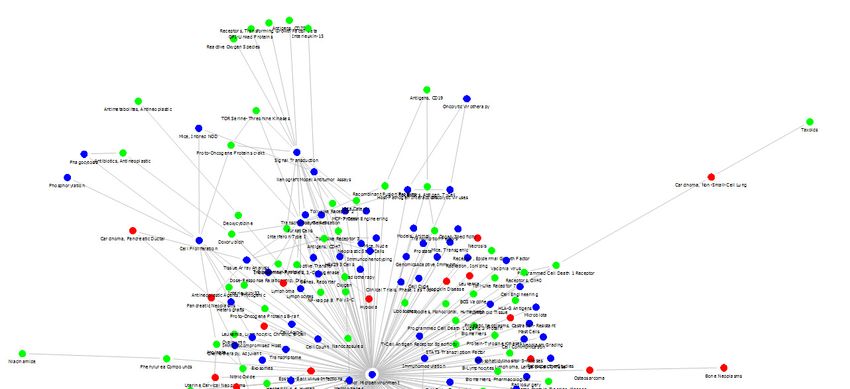
Figure 4 is a MeSH PFNET network based on the MeSH term correlation matrix prepared from
the title similarities, which is the alternative method proposed in this study. Figure 4 is also illustrated
through the Fruchterman and Reingold algorithm. The prototype application developed in this study
provides a zooming function so that the users can identify the connection details of the network when
necessary. The colors of the nodes are given according to the nature of the corresponding MeSH terms:
red for Disease, green for Chemicals and Drugs, and blue for others. This coloring can help the readers
better understand the characteristics of the relationships between the MeSH terms: target diseases for
chemicals and drugs, for example.
Quite contrary to the network in Figure 3, it has a well-defined structure consisting of branches,
which can be interpreted as the sub-areas (research topics comprising the research field). Sub-branches
of a large branch can be considered the subsidiary topics. This is a feature of the PFNET algorithm:
even without clustering or community detection, branches are formed by research topics, so it is
possible to grasp detailed research topics just by looking at the network graph. The validation of
Figure 4 was carried out by the experts in this research area, who gave a clear definition on the six
sub-areas by grouping the MeSH terms in the network and assigning a representative MeSH termInt. J. Environ. Res. Public Health 2018, 15, 1113 10 of 14
per sub-area: Receptors, Transforming Growth Factor beta; Mutation; Tumor microenvironment;
Biomarkers, Tumor; Protein Engineering; and Genetic vectors. These terms are marked with blue
shades and underscore in Figure 4 and Table 3 which shows some of major MeSH terms in each group.
Int. J. Environ. Res. Public Health 2018, 15, x FOR PEER REVIEW
They also confirmed that the network structure (the sub-areas and the subsidiary topics) was10in of 14
good
agreement
the subsidiary topics) was in good agreement with the actual activities in the recent research area. to
with the actual activities in the recent research area. The network in Figure 4 is referred
as the The
“MeSH Net”.
network in Figure 4 is referred to as the “MeSH Net”.
What What is remarkable with this
is remarkable withMap this is thatisit that
Map was itcreated only with
was created onlythe
withsearch query and
the search querystatistical
and
processes without
statistical the help
processes or intervention
without the help or of the experts
intervention of in
thethe research
experts area.
in the The search
research area. Thequery was a
search
query list
very simple wasof a typical
very simple list of typical
keywords keywordsarea,
in the research in the
notresearch
the onearea,
withnot the one with
a complex searcha complex
expression
search expression
that professional analysts that professional
often make. When analysts
using often
thismake.
method, When using this
therefore, themethod,
user only therefore,
needs totheinput
user only needs to input a search query for the research area to explore
a search query for the research area to explore and wait until the calculation is finished. The user will and wait until the
calculation is finished. The user will be given a network in a graphic mode with the essential
be given a network in a graphic mode with the essential information on the research trend and the
information on the research trend and the knowledge structure which are very intuitive for
knowledge structure which are very intuitive for understanding the result. Common search tools,
understanding the result. Common search tools, including PubMed, provide search results in a
including PubMed,
publication provide
list. search results
It the number in a publication
of searched publicationslist. It theand
is 1000 number
a listofofsearched publications
10 publications is
is 1000displayed
and a list per search page, the user needs to click on up to 100 pages to check the titles on
of 10 publications is displayed per search page, the user needs to click up to
of all
100 pages to check the
publications. Thetitles of all
method wepublications.
introduce is to The methodthe
structure weknowledge
introduce is ofto structure
1000 the knowledge
publications using
of 1000MeSH
publications
terms and using MeSH
provide themterms andMeSH
as one provide Netthem
graph as which
one MeSH
couldNethelpgraph
users which could help
to understand
intuitively
users to understand the recent research
intuitively thetrends.
recent research trends.
3. Medical
FigureFigure Subject
3. Medical Headings
Subject Headings(MeSH)
(MeSH)network
networkbased
based on the MeSH
on the MeSHterm
termcorrelation
correlation matrix
matrix
prepared from the
prepared fromMeSH termterm
the MeSH co-occurrence
co-occurrencecount
countfor
forthe
thecase
case study researcharea.
study research area. The
The colors
colors of the
of the
nodes nodes
represent different
represent characteristics
different of MeSH
characteristics terms:
of MeSH redred
terms: dots forfor
dots Disease, green
Disease, forforChemicals
green Chemicalsand
Drugs,and
andDrugs,
blue forandother
blue for otherterms.
MeSH MeSH terms.Int. J. Environ. Res. Public Health 2018, 15, 1113 11 of 14
Int. J. Environ. Res. Public Health 2018, 15, x FOR PEER REVIEW 11 of 14
Figure4.4.Medical
Figure MedicalSubject
SubjectHeadings
Headings(MeSH)
(MeSH)network
networkbased
basedononthe
theMeSH
MeSHtermtermcorrelation
correlationmatrix
matrix
preparedfrom
prepared fromthe
the title
title similarities
similarities forfor
thethe
casecase study
study research
research area.area.
This This network
network is referred
is referred to as
to as “the
“the MeSH Net”. The six sub-areas in dotted lines are in good agreement with the
MeSH Net”. The six sub-areas in dotted lines are in good agreement with the actual research activities actual research
inactivities in as confirmed
as confirmed by an expert byin
anthe
expert in the corresponding
corresponding research
research area. area. The representative
The representative MeSH terms MeSH
for
each
termssub-area
for eachare shownare
sub-area marked
shownwith bluewith
marked shades.
blueThe colors
shades. Theofcolors
the nodes
of theare the same
nodes are theassame
thoseas
inthose
Figure 3.
in Figure 3.
Table3.3.Examples
Table Examplesofofmajor
majorMedical
MedicalSubject
SubjectHeadings
Headings(MeSH)
(MeSH)terms
termsinineach
eachgroup
groupofofFigure
Figure4.4.
Major MeSH Terms
Major MeSH Terms
in Group 1 in Group 2
in Group 1 Transforming Growth Factor beta
Receptors, inMutation
Group 2
OncogeneTransforming
Receptors, Proteins, ViralGrowth Factor beta Proto-Oncogene Proteins B-raf
Mutation
Nitric Oxide
Oncogene Proteins, Viral Phenylurea Compounds
Proto-Oncogene Proteins B-raf
Nitric Oxide
Poly I-C Phenylurea Compounds
Poly I-C
GPI-Linked Proteins
GPI-Linked
MCF-7 Cells Proteins
MCF-7 CellsNeoplasms
Pancreatic
Pancreatic Neoplasms
in Group 3 in Group 4
Tumor Microenvironment Biomarkers, Tumor
Immunomodulation Survival Rate
Cell Transformation, Neoplastic Follow-Up Studies
Serine Endopeptidases Kaplan-Meier EstimateInt. J. Environ. Res. Public Health 2018, 15, 1113 12 of 14
Table 3. Cont.
Major MeSH Terms
in Group 3 in Group 4
Tumor Microenvironment Biomarkers, Tumor
Immunomodulation Survival Rate
Cell Transformation, Neoplastic Follow-Up Studies
Serine Endopeptidases Kaplan-Meier Estimate
Gelatinases BCG Vaccine
Molecular Targeted Therapy
in Group 5 in Group 6
Protein Engineering Genetic Vectors
Herpesvirus 4, Human Oncolytic Viruses
Epstein-Barr Virus Infections
Underscored Medical Subject Headings (MeSH) terms are the representative terms for corresponding groups.
5. Conclusions
The increase of publications in biomedical field makes the researchers and educators experience
difficulties with keeping track of the literature in their research areas. Various PubMed derivatives
have been developed to assist them as the complementary tools to PubMed. Most of these tools,
however, including PubMed itself, give the output as the list of search result, which requires much time
and effort from the users either to locate a publication or to extract knowledge from it. Although some
PubMed derivatives use different ranking algorithms from PubMed, the users still need to collect bits
of knowledge to build the overall knowledge structure; a cognitive way, so to speak. An alternative
way would reduce the amount of time and effort by providing an easier way to explore the knowledge
structure of a research area is needed; an intuitive (or graphical) way.
What is proposed in this paper is a prototype application with an alternative method to explore
the research trend of a research area using a network graph. We have studied a methodology to
visualize a social network composed of emerging medical keywords in PubMed literature, so-called
MeSH terms, a controlled biomedical vocabulary thesaurus. The new method includes the mechanism
to select only the “noteworthy” MeSH terms from those extracted from the publications in a research
area defined by a search query, a simple list of keywords, to PubMed. Another unique feature of the
method is that the network graph is generated via the similarities of the titles of the publications,
which is different from the conventional method using the co-occurrence count of the terms. According
to a case study, it was found that the resulting network graph is not biased by the dominating terms
such as Routine, Trendy and Query terms, and that the knowledge structure obtained showed the
structure made of six well-defined branches. The experts in the corresponding research area confirmed
that the MeSH terms selected and the network structure obtained were in good agreement with the
actual activities in the research area. The whole analytical process does not need any knowledge of
experts once the research area to be analyzed is given by the user, which implies that the application
can act as an automated technology intelligence tool.
The prototype application that implements the method for generating MeSH Net is believed to be
helpful for the users to explore the research trend of their research areas of interest. The prototype
application would have some additional functions to improve performance. One of the examples is
the “Click and Link”, which opens a pop-up window containing the list of the publication of PubMed
including the MeSH term when a MeSH term in the network graph is clicked by the user. It is also
possible to link to other literature databases including MeSH terms, ClinicalTrials.gov database for
example. The link to a list of clinical trial studies including the MeSH term would be added as well.
One concern with the operation of the application is the running speed. If the search query entered
by users is too broad and covers many documents, it could take a considerable amount of time to
download the document information and calculate similarities to draw the network. A further studyInt. J. Environ. Res. Public Health 2018, 15, 1113 13 of 14
will be carried out on the speed problem according to the number of documents and to scale the size
of the analytical literature to maintain the speed that the users can accept. Overall, the application for
the MeSH Net with the aforementioned features is expected to provide users an easier way to explore
the research areas of their interests.
Author Contributions: Study design, Methodology, Data collection and analysis, Heyoung Yang; Writing, Editing,
Reviewing, Heyoung Yang and Hyuck Jai Lee.
Funding: This research was funded by Korea Institute of Science and Technology Information; grant
number: K-17-L02-C02-S03.
Conflicts of Interest: The authors declare no conflict of interest.
References
1. Hunter, L.; Cohen, K.B. Biomedical language processing: Perspective what’s beyond PubMed? Mol. Cell
2006, 21, 589–594. [CrossRef] [PubMed]
2. Lu, Z. PubMed and beyond: A survey of web tools for searching biomedical literature. Database 2011, 2011,
baq036. [CrossRef] [PubMed]
3. Srinivasan, P. MeSHmap: A text mining tool for MEDLINE. In Proceedings of the AMIA Symposium;
American Medical Informatics Association: Bethesda, MD, USA, 2001; p. 642.
4. Gorman, P.N.; Helfand, M. Information seeking in primary care: How physicians choose which clinical
questions to pursue and which to leave unanswered. Med. Decis. Mak. 1995, 15, 113–119. [CrossRef]
[PubMed]
5. National Center for Biotechnology Information (NCBI). Available online: https://www.ncbi.nlm.nih.gov/
CBBresearch/Lu/search/ (accessed on 17 April 2018).
6. Theodosiou, T.; Vizirianakis, I.S.; Angelis, L.; Tsaftaris, A.; Darzentas, N. MeSHy: Mining unanticipated
PubMed information using frequencies of occurrences and concurrences of MeSH terms. J. Biomed. Inform.
2011, 44, 919–926. [CrossRef] [PubMed]
7. Kim, S.; Yeganova, L.; Wilbur, W.J. Meshable: Searching PubMed abstracts by utilizing MeSH and
MeSH-derived topical terms. Bioinformatics 2016, 32, 3044–3046. [CrossRef] [PubMed]
8. De Bellis, N. Bibliometrics and Citation Analysis: From the Science Citation Index to Cybermetrics; Scarecrow Press:
Lanham, MD, USA, 2009. [CrossRef]
9. Scott, J. Social Network Analysis; Sage: London, UK, 2017.
10. Borgatti, S.P.; Mehra, A.; Brass, D.J.; Labianca, G. Network analysis in the social sciences. Science 2009, 323,
892–895. [CrossRef] [PubMed]
11. Strogatz, S.H. Exploring complex networks. Nature 2001, 410, 268. [CrossRef] [PubMed]
12. Otte, E.; Rousseau, R. Social network analysis: A powerful strategy, also for the information sciences.
J. Inf. Sci. 2002, 28, 441–453. [CrossRef]
13. Whittaker, J. Creativity and conformity in science: Titles, keywords and co-word analysis. Soc. Stud. Sci.
1989, 19, 473–496. [CrossRef]
14. Sternitzke, C.; Bartkowski, A.; Schramm, R. Visualizing patent statistics by means of social network analysis
tools. World Pat. Inf. 2008, 30, 115–131. [CrossRef]
15. Doms, A.; Schroeder, M. GoPubMed: Exploring PubMed with the gene ontology. Nucleic Acids Res. 2005, 33
(Suppl. 2), W783–W786. [CrossRef] [PubMed]
16. Gene Ontology Consortium. The Gene Ontology (GO) database and informatics resource. Nucleic Acids Res.
2004, 32 (Suppl. 1), D258–D261. [CrossRef]
17. Kilicoglu, H.; Fiszman, M.; Rodriguez, A.; Shin, D.; Ripple, A.; Rindflesch, T.C. Semantic MEDLINE:
A web application for managing the results of PubMed Searches. In Proceedings of the Third International
Symposium for Semantic Mining in Biomedicine, Turku, Finland, 1–3 September 2008; Volume 2008,
pp. 69–76.
18. Rindflesch, T.C.; Fiszman, M. The interaction of domain knowledge and linguistic structure in natural
language processing: Interpreting hypernymic propositions in biomedical text. J. Biomed. Inform. 2003, 36,
462–477. [CrossRef] [PubMed]Int. J. Environ. Res. Public Health 2018, 15, 1113 14 of 14
19. Lindberg, D.A.; Humphreys, B.L.; McCray, A.T. The unified medical language system. In IMIA Yearbook;
IMIA: Kardak Islets, Greece, 1993; pp. 41–51.
20. Fiszman, M.; Rindflesch, T.C.; Kilicoglu, H. Abstraction summarization for managing the biomedical research
literature. In Proceedings of the HLT-NAACL Workshop on Computational Lexical Semantics, Boston, MA,
USA, 6 May 2004; Association for Computational Linguistics: Stroudsburg, PA, USA, 2004; pp. 76–83.
[CrossRef]
21. Callon, M.; Courtial, J.P.; Turner, W.A.; Bauin, S. From translations to problematic networks: An introduction
to co-word analysis. Soc. Sci. Inf. 1983, 22, 191–235. [CrossRef]
22. Schvaneveldt, R.W.; Durso, F.T.; Dearholt, D.W. Network structures in proximity data. Psychol. Learn. Motiv.
1989, 24, 249–284. [CrossRef]
23. Quirin, A.; Cordón, O.; Guerrero-Bote, V.P.; Vargas-Quesada, B.; Moya-Anegón, F. A quick MST-based
algorithm to obtain Pathfinder networks (∞, n − 1). J. Assoc. Inf. Sci. Technol. 2008, 59, 1912–1924. [CrossRef]
24. Schvaneveldt, R.W. Pathfinder Associative Networks: Studies in Knowledge Organization; Ablex Publishing:
Westport, CT, USA, 1990.
25. Chen, C.; Paul, R.J. Visualizing a knowledge domain’s intellectual structure. Computer 2001, 34, 65–71.
[CrossRef]
26. Chen, C.; Morris, S. Visualizing evolving networks: Minimum spanning trees versus pathfinder networks.
In Proceedings of the IEEE Symposium on Information Visualization (INFOVIS 2003), Seattle, WA, USA,
19–21 October 2003; pp. 67–74. [CrossRef]
27. Mane, K.K.; Borner, K. Mapping topics and topic bursts in PNAS. Proc. Natl. Acad. Sci. USA 2004, 101
(Suppl. 1), 5287–5290. [CrossRef] [PubMed]
28. Chen, C. CiteSpace II: Detecting and visualizing emerging trends and transient patterns in scientific literature.
J. Assoc. Inf. Sci. Technol. 2006, 57, 359–377. [CrossRef]
29. Lee, J.Y.; Kim, H.; Kim, P.J. Domain analysis with text mining: Analysis of digital library research trends
using profiling methods. J. Inf. Sci. 2010, 36, 144–161. [CrossRef]
30. Lee, M.R.; Chen, T.T. Revealing research themes and trends in knowledge management: From 1995 to 2010.
Knowl. Based Syst. 2012, 28, 47–58. [CrossRef]
31. Chen, C.; Hu, Z.; Liu, S.; Tseng, H. Emerging trends in regenerative medicine: A scientometric analysis in
CiteSpace. Expert Opin. Biol. Ther. 2012, 12, 593–608. [CrossRef] [PubMed]
32. Fruchterman, T.M.; Reingold, E.M. Graph drawing by force-directed placement. Softw. Pract. Exp. 1991, 21,
1129–1164. [CrossRef]
© 2018 by the authors. Licensee MDPI, Basel, Switzerland. This article is an open access
article distributed under the terms and conditions of the Creative Commons Attribution
(CC BY) license (http://creativecommons.org/licenses/by/4.0/).You can also read