Network analysis reveals essential proteins that regulate sodium iodide symporter expression in anaplastic thyroid carcinoma - Nature
←
→
Page content transcription
If your browser does not render page correctly, please read the page content below
www.nature.com/scientificreports
OPEN Network analysis reveals
essential proteins that regulate
sodium‑iodide symporter
expression in anaplastic thyroid
carcinoma
Hassan Rakhsh‑Khorshid1,2, Hilda Samimi3, Shukoofeh Torabi4,
Sayed Mahmoud Sajjadi‑Jazi5,3, Hamed Samadi3, Fatemeh Ghafouri6,3, Yazdan Asgari7* &
Vahid Haghpanah3,8*
Anaplastic thyroid carcinoma (ATC) is the most rare and lethal form of thyroid cancer and requires
effective treatment. Efforts have been made to restore sodium-iodide symporter (NIS) expression
in ATC cells where it has been downregulated, yet without complete success. Systems biology
approaches have been used to simplify complex biological networks. Here, we attempt to find more
suitable targets in order to restore NIS expression in ATC cells. We have built a simplified protein
interaction network including transcription factors and proteins involved in MAPK, TGFβ/SMAD, PI3K/
AKT, and TSHR signaling pathways which regulate NIS expression, alongside proteins interacting
with them. The network was analyzed, and proteins were ranked based on several centrality indices.
Our results suggest that the protein interaction network of NIS expression regulation is modular, and
distance-based and information-flow-based centrality indices may be better predictors of important
proteins in such networks. We propose that the high-ranked proteins found in our analysis are
expected to be more promising targets in attempts to restore NIS expression in ATC cells.
Abbreviations
AKT1 AKT Serine/Threonine Kinase 1
ATC Anaplastic Thyroid Carcinoma
BCL2L1 B Cell Lymphoma-2-Like 1
BioGRID Biological General Repository for Interaction Datasets
BRAF B-Raf Proto-Oncogene
CASP3 Cysteine-ASPartic Protease 3
CASP9 Cysteine-ASPartic Protease 9
DMNC Maximum Neighborhood Component
EGR1 Early Growth Response Protein 1
EPC Edge Percolated Component
N-RAS NRAS Proto-Oncogene
1
Department of Biochemistry, Faculty of Biological Sciences, Tarbiat Modares University, Tehran, Iran. 2Apoptosis
Research Centre, National University of Ireland, Galway, Ireland. 3Endocrinology and Metabolism Research Center,
Endocrinology and Metabolism Clinical Sciences Institute, Tehran University of Medical Sciences, Dr. Shariati
Hospital, North Kargar Ave, Tehran 14114, Iran. 4Department of Stem Cells and Developmental Biology, Cell
Science Research Center, Royan Institute for Stem Cell Biology and Technology, Academic Center for Education,
Culture and Research (ACECR), Tehran, Iran. 5Cell Therapy and Regenerative Medicine Research Center,
Endocrinology and Metabolism Molecular‑Cellular Sciences Institute, Tehran University of Medical Sciences,
Tehran, Iran. 6Department of Biotechnology, Faculty of Life Sciences and Biotechnology, Shahid Beheshti
University, Tehran, Iran. 7Department of Medical Biotechnology, School of Advanced Technologies in Medicine,
Tehran University of Medical Sciences, Italia St., Tehran 1417755469, Iran. 8Personalized Medicine Research
Center, Endocrinology and Metabolism Clinical Sciences Institute, Tehran University of Medical Sciences, Tehran,
Iran. *email: yasgari@tums.ac.ir; v.haghpanah@gmail.com
Scientific Reports | (2020) 10:21440 | https://doi.org/10.1038/s41598-020-78574-x 1
Vol.:(0123456789)www.nature.com/scientificreports/
MAPK1 Mitogen-Activated Protein Kinase 1
MCC Maximal Clique Centrality
MEK Mitogen-Activated Protein Kinase Kinase
MYC MYC Proto-Oncogene
NIS Sodium-Iodide Symporter
NIS-ERPIN NIS regulatory protein interaction network
PARP1 Poly [ADP-Ribose] Polymerase 1
PI3K Phosphoinositide 3-Kinase
PIK3CA Phosphoinositide 3-Kinase Catalytic subunit A
PIK3CB Phosphoinositide 3-Kinase Catalytic subunit B
PIK3CD Phosphoinositide 3-Kinase Catalytic subunit D
PIK3CG Phosphoinositide 3-Kinase Catalytic subunit G
PPI Protein–Protein Interaction
SMAD Sma- And Mad-Related Protein
SRC SRC Proto-Oncogene
TERT Telomerase Reverse Transcriptase
TGFβ Transforming Growth Factor β
TP53 Tumor Protein 53
TSHR Thyroid-Stimulating Hormone Receptor
XIAP X-linked Inhibitor of Apoptosis Protein
Anaplastic thyroid carcinoma (ATC) is a very rare tumor of the thyroid gland, featuring undifferentiated tissue.
ATC is diagnosed in about one percent of thyroid cancers with nearly 100 percent disease-specific m ortality1. In
most cases, surgery is intended to prevent imminent airway compromise and despite multimodality approach
including post-surgery radio/chemotherapies, many ATC patients have very poor o utcome2. Radioactive iodine
administration which has been routinely applied and considered to be effective in differentiated thyroid cancers,
is not successful in ATC patients as ATC tissue does not concentrate iodide due to defects in sodium-iodide
symporter (NIS) expression, structure or translocation3. Attempts have been made to induce radioactive iodine
uptake in ATC cells4, e.g., by stable expression of NIS5 or suppression of inhibitory signaling pathways6,7, however
none have yet been clinically used for ATC. The inability of ATC cells to respond to radioactive iodine seems to
be the result of several genetic and epigenetic abnormalities. ATC is a genetically complex disease, and various
mutations, notably in BRAF, TP53, TERT, RAS, and PIK3CA, have been noted in s amples8–11. Moreover, many
breaks and copy number variations have been observed in ATC s amples12. For instance, with regard to NIS
expression it was found that B RAFV600E, one of the most frequent mutations in ATC, leads to NIS downregulation
through induction of TGFβ s ecretion13 or regulation of DNA methyltransferase 114. In addition, membranous
NIS-expressing thyroid tumor samples were shown to have wild-type BRAF and N-RAS15. Moreover, suppression
of MAPK and PI3K/AKT signaling pathways, two pathways with the most frequent mutations in ATC, led to
NIS restoration6,7. This complicated and multi-pathway regulation of NIS expression has persuaded us to exploit
other approaches in order to better understand it.
At several levels, biological entities show such complicated structures and behaviors that systemic approaches
are required to complement studies on single molecules. Further encouragement to try these approaches came
from the similarities between biological and non-biological (e.g., social) networks that facilitate use of similar
methods16. Centrality analysis is one of these methods employed by biological researchers to determine the
importance of each node (e.g., protein) in a network (e.g., protein–protein interaction (PPI) networks)17. In such
networks, protein interactions are undirected and unweighted e dges18. Centrality analysis has been applied in
order to find essential proteins of PPI networks in a wide range of o rganisms19–23. This method has also been
brought to cancer research24. In almost all studies, the goal was finding the most suitable centrality indices or
a combination of them, usually by comparing the ranking results within experimental data17–23,25–28. Finding
essential proteins of a network using centrality analysis can help researchers to design therapeutics and genetic
manipulations with a minimalistic approach, and therefore lower cost.
Considering the complexity of NIS expression regulatory pathways in ATC, we attempted to simplify it by
building a model network comprising the transcription factors and signaling pathways (MAPK, TGFβ/SMAD,
PI3K/AKT, and TSHR) related to NIS expression13,29,30. Based on 167 input proteins, the NIS regulatory protein
interaction network (NIS-ERPIN) was established. These proteins include transcription factors and signaling
pathway proteins that regulate NIS expression, along with some other proteins that interact with them. NIS-
ERPIN has then been analyzed for both modularity and centrality and sorted based on different centrality
indices. Ranks of proteins in each centrality index have been considered as indicators of proteins essentiality
within the network. Protein essentiality in this network may be utilized in order to choose molecular targets
for NIS expression and consequently response to radioactive iodine therapy in ATC patients if one is going to
disrupt the network.
Methods
Creating the NIS‑ERPIN. We have built a network of proteins, mainly including the four signaling path-
ways and transcription factors that regulate NIS expression (Supplementary Table S1). These proteins were ini-
tially mined manually through literature review and were enriched by several interacting proteins that were rec-
ommended by BioGRID31, together making the list of 167 input proteins (Supplementary Figure S1). BioGRID
is the Biological General Repository for Interaction Datasets, a curated database of different types of interac-
tions, notably protein–protein interactions. Using Cytoscape (version 3.7.1)32, a software capable of modeling
Scientific Reports | (2020) 10:21440 | https://doi.org/10.1038/s41598-020-78574-x 2
Vol:.(1234567890)www.nature.com/scientificreports/
the networks of molecular interactions, a network was reconstructed with the data from BioGRID. It is possible
to create a network for which all nodes are not necessarily connected to each other. Therefore, we have a whole
network including different connected sub-networks. In most cases, there is a very large connected sub-network
and other small connected sub-networks. If the other small sub-networks contain a very small number of nodes
(compared to the largest one), it is possible to remove them from the analyses. At the present study, the largest
connected sub-network was considered for further topological analyses which contains 1,278 nodes and 76,924
edges or interactions (Supplementary Figure S2).
Centrality analysis. Eleven centrality indices were used in this study: Degree, Betweenness, Closeness,
Bottleneck, Radiality, Stress, Clustering Coefficient, EcCentricity, Edge Percolated Component (EPC), Density
of Maximum Neighborhood Component (DMNC), and Maximal Clique Centrality (MCC)33. Based on the pri-
mary ranking, eight centrality indices were informative and thus categorized in three groups: (1) representing
the number of immediate neighbors of a node (Degree), (2) indicating the number of interactions in the circle of
neighbors (DMNC, and Clustering Coefficient), and (3) reflecting distance and information flow in the network
(EPC, Closeness, Radiality, Betweenness, and Stress).
Centrality indices in each category averaged out to give a combination index which we used to compute
weighted and unweighted averages of protein ranks. Since we hypothesized that, in NIS-ERPIN, distance- and
information flow-based centrality indices are better predictors of protein essentiality, weighted averages were
computed to reflect this assumption. The weighted average was calculated by giving a factor of 0.7 to the average
of information flow indices, 0.2 to Degree, and 0.1 to the average of Clustering Coefficient and DMNC.
Modularity analysis. A network of protein interactions was generated using STRING database34. The
output file, the list of protein interactions, was imported in Gephi 0.9.235 for modularity analysis by Blondel’s
ethod36. A graph of 2039 nodes and 76,924 edges was created with the resolution set at one. For comparison,
m
three random graphs with the same number of nodes and resolutions were also generated.
Mutated genes in ATC. To obtain the mutational landscape of genes that encode proteins of NIS-ERPIN,
we used the results of the whole-exome sequencing on ATC samples with the largest sample size, including 22
ATC tissue specimens and four ATC cell l ines37. At the present study, the list of mutation frequencies for proteins
of NIS-ERPIN in ATC is extracted from the results of Kunstman et al.37 study and is presented in Supplementary
Table S2. The mutation frequencies, normalized and sorted based on the protein length, in ATC were compared
with the lists obtained from the centrality analysis. The correlation between lists was evaluated using R software
(version 3.5.2) in Mac Operating System.
Results
Scoring based on centrality indices and averaging out the proteins ranks. Of the eleven central-
ity indices used, the results of three (Bottleneck, MCC, and EcCentricity) were not informative (data are not
shown) and as a result were excluded from further analyses. They were not informative because their lists consist
of mostly repetitive scores. The high-ranked proteins of the eight informative indices are presented in Table 1.
Results of the weighted and unweighted averages of protein ranks of three centrality categories are presented in
Table 2.
Modularity analysis. The modularity score of 0.411 was calculated for NIS-ERPIN (plot of size distribution
is presented in Fig. 1), whereas three random graphs with the same size of nodes had modularity scores of about
one fifth (0.085, 0.084 and 0.082; plots of size distribution are presented in Supplementary Figure S3. Moreover,
the graph of NIS-ERPIN contained seven communities of nodes, and the random graphs had nine, eight and ten
communities, respectively.
Comparing centrality analysis with mutation frequencies. Interested in the correlation between
the rate of mutations and the essentiality of the protein products in NIS-ERPIN, we focused on the mutations
of 167 protein-coding genes, reported by Kunstman et al. in the whole-exome sequencing of ATC samples and
cell lines37. The list of mutations was compared with the lists of protein ranks from centrality analyses. There was
no statistically significant correlation between the list of mutation frequencies and any of the centrality indices
(Table 3). Also, all correlation coefficients were below 0.3 and considered weak.
Discussion
Centrality analysis has been recently explored in thyroid cancer r esearch38,39. In doing so, the two groups of Shang
et al. and Hossain et al. first regarded differential gene expression as their criterion for the importance of genes
and then built their networks. Taking a different approach here, we have built our network without referring to
the gene expression data and therefore we provide a protein interaction network which can be used as a basis
for further studies. When creating strategies to disrupt the NIS expression regulatory network, gene expression
data can be imported to strengthen or weaken edges and nodes of the network.
An interesting result of our investigation was finding the concentration of apoptotic proteins on top of the
unweighted average list of the three centrality categories (Table 2). This outcome indicates that considering all
eight centrality indices explored in this study, several apoptosis-related proteins, including BCL2L1, CASP9,
XIAP, CASP3, and PARP1, are important in the network. Apoptosis has been proposed as a mechanism of cell
Scientific Reports | (2020) 10:21440 | https://doi.org/10.1038/s41598-020-78574-x 3
Vol.:(0123456789)www.nature.com/scientificreports/
No Degree Betwenness Closeness Radiality Stress EPC DMNC Clustering coefficient
1 AKT1 AKT1 AKT1 AKT1 AKT1 ALB MAPKAP1 GSX1
2 TP53 TP53 TP53 TP53 PIK3CA AKT1 IL1A PTTG1IP
3 GAPDH SRC GAPDH GAPDH IL6 GAPDH CASP9 ERRFI1
4 PIK3CA PIK3CA PIK3CA PIK3CA ALB PIK3CA XIAP CAMP
5 ALB ALB ALB ALB SRC JUN CAMP FOXE1
6 SRC IL6 SRC SRC TP53 TP53 PARP1 PDK1
7 IL6 MAPK1 IL6 IL6 MAPK1 MAPK3 BCL2L1 MAFA
8 MAPK1 TNF MAPK1 MAPK1 TNF PIK3CB WEE1 SLA
9 MAPK3 EGFR MAPK3 MAPK3 JAK2 IL6 CHEK1 DAPP1
10 JUN EGF JUN JUN PIK3CD PIK3CG FGF1 MAPKAP1
11 PIK3CG GAPDH PIK3CG PIK3CG PIK3CB PIK3CD MMP2 SLC5A5
12 PIK3CD MAPK3 PIK3CD PIK3CD EGF MAPK1 RPS6KA1 APEX1
13 TNF JUN TNF TNF MAPK3 MYC HIF1A NKX2-1
14 PIK3CB VEGFA PIK3CB PIK3CB EGFR SRC PPARG IL1A
15 EGF PIK3CD EGF EGF PIK3CG EGFR DAPP1 HES1
16 EGFR JAK2 EGFR EGFR GAPDH INS EGR1 TSHB
17 MYC PIK3CB MYC MYC VEGFA TNF CDC25A CDC25B
18 VEGFA PIK3CG VEGFA VEGFA JUN EGF EIF4EBP1 THRB
19 INS MYC INS INS IL2 MAPK8 MDM2 WEE1
20 MAPK8 INS MAPK8 MAPK8 TGFB1 HRAS CDC25C UBTF
Table 1. Top-20 proteins of the eight informative centrality indices.
Distance and information flow Degree Interaction among neighbors Unweighted average Weighted average
AKT1 AKT1 TERF2IP PARP1 AKT1
PRDM10 PRDM10 CAMP BCL2L1 PRDM10
TP53 MBOAT4 MAPKAP1 CASP9 IL2
ALB TP53 IL1A XIAP NFKB1
PIK3CA GAPDH ERRFI1 FGF1 GAPDH
MBOAT4 PIK3CA DAPP1 MMP2 MBOAT4
IL6 ALB XIAP PPARG BCL2
SRC SRC WEE1 EGR1 TP53
GAPDH IL6 CASP9 CASP3 IL6
MAPK1 MAPK1 PDK1 HIF1A ALB
MAPK3 MAPK3 SLA MDM2 PIK3CA
JUN JUN CHEK1 IL1A JUN
TNF PIK3CG APEX1 CDC25A MTOR
PIK3CD PIK3CD CDC25B RB1 STAT3
PIK3CB TNF DDIT3 CDKN1B PIK3CB
PIK3CG PIK3CB PTTG1 IL1B MAPK3
EGF EGF PARP1 RPS6KA1 TNF
EGFR EGFR RPS6KA1 PTEN PIK3CD
MYC MYC UBTF ESR1 PIK3CG
VEGFA VEGFA EIF4EBP1 HGF SRC
Table 2. Weighted and unweighted averages of proteins rank after categorizing centrality indices in three
groups, as mentioned in “Methods”.
death after radioactive iodine uptake in t hyroid40 and non-thyroid41–44 cancer cells. However, our results suggest
that apoptosis-related proteins may have a notable role in regulating NIS expression.
Categorizing centrality indices, we hypothesized that those indices, indicating distance and information
flow in the network, were better indicators of essentiality in the NIS-ERPIN, if one was going to disrupt the
function of the network in ATC. These indices, including Betweenness, Closeness, Stress, Radiality, and EPC,
can provide information about the fast flow of signal in the network. Betweenness and Closeness have been
shown to present essential proteins of PPI networks in yeast, worm, and fruit fly22. Betweenness effectiveness in
Scientific Reports | (2020) 10:21440 | https://doi.org/10.1038/s41598-020-78574-x 4
Vol:.(1234567890)www.nature.com/scientificreports/
Figure 1. Size distribution of protein communities of NIS expression regulatory network. 7 communities were
detected, and the modularity score was calculated 0.411.
Clustering
Betweenness Closeness coefficient Degree DMNC EPC MNC
Correlation − 0.0782 − 0.0784 0.1077 − 0.0827 0.1483 − 0.0689 − 0.0827
P value 0.3138 0.3122 0.1647 0.2868 0.0551 0.3746 0.2864
Group 1 average Weighted
Radiality Stress Total average † Group 2 average Group 3 average average
Correlation − 0.0828 − 0.0769 − 0.0369 0.1512 − 0.0765 0.0262 − 0.0644
P value 0.2858 0.3217 0.6345 0.0504 0.3241 0.7361 0.4069
Table 3. Correlation analysis of mutation rates and centrality indices shows that there is no statistically
significant correlation between any of the centrality indices and normalized mutation rates. Mutation data
are from a study by Kunstman et al.37. † Group and weighted averages have been defined as following: Group
1 average: average of ranks of DMNC and CC. Group 2 average: average of ranks of closeness, radiality,
betweenness, stress and EPC. Group 3 average: average of ‘Group 1 average’, ‘Group 2 average’ and ranks of
degree. Weighted average: average of ‘Group 1 average × 0.1’, ‘Group 2 average ✕ 0.7’ and ranks of ‘degree ×
0.2’.
discriminating essential proteins is proposed to be independent of the number of connections (Degree central-
ity)22. In a homology-based study in yeast PPI network, Xiong et al. found that cancer proteins tend to have higher
Betweenness scores than a verage24. In a study on prostate cancer, Closeness and Betweenness were found to be
more predictive of unknown genes/proteins related to the disease, whereas Degree was able to explore known
related genes/proteins accurately25. Centrality indices of Degree, Betweenness, and Closeness have been proposed
to be profitable in exploring essential proteins of cancer PPI networks45 and have been applied in studying the
pan-cancer network of proteins related to epithelial-mesenchymal transition46. However, we reasoned that Degree
centrality could give high scores to more known proteins due to the simple fact that these more recognized pro-
teins have been the focus of more studies, and therefore more interactions (network neighbors) have been found
for them. Considering the distance-based indices, we found that many top proteins in these lists are encoded
by highly mutated genes in ATC (Table 2). The results of the present study suggest that information-flow- and
distance-based centrality indices may be useful in predicting the essential proteins in regulating NIS expression.
To emphasize the importance of distance and information flow in the network, we put more weight on this
category when averaging ranks. We found that top-20 positions are concentrated with proteins which have
been frequently mutated in ATC, including AKT1, TP53, PIK3CA, PIK3CB, MAPK3, PIK3CD, PIK3CG, SRC,
MAPK1, and MYC (Table 2). These are all main proteins of AKT/PI3K or MAPK pathways. The essentiality of
distance-based and information-flow-based centrality indices in our study is in accordance with experimental
efforts to restore the NIS function. By using small molecules to inhibit MEK, AKT, and histone deacetylase, Liu
et al. could restore NIS expression and iodine uptake in several non-thyroid cell lines6. Also, Hou et al. gained
similar results upon downregulation of BRAF and AKT in melanoma cells7. These observations confirm the
significance of MAPK and AKT signaling pathways and epigenetic regulation in NIS expression. PI3K and TGFβ
were shown to inhibit radioactive iodine uptake, and one mechanism in the case of TGFβ was NIS r epression47.
In another study to restore iodide uptake, transfection of ATC cells with vector encoding wide-type TP53 gene
was successful to express NIS at the mRNA and protein levels and induce radioactive iodine concentration and
eventually cell death48. Developing a high-throughput screening, Oh et al. recently found a new tyrosine kinase
inhibitor leading to MAPK signaling pathway inactivation and NIS expression49. Accordingly, we conclude that
not only do our results suggest that MAPK and AKT/PI3K pathways may be more important in regulating NIS
Scientific Reports | (2020) 10:21440 | https://doi.org/10.1038/s41598-020-78574-x 5
Vol.:(0123456789)www.nature.com/scientificreports/
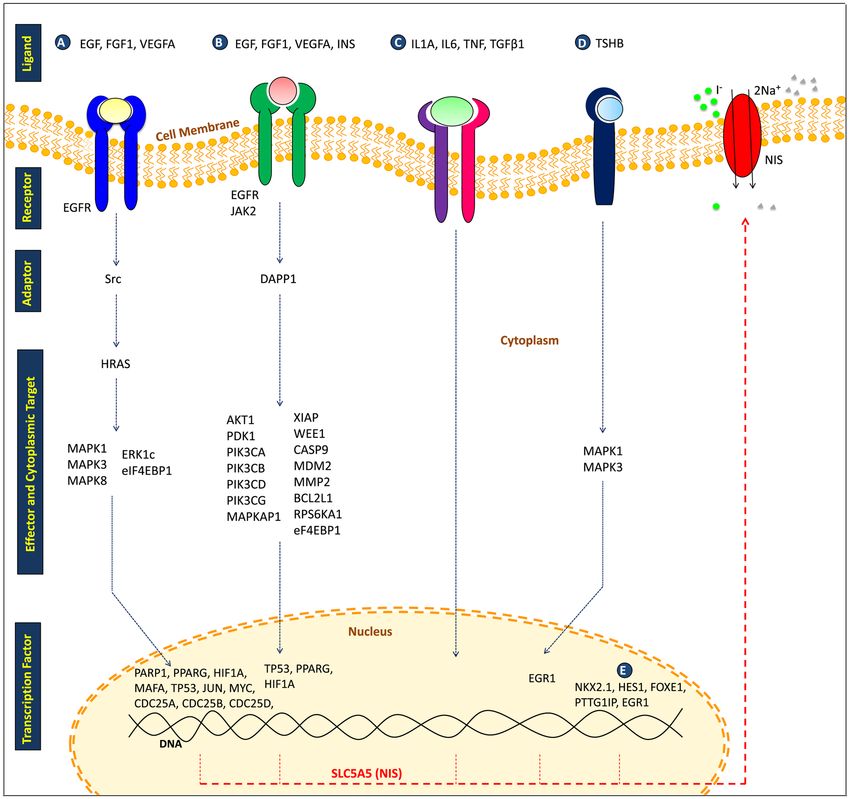
Figure 2. Several proteins of the four signaling pathways, including MAPK (A), PI3K/AKT (B), TGFβ/SMAD
(C) and TSH/TSHR (D), alongside a few transcription factors (E) with a role in the regulation of NIS expression
in ATC from the list of 167 input proteins, also appeared in top-20 lists of centrality indices.
expression but also, they confirm the importance of distance-based centrality indices in this network. Addition-
ally, other high-ranked proteins in the category of distance-related centrality indices may be interesting subjects
of study.
In a modular network, communities of nodes which are densely connected can be found, whereas their
connections with nodes of other communities are s parse36. Finding evidence of modularity is encouraging, as
it suggests that there might be nodes which are highly essential for the integrity of the network, regarded as
its weakness. The modularity of NIS-ERPIN emphasizes the significance of centrality analysis presented here.
Moreover, we investigated if we can find nodes with high scores in Betweenness and low scores in Degree, which
might be the connecting nodes of protein c ommunities50. However, we observed that there was no such node,
and that there was a very strong correlation between scores of Betweenness and Degree (data are not presented).
Curious about any correlation between centrality ranks of proteins and their rate of mutations, we also
compared the results of the only available whole-exome sequencing of ATC samples with our lists of centrality
indices and combinatory indices. Such a correlation may indicate the importance of highly mutated proteins for
the NIS-ERPIN; however, we found no statistically significant correlation. This lack of meaningful correlation
was not unexpected since mutation frequencies found in the whole-exome sequencing were only partially in
accordance with mutation frequencies found in target-based sequencing studies8–12. Whether this controversial
outcome is due to possibly inadequate ATC samples investigated in the whole-exome sequencing will be clari-
fied by further examinations. Therefore, future genetic studies may strengthen or weaken the implications of
our centrality analysis.
Beginning with 167 input proteins to create our network and listing the top-20 in each index, we propose here
the essential proteins of the NIS expression regulatory network (Fig. 2). We hypothesized that those centrality
indices that represent the distance and flow of information would be better indicators of essential proteins of
Scientific Reports | (2020) 10:21440 | https://doi.org/10.1038/s41598-020-78574-x 6
Vol:.(1234567890)www.nature.com/scientificreports/
NIS-ERPIN. We also found that several proteins encoded by highly mutated genes of ATC were high-ranked in
these lists. This study can be used to exclude some targets and include other targets in experimental efforts to
restore NIS expression. However, we are aware that NIS downregulation is not the only abnormality that results
in an inability of thyroid cells to uptake iodide, and that NIS translocation is also worth considering15. Neverthe-
less, some proteins of our network probably have a role in the suppression of NIS function in ways other than
expression regulation. For example, it has been shown that β-catenin regulates NIS distribution in thyroid c ells51.
Additionally, NIS inhibitory mutations should be considered, particularly in personalized therapy. In addition
to the complicated manner of NIS suppression, it is worth noting that, to interpret raw data from the network
analysis, careful reflection on biological context and/or experimental data is required. Besides, there are some
limitations regarding the centrality analysis. One of them is different indices could lead to difference on the most
important vertex in a network. Hence , using a proper index depends heavily on the context of the reconstructed
network and should be chosen with a reasonable process. Another limitation is whether a combination of differ-
ent indices is more useful than considering an index alone. However, this issue also depends on the basics and
properties of the reconstructed network. Therefore, one must find or suggest the proper indices in the study based
on the context of the biological problem in the study52. Moreover, PPI networks are affected by false positives
and, have also not yet been completed45, which is a source of inaccuracy in these analyses. Therefore, a more
cautious approach to network analysis results is recommended.
Conclusion
The results of our modularity and centrality analyses suggest a combination therapy approach to induce NIS
expression in ATC cases, particularly if the targets are essential proteins we present in this study. We propose
several genes/proteins in the NIS expression regulatory network as interesting targets for manipulation, including:
AKT1, TP53, PIK3C, MAPK1, MAPK3, SRC, MYC, EGR1, XIAP, BCL2L1, CASP3, and CASP9. Also, several
previously unnoticed proteins which rank high in our analyses might prove to be interesting targets of study.
Moreover, we presume that lower rank proteins of our weighted and unweighted combinatory indices are of
little importance and interest, and that manipulations based on them will probably result in failure due to the
fact that they are not essential enough in the NIS expression regulatory network.
Data availability
Data are available upon request from corresponding authors.
Received: 18 June 2020; Accepted: 18 November 2020
References
1. Haddad, R. I. et al. Anaplastic thyroid carcinoma, version 22015. J. Natl. Compr. Cancer Netw. 13, 1140–1150 (2015).
2. Keutgen, X. M., Sadowski, S. M. & Kebebew, E. Management of anaplastic thyroid cancer. Gland Surg. 4, 44 (2015).
3. Kogai, T. & Brent, G. A. The sodium iodide symporter (NIS): regulation and approaches to targeting for cancer therapeutics.
Pharmacol. Ther. 135, 355–370 (2012).
4. Schmohl, K. A. et al. Reintroducing the sodium–iodide symporter to anaplastic thyroid carcinoma. Thyroid 27, 1534–1543 (2017).
5. Hsieh, Y.-J. et al. Radioiodide imaging and treatment of ARO cancer xenograft in a mouse model after expression of human sodium
iodide symporter. Anticancer Res. 27, 2515–2522 (2007).
6. Liu, Z. & Xing, M. Induction of sodium/iodide symporter (NIS) expression and radioiodine uptake in non-thyroid cancer cells.
PLoS ONE https://doi.org/10.1371/journal.pone.0031729 (2012).
7. Hou, P. et al. Induction of thyroid gene expression and radioiodine uptake in melanoma cells: novel therapeutic implications. PLoS
ONE https://doi.org/10.1371/journal.pone.0006200 (2009).
8. Jeon, M. J. et al. Genomic alterations of anaplastic thyroid carcinoma detected by targeted massive parallel sequencing in a
BRAFV600E mutation-prevalent area. Thyroid 26, 683–690 (2016).
9. Landa, I. et al. Genomic and transcriptomic hallmarks of poorly differentiated and anaplastic thyroid cancers. J. Clin. Investig. 126,
1052–1066 (2016).
10. Pozdeyev, N. et al. Genetic analysis of 779 advanced differentiated and anaplastic thyroid cancers. Clin. Cancer Res. 24, 3059–3068
(2018).
11. Landa, I. et al. Comprehensive genetic characterization of human thyroid cancer cell lines: a validated panel for preclinical studies.
Clin. Cancer Res. 25, 3141–3151 (2019).
12. Woodward, E. L. et al. Genomic complexity and targeted genes in anaplastic thyroid cancer cell lines. Endocr. Relat. Cancer 24,
209–220 (2017).
13. Riesco-Eizaguirre, G. et al. The BRAFV600E oncogene induces transforming growth factor β secretion leading to sodium iodide
symporter repression and increased malignancy in thyroid cancer. Can. Res. 69, 8317–8325 (2009).
14. Choi, Y. W. et al. B-RafV600E inhibits sodium iodide symporter expression via regulation of DNA methyltransferase 1. Exp. Mol.
Med. 46, e120–e120 (2014).
15. Tavares, C. et al. NIS expression in thyroid tumors, relation with prognosis clinicopathological and molecular features. Endocr.
Connect. 7, 78–90 (2018).
16. Oltvai, Z. N. & Barabási, A.-L. Life’s complexity pyramid. Science 298, 763–764 (2002).
17. Koschützki, D. & Schreiber, F. Centrality analysis methods for biological networks and their application to gene regulatory net-
works. Gene Regul. Syst. Biol. https://doi.org/10.4137/GRSB.S702 (2008).
18. Tang, X., Wang, J., Zhong, J. & Pan, Y. Predicting essential proteins based on weighted degree centrality. IEEE/ACM Trans. Comput.
Biol. Bioinf. 11, 407–418 (2013).
19. Li, M., Wang, J., Chen, X., Wang, H. & Pan, Y. A local average connectivity-based method for identifying essential proteins from
the network level. Comput. Biol. Chem. 35, 143–150 (2011).
20. Jeong, H., Mason, S. P., Barabási, A.-L. & Oltvai, Z. N. Lethality and centrality in protein networks. Nature 411, 41–42 (2001).
21. Wuchty, S. Interaction and domain networks of yeast. Proteomics 2, 1715–1723 (2002).
22. Hahn, M. W., Conant, G. C. & Wagner, A. Molecular evolution in large genetic networks: does connectivity equal constraint?. J.
Mol. Evol. 58, 203–211 (2004).
23. Lin, C.-C. et al. Essential core of protein–protein interaction network in Escherichia coli. J. Proteome Res. 8, 1925–1931 (2009).
Scientific Reports | (2020) 10:21440 | https://doi.org/10.1038/s41598-020-78574-x 7
Vol.:(0123456789)www.nature.com/scientificreports/
24. Xiong, W., Xie, L., Zhou, S., Liu, H. & Guan, J. The centrality of cancer proteins in human protein-protein interaction network: a
revisit. Int. J. Comput. Biol. Drug Design 7, 146–156 (2014).
25. Özgür, A., Vu, T., Erkan, G. & Radev, D. R. Identifying gene-disease associations using centrality on a literature mined gene-
interaction network. Bioinformatics 24, i277–i285 (2008).
26. Peng, W. et al. Iteration method for predicting essential proteins based on orthology and protein-protein interaction networks.
BMC Syst. Biol. 6, 87 (2012).
27. Bafna, D. & Isaac, A. E. Identification of target genes in breast cancer pathway using protein-protein interaction network. Can.
Res. 13, 51–58 (2017).
28. Ashtiani, M. et al. A systematic survey of centrality measures for protein-protein interaction networks. BMC Syst. Biol. 12, 80
(2018).
29. Darrouzet, E., Lindenthal, S., Marcellin, D., Pellequer, J.-L. & Pourcher, T. The sodium/iodide symporter: state of the art of its
molecular characterization. Biochimica et Biophysica Acta (BBA)-Biomembranes 1838, 244–253 (2014).
30. Ravera, S., Reyna-Neyra, A., Ferrandino, G., Amzel, L. M. & Carrasco, N. The sodium/iodide symporter (NIS): molecular physiol-
ogy and preclinical and clinical applications. Annu. Rev. Physiol. 79, 261–289 (2017).
31. Chatr-Aryamontri, A. et al. The BioGRID interaction database: 2017 update. Nucleic Acids Res. 45, D369–D379 (2017).
32. Shannon, P. et al. Cytoscape: a software environment for integrated models of biomolecular interaction networks. Genome Res.
13, 2498–2504 (2003).
33. Jalili, M. et al. CentiServer: a comprehensive resource, web-based application and R package for centrality analysis. PLoS ONE 10,
e0143111 (2015).
34. Szklarczyk, D. et al. STRING v11: protein–protein association networks with increased coverage, supporting functional discovery
in genome-wide experimental datasets. Nucleic Acids Res. 47, D607–D613 (2019).
35. Bastian, M., Heymann, S. & Jacomy, M. In: Third international AAAI conference on weblogs and social media.
36. Blondel, V. D., Guillaume, J.-L., Lambiotte, R. & Lefebvre, E. Fast unfolding of communities in large networks. J. Stat. Mech: Theory
Exp. 2008, P10008 (2008).
37. Kunstman, J. W. et al. Characterization of the mutational landscape of anaplastic thyroid cancer via whole-exome sequencing.
Hum. Mol. Genet. 24, 2318–2329 (2015).
38. Shang, J. et al. Network analyses of integrated differentially expressed genes in papillary thyroid carcinoma to identify characteristic
genes. Genes 10, 45 (2019).
39. Hossain, M. et al. Network-based genetic profiling reveals cellular pathway differences between follicular thyroid carcinoma and
follicular thyroid adenoma. Int. J. Environ. Res. Public Health 17, 1373 (2020).
40. Marx, K. et al. Cell death induced by 131I in a differentiated thyroid carcinoma cell line in vitro: Necrosis or apoptosis?. Nucl. Med.
Commun. 27, 353–358 (2006).
41. Huang, M. et al. Ectopic expression of the thyroperoxidase gene augments radioiodide uptake and retention mediated by the
sodium iodide symporter in non–small cell lung cancer. Cancer Gene Ther. 8, 612–618 (2001).
42. Aranda, N., Sosa, S., Delgado, G., Aceves, C. & Anguiano, B. Uptake and antitumoral effects of iodine and 6-iodolactone in dif-
ferentiated and undifferentiated human prostate cancer cell lines. Prostate 73, 31–41 (2013).
43. Jung, K. O. et al. Relationship between apoptosis imaging and radioiodine therapy in tumor cells with different sodium iodide
symporter gene expression. Mol. Imaging https://doi.org/10.2310/7290.2014.00050 (2015).
44. Xia, W. et al. Small activating RNA upregulates NIS expression: promising potential for hepatocellular carcinoma endoradiotherapy.
Cancer Gene Ther. 23, 333–340 (2016).
45. Sanz-Pamplona, R. et al. Tools for protein-protein interaction network analysis in cancer research. Clin. Transl. Oncol. 14, 3–14
(2012).
46. Barneh, F. et al. Integrated use of bioinformatic resources reveals that co-targeting of histone deacetylases, IKBK and SRC inhibits
epithelial-mesenchymal transition in cancer. Brief. Bioinform. 20, 717–731 (2019).
47. Lakshmanan, A. et al. Modulation of thyroidal radioiodide uptake by oncological pipeline inhibitors and Apigenin. Oncotarget 6,
31792 (2015).
48. Liu, L. et al. Wild-Type P53 induces sodium/iodide symporter expression allowing radioiodide therapy in anaplastic thyroid cancer.
Cell. Physiol. Biochem. 43, 905–914 (2017).
49. Oh, J. M. et al. Reverting iodine avidity of radioactive-iodine refractory thyroid cancer with a new tyrosine kinase inhibitor (K905-
0266) excavated by high-throughput NIS (sodium iodide symporter) enhancer screening platform using dual reporter gene system.
Oncotarget 9, 7075 (2018).
50. Joy, M. P., Brock, A., Ingber, D. E. & Huang, S. High-betweenness proteins in the yeast protein interaction network. Biomed. Res.
Int. 2005, 96–103 (2005).
51. Lan, L. et al. Inhibiting β-catenin expression promotes efficiency of radioiodine treatment in aggressive follicular thyroid cancer
cells probably through mediating NIS localization. Oncol. Rep. 37, 426–434 (2017).
52. Martin, T., Zhang, X. & Newman, M. E. Localization and centrality in networks. Phys. Rev. E 90, 052808 (2014).
Acknowledgements
The authors are grateful to Mr. Andrew Grimshaw for his English language comments on the initial draft of
the manuscript. Also, the authors are thankful to Dr. Mahmood Naderi for his helpful suggestions and advice.
Author contributions
H.R., H.S.1, S.T., Y.A., and V.H. designed the study. H.R., H.S.1, and S.T. provided the information. Y.A., F.G. and
H.R. performed experiments. H.R., H.S.1, S.M.S., H.S.2, and V.H. analyzed the data. H.R. wrote the manuscript,
and all authors critically reviewed and approved the final version of the manuscript. H.S.1: Hilda Samimi; H.S.2:
Hamed Samadi.
Funding
This research did not receive any specific grant from a funding agency in the public, commercial, or not-for-
profit sector.
Competing interests
The authors declare no competing interests.
Additional information
Supplementary information The online version contains supplementary material available at https://doi.
org/10.1038/s41598-020-78574-x.
Scientific Reports | (2020) 10:21440 | https://doi.org/10.1038/s41598-020-78574-x 8
Vol:.(1234567890)www.nature.com/scientificreports/
Correspondence and requests for materials should be addressed to Y.A. or V.H.
Reprints and permissions information is available at www.nature.com/reprints.
Publisher’s note Springer Nature remains neutral with regard to jurisdictional claims in published maps and
institutional affiliations.
Open Access This article is licensed under a Creative Commons Attribution 4.0 International
License, which permits use, sharing, adaptation, distribution and reproduction in any medium or
format, as long as you give appropriate credit to the original author(s) and the source, provide a link to the
Creative Commons licence, and indicate if changes were made. The images or other third party material in this
article are included in the article’s Creative Commons licence, unless indicated otherwise in a credit line to the
material. If material is not included in the article’s Creative Commons licence and your intended use is not
permitted by statutory regulation or exceeds the permitted use, you will need to obtain permission directly from
the copyright holder. To view a copy of this licence, visit http://creativecommons.org/licenses/by/4.0/.
© The Author(s) 2020
Scientific Reports | (2020) 10:21440 | https://doi.org/10.1038/s41598-020-78574-x 9
Vol.:(0123456789)You can also read