Effects of freezing rate on structural changes in l lactate dehydrogenase during the freezing process
←
→
Page content transcription
If your browser does not render page correctly, please read the page content below
www.nature.com/scientificreports
OPEN Effects of freezing rate
on structural changes in l‑lactate
dehydrogenase during the freezing
process
Haena Park1, Jun‑Young Park1, Kyung‑Min Park2,5 & Pahn‑Shick Chang1,3,4,5*
Freezing is a common method for improving enzyme storage stability. During the freezing process,
the freezing rate is an important parameter that can affect protein stability. However, there is limited
information on the denaturation mechanisms and protein conformational changes associated with
the freezing rate. In this study, the effects of freezing rate on activity loss and conformational changes
in a model enzyme, l-lactate dehydrogenase, were evaluated. Enzyme solutions were frozen at
various rates, from 0.2 to 70.6 °C/min, and ice seeding was conducted to reduce supercooling. The
results demonstrated that fast freezing results in activity loss, structural changes, and aggregation.
The residual activities at freezing rates of 0.2, 12.8, and 70.6 °C/min were 77.6 ± 0.9%, 64.1 ± 0.4%,
and 44.8 ± 2.0%, respectively. As the freezing rate increased, the degree of dissociation and unfolding
increased significantly, as determined using blue native-polyacrylamide gel electrophoresis and
fluorescence spectroscopy. Moreover, a large number of amyloid aggregates were detected in
samples frozen at a fast freezing rate (70.6 °C/min). The enzyme inactivation mechanism induced
by fast freezing was proposed in terms of increased dehydration at the enzyme surface and an ice/
unfroze solution interface, which could be helpful to establish a common understanding of enzyme
inactivation during the freezing process.
Freezing is a common method used to facilitate the storage stability of enzymes in research and industry1. In a
frozen state, the rates of chemical reactions (e.g., oxidation, hydrolysis, deamidation, etc.) and physical degrada-
tion reactions (e.g., aggregation, precipitation, etc.) decelerate drastically due to decreased molecular mobility
in the solution at low temperature and high viscosity2. Therefore, most enzymes preserved in a frozen state can
maintain their initial activity and structure over long-term s torage1,3. However, although freezing can improve
protein stability, several enzymes, for example, l-lactate dehydrogenase (LDH), catalase, and β-galactosidase,
are susceptible to freezing and may lose activity during the p rocess4–6. Various physicochemical changes occur
during freezing that influence protein s tability7. Once water is crystallized into ice, water molecules are eliminated
from the liquid phase, decreasing protein-bound water m olecules1. Moreover, as the ice crystals grow, the con-
centration of the solute rapidly increases, leading to the formation of an interface between the ice and unfrozen
solution8,9. These changes could affect the conformational stability of proteins10.
There has been increased interest in the rational design of the freezing process to minimize activity loss11.
Until now, the process for optimizing freezing or freeze-drying of enzyme is still empirical and nonsystematic
approach based on trial and error, controlling freezing conditions (e.g., type of buffer salts, surfactants, sac-
charides, and etc.)3. The empirical approach collecting data from multiple trials will be time-consuming and no
guarantees of product quality. On the other hand, a systematic approach that is based on well-accepted scientific
principles would increase production efficiency and achieve consistent high quality of products. However, there
are still limitations to conduct the rational design of the freezing process, because the enzyme deactivation
mechanism during the freezing process is not fully elucidated. Therefore, a study of individual stress factors can
aid the design of a freezing process that minimizes stress and ensures the desired final product quality. During
1
Department of Agricultural Biotechnology, Seoul National University, Seoul 08826, Republic of
Korea. 2Department of Food Science and Biotechnology, Wonkwang University, Iksan 54538, Republic of
Korea. 3Center for Food and Bioconvergence, Seoul National University, Seoul 08826, Republic of Korea. 4Research
Institute of Agriculture and Life Sciences, Seoul National University, Seoul 08826, Republic of Korea. 5Center for
Agricultural Microorganism and Enzyme, Seoul National University, Seoul 08826, Republic of Korea. *email:
pschang@snu.ac.kr
Scientific Reports | (2021) 11:13643 | https://doi.org/10.1038/s41598-021-93127-6 1
Vol.:(0123456789)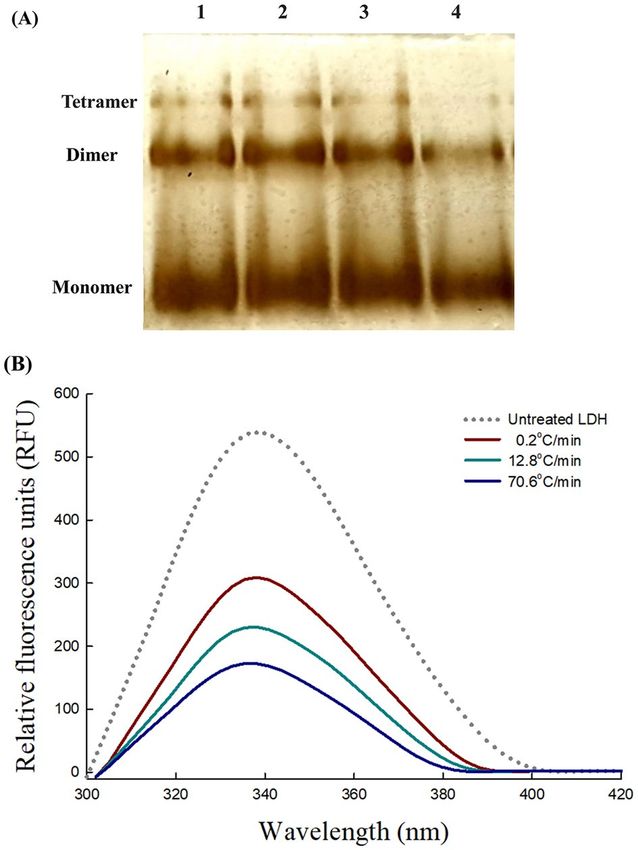
www.nature.com/scientificreports/
Figure 1. Schematic diagrams of the three different freezing methods. (A) Air-mediated freezing, (B) liquid-
mediated freezing, and (C) freezing in liquid nitrogen ( N2).
the freezing process, the freezing rate is one of the critical conditions determining enzyme stability, and a cor-
relation between enzyme activity and freezing rate has been reported by several researchers4,12. However, few
studies and industrial cases have considered and controlled the freezing rate during the freezing process. Fur-
thermore, few studies have analyzed the effect of freezing rate on enzyme structure. Determining the degree of
structural change according to the freezing rate is critical because protein structure is closely linked to stability.
Furthermore, the enzyme inactivation mechanism during freezing can be suggested based on the results of the
analysis of structural changes. The in-depth understanding of the inactivation mechanism is eventually required
for a rational designing of the freezing process.
Therefore, in the present study, the effects of freezing rate on enzyme stability during the freezing process
were evaluated by measuring activity loss and conformational changes. LDH (EC 1.1.1.27) was used as the
model enzyme because it is a freeze-labile protein that loses its activity after freezing4,8,13. Three different freez-
ing methods and rates were used: freezing in a deep freezer (− 75 °C), liquid-mediated freezing (LMF), and
freezing in liquid nitrogen. The LMF system, based on freezing the sample in a container filled with isopropyl
alcohol (IPA), was designed to easily and finely control the freezing rate and heat transfer rate by modulating
solvent temperature. Conformational changes in LDH according to the freezing rate and degree of dissociation
and unfolding were determined using blue native-polyacrylamide gel electrophoresis (BN-PAGE) and fluores-
cence spectroscopy. Dynamic light scattering (DLS) and fluorescence microscopy were used to analyze the size
distribution and morphology of the denatured LDH after freezing.
Materials and methods
Materials. LDH (type II, from rabbit muscle, suspended in 3.2 M (NH4)2SO4, 830 units/mg protein),
β-nicotinamide adenine dinucleotide (NADH) in a reduced form, and Tris base were purchased from Sigma-
Aldrich (St. Louis, MO, USA). Pyruvate of 97.0% purity was obtained from Kanto Chemical Co. (Tokyo, Japan).
IPA of 99.5% purity was purchased from Samchun Chemical Co. (Seoul, Republic of Korea). All other chemicals
were of analytical grade.
l‑Lactate dehydrogenase assay. The LDH enzyme assay was performed at 25 °C using a slight modifica-
tion of Bagchi’s method14. The reaction mixture consisted of 11.4 mL of 0.2 M Tris–HCl buffer (pH 7.4), 0.4 mL
of 6.6 mM NADH, 0.4 mL of 30 mM pyruvate, and 0.4 mL of 1.8 μg/mL LDH solution. The reaction was initiated
by the addition of the enzyme solution. LDH activity was determined as the reduced absorbance of NADH at
340 nm using a spectrophotometer (UV-2450, Shimadzu, Kyoto, Japan). One unit of LDH activity was defined as
the amount of enzyme that converted 1 μmol of NADH into 1 μmol of NAD per minute under assay conditions.
Protein concentration was determined spectrophotometrically at 280 and 260 nm using the following Eq. (1):
Protein concentration (mg/mL) = (1.55 × A280 ) − (0.76 × A260 ) (1)
where A280 and A260 are the absorbance values at wavelengths of 280 and 260 nm, respectively.
Freezing process. The LDH was dissolved in 0.2 M Tris–HCl buffer (pH 7.4) at a final concentration of
20 μg/mL (16.6 units/mL). The composition of the LDH solution can affect protein stability during freezing4.
The total sample volume was 1 mL, and samples were frozen in 2 mL polypropylene tubes. Enzyme samples
were frozen at different freezing rates using three different methods: air-mediated freezing, the LMF system, and
freezing in liquid nitrogen (Fig. 1). For each method, ice seeding was performed before freezing. Ice nucleation
was controlled at a specific temperature to ensure reproducibility of the freezing r ate7,15. In the first step of ice
seeding, enzyme samples were cooled to − 1 °C (the ice nucleation temperature) in a chilling block (Cole-Parmer
Scientific Reports | (2021) 11:13643 | https://doi.org/10.1038/s41598-021-93127-6 2
Vol:.(1234567890)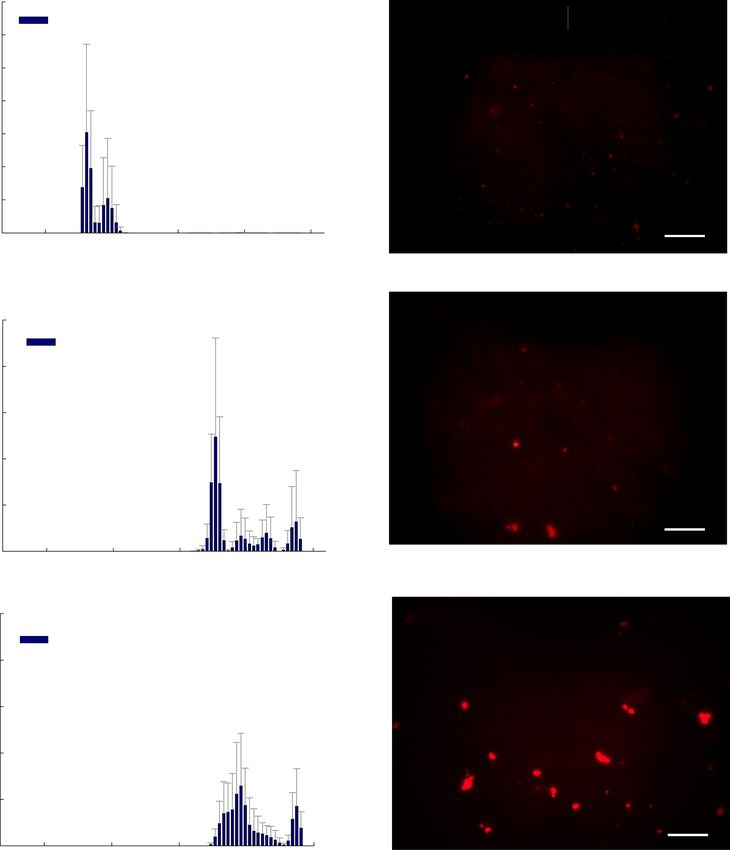
www.nature.com/scientificreports/
Benchtop, Vernon Hills, IL, USA) and held for 2 min. In the second step, a tweezer, pre-cooled in liquid nitrogen
for 35 s, was briefly dipped into the sample.
All samples were frozen until they reached the final temperature (− 50 °C), followed by thawing in a 25 °C
water bath for 4 min at a thawing rate of 14 °C/min. The LDH assay was performed twice to quantify activity
loss, before and after freezing. LDH structural analysis was carried out on samples freeze-thawed five times and
used to detect subtle changes. The temperature of the enzyme solution during freezing was monitored using a
thermometer (MTM-380SD, Lutron, Taipei, Taiwan). A thermocouple was mounted between the surface and
bottom of the enzyme solution. Temperature changes were recorded using a data logger attached to the ther-
mometer. The freezing rate was calculated as the average of post-nucleation cooling rates in the temperature
range of 0 to − 5 °C, known as the zone of maximum ice crystal formation16.
The liquid‑mediated freezing system. The LMF system was designed to control the freezing rate of the
enzyme solutions, with each enzyme solution frozen in a container filled with pre-cooled IPA (Fig. 1). The freez-
ing rate was determined using the temperature difference between the solution and the IPA. The temperature
difference was caused by the pre-cooled IPA temperature, which was modulated by the cooling time of the solu-
tion in a deep freezer (− 75 °C). IPA (400 mL) was added to each IPA container, a polypropylene cylinder. IPA
temperature was measured as described in the section above.
Blue native‑polyacrylamide gel electrophoresis. BN-PAGE was performed using 0.002% (w/v)
Coomassie Blue G-250 for the cathode buffer (pH 7.0), 3.3% polyacrylamide for the stacking gel (pH 7.0), and
6.5% polyacrylamide for the resolving gel (pH 7.0). Electrophoresis was conducted at 90 V and 4 °C for 4 h.
After electrophoresis, the gel was incubated in a fixing solution (40% [v/v] ethanol, 10% [v/v] acetic acid) for 1 h
and washed in distilled water for 9 h. The gel was then sensitized in 0.02% (w/v) sodium thiosulfate for 1 min.
Silver staining was conducted at 4 °C using 0.1% (w/v) silver nitrate solution with a gentle rocking motion. The
gel was developed in a solution consisting of 3% (w/v) sodium carbonate and 0.05% (v/v) formaldehyde. The
formaldehyde was added just before use. Development was terminated by adding 5% (v/v) acetic acid solution.
Fluorescence spectroscopy. Fluorescence spectroscopy was performed with a fluorescence spectrom-
eter (FluoroMate FS-2, Scinco Co., Seoul, Republic of Korea). Intrinsic fluorescence emission spectra of freeze-
thawed 1 mL enzyme solutions (16.6 units/mL) were recorded at 25 °C in a 10 mm optical path length quartz
cuvette (Hellma Analytics, Müllheim, Germany). The excitation wavelength was 280 nm, and emission spectra
were collected from 300–600 nm in 0.1-nm increments. The slit width for excitation and emission was 5 nm, and
the photomultiplier tube voltage was set to 400 V.
Fluorescence microscopy. In 100 μL volumes (16.6 units/mL), freeze-thawed enzyme solution was mixed
and stained with 1 μL of 100 μM Nile red solution in ethanol before microscopic examination. Observations
were made under a fluorescence microscope (DE/Axio Imager A1 microscope, Carl Zeiss, Oberkochen, Ger-
many) equipped with a Zeiss filter cube no. 15 (EX BP 546/12, BS FT 580, EM LP 590) and a 100 × Plan-Neofluar
objective lens. Images were acquired with an AxioCam HRC CCD camera (Carl Zeiss) and processed using
AxioVision software (Ver. 4.8, Carl Zeiss).
Dynamic light scattering. The size distribution of enzyme aggregates was analyzed via DLS using a Zeta-
sizer Nano ZS90 instrument (Malvern Instruments Ltd., Worcestershire, UK). Scattered light intensity was mon-
itored at 90°, and hydrodynamic sizes were calculated using the autocorrelation function of the Zetasizer Nano
software. Freeze-thawed 1 mL enzyme solutions (16.6 units/mL) were added to disposable cuvettes (Ratiolab,
Dreieich, Germany) with a path length of 10 mm. The solvent refractive index was set to 1.33, the viscosity of
dispersant was 0.8872 cP, and the dispersant dielectric constant was 78.5. All measurements were carried out at
4 °C to suppress additional aggregation due to heat.
Results and discussion
Effect of freezing rate on the activity of l‑lactate dehydrogenase. The LMF system was devised
to freeze the enzyme solution at various freezing rates to determine the effect of freezing rate on enzyme stability
during the freezing process. This system controls the sample freezing rate by changing the initial temperature
(Ti) of the solvent (IPA). The temperature profiles of the enzyme solution monitored at each Ti showed that the
freezing rate increased as Ti decreased (Fig. 2A). In all freezing conditions, the temperature decreased continu-
ally even in the region of phase change because of freezing point depression of the enzyme solution (0.2 M Tris–
HCl) with a high concentration of solutes.
Freezing rate can be expressed by a variety of definitions including time–temperature methods, the velocity
of ice front, appearance of a frozen sample, and thermal m ethods17. The time–temperature method, temperature
change per unit time or time to transverse a given range of temperatures, is the most frequently used when the ice
crystal structure influences the quality of a frozen product. The freezing rate was calculated in the temperature
range of 0 to − 5 °C (Table 1), known as the zone of maximum ice crystal formation at which nucleation and ice
crystal growth occur. Because, the zone of the maximum is a critical region to determine the freezing rate, as the
ice crystal size is determined by the time taken for the phase change18. The freezing rate of each method increased,
as expected, in the following order: air-mediated freezing (0.2 °C/min) < LMF (0.4–12.8 °C/min) < freezing in
liquid nitrogen (70.6 °C/min). Notably, supercooling did not occur during the freezing process due to ice seeding
(Fig. 2A). The ice nucleation temperature in all freezing treatment groups was controlled at a specific temperature
Scientific Reports | (2021) 11:13643 | https://doi.org/10.1038/s41598-021-93127-6 3
Vol.:(0123456789)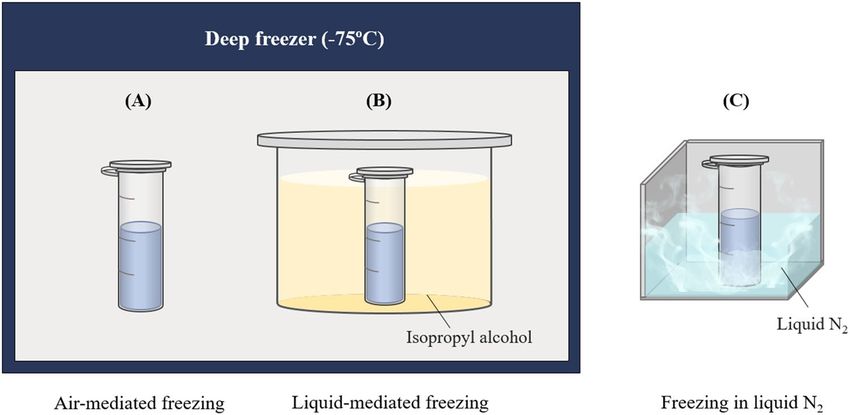
www.nature.com/scientificreports/
(A) 20
LMF (Ti = -10o C)
LMF (Ti = -20o C)
LMF (Ti = -30o C)
LMF (Ti = -40o C)
Temperature (oC)
0 LMF (Ti = -50o C)
-20
-40
0 5 10 15 20
Time (min)
Figure 2. (A) Freezing curves of the l-lactate dehydrogenase (LDH) solution (20 μg/mL, 0.2 M Tris–HCl
buffer, pH 7.4) at different liquid-mediated freezing (LMF) conditions [ Ti] = − 10, − 20, − 30, − 40, or − 50 °C). Ti,
the temperature of isopropyl alcohol just before freezing LDH samples. (B) Effect of freezing rate on the activity
of LDH dissolved in 0.2 M Tris–HCl buffer (pH 7.4). Results are expressed as the means ± SDs. Asterisks (*)
indicate significant differences (p < 0.05). NS non-significant difference.
Freezing methods Freezing rate ( °C/min) Residual activity (%)
Air-mediated freezing 0.2 ± 0.01 77.6 ± 0.9a
− 10 0.4 ± 0.04 83.3 ± 1.2a
− 20 1.2 ± 0.19 80.9 ± 4.1a
LMF Ti (°C) − 30 2.5 ± 0.41 81.8 ± 1.4a
− 40 3.8 ± 2.06 78.2 ± 1.2a
− 50 12.8 ± 3.30 64.1 ± 0.4b
Freezing in liquid nitrogen 70.6 ± 8.09 44.8 ± 2.0c
Table 1. Residual activities of l-lactate dehydrogenase according to freezing rate. LMF liquid-mediated
freezing, Ti initial temperature of isopropyl alcohol. a–c Different superscript letters denote significant
differences between treatments (p < 0.05). The means were compared using ANOVA and ranked using
Duncan’s multiple range test.
(− 1 °C). Enzyme solutions frozen using an identical method can have a different size distribution of ice crystals
from vial to vial because ice nucleation is a stochastic p rocess1. Therefore, precisely controlling ice nucleation
was necessary to investigate the interfacial area effect, which is affected by ice crystal size, on enzyme stability
during the freezing process. Supercooling was not triggered, indicating that ice nucleation was well controlled
in all treatment groups.
In the thawing process, the ice recrystallization is also an additional damage factor to proteins4. The water
molecules on the small ice crystal surface having high free energy are melted and migrate to the large ice crystal
Scientific Reports | (2021) 11:13643 | https://doi.org/10.1038/s41598-021-93127-6 4
Vol:.(1234567890)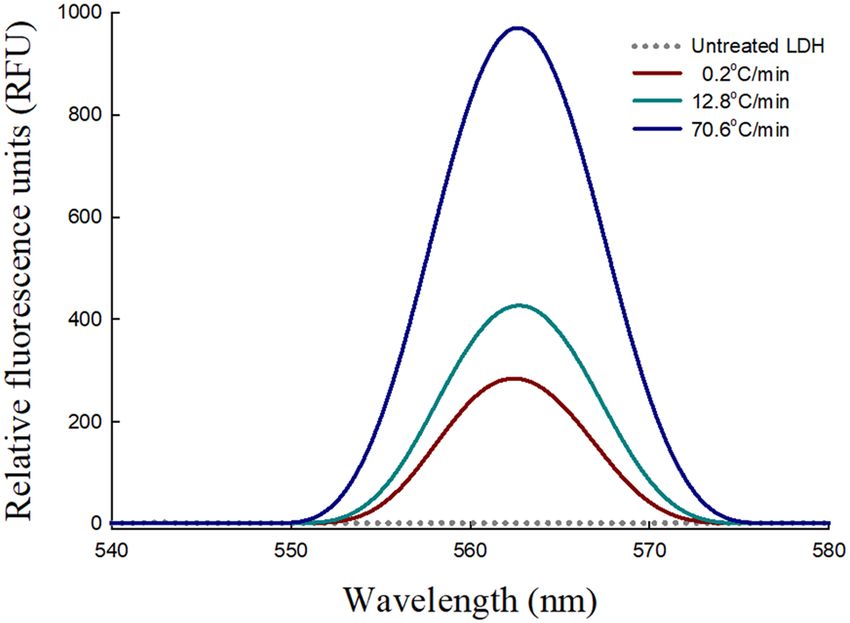
www.nature.com/scientificreports/
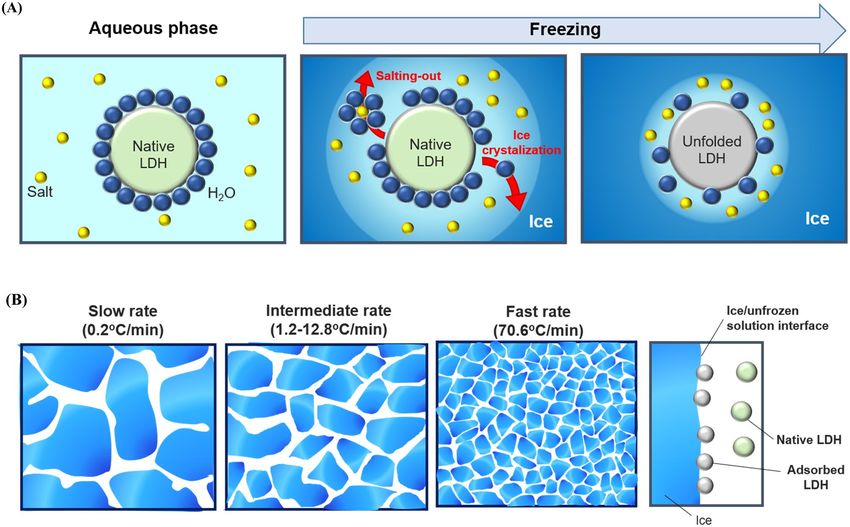
Figure 3. Schematic illustration of the mechanisms of enzyme destabilization by fast freezing. (A) Increased
dehydration at the enzyme surface. (B) Formation of an ice/unfrozen solution interface.
surface, resulting in ice crystal growth to decrease free energy (i.e., ice recrystallization)18. Thawing slowly
generally causes ice recrystallization to be more significant, causing more protein denaturation (Supplementary
Fig. S1). Therefore, LDH activity was assayed after fast thawing (14 °C/min) to minimize the effect of recrystal-
lization. As shown in Fig. 2B, the residual activity of LDH decreased drastically as the freezing rate increased.
When the freezing rate was relatively slow (0.18–3.76 °C/min), the highest residual activity levels were observed
(80.3 ± 2.2%). At the intermediate freezing rate (12.8 °C/min), the residual activity was 64.1 ± 0.4%, decreasing to
44.8 ± 2.0% at the fastest freezing rate of 70.6 °C/min; thus, more than half of the initial activity was lost. These
results indicate that enzyme activity loss can be minimized at relatively low freezing rates.
As indicated, loss of enzyme activity during the freezing process could be caused by ice crystallization (Fig. 3).
In the aqueous phase, the interaction between proteins and water molecules plays an important role in protein
structural stability10. However, once the water is crystallized into ice, the protein surface is dehydrated as water
molecules around the protein are removed, which can destabilize protein structure19. Moreover, as the ice crystals
grow, the solute concentration increases drastically20. Under a freeze-concentrated state, the interaction between
the solute and water molecules strengthens, and the number of water molecules interacting with proteins is
reduced. Consequently, fast freezing rates lead to fast dehydration rates, causing severe protein damage. The
drastic decrease in various interactions between water molecules and proteins, which contribute to protein
structural stability, can affect protein conformation. Alternatively, previous research implicated the ice/unfro-
zen solution interface as a major contributor to protein damage during freezing5. When proteins are adsorbed
onto the ice/unfrozen solution interface, they can lose their original structure, which leads to activity loss21. The
results of this study support this assumption because fast freezing results in a large interfacial area and greater
damage, leading to overall enzyme activity loss. Consequently, these results strengthen the above two hypotheses.
Dissociation and unfolding of l‑lactate dehydrogenase after fast freezing. Figure 2B illustrates
that the freezing rate is a significant determinant of final enzyme activity after freezing. It was also expected
that the freezing rate would change the protein structure based on enzyme structure–function associations. For
LDH, a tetrameric enzyme, subunit dissociation represents a critical structural change as it causes loss of activ-
ity. The BN-PAGE gel image of LDH after freezing at different rates (0.2, 12.8, and 70.6 °C/min) is presented in
Fig. 4A. In this gel system, three bands were observed in each lane, distributed according to size22. The intensities
of the bands assigned to tetramers and dimers were significantly weaker at the fastest freezing rate (70.6 °C/min)
compared with the low and moderate freezing rates (0.2 and 12.8 °C/min). These results indicate that a faster
freezing rate promotes protein dissociation. Three bands were also detected in the untreated sample lane, but
those were caused by the Coomassie Blue G250 used in the cathode b uffer23. The dye has a mild negative charge,
essential for the migration of proteins, but causes some dissociation of p roteins22. Therefore, freezing induces
Scientific Reports | (2021) 11:13643 | https://doi.org/10.1038/s41598-021-93127-6 5
Vol.:(0123456789)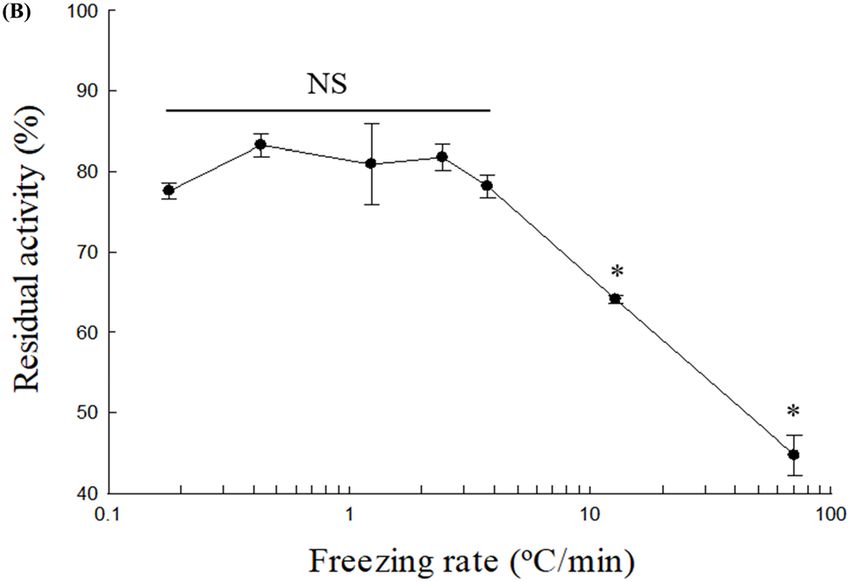
www.nature.com/scientificreports/
Figure 4. (A) Blue native-polyacrylamide gel electrophoresis profile of LDH after silver staining following the
freeze–thaw process repeated five times. The concentration of the LDH solution was 40 μg/mL. Lane 1 was for
untreated LDH, Lanes 2, 3, and 4 were for freeze-thawed LDH treated at freezing rates of 0.2, 12.8, and 70.6 °C/
min, respectively. The full-sized gel is presented in the supplemental information (Supplementary Fig. S2). (B)
Intrinsic fluorescence emission spectra (300–420 nm) of 20 μg/mL LDH in 0.2 M Tris–HCl buffer (pH 7.4)
after the freeze–thaw process was repeated five times. LDH solution was frozen at a freezing rate of 0.2, 12.8, or
70.6 ºC/min. The frozen samples were thawed in a water bath at 25 ºC for 5 min before analysis.
quaternary structural changes, and an increased freezing rate accelerates denaturation. The loss of the LDH qua-
ternary structure was one of the major structural changes that occurred during fast freezing.
When multimeric proteins are dissociated, they can easily unfold because their structural stability is lower
than that of intact proteins. The fluorescence signal of tryptophan in proteins is sensitive to their surroundings
and changes according to protein folding status24, making fluorescence spectroscopy suitable for detecting sub-
tle conformational changes induced by fast freezing. There was a significant decrease in fluorescence emission
intensity at 340 nm as the freezing rate increased (Fig. 4B). LDH frozen at 70.6 °C/min exhibited the largest
decrease in fluorescence emission intensity, to 68.2 ± 3.0% compared with the native state (i.e., untreated sample).
The results suggest that fast freezing also causes tertiary structural changes in the enzyme. These conformational
changes were confirmed by the maximum emission wavelength ( Emax) shift of the tryptophan residues, which
depends on the chemical e nvironment25. The E max exhibited a blue shift at the freezing rate of 70.6 °C/min (from
339–335 nm). For LDH, which contains tryptophan residues on its surface in the folded state, a blue shift can
occur when tertiary conformational changes lead to the burying of tryptophan residues in the protein core26. Also,
a significant drop in the intrinsic fluorescence intensity coupled with the blue shift can be described as aggrega-
tion. When tryptophans are accessible to quenchers such as histidines, phenylalanines, and disulfide bonds upon
aggregation, the tryptophan fluorescence intensity decrease27. Consequently, the fast freezing caused quaternary
and tertiary structural changes and aggregate formation. The degree of conformational change increased at the
fast freezing rate, emphasizing the effect of freezing-induced damage in proteins.
The effect of freezing rate on the aggregation of l‑lactate dehydrogenase. Aggregate forma-
tion represents a quality defect in protein products because it decreases total activity, and aggregates can become
nuclei for the growth of larger clusters. Thus, it is important to analyze the conditions that trigger aggregate
formation. A blue shift in fluorescence spectroscopy can be attributed to protein aggregation due to buried
tryptophan residues accumulating in the protein. As the enzyme loses its quaternary and tertiary structure after
freezing, low conformational stability increases the possibility of aggregate formation. DLS analysis was car-
ried out to measure the particle size distribution in freeze-thawed enzyme samples and determine the effect of
freezing rate on aggregate formation. DLS is suitable for analyzing colloidal systems such as protein solutions28;
Scientific Reports | (2021) 11:13643 | https://doi.org/10.1038/s41598-021-93127-6 6
Vol:.(1234567890)www.nature.com/scientificreports/
(A) 70
(B)
0.2oC/min 0.2℃/min
60
50
Volume (%)
40
30
20
10
20 μm
0
1 10 100 1000 10000
Size (Diameter, nm)
50
12.8℃/min
12.8oC/min
40
Volume (%)
30
20
10
20 μm
0
1 10 100 1000 10000
Size (Diameter, nm)
50
70.6℃/min
70.6oC/min
40
Volume (%)
30
20
10
20 μm
0
1 10 100 1000 10000
Size (Diameter, nm)
Figure 5. (A) Dynamic light scattering analysis of 120 μg/mL LDH in 0.2 M Tris–HCl buffer (pH 7.4) after
the freeze–thaw process was repeated five times. The freezing rates were 0.2, 12.8, and 70.6 °C/min. (B) Nile
Red fluorescence micrographs of 20 μg/mL LDH in 0.2 M Tris–HCl (pH 7.4) after the freeze–thaw process was
repeated five times. LDH solution was frozen at a freezing rate of 0.2, 12.8, or 70.6ºC/min. The frozen samples
were thawed in a water bath at 25 ºC for 5 min before analysis.
however, in a multimodal distribution, the size distribution as expressed by light scattering intensity was skewed
to large particles because of their high s ensitivity29. Thus, the size distribution of protein aggregates should be
expressed as volumes converted from intensity readings to reduce the emphasis on large particles. In contrast to
untreated LDH (0.6 nm diameter, data not shown), large particles were detected in all freezing-treated groups
(Fig. 5A). At the lowest freezing rate (0.2 °C/min), most particles had a diameter of approximately 10 nm. At
higher freezing rates (12.8 and 70.6 °C/min), the proportion of particles with a size of approximately 1000 nm
Scientific Reports | (2021) 11:13643 | https://doi.org/10.1038/s41598-021-93127-6 7
Vol.:(0123456789)www.nature.com/scientificreports/
Figure 6. Intrinsic fluorescence emission spectra (540–580 nm) of 20 μg/mL LDH in 0.2 M Tris–HCl buffer
(pH 7.4) after the freeze–thaw process was repeated five times. LDH solution was frozen at a freezing rate of 0.2,
12.8, or 70.6º C/min. The frozen samples were thawed in a water bath at 25 ºC for 5 min before analysis.
increased. The proportion of particles larger than 400 nm accounted for 42.2% of total particles at 12.8 °C/min
and 92.9% at 70.6 °C/min. Larger, aggregated particles were formed as the freezing rate increased.
Freeze-thawed samples were stained with Nile red and visualized using fluorescence microscopy to confirm
the formation of large particles. Nile red emits strong fluorescence upon binding to hydrophobic surfaces of
proteins exposed during conformational c hanges30. Therefore, Nile red staining allowed more effective visu-
alization and detection of LDH protein aggregates in the fluorescence photomicrographs. Red dots indicating
aggregates were not observed, as expected, in untreated LDH samples (data not shown). By contrast, red dots
were detected in freeze-treated LDH samples (Fig. 5B), demonstrating that aggregation was induced by freezing.
These microscopic images also showed that the fluorescence emission intensity and red particle size increased
with the freezing rate, consistent with the DLS results. It was concluded that fast freezing caused severe aggrega-
tion, which results from structural changes. In general, non-biological particles such as nanoparticles are prone
to aggregation during slow freezing which allows the significant exclusion of nanoparticles from the ice crystal,
resulting in a ggregation31. On the contrary, LDH, which is a biological particle, is vice versa, because denatured
proteins tend to oligomerize by various interactions between amino acid residues. Therefore, fast freezing of
LDH caused structural changes and following aggregation, corresponding to these explanations. The formation
of aggregates gives insight into the enzyme deactivation mechanism during the fast freezing process. The multi-
meric LDH lost its quaternary structure during the freezing process, and the dissociated subunits easily unfolded
because of their low structural stability. They could then be re-assembled based on hydrophobic interactions. In
the case of fast-frozen LDH, subunits dissociated from LDH formed a greater amount of aggregates.
Interestingly, in the fluorescence spectroscopy analysis, unique elements in the fluorescence emission spectra
of freeze-thawed LDH solution were detected at approximately 564 nm (Fig. 6). A significant increase in intensity
was observed as the freezing rate increased. The intrinsic fluorescence of proteins stems from aromatic residues;
however, recent research has identified a novel intrinsic protein fluorescence pattern in the visible range, despite
excitation in the UV range32. This unique emission pattern is probably due to amyloid aggregates, which have a
high proportion of β-sheets33. It is suggested that extensive arrays of hydrogen bonds in β-sheet structures give
rise to electron delocalization, which shifts fluorescence emissions into the visible r ange34. Thus, the intrinsic
fluorescence can be an indicator of amyloid formation, which is supported by recent reports17,35,36. The extent of
amyloid formation after the freezing process and fluorescence intensity exhibited a positive correlation; hence,
these results demonstrated that the fast freezing of LDH caused the amyloid aggregation.
Conclusions
This study investigated the effects of freezing rate on a model enzyme’s activity and structure after the freezing
process. The decreased enzyme activity after fast freezing demonstrated that LDH was severely destabilized as
the freezing rate increased. Analysis of conformational changes and the freezing rate showed that the degree of
dissociation and unfolding increased during fast freezing compared with slow freezing. The unfolded proteins
aggregated, mostly as amyloids. This phenomenon would be associated with the increased rate of dehydration at
the protein surface and the adsorption of proteins onto the ice/unfrozen solution interface. Consequently, this
study is an important attempt to understand the enzyme inactivation mechanism during fast freezing. Further
researches on various freeze-labile enzymes would be required to establish a common understanding of freezing
enzymes for a rational designing of the freezing process, which would increase production efficiency and achieve
consistent high quality of products in industry.
Scientific Reports | (2021) 11:13643 | https://doi.org/10.1038/s41598-021-93127-6 8
Vol:.(1234567890)www.nature.com/scientificreports/
Received: 1 February 2021; Accepted: 16 June 2021
References
1. Kasper, J. C. & Friess, W. The freezing step in lyophilization: Physico-chemical fundamentals, freezing methods and consequences
on process performance and quality attributes of biopharmaceuticals. Eur. J. Pharm. Biopharm. 78, 248–263. https://doi.org/10.
1016/j.ejpb.2011.03.010 (2011).
2. Pincock, R. E. Reactions in frozen systems. Acc. Chem. Res. 2, 97–103. https://doi.org/10.1021/ar50016a001 (1969).
3. Tang, X. & Pikal, M. J. Design of freeze-drying processes for pharmaceuticals: Practical advice. Pharm. Res. 21, 191–200. https://
doi.org/10.1023/B:PHAM.0000016234.73023.75 (2004).
4. Cao, E., Chen, Y., Cui, Z. & Foster, P. R. Effect of freezing and thawing rates on denaturation of proteins in aqueous solutions.
Biotechnol. Bioeng. 82, 684–690. https://doi.org/10.1002/bit.10612 (2003).
5. Gabellieri, E. & Strambini, G. B. ANS fluorescence detects widespread perturbations of protein tertiary structure in ice. Biophys.
J. 90, 3239–3245. https://doi.org/10.1529/biophysj.105.074948 (2006).
6. Pikal-Cleland, K. A., Rodríguez-Hornedo, N., Amidon, G. L. & Carpenter, J. F. Protein denaturation during freezing and thawing
in phosphate buffer systems: Monomeric and tetrameric β-galactosidase. Arch. Biochem. Biophys. 384, 398–406. https://doi.org/
10.1006/abbi.2000.2088 (2000).
7. Bhatnagar, B. S., Bogner, R. H. & Pikal, M. J. Protein stability during freezing: Separation of stresses and mechanisms of protein
stabilization. Pharm. Dev. Technol. 12, 505–523. https://doi.org/10.1080/10837450701481157 (2007).
8. Chang, B. S., Kendrick, B. S. & Carpenter, J. F. Surface-induced denaturation of proteins during freezing and its inhibition by
surfactants. J. Pharm. Sci. 85, 1325–1330. https://doi.org/10.1021/js960080y (1996).
9. Strambini, G. B. & Gabellieri, E. Proteins in frozen solutions: Evidence of ice-induced partial unfolding. Biophys. J. 70, 971–976.
https://doi.org/10.1016/S0006-3495(96)79640-6 (1996).
10. Schnepf, M. I. Protein–water interactions. In Biochemistry of Food Proteins (ed. Hudson, B. J. F.) 1–33 (Springer US, 1992).
11. Franks, F. Freeze-drying: From empiricism to predictability. The significance of glass transitions. Dev. Biol. Stand. 74, 9–18 (1992)
(discussion 19).
12. Jiang, S. & Nail, S. L. Effect of process conditions on recovery of protein activity after freezing and freeze-drying. Eur. J. Pharm.
Biopharm. 45, 249–257. https://doi.org/10.1016/S0939-6411(98)00007-1 (1998).
13. Anchordoquy, T. J. & Carpenter, J. F. Polymers protect lactate dehydrogenase during freeze-drying by inhibiting dissociation in
the frozen state. Arch. Biochem. Biophys. 332, 231–238. https://doi.org/10.1006/abbi.1996.0337 (1996).
14. Bagchi, D., Bagchi, M., Hassoun, E. A. & Stohs, S. J. In vitro and in vivo generation of reactive oxygen species, DNA damage and
lactate dehydrogenase leakage by selected pesticides. Toxicology 104, 129–140. https://doi.org/10.1016/0300-483X(95)03156-A
(1995).
15. Searles, J. A., Carpenter, J. F. & Randolph, T. W. The ice nucleation temperature determines the primary drying rate of lyophiliza-
tion for samples frozen on a temperature-controlled shelf. J. Pharm. Sci. 90, 860–871. https://doi.org/10.1002/jps.1039 (2001).
16. Cho, C. H., Lee, H. G., Jeong, S. & Yoo, S. Influence of packaging oxygen transmission rate on physical characteristics of frozen
cooked rice under various freezing conditions. J. Food Sci. 84, 3483–3493 (2019).
17. Fennema, O. R. Nature of freezing process. In Low Temperature Preservation of Foods and Living Matter (ed. William, D. P.) 151–222
(Marcel Dekker, 1973).
18. Tan, M., Mei, J. & Xie, J. The formation and control of ice crystal and its impact on the quality of frozen aquatic products: A review.
Curr. Comput. Aided Drug Des. 11, 68 (2021).
19. Michael, R. D. & Michael, J. A. Peptide and proteins as parenteral suspensions: An overview of design, development, and manu-
facturing considerations. In Pharmaceutical Formulation Development of Peptides and Proteins (ed. Hovgaard, L.) 193–238 (CRC
Press, 2012).
20. Van der Sman, R. G. M. Phase field simulations of ice crystal growth in sugar solutions. Int. J. Heat Mass Transf. 95, 153–161.
https://doi.org/10.1016/j.ijheatmasstransfer.2015.11.089 (2016).
21. Dickinson, E. Adsorbed protein layers at fluid interfaces: Interactions, structure and surface rheology. Colloids Surf. B 15, 161–176.
https://doi.org/10.1016/S0927-7765(99)00042-9 (1999).
22. Eubel, H., Braun, H.-P. & Millar, A. Blue-native PAGE in plants: A tool in analysis of protein-protein interactions. Plant Methods
1, 11. https://doi.org/10.1186/1746-4811-1-11 (2005).
23. Wittig, I., Braun, H.-P. & Schägger, H. Blue native PAGE. Nat. Protoc. 1, 418 (2006).
24. Royer, C. A. Probing protein folding and conformational transitions with fluorescence. Chem. Rev. 106, 1769–1784. https://doi.
org/10.1021/cr0404390 (2006).
25. Fontana, N. A., Fonseca-Maldonado, R., Mendes, L. F. S., Meleiro, L. P. & Costa-Filho, A. J. The yeast GRASP Grh1 displays a high
polypeptide backbone mobility along with an amyloidogenic behavior. Sci. Rep. 8, 15690. https://doi.org/10.1038/s41598-018-
33955-1 (2018).
26. Świderek, K., Panczakiewicz, A., Bujacz, A., Bujacz, G. & Paneth, P. Modeling of isotope effects on binding oxamate to lactic
dehydrogenase. J. Phys. Chem. B 113, 12782–12789. https://doi.org/10.1021/jp903579x (2009).
27. Bhattacharya, M., Jain, N. & Mukhopadhyay, S. Insights into the mechanism of aggregation and fibril formation from bovine serum
albumin. J. Phys. Chem. B 115, 4195–4205. https://doi.org/10.1021/jp111528c (2011).
28. Den Engelsman, J. et al. Strategies for the assessment of protein aggregates in pharmaceutical biotech product development. Pharm.
Res. 28, 920–933. https://doi.org/10.1007/s11095-010-0297-1 (2011).
29. Lorber, B., Fischer, F., Bailly, M., Roy, H. & Kern, D. Protein analysis by dynamic light scattering: Methods and techniques for
students. Biochem. Mol. Biol. Educ. 40, 372–382. https://doi.org/10.1002/bmb.20644 (2012).
30. Demeule, B., Gurny, R. & Arvinte, T. Detection and characterization of protein aggregates by fluorescence microscopy. Int. J.
Pharm. 329, 37–45. https://doi.org/10.1016/j.ijpharm.2006.08.024 (2007).
31. Lee, M. K., Kim, M. Y., Kim, S. & Lee, J. Cryoprotectants for freeze drying of drug nano-suspensions: Effect of freezing rate. J.
Pharm. Sci. 98, 4808–4817. https://doi.org/10.1002/jps.21786 (2009).
32. Bhattacharya, M. & Mukhopadhyay, S. Insights into the mechanism of aggregation and fibril formation from bovine serum albumin.
J. Phys. Chem. 115, 4195–4205. https://doi.org/10.1021/jp111528c (2011).
33. Breydo, L. & Uversky, V. N. Molecular mechanisms of protein misfolding. In Bio-nanoimaging (eds Uversky, V. N. & Lyubchenko,
Y. L.) 1–14 (Academic Press, 2014).
34. Chan, F. T. S., Pinotsi, D., Gabriele, S., Schierle, K. & Kaminski, C. F. Structure-specific intrinsic fluorescence of protein amyloids
used to study their kinetics of aggregation. In Bio-nanoimaging (eds Uversky, V. N. & Lyubchenko, Y. L.) 147–155 (Academic Press,
2014).
35. Pinotsi, D., Buell, A. K., Dobson, C. M., Kaminski Schierle, G. S. & Kaminski, C. F. A label-free, quantitative assay of amyloid fibril
growth based on intrinsic fluorescence. ChemBioChem 14, 846–850. https://doi.org/10.1002/cbic.201300103 (2013).
36. Sharpe, S., Simonetti, K., Yau, J. & Walsh, P. Solid-state NMR characterization of autofluorescent fibrils formed by the elastin-
derived peptide GVGVAGVG. Biomacromol 12, 1546–1555. https://doi.org/10.1021/bm101486s (2011).
Scientific Reports | (2021) 11:13643 | https://doi.org/10.1038/s41598-021-93127-6 9
Vol.:(0123456789)www.nature.com/scientificreports/
Acknowledgements
This work was carried out with support from the R&D Program for Forest Science Technology (2020189B10-
2122-BA01) of the Korea Forest Service (Korea Forestry Promotion Institute) and the Cooperative Research
Program for Agriculture Science and Technology Development (Project No. PJ01488801) of the Rural Develop-
ment Administration, Republic of Korea.
Author contributions
J.Y.P., K.M.P., and P.S.C. conceived, designed, and planned the study. P.H.N. carried out the experimental work,
analyzed and interpreted the data, and wrote and revised the manuscript. All authors reviewed the manuscript.
Competing interests
The authors declare no competing interests.
Additional information
Supplementary Information The online version contains supplementary material available at https://doi.org/
10.1038/s41598-021-93127-6.
Correspondence and requests for materials should be addressed to P.-S.C.
Reprints and permissions information is available at www.nature.com/reprints.
Publisher’s note Springer Nature remains neutral with regard to jurisdictional claims in published maps and
institutional affiliations.
Open Access This article is licensed under a Creative Commons Attribution 4.0 International
License, which permits use, sharing, adaptation, distribution and reproduction in any medium or
format, as long as you give appropriate credit to the original author(s) and the source, provide a link to the
Creative Commons licence, and indicate if changes were made. The images or other third party material in this
article are included in the article’s Creative Commons licence, unless indicated otherwise in a credit line to the
material. If material is not included in the article’s Creative Commons licence and your intended use is not
permitted by statutory regulation or exceeds the permitted use, you will need to obtain permission directly from
the copyright holder. To view a copy of this licence, visit http://creativecommons.org/licenses/by/4.0/.
© The Author(s) 2021
Scientific Reports | (2021) 11:13643 | https://doi.org/10.1038/s41598-021-93127-6 10
Vol:.(1234567890)You can also read