Vibrational resonant inelastic X ray scattering in liquid acetic acid: a ruler for molecular chain lengths
←
→
Page content transcription
If your browser does not render page correctly, please read the page content below
www.nature.com/scientificreports
OPEN Vibrational resonant inelastic X‑ray
scattering in liquid acetic acid:
a ruler for molecular chain lengths
Viktoriia Savchenko1,2,3*, Iulia Emilia Brumboiu1,4, Victor Kimberg1,2,3*,
Michael Odelius5*, Pavel Krasnov2,3, Ji‑Cai Liu6, Jan‑Erik Rubensson7, Olle Björneholm7,
Conny Såthe8, Johan Gråsjö7,13, Minjie Dong7, Annette Pietzsch9, Alexander Föhlisch9,10,
Thorsten Schmitt11, Daniel McNally11, Xingye Lu11, Sergey P. Polyutov2,3, Patrick Norman1,
Marcella Iannuzzi12, Faris Gel’mukhanov1,2,3 & Victor Ekholm7,8
Quenching of vibrational excitations in resonant inelastic X-ray scattering (RIXS) spectra of liquid
acetic acid is observed. At the oxygen core resonance associated with localized excitations at the
O–H bond, the spectra lack the typical progression of vibrational excitations observed in RIXS spectra
of comparable systems. We interpret this phenomenon as due to strong rehybridization of the
unoccupied molecular orbitals as a result of hydrogen bonding, which however cannot be observed in
x-ray absorption but only by means of RIXS. This allows us to address the molecular structure of the
liquid, and to determine a lower limit for the average molecular chain length.
The hydrogen bond (HB) is of central importance in chemistry and biochemistry and it is crucial in chemical
reactions, supramolecular structures, molecular assemblies, and even life processes. Consequently, HBs have been
immensely studied over the years, exploiting a plethora of spectroscopy and scattering methods, with liquid water
as an important showcase1. The new generation synchrotron radiation sources have allowed for a refinement of
the resonant inelastic X-rays scattering (RIXS) technique, which now gives access to detailed information about
the nature of the HB, not only in liquid w ater2–6, but also liquids like acetone7 and methanol8.
Vibrational excitations observed in RIXS spectra give information about the local potential surface of the
electronic ground s tate9, and about the electronic-vibronic dynamics during the scattering process. The dynam-
ics is especially dramatic when the intermediate core-excited state is dissociative in a bond to a light atom, e.g.,
a state in which an O–H antibonding orbital is populated. This dynamics is sensitively reflected in extended
vibrational progressions in RIXS spectra, and the exploration of these phenomena for the investigation of HBs
in the liquid phase is a new research field which we are currently entering.
Recently, unambiguous experimental evidence for ultrafast proton-transfer dynamics following excitation on
the “pre-peak” resonance of liquid water was provided5,6. Significant nuclear rearrangement could be expected as
the pre-peak resonance is associated with the 1s−1 4a1 excitation in gas-phase water, in which ultrafast dissocia-
tion arises from the antibonding O–H σ ∗ character of the 4a1 orbital10. RIXS spectra of liquid water excited at
this resonance show a long vibrational progression (Fig. 1a). Also in corresponding measurements on m ethanol8
and acetone7, it was found that the long vibrational progression of the RIXS spectra of the free molecules was
1
Department of Theoretical Chemistry and Biology, KTH Royal Institute of Technology, 10691 Stockholm,
Sweden. 2International Research Center of Spectroscopy and Quantum Chemistry—IRC SQC, Siberian Federal
University, Krasnoyarsk, Russia 660041. 3Kirensky Institute of Physics, Federal Research Center KSC SB RAS,
Krasnoyarsk, Russia 660036. 4Department of Chemistry, Korea Advanced Institute of Science and Technology,
Daejeon 34141, Korea. 5Department of Physics, AlbaNova University Center, Stockholm University, 106
91 Stockholm, Sweden. 6Department of Mathematics and Physics, North China Electric Power University,
Beijing 102206, China. 7Department of Physics and Astronomy, Uppsala University, Box 516, 751 20 Uppsala,
Sweden. 8MAX IV Laboratory, Lund University, Box 118, 221 00 Lund, Sweden. 9Institute for Methods and
Instrumentation in Synchrotron Radiation Research FG-ISRR, Helmholtz‑Zentrum Berlin für Materialien und
Energie Albert‑Einstein‑Strasse 15, Berlin 12489, Germany. 10Institut für Physik und Astronomie, Universität
Potsdam, Karl‑Liebknecht‑Strasse 24‑25, 14476 Potsdam, Germany. 11Swiss Light Source, Photon Science
Division, Paul Scherrer Institut, 5232 Villigen PSI, Switzerland. 12Physical Chemistry Institute, University of Zürich,
8057 Zurich, Switzerland. 13Department of Medicinal Chemistry, Uppsala University, Box 574, 75123 Uppsala,
Sweden. *email: viksav@kth.se; kimberg@kth.se; odelius@fysik.su.se
Scientific Reports | (2021) 11:4098 | https://doi.org/10.1038/s41598-021-83248-3 1
Vol.:(0123456789)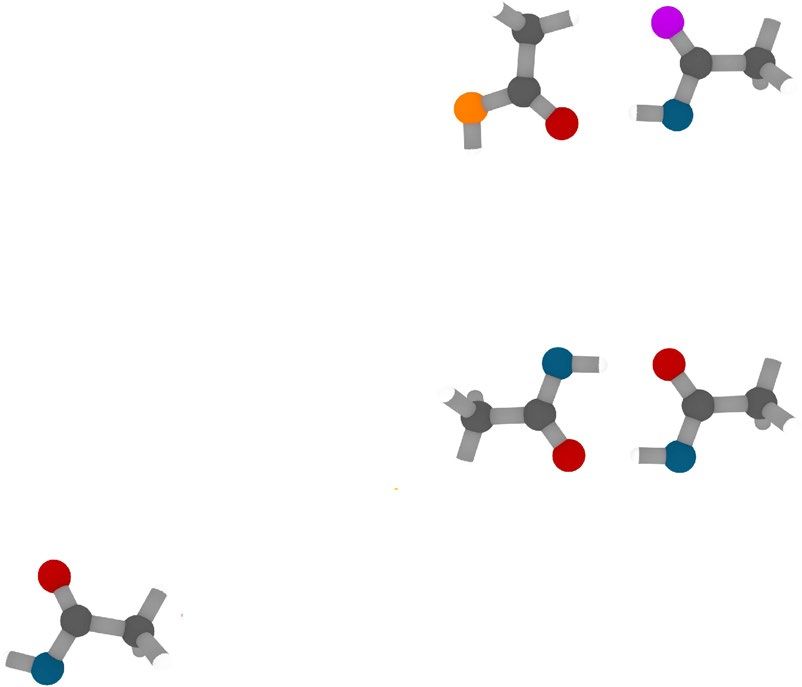
www.nature.com/scientificreports/
Figure 1. Liquid phase and gas phase RIXS spectra of water5 (a) and acetic acid (b, c). The experimental spectra
of liquid phase (blue) are compared to computed gas phase spectra (red), obtained using ab initio methods
as outlined in the text and normalized to v = 1. The inserts shows the experimental XAS spectra of gas phase
(dashed blue) water5 (a), acetic acid28 (b, c) and liquid (blue) water5 (a), acetic acid29 (b,c), where the vertical
arrows point out the corresponding core-excitation energy in XAS. (In gas phase, on top of the resonances (red
arrows). In (a) the excitation energy for liquid water is 535.0 eV. In (b, c) the excitation energies for liquid ACA
are 532.1 and 534.6 eV for the OC 1s → π ∗ and OH 1s → π ∗ resonances, respectively). The RIXS intensities of
ACA in panels (b) and (c) are matched to each other, as it is shown in Fig. S518. The energy loss is the difference
between the energies of incoming and emitted X-ray photons.
largely preserved in the liquid. These observations suggest that the intermolecular interactions, albeit significant,
only play a minor role for the RIXS dynamics. Here we will demonstrate that this by no means is a general rule.
Results
In the present work we combine state-of-the-art theory with high-resolution RIXS spectra (Fig. 1b,c) of liquid
acetic acid (ACA) to analyze the influence of intermolecular interactions. We show that the HB has a dramatic
influence on the molecular dynamics. Whereas ultrafast dissociation and accompanying extended vibrational
progression are expected in RIXS spectra excited at the O–H antibonding intermediate state of O 1s−1 σ ∗ char-
acter for the free molecule, the corresponding dynamics is almost entirely quenched in liquid ACA.
Carboxylic acids have received a lot of experimental and theoretical interest over more than a century. There
is now a consensus that the predominant structures of ACA in the gas phase are the monomer and the symmetric
cyclic dimer11. In the solid state, the crystalline unit cell consists of non-symmetric dimers which belong to a
chain structure11. The local structure of liquid ACA is more complex and is still heavily debated (see Ref.11–14
and references therein). The linear cis-cis and cis-trans configurations are theoretically found in less ordered
chains and rings of liquid acetic a cid11. However, neutron s cattering15 and Raman s pectroscopy16 show a remark-
able similarity in the hydrogen bond length when going from the crystal to the liquid structure and it has been
concluded that the liquid structure is similar to that of a disordered crystal with predominant chain structures.
The interpretation of spectroscopic and scattering data of disordered liquids is complicated by the difficulty to
get direct access to the structure, mainly because of the ambiguity in the analysis and interpretation of structural
measurements. A crucial role is played by theoretical modeling, but in spite of theoretical support, the solution
of the inverse problem is ambiguous (Refs.12,14,15). Therefore, complementary investigations are called for, and
here we use modeling-supported X-ray absorption spectroscopy (XAS) and RIXS spectroscopy to shed light on
the structure and interactions in ACA.
The spectral region of our interest consists of the first two peaks in the oxygen K-edge XAS of acetic acid
(Fig. 2). Because of the different chemical shifts of the O 1s levels of carbonyl (OC ) and hydroxyl (OH ) oxygen
atoms the chemical site can be selected by tuning the excitation energy. Indeed, the XAS spectrum of the acetic
acid monomer has two distinct pre-edge peaks and the analysis shows that each peak is related to a distinct
oxygen atom (Fig. 2). XAS simulations of the isolated ACA show that the first peak around 532 eV is due to
OC 1s → π ∗ core excitation, while the second peak at 535 eV is formed by two close-lying peaks OH 1s → π ∗ and
OH 1s → σ ∗ with almost the same intensity17. The C–O equilibrium distance of the ground state and the core
excited state OC 1s−1 π ∗ state differs (Fig. 3) due to the strong interaction between the 2p orbitals of carbon and
oxygen. Consequently, a long C=O vibrational progression is predicted for the gas-phase RIXS spectrum (Fig. 1b).
The O–H equilibrium distance of the core excited OH 1s−1 π ∗ state of the ACA monomer is almost the same
as that of the ground state, largely because the oxygen 2p orbital does not interact with the hydrogen 1s orbital
(Fig. 3), and consequently, RIXS spectra excited at this resonance are predicted to show almost no OH vibrations
Scientific Reports | (2021) 11:4098 | https://doi.org/10.1038/s41598-021-83248-3 2
Vol:.(1234567890)www.nature.com/scientificreports/
Figure 2. CVS-ADC(2)-x calculated XAS spectra of (a) the acetic acid monomer, (b) regular (cyclic) dimer and
(c) inverted (non-cyclic) dimer, showed in comparison to measured XAS spectra of (d) acetic acid liquid from
Ref.29 and (e) gas phase from Ref.28. The experimental and theoretical XAS spectra are shown in blue and red,
respectively. The calculated oscillator strengths are shown as bar graphs, where each bar is coloured according
to the atom of origin depicted in the molecular structure next to each spectrum. The XAS spectra have been
obtained by broadening the bar graphs using Gaussian functions of 0.5 eV full width at half maximum. The high
photon energy region (537 eV and above) of the dimer spectra is missing. This is due to the high computational
cost of the CVS-ADC(2)-x method, where for the dimers we could only compute a limited number of excitation
vectors, allowing the full description of only the first two experimental XAS peaks. In the case of the monomer,
we could instead include enough excitation vectors to cover the full photon energy window used in the
experiment.
(Fig. S318). In contrast, the OH 1s−1 σ ∗ is dissociative (Fig. 3), resulting in an extensive vibrational progression
(Fig. 1c) in the corresponding monomer RIXS spectrum.
Experimentally, we find that the vibrational progressions predicted for free molecules to a large extent are
preserved in the RIXS spectra of the liquids. The sensitivity to the chemical surrounding is typically accentu-
ated for highly excited vibrational states, where potential surfaces are modified by intermolecular interactions.
Therefore, vibrational progressions are often smeared out and attenuated at large energy losses. For lower energy
losses, on the other hand, the behavior simulates gas-phase predictions. This is illustrated for the O 1s → 4a1
resonance in water (Fig. 1a), and for the OC 1s → π ∗ resonance in ACA (Fig. 1b). The predicted O–H vibrations
for gas-phase water and O-C vibrations for ACA, are both retained in the RIXS spectra of the liquids, at least up
to v = 5, before intermolecular interactions smear out the intensity.
For the second resonance of liquid ACA the situation is dramatically different (Fig. 1c). Whereas a long
exp
progression of O–H stretch vibrations with a ωvib ≈ 0.44 eV is predicted for the free molecule, vibrational exci-
tations are virtually absent in the experimental RIXS spectrum. This observation suggests that intermolecular
interactions dramatically quench the ultrafast dissociation, and that the HB has a major impact on the dynam-
ics. Notable, however, is a weak vibrational peak structure, where the vibrational peaks are separated 0.16-0.17
eV. These could be attributed to the OH bending mode and/or carboxyl C–O s tretch19,20. To shed light on the
unusual effect of complete quenching of the O–H stretch progression, we analyze the core-excitations of ACA
Scientific Reports | (2021) 11:4098 | https://doi.org/10.1038/s41598-021-83248-3 3
Vol.:(0123456789)www.nature.com/scientificreports/
Figure 3. The potential energy curves from RASPT2 calculations of acetic acid in the ground, 1sO−1
C
(a) and 1sO
−1
H
(b) core-excited states along the C=O and O–H stretching normal modes, respectively. Only the lowest bound
1sOC π contributes to the first XAS peak, and both close lying bound 1sOH π and dissociative 1sOH σ states
−1 ∗ −1 ∗ −1 ∗
form the second XAS peak of acetic acid monomer (Fig. 2). The oscillator strengths are almost the same for the
−1
1sOH
core-excited states and they are about four times smaller as compared to the 1sOC → π ∗ core-excitation
(Fig. 2).
molecules in gas and liquid phases. For comparison with liquid phase, an experimental gas-phase spectrum
would be ideal. However, the spectral quality needed to make a comparison is state-of-the-art, and presently
there is no instrument available where such a gas-phase measurement can be done. Instead, we use a high-quality
theoretical calculation of the RIXS spectrum of the ACA monomer (Fig. 1c) which is expected to accurately
predict an experimental gas-phase spectrum (compare to our previous study of RIXS of free water m olecule21).
We use this as a reference to compare with the measured RIXS spectra of the liquid.
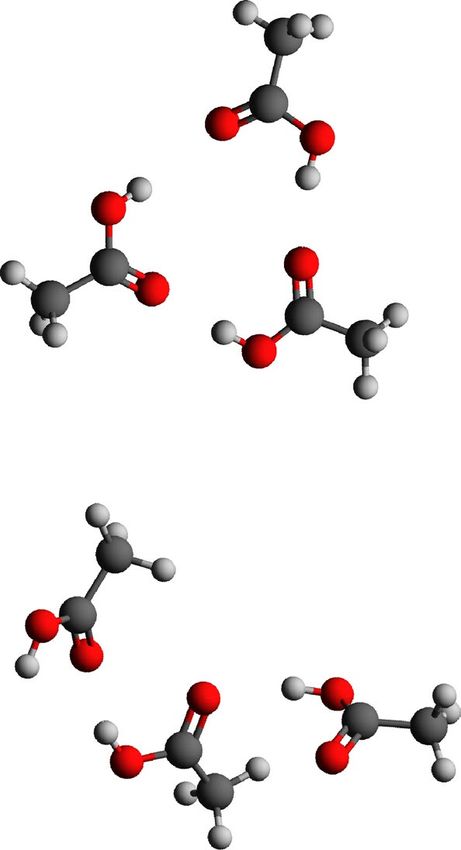
We represent the gas-phase ACA by the monomer and assume that a chain of hydrogen bonded molecules is
the representative structure of liquid ACA (Fig. 4d). Here, we identify two distinct OH groups: one at the end of
the chain, not involved in HB, which we denote “end”, and one inside the chain, involved in HB, which we denote
“in”. These two OH groups are expected to have significantly different XAS spectra, which we have computed
using the shortest possible chains, i.e. the dimers. Two types of dimers are included, namely the regular dimer
(centrosymmetric cyclic dimer, which also exist in the gas phase) and the inverted dimer (asymmetric noncyclic
dimer which is the shortest representative of the chain present in the liquid). The XAS spectra, computed in the
same way as for the monomer, are shown in Fig. 2.
Discussion
Note that while π ∗ and σ ∗ resonances are predicted to contribute almost equally to the 535-eV peak in the XAS
spectrum of the monomer (Fig. 2a), the σ ∗ resonance does not contribute at all in the regular dimer, as previously
discussed in the literature17 (Fig. 2b). This dramatic change is an obvious effect of the HB, which affects both
“in” OH groups in the regular dimer. For the inverted dimer the XAS spectrum comprises transitions in both
“in” and “end” OH groups (Fig. 2c), and whereas the “in” OH group has similar features as the OH groups in the
regular dimer the XAS signal of the “end” OH resembles the signal of the OH group in the ACA monomer. This
is a manifestation of the building block principle, according to which the occurrence of specific groups leaves a
fingerprint in the spectrum. The effect of the HBs is, however, not very large in the total XAS, and condensation
results only in slight shifts of the spectral features (Fig. 2d–e). In contrast, a strong effect is expected in RIXS:
Whereas the “end” OH groups are almost unaffected by the HB, and because the 535-eV peak comprises transi-
tions to the dissociative σ ∗ core-excited state, a long vibrational progression is expected in the RIXS spectrum,
the peak in the spectra of the “in” OH groups has no contribution from the σ ∗ state, and consequently no sig-
nificant vibrational excitations are expected. In this way a RIXS measurement allows us to clearly distinguish
between “in” and “end” OH groups, and the observation that vibrational excitations are virtually absent shows
that HBs are significant, and puts an upper limit to the occurrence of “end” OH groups in the liquid, which we
estimate in the following.
The total number of ACA units in a liquid can be written approximately as
N = ℓch Nch + ℓcycl Ncycl (1)
Here ℓch and ℓcycl are the average number of ACA monomers (or length in ACA units) in chain and cyclic
structures, respectively, while Nch and Ncycl are the average number of chains and cyclic structures, respectively.
Here we assume that the chain is the representative chain structure from crystalline ACA with one “end” OH
group (see Fig. 4d). The cyclic structures have only “in” OH groups (see Fig. 4c). The relative abundance of the
“end” OH groups is Nch /N . This ratio represents the relative intensity of the RIXS profile with the OH vibrational
progression caused by the “end” OH group.
A detailed analysis of peak-to-noise ratio in the RIXS spectra of liquid ACA and the calculated v = 1 peak
intensities in the ACA monomer is performed in the Supplementary information18. From this analysis, we
conclude that for a vibrational progression to exceed the experimental noise level (more precisely the level of
Scientific Reports | (2021) 11:4098 | https://doi.org/10.1038/s41598-021-83248-3 4
Vol:.(1234567890)www.nature.com/scientificreports/
Figure 4. XAS from DFT calculations of the OC (blue) and OH (red) K-edges in gas phase (a) and liquid (b)
ACA are shown and further decomposed into out-of-plane (π ∗-type, dotted) and in-plane (σ ∗-type, dashed-
dotted) contributions. The spectra are computed using the XFH transition potential method and AIMD
approach (see for more details the Supplementary i nformation18). (c) A cyclic structure without “end” OH
groups. (d) A chain structure of liquid acetic acid which contains an “end” OH group.
detectability), the fraction of chains must obey the following relation N /Nch = ℓeff = ℓch + ℓcycl Ncycl /Nch 3.5,
where ℓeff denotes the effective length of chain or cycle unit.
Since our measurements do not display a OH vibrational progression, this means that the effective length ℓeff
should be longer than 3.5 monomer units.
N Ncycl
= ℓch + ℓcycl > 3.5. (2)
Nch Nch
Let us take the recommended structure from a recent analysis15 of neutron scattering data, where it is claimed
that the dominant structure is the trimer chain. If trimer chains were the only motif then Ncycl = 0 and ℓch = 3,
so that the condition for observing vibrational excitation would be fulfilled. Our results indicate that the effective
chain length is longer. Our estimate corresponds to a lower bound for ℓeff within the current signal/noise ratio.
One can expect to refine the estimate, possibly giving an increased ℓeff , in future experiments with improved
statistics.
So far, we have discussed RIXS only from the perspective of the OH 1s−1 σ ∗ core-excited state of the ACA
monomer and dimers. However, one may also expect vibrational structure in RIXS due to the OH 1s−1 π ∗ core-
excited states which are also populated when the photon energy is tuned near the second XAS peak (Fig. 2). One
cannot exclude that the HB changes the potential energy curve of the π ∗ core-excited states and opens inelastic
scattering channels, but, as shown in the Supplementary i nformation18, this does not occur.
Additionally, ab initio molecular dynamics (AIMD) simulations of the XAS spectrum were performed to
investigate the sensitivity to solvation and HBs, using the transition-potential DFT approach (see the Supple-
mentary information18). The results of these simulations (Fig. 4b) confirm that the σ ∗ core-excited state only
contributes little to the second XAS peak in liquid ACA which is dominated by a single π ∗ core-excited state.
The individual contributions of the C=O and O–H oxygen atoms to the O 1s XAS spectra (displayed in blue
and red lines, respectively) show that liquid interactions have a profoundly different influence on the two sets
of core-excited states. In Fig. 4a,b, we also show the decomposition of the XAS spectrum contributions into
in-plane and out-of-plane components which allows us to understand the influence of the HB on the O–H σ ∗
core-excited state. In Fig. S1b,c of the Supplementary i nformation18 we further investigate the hydrogen bonding
by ordering the out-of-plane and in-plane contributions according to hydrogen bond distance in the donating
Scientific Reports | (2021) 11:4098 | https://doi.org/10.1038/s41598-021-83248-3 5
Vol.:(0123456789)www.nature.com/scientificreports/
direction of the OH group, and we identify the trend that the σ ∗ character only barely reaches down to the O–H
pre-edge peak even for very distorted hydrogen bonding configurations.
In conclusion, our RIXS measurements of liquid ACA show the absence of a vibrational progression of the
OH stretch mode under pre-edge core-excitation of the hydroxyl oxygen contrary to liquid water and methanol.
We attribute this behavior to an unusually strong influence of the HB, which changes the character of the inter-
mediate state and quenches the vibrational progression. The effect allows us to put an upper limit to the average
concentration of “end” OH groups in the liquid that are not strongly involved in HBs, implying that the average
length of chains must be larger than 3 and/or there must be a significant abundance of cyclic structures. Finally,
we note that the method exploited here, based on the quenching of the vibrational progression in RIXS, can be
used for structure investigations with some generality: We have found that the intensity of the OH vibrational
progression can be used as a “ruler” of chain length. X-ray d iffraction22 shows that the ratio between dimers
and chains is shifted towards dimers in the case of liquid propionic acids compared to ACA, and the proposed
structure may be validated with this new method. We envision applications to a variety of liquids, such as formic
acid, methyl acetate, and methyl propionate in the near future.
Methods
Experiment. The experiment was performed at room temperature with the SAXES spectrometer23 at the
RIXS end station of the ADRESS beam line24 at the Swiss Light Source at the Paul Scherrer Institut. The liquid
acetic acid acquired from Sigma-Aldrich had a purity level ≥99% and the water sample was Milli-Q purified and
de-ionized. We utilized a flow-cell separating the sample from the vacuum by a 100 nm thick Si3 N4 window.
Due to the risk of window rupture under irradiation, the cell was moved every 5 min. The resonantly scattered
photons were detected at a 90◦ angle from the incoming horizontally polarized X-ray beam by three different
detectors with an experimental resolution of ≈45 meV for liquid ACA and water. The spectra were measured
at several times (3-6 times) at each excitation energy where the duration of each measurement was 5 minutes.
The presented spectra were calculated as the sum of these spectra and normalized by dividing by the number
of measurements times the number of detectors. To avoid errors from this procedure, the spectra of these indi-
vidual scans were shifted to same energy scale by using a fit to the elastic line before joining them for further
data processing. The energy calibration was based on the O2 RIXS s pectrum25. Moreover, the RIXS intensity inte-
grated in a broad energy range (up to 12 eV energy loss) was monitored in order to confirm peaks of the absorp-
tion resonances (see Fig. S6). We compare the intensities of RIXS spectra for the scattering through the carbonyl
(OC ) and hydroxyl (OH ) oxygen atoms. The normalization of intensities of these scattering channels was refined
by adjusting the spectral intensity to achieve the noise (by the root mean square error) in the signal-free anti-
Stokes range of − 6 to − 2 eV to be equal for these spectra (See Supplementary i nformation18 and Fig. S5).
Theory. The main part of simulations were performed using post Hartree–Fock ab initio methods accompa-
nied by the techniques based on density functional theory (DFT) and AIMD. We computed the X-ray absorption
profile of the ACA monomer and dimers (Fig. 2) using the core-valence separation (CVS) approximation at the
algebraic diagrammatic construction (ADC) level of theory. Specifically, the CVS-ADC(2)-x variant was used
in combination with the 6-31++G(p,d) basis set, as outlined in Refs.8,26. It is noted that the XAS profile of the
ACA monomer as computed using the multi-reference RASPT2 approach displays a good agreement with the
ADC(2)-x and TDDFT simulations (Fig. S218). The RIXS profiles (Figs. 1, S318) were computed using the wave
packet software as described in Refs.6,8,21,27 using the potential energy curves (PECs) along the O–H and C–O
stretching modes. The ground and core-excited PECs (Fig. 3) were determined at the RASSCF/ANO-RCC-
VTZP level (with 10 electrons in 13 active molecular orbitals) followed by RASPT2 calculations to account
for dynamic electron correlation effects. Finally, additional simulations of XAS spectra using AIMD were per-
formed (see Figs. 4, S118). The full computational details can be found in the Supplementary information18.
Received: 20 November 2020; Accepted: 1 February 2021
References
1. Soper, A. K. Is water one liquid or two?. J. Chem. Phys. 150, 234503. https://doi.org/10.1063/1.5096460 (2019).
2. Fuchs, O. et al. Isotope and temperature effects in liquid water probed by X-ray absorption and resonant X-ray emission spectros-
copy. Phys. Rev. Lett. 100, 027801. https://doi.org/10.1103/PhysRevLett.100.027801 (2008).
3. Pietzsch, A. et al. Snapshots of the Fluctuating Hydrogen Bond Network in Liquid Water on the Sub-Femtosecond Timescale
with Vibrational Resonant Inelastic x-ray Scattering. Phys. Rev. Lett. 114, 088302. https://doi.org/10.1103/PhysRevLett.114.08830
2 (2015).
4. Nilsson, A. & Pettersson, L. G. M. The structural origin of anomalous properties of liquid water. Nat. Commun. 6, 1–11. https://
doi.org/10.1038/ncomms9998 (2015).
5. Niskanen, J. et al. Compatibility of quantitative X-ray spectroscopy with continuous distribution models of water at ambient
conditions. Proc. Natl. Acad. Sci. USA 116, 4058–4063. https://doi.org/10.1073/pnas.1815701116 (2019).
6. Vaz da Cruz, V. et al. Probing hydrogen bond strength in liquid water by resonant inelastic X-ray scattering. Nat. Commun. 10,
1013. https://doi.org/10.1038/s41467-019-08979-4 (2019).
7. Sun, Y.-P. et al. Intramolecular soft modes and intermolecular interactions in liquid acetone. Phys. Rev. B 84, 132202. https://doi.
org/10.1103/PhysRevB.84.132202 (2011).
8. Vaz da Cruz, V. et al. Nuclear dynamics in resonant inelastic X-ray scattering and X-ray absorption of methanol. J. Chem. Phys.
150, 234301. https://doi.org/10.1063/1.5092174 (2019).
Scientific Reports | (2021) 11:4098 | https://doi.org/10.1038/s41598-021-83248-3 6
Vol:.(1234567890)www.nature.com/scientificreports/
9. Schreck, S. et al. Ground state potential energy surfaces around selected atoms from resonant inelastic x-ray scattering. Sci. Rep.
6, 1–8. https://doi.org/10.1038/srep20054 (2016).
10. Hjelte, I. et al. Evidence for ultra-fast dissociation of molecular water from resonant Auger spectroscopy. Chem. Phys. Lett. 334,
151–158. https://doi.org/10.1063/1.50964600 (2001).
11. Riniker, S. et al. Temperature Dependence of the Dielectric Permittivity of Acetic Acid, Propionic Acid and Their Methyl Esters:
A Molecular Dynamics Simulation Study. ChemPhysChem 13, 1182–1190. https://doi.org/10.1063/1.50964601 (2012).
12. Imberti, S. & Bowron, D. T. Formic and acetic acid aggregation in the liquid state. J. Phys. Condens. Matter 22, 404212. https://doi.
org/10.1088/0953-8984/22/40/404212 (2010).
13. Takahashi, O., Nishida, N., Kanai, S., Horikawa, Y. & Tokushima, T. XAS and RIXS study of acetic acid and methyl formate in
liquid. J. Phys. Conf. Ser. 712, 012040. https://doi.org/10.1088/1742-6596/712/1/012040 (2016).
14. Zhang, M., Chen, L., Yang, H. & Ma, J. Theoretical study of acetic acid association based on hydrogen bonding mechanism. J. Phys.
Chem. A 121, 4560–4568. https://doi.org/10.1021/acs.jpca.7b03324 (2017).
15. Chebaane, A., Trabelsi, S., Nasr, S. & Bellissent-Funel, M.-C. Local order in fully deuterated liquid acetic acid as studied by neutron
scattering. Complementarity to X-ray results. J. Mol. Liq. 198, 204–210. https://doi.org/10.1063/1.50964605 (2014).
16. Nakabayashi, T., Kosugi, K. & Nishi, N. Liquid structure of acetic acid studied by Raman spectroscopy and ab initio molecular
orbital calculations. J. Phys. Chem. A 103, 8595–8603. https://doi.org/10.1021/jp991501d (1999).
17. Tabayashi, K., Takahashi, O., Namatame, H. & Taniguchi, M. Substituent R-effects on the core-electron excitation spectra of
hydrogen-bonded carboxylic-acid (R-COOH) clusters: Comparison between acetic-acid and formic-acid clusters. Chem. Phys.
Lett. 557, 1–9. https://doi.org/10.1063/1.50964607 (2013).
18. See Supplementary information at https://doi.org/10.1063/1.50964608 for AIMD simulation and spectral calculation details.
19. Olbert-Majkut, A., Ahokas, J., Lundell, J. & Pettersson, M. Raman spectroscopy of acetic acid monomer and dimers isolated in
solid argon. J. Raman Spectrosc. 42, 1670–1681. https://doi.org/10.1063/1.50964609 (2011).
20. See assignment in Olbert-Majkut et al. [19] e.g. Table 1 (HAc monomer) ν7: νC–O + δCOH (A’) 1325.0 cm−1 = 0.164 eV and Table 2
(HAc dimer) νC–O + δ COH (Bu) 1309.3 cm−1 = 0.162 eV).
21. Couto, R. C. et al. Selective gating to vibrational modes through resonant X-ray scattering. Nat. Commun. 8, 12725–12734. https
://doi.org/10.1038/ncomms14165 (2017).
22. Gorbunova, T. V., Shilov, V. V. & Batalin, G. I. X-ray diffraction study of formic, acetic, and propionic acids in the liquid state. J.
Struct. Chem. 14, 388–392. https://doi.org/10.1103/PhysRevLett.100.0278011 (1973).
23. Ghiringhelli, G. et al. SAXES, a high resolution spectrometer for resonant x-ray emission in the 400–1600eV energy range. Rev.
Sci. Instrum. 77, 113108. https://doi.org/10.1103/PhysRevLett.100.0278012 (2006).
24. Strocov, V. N. et al. Synchrotron Radiation High-resolution soft X-ray beamline ADRESS at the Swiss Light Source for reso-
nant inelastic X-ray scattering and angle-resolved photoelectron spectroscopies. J. Synchrotron Rad. 17, 631–643. https://doi.
org/10.1107/S0909049510019862 (2010).
25. Hennies, F. et al. Resonant inelastic scattering spectra of free molecules with vibrational resolution. Phys. Rev. Lett. 104, 193002.
https://doi.org/10.1103/PhysRevLett.104.193002 (2010).
26. Wenzel, J., Holzer, A., Wormit, M. & Dreuw, A. Analysis and comparison of CVS-ADC approaches up to third order for the cal-
culation of core-excited states. J. Chem. Phys. 142, 214104. https://doi.org/10.1063/1.4921841 (2015).
27. Gel’mukhanov, F. & Ågren, H. Resonant X-ray Raman scattering. Phys. Rep. 312, 87–330. https://doi.org/10.1103/PhysRevLet
t.100.0278016 (1999).
28. Robin, M., Ishii, I., McLaren, R. & Hitchcock, A. Fluorination effects on the inner-shell spectra of unsaturated molecules. J. Electron
Spectrosc. Relat. Phenom. 47, 53–92. https://doi.org/10.1103/PhysRevLett.100.0278017 (1988).
29. Tokushima, T. et al. Selective observation of the two oxygen atoms at different sites in the carboxyl group (-COOH) of liquid acetic
acid. Phys. Chem. Chem. Phys. 11, 1679–1682. https://doi.org/10.1039/B818812B (2009).
Acknowledgements
The work is supported by the Swedish Research Council (VR). The research work of V.S. is funded by a Swedish
Institute scholarship. M.O. acknowledges financial support from the Carl Tryggers Foundation. J.-C.L. thanks
for the support by the National Science Foundation of China under Grant Nos. 11574082, 11974108 and the
Fundamental Research Funds for the Central Universities (No. 2018MS050). F.G., V.K., P.K. and S.P.P. acknowl-
edge support within the Russian Science Foundation (Project No. 16-12-10109). F.G. acknowledges also the
support from the Helmholtz Virtual Institute VI419 “Dynamic Pathways in Multidimensional Landscapes”.
The synchrotron experiments have been performed at the ADRESS beamline of the Swiss Light Source at the
Paul Scherrr Institut (PSI). The work at PSI is supported by the Swiss National Science Foundation through the
NCCR MARVEL and the Sinergia project “Mott Physics Beyond the Heisenberg (MPBH) model” (SNSF Research
grant numbers CRSII2:141962 and CRSII2:1607651). The research leading to these results has received funding
from the European Community’s Seventh Framework Programme (FP7/2007–2013) under Grant Agreement
No. 290605 (COFUND: PSIFELLOW). The computations were performed on resources provided by the Swed-
ish National Infrastructure for Computing (SNIC) at the Swedish National Supercomputer Center (NSC), the
High Performance Computer Center North (HPC2N), and Chalmers Centre for Computational Science and
Engineering (C3SE).
Author contributions
V.S. performed theoretical simulations of nuclear dynamics, prepared the text of manuscript and figures; V.E. sug-
gested and planned the experiment, collected the data, carried out the data analysis; J.E.R, O.B., C.S., J.G., M.D.,
A.P., A.F., T.S., D.M., and X.L. participated in the experiment and results discussion; I.E.B., M.O., P.K. performed
quantum chemical calculations; J.C.L., S.P.P., P.N., M.I. participated in theoretical analysis and results discussion;
F.G., M.O., and V.K. proposed the theoretical model and wrote the paper. All authors reviewed the manuscript.
Funding
Open Access funding provided by Stockholm University.
Competing interests
The authors declare no competing interests.
Scientific Reports | (2021) 11:4098 | https://doi.org/10.1038/s41598-021-83248-3 7
Vol.:(0123456789)www.nature.com/scientificreports/
Additional information
Supplementary Information The online version contains supplementary material available at https://doi.
org/10.1038/s41598-021-83248-3.
Correspondence and requests for materials should be addressed to V.S., V.K. or M.O.
Reprints and permissions information is available at www.nature.com/reprints.
Publisher’s note Springer Nature remains neutral with regard to jurisdictional claims in published maps and
institutional affiliations.
Open Access This article is licensed under a Creative Commons Attribution 4.0 International
License, which permits use, sharing, adaptation, distribution and reproduction in any medium or
format, as long as you give appropriate credit to the original author(s) and the source, provide a link to the
Creative Commons licence, and indicate if changes were made. The images or other third party material in this
article are included in the article’s Creative Commons licence, unless indicated otherwise in a credit line to the
material. If material is not included in the article’s Creative Commons licence and your intended use is not
permitted by statutory regulation or exceeds the permitted use, you will need to obtain permission directly from
the copyright holder. To view a copy of this licence, visit http://creativecommons.org/licenses/by/4.0/.
© The Author(s) 2021
Scientific Reports | (2021) 11:4098 | https://doi.org/10.1038/s41598-021-83248-3 8
Vol:.(1234567890)You can also read