NOVEL URINARY GLYCAN PROFILING BY LECTIN ARRAY SERVES AS THE BIOMARKERS FOR PREDICTING RENAL PROGNOSIS IN PATIENTS WITH IGA NEPHROPATHY - NATURE
←
→
Page content transcription
If your browser does not render page correctly, please read the page content below
www.nature.com/scientificreports
OPEN Novel urinary glycan profiling
by lectin array serves
as the biomarkers for predicting
renal prognosis in patients with IgA
nephropathy
Chieko Kawakita1, Koki Mise1*, Yasuhiro Onishi1, Hitoshi Sugiyama2, Michihiro Yoshida3,
Masao Yamada4 & Jun Wada1*
In IgA nephropathy (IgAN), IgA1 molecules are characterized by galactose deficiency in O-glycans.
Here, we investigated the association between urinary glycosylation profile measured by 45 lectins
at baseline and renal prognosis in 142 patients with IgAN. The primary outcome was estimated
glomerular filtration rate (eGFR) decline (> 4 mL/min/1.73 m2/year), or eGFR ≥ 30% decline from
baseline, or initiation of renal replacement therapies within 3 years. During follow-up (3.4 years,
median), 26 patients reached the renal outcome (Group P), while 116 patients were with good renal
outcome (Group G). Multivariate logistic regression analyses revealed that lectin binding signals of
Erythrina cristagalli lectin (ECA) (odds ratio [OR] 2.84, 95% confidence interval [CI] 1.11–7.28) and
Narcissus pseudonarcissus lectin (NPA) (OR 2.32, 95% CI 1.11–4.85) adjusted by age, sex, eGFR, and
urinary protein were significantly associated with the outcome, and they recognize Gal(β1-4)GlcNAc
and high-mannose including Man(α1-6)Man, respectively. The addition of two lectin-binding glycan
signals to the interstitial fibrosis/tubular atrophy score further improved the model fitness (Akaike’s
information criterion) and incremental predictive abilities (c-index, net reclassification improvement,
and integrated discrimination improvement). Urinary N-glycan profiling by lectin array is useful in
the prediction of IgAN prognosis, since ECA and NPA recognize the intermediate glycans during
N-glycosylation of various glycoproteins.
Immunoglobulin A nephropathy (IgAN) is the most prevalent primary glomerulonephritis worldwide1,2. In a
systematic review of 1,619 publications, IgAN is more frequent in Asia (45 per million/year in Japan) than in
Caucasians (31 cases per million/year in France)3. The most cases with IgAN demonstrate chanced microhema-
turia and proteinuria, and they are characterized by the IgA dominant immune complex deposition in glomerular
mesangial area, recognized only by renal biopsy. The clinical manifestation and course were varied; asymptomatic
microhematuria, acute glomerulonephritis, rapidly progressive glomerulonephritis, chronic nephritis, nephrotic
syndrome, and end-stage kidney disease (ESKD). The Oxford Classification of IgAN is the most widely accepted
system for evaluating histological features in biopsy specimens with a minimum of 8 glomeruli. The MEST-C
score, including mesangial hypercellularity (M), endocapillary cellularity (E), segmental sclerosis (S), interstitial
fibrosis/tubular atrophy (T), and crescents (C) lesions, is predictive of clinical renal outcome. The supportive
therapy, i.e. tight blood pressure control with renin-angiotensin aldosterone system (RAS) inhibitors, treatment
of dyslipidemia with statins, and life-style modification, delayed the decline of renal function. The additional
benefits were observed in the immunosuppressive therapy with corticosteroids in recent randomized clinical
trial4. Although the efforts were made in diagnostic and therapeutic approaches, 20%-40% of IgAN patients
1
Department of Nephrology, Rheumatology, Endocrinology and Metabolism, Okayama University Graduate
School of Medicine, Dentistry and Pharmaceutical Sciences, 2‑5‑1 Shikata‑cho, Kita‑ku, Okayama 700‑8558,
Japan. 2Department of Human Resource Development of Dialysis Therapy for Kidney Disease, Okayama University
Graduate School of Medicine, Dentistry and Pharmaceutical Sciences, Okayama, Japan. 3Center for Innovative
Clinical Medicine, Okayama University Hospital, Okayama, Japan. 4GlycoTechnica Ltd, Yokohama, Japan. *email:
kokims‑frz@okayama‑u.ac.jp; junwada@okayama‑u.ac.jp
Scientific Reports | (2021) 11:3394 | https://doi.org/10.1038/s41598-020-77736-1 1
Vol.:(0123456789)www.nature.com/scientificreports/
progress to ESKD by 20 years after initial renal b iopsy5,6. Although several predictors of the renal prognosis
at the diagnosis have been recognized, including the estimated glomerular filtration rate (eGFR), proteinuria,
hypertension and pathological grading, they are not specific for IgAN7–9. Therefore, unmet medical needs in the
management of IgAN are the identification of reliable biomarkers to predict the renal prognosis at an early stage.
In the 2 human subclasses of IgA, IgA1 and IgA2, IgA1 is selectively deposited in the glomeruli and the human
IgA1 contains clustered O-glycans in its hinge region. In normal conditions, N-acetylgalactosamine (GalNAc)
is linked to a serine or threonine and galactose linked in β1,3 to GalNAc, while sialic acid has an α2,6 linkage
with GalNAc and α2,3 linkage with g alactose10. In this decade, the evidences involving galactose-deficient IgA1
(Gd-IgA1) on the pathogenesis of IgAN has emerged11–13. The down-regulation of β1,3-galactosyltransferase
(β3GalT)14 and up-regulation of α-2,6 sialyltransferase g ene15 may contribute the production of sialylation of
galacotose-deficient IgA1, the key autoantigen in IgAN. Suzuki et al. fist reported that urinary Gd-IgA1 might
be a disease-specific biomarker of IgAN16. Later, Berthoux et al. demonstrated that serum levels of Gd-IgA1-
targeting IgG and/or IgA autoantibodies could be related to the progression of I gAN17.
We previously reported that urinary excretion of N- or O-linked glycans conjugated to core proteins quantified
by a lectin array were able to predict the renal prognosis in patients with diabetes and the urinary glycan profile
might well-reflect kidney specific glycosylation changes, that is not the case with serum glycan profile18. However,
the association between the urinary glycan profiles and the renal prognosis of IgAN has not been investigated
to the best of our knowledge. By lectin array, the overall changes in sugar chains on global glycoproteins can be
quantified in an unbiased fashion. Herein, we studied the relationship between the urinary glycan profiling using
45 lectins and the renal prognosis in patients with biopsy-proven IgAN.
Results
Patient characteristics. Among 157 patients diagnosed with isolated IgAN who received a renal biopsy
from December 2010 to August 2017 at Okayama University Hospital, 142 patients were enrolled in the current
study (Supplementary Fig. 1). The baseline characteristics of the patients at the time of the renal biopsy are shown
in Table 1. The patients were 42.7 ± 16.3 years old, and 48% men. The mean baseline eGFR was 70.6 ± 25.9 mL/
min/1.73 m2, and the median 24-h urinary protein (UP) was 0.73 g/day (interquartile range [IQR] 0.27–1.53).
The primary outcome was defined as an estimated glomerular filtration rate (eGFR) decline (> 4 mL/min/1.73
m2/year), or eGFR ≥ 30% decline from baseline, or initiation of renal replacement therapies within 3 years. Dur-
ing a median follow-up period of 3.4 years, 26 patients reached the renal outcome (Group P), while 116 patients
were with good renal outcome (Group G). The systolic blood pressure (SBP), serum IgA levels, and UP were
significantly higher in Group P (n = 26) than Group G (n = 116). The percentage of treatments, such as tonsil-
lectomy and/or steroid therapy, was not significantly different between Group P and G. In addition, there was
no significant difference in the use of antihypertensive agents, such as angiotensin converting enzyme inhibitor
(ACE-I) or angiotensin receptor blocker (ARB) and calcium channel blocker, between two groups. At the final
follow-up, UP was significantly reduced, and the patients treated with ACE-I or ARB was increased compared
with baseline in both Group P and G (Supplementary Table 1). Furthermore, SBP, diastolic blood pressure (DBP)
and mean arterial pressure (MAP) demonstrated no significant differences between 2 groups at the end of obser-
vation (Supplementary Table 2).
Relationship between the renal outcome and lectin binding signals. The median follow-up
period was 3.4 years (IQR 2.2–5.2 years). The data of net glycan intensity (Net-I) in Group P and G at baseline
are shown in Supplementary Fig. 2. The lectin signals were generally higher in Group P versus Group G and
the urinary protein excretions were higher in Group P versus Group G (Table 1). Cy3 fluorescent is labelled to
amine-containing proteins and the background signals of albumin lacking glycosylation are the critical concerns
regards the specificity of lectin array. Actually, Net-I in each lectin demonstrated significant correlation with uri-
nary protein concentrations (Supplementary Fig. 3). However, the correlation matrix among 45 lectin binding
signals demonstrated that r values between lectins with similar glycan recognition are very high, while r values
between lectins with distinct glycan specificity are very low or even minus (Supplementary Fig. 4). These data
supported the elimination of artifacts and specificity of urinary lectin array.
The odds ratios (ORs) for a poor renal outcome by 45 lectin binding signals from urine samples are shown in
Fig. 1, and the reported glycan structures specific to each lectin are shown in Supplementary Table 3. Among 45
lectins, 34 lectin binding signals were significantly associated with the renal outcome in the univariate logistic
regression model, whereas only two lectins (Erythrina cristagalli lectin [ECA] and Narcissus pseudonarcissus
lectin [NPA]) were significantly related to the renal outcome in both univariate and multivariate models. In
univariate models, the OR for the poor renal outcome by urinary ECA signals was 3.00 (95% confidence inter-
val [CI], 1.52–5.94; p = 0.0016; false discovery rate [FDR] = 0.072 < 0.1) and by NPA 2.17 (95% CI, 1.32–3.56;
p = 0.0021; FDR = 0.047 < 0.1). In the multivariate models adjusted for age, sex, eGFR, and log-transformed UP,
the OR for the poor renal outcome by urinary ECA signals was 2.84 (95% CI, 1.11–7.28) and by NPA 2.32 (95%
CI, 1.11–4.85) (Fig. 1). Hippeastrum hybrid lectin (HHL), Canavalia ensiformis lectin (ConA) and Galanthus
nivalis lectin (GNA) demonstrated similar sugar recognition with NPA signals, while Ricinus communis lectin
(RCA120) with ECA. In univariate analysis, these lectin binding signals demonstrate similar trends in Odds
ratios and p values. However, a multivariate logistic regression analysis showed that the ECA and NPA remained
statistically significant even after adjusting for established risk factors for progression of IgAN, i.e. age, sex,
eGFR, and UP (Tables 2, 3). The inclusion of variables, i.e. IgA, SBP or T score into the models, ECA and NPA
remained statistically significant. In the stepwise models, age, eGFR, and ECA/NPA were selected as statistically
significant independent variables (Tables 2, 3). In another multivariate logistic regression models, we employed
statistically significant parameters in univariate analyses, such as ECA/NPA, age, UP, IgA, SBP and T score,
Scientific Reports | (2021) 11:3394 | https://doi.org/10.1038/s41598-020-77736-1 2
Vol:.(1234567890)www.nature.com/scientificreports/
Renal outcome
Good (G) Poor (P)
Clinical parameters All patients (n = 142) (n = 116) (n = 26) P value
Maleb 68 (48) 53 (46) 15 (58) 0.27
Age (years)a 42.7 ± 16.3 41.5 ± 15.0 48.2 ± 20.6 0.06
BMI (kg/m2)a 22.2 ± 3.2 22.3 ± 3.3 22.2 ± 3.0 0.88
SBP (mmHg)a 124.1 ± 17.7 122.1 ± 17.1 133.0 ± 18.2 < 0.01
DBP (mmHg)a 77.9 ± 12.2 77.9 ± 12.3 77.9 ± 12.3 0.99
MAP (mmHg)a 93.3 ± 13.0 92.6 ± 13.1 96.2 ± 12.2 0.20
Hypertensionb 47 (33) 35 (30) 12 (46) 0.12
sCr (mg/dL)a 0.94 ± 0.37 0.92 ± 0.32 1.04 ± 0.55 0.14
2)a
eGFR (mL/min/1.73 m 70.6 ± 25.9 70.3 ± 23.9 72.2 ± 34.1 0.74
IgA (mg/gL)a 310.7 ± 117.4 301.2 ± 108.4 352.9 ± 146.4 0.04
C3 (mg/dL)a 100.4 ± 18.0 99.7 ± 17.7 103.5 ± 19.5 0.33
IgA/C3a 3.2 ± 1.2 3.1 ± 1.1 3.5 ± 1.3 0.15
UP (g/day)a 0.73 (0.27–1.53) 0.69 (0.26–1.27) 0.90 (0.37–3.09) 0.04
Urine occult bloodc 124 (87) 101 (87) 23 (88) 0.57
Smoke (never/past/current)de 81 (62)/33 (25)/16 (12) 66 (63)/26 (25)/13 (12) 15 (60)/7 (28)/3 (12) 0.83
Re-biopsyc 25 (18) 19 (16) 6 (23) 0.40
RBb
ACE-I or A 40 (28) 32 (28) 8 (31) 0.74
Calcium channel blockerb 30 (21) 22 (19) 8 (31) 0.18
Tonsillectomyb 86 (61) 74 (64) 12 (46) 0.09
Steroid therapyb 101 (71) 84 (72) 17 (65) 0.48
TSPb 83 (58) 71 (61) 12 (46) 0.16
Table 1. Clinical characteristics at baseline. Data are mean ± standard deviation, n (%), or median (inter-
quartile range) unless otherwise indicated. BMI, body mass index; SBP, systolic blood pressure; DBP, diastolic
blood pressure; MAP, mean arterial pressure; sCr, serum creatinine; eGFR, estimated glomerular filtration rate;
UP, urinary protein; ACE-I, angiotensin converting enzyme inhibitor; ARB, angiotensin receptor blocker; TSP,
tonsillectomy combined with steroid pulse therapy. a Student’s t-test. b Pearson’s chi-square test. c Fisher’s exact
test. d Wilcoxon test. e n = 130.
none of the parameters demonstrated significant contribution to the poor renal outcome. However, only ECA
and NPA were selected as significant variables in stepwise models (Supplementary Tables 4 and 5). As shown
in Supplementary Table 3, the glycans, Gal(β1-4)GlcNAc (Gal: galactose, GlcNAc: N-acetylglucosamine) and
high-mannose (Man) including Man(α1-6)Man, were reported to bind to ECA and NPA, respectively. Since the
glycosylation composition of IgG changes by biological age19 and 24 lectin signals among 45 lectins significantly
correlated with age (Supplementary Fig. 5), we selected the patients with 19–64 years old both in Group P and
G (40.4 ± 16.6, n = 20 vs 41.6 ± 12.7, n = 101) (P = 0.70), respectively. ECA (P = 0.047) but not NPA (P = 0.137)
remained statistically significant even after adjusting for established risk factors for progression of IgAN, i.e. age,
sex, eGFR, and UP in multivariate logistic regression analysis.
Influence of pathological scoring, lectin binding signals and steroid use on the renal out-
come. The Oxford classification and pathological grading are shown in Table 4. There were no statistically
significant differences in most of the pathological findings between Group P and G, whereas T score of Oxford
classification was significantly higher in Group P than in Group G (P = 0.04). The classification of pathological
features and their renal outcomes are shown in Table 5. Although only 11 patients were in T2 category, T2 score
of Oxford classification and percentage of interstitial fibrosis/tubular atrophy (IFTA) were significantly related to
the renal outcome in both univariate and multivariate models. Next, we investigated the correlation of ECA and
NPA with pathological parameters. ECA signals demonstrated mild correlation with T score (r = 0.25, P < 0.01),
cellular crescent (r = 0.22, P = 0.01), global sclerosis (r = 0.22, P = 0.01), and IFTA (r = 0.21, P = 0.01), while NPA
signals also revealed mild correlation with the T score (r = 0.32, P < 0.01), cellular crescent (r = 0.36, P < 0.01), and
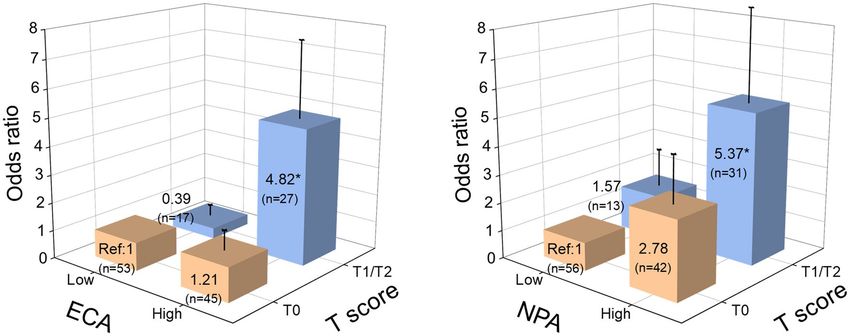
IFTA (r = 0.27, P < 0.01) (Supplementary Table 6). The comparisons of ORs in the groups stratified according
to ECA/NPA signals and T score are shown in Fig. 2. In E CAhigh and N PAhigh 2-quantile groups, the elevation
of risks for poor renal outcome were prominent in patients with severe interstitial disease (T1/T2). We further
analyzed the association between steroid therapy and the renal outcome in subgroups stratified by MEST-C
scores, including mesangial hypercellularity (M), segmental sclerosis (S), interstitial fibrosis/tubular atrophy (T)
lesions, and crescents (C) (Supplementary Table 7). As a result, the patients with cellular crescent and adhesion
were more likely to receive steroid therapy than those without cellular crescent (p = 0.01) or adhesion (p = 0.03).
In contrast, the patients with higher T scores were more likely to avoid steroid therapy (p < 0.01).
Incremental predictive power of urinary glycan levels of ECA and NPA, plus T score. The
Akaike information criterion (AIC) for evaluating the model fitting, concordance index (C-index), category-
Scientific Reports | (2021) 11:3394 | https://doi.org/10.1038/s41598-020-77736-1 3
Vol.:(0123456789)www.nature.com/scientificreports/
Figure 1. Univariate and multivariate logistic regression models for the renal outcome predicted by glycan
indexes of 45 lectins. In the multivariate model, the OR for 1 SD of the net glycan intensity was adjusted for
age, sex, eGFR, and log-transformed 24-h urinary protein at baseline. *P < 0.05, **P < 0.01. Abbreviations: OR,
odds ratio; 95% CI, 95% confidence interval; eGFR, estimated glomerular filtration rate. (StataCorp. 2015. Stata
Statistical Software: Release 14. College Station, TX: StataCorp LP)
Multivariate
Univariate Stepwise model Model 1 Model 2 Model 3 Model 4
OR P OR P OR P OR P OR P OR P
ECA (Net glycan intensity) (1 SD increments) 3.00 0.0016 3.48 0.001 2.84 0.03 2.69 0.04 2.66 0.04 2.67 0.05
Age (years) 1.03 0.06 1.05 0.01 1.05 0.01 1.05 0.02 1.05 0.03 1.06 0.01
Sex 1.62 0.27 1.72 0.27 1.63 0.33 1.57 0.37 1.90 0.21
2)
eGFR (mL/min/1.73 m 1.00 0.74 1.03 0.01 1.04 0.01 1.03 0.01 1.04 0.01 1.07 0.0003
UP (g/day) 1.62 0.02 1.23 0.48 1.26 0.43 1.16 0.63 1.13 0.69
IgA (mg/dL) 1.00 0.05 1.00 0.37
SBP (mmHg) 1.04 0.01 1.02 0.19
T score
T1 1.62 0.35 5.53 0.03
T2 5.00 0.02 22.77 0.01
Table 2. Univariate and multivariate logistic regression models using ECA signal and established risk factors
to predict renal outcome. Independent variables are as follow; Stepwise Model: ECA + Age + Sex + eGFR + UP;
Model 1: ECA + Age + Sex + eGFR + UP; Model 2: ECA + Age + Sex + eGFR + UP + IgA; Model 3:
ECA + Age + Sex + eGFR + UP + SBP; Model 4: ECA + Age + Sex + eGFR + UP + T score. ECA, Erythrina
cristagalli lectin; eGFR, estimated glomerular filtration rate; UP, urinary protein; SBP, systolic blood pressure;
SD, standard deviation; OR, Odds ratio; P, P-value.
free net reclassification improvement (NRI), and integrated discrimination improvement (IDI) for predicting
the primary renal outcome at the median follow-up time (3 years) obtained by adding the ECA, NPA, T score,
and their combinations are summarized in Table 6. Adding the ECA, NPA, or T score to the multivariate model
displayed improved the models, as shown by a decreased AIC and increased NRI. However, the addition of sin-
gle parameters did not improve other model fitting indexes such as the C-index and IDI. Next, we investigated
the effects of various combination of T score, ECA, and NPA signals. The combination of 2 parameters improved
Scientific Reports | (2021) 11:3394 | https://doi.org/10.1038/s41598-020-77736-1 4
Vol:.(1234567890)www.nature.com/scientificreports/
Multivariate
Univariate Stepwise model Model 1 Model 2 Model 3 Model 4
OR P OR P OR P OR P OR P OR P
NPA (Net glycan intensity) (1 SD increments) 2.17 0.01 2.65 0.001 2.32 0.02 2.21 0.04 2.13 0.04 2.11 0.05
Age (years) 1.03 0.06 1.05 0.005 1.06 0.0043 1.05 0.02 1.05 0.02 1.06 0.01
Sex 1.62 0.27 1.71 0.27 1.62 0.33 1.56 0.38 2.01 0.18
2)
eGFR (mL/min/1.73 m 1.00 0.74 1.04 0.004 1.04 0.0026 1.04 0.01 1.04 0.0027 1.07 0.0001
UP (g/day) 1.62 0.02 1.18 0.58 1.22 0.51 1.14 0.66 1.10 0.76
IgA (mg/dL) 1.00 0.05 1.00 0.42
SBP (mmHg) 1.04 0.01 1.02 0.23
T score
T1 1.62 0.35 5.25 0.04
T2 5.00 0.02 22.36 0.01
Table 3. Univariate and multivariate logistic regression models using NPA signal and established risk factors
to predict renal outcome. Independent variables are as follow; Stepwise Model: NPA + Age + Sex + eGFR + UP;
Model 1: NPA + Age + Sex + eGFR + UP; Model 2: NPA + Age + Sex + eGFR + UP + IgA; Model 3:
NPA + Age + Sex + eGFR + UP + SBP; Model 4: NPA + Age + Sex + eGFR + UP + T score. NPA, Narcissus
pseudonarcissus lectin; eGFR, estimated glomerular filtration rate; UP, urinary protein; SBP, systolic blood
pressure; OR, Odds ratio; P, P-value.
Renal outcome
Pathological parameters All patients (n = 142) Good (G) (n = 116) Poor (P) (n = 26) P value
Oxford classification
M1b 5 (4) 5 (4) 0 (0) 0.59
E1a 42 (30) 34 (29) 8 (31) 0.88
S1a 57 (40) 45 (39) 12 (46) 0.49
Tc
0 98 (69) 84 (72) 14 (54)
1 33 (23) 26 (22) 7 (27) 0.04
2 11 (8) 6 (5) 5 (19)
Cellular crescenta 29 (20) 24 (21) 5 (19) 0.87
Fibrocellular crescenta 68 (48) 57 (49) 11 (42) 0.53
Fibrous crescenta 30 (21) 24 (21) 6 (23) 0.79
Adhesiona 113 (80) 92 (79) 21 (81) 0.87
Percentage of global sclerosisc 10 (0–22) 10 (0–22) 10 (0–39) 0.83
Percentage of IFTAc 20 (10–0) 20 (10–30) 20 (10–50) 0.31
Glomerular number obtained by renal biopsyc 17 (12–21) 16 (12–21) 18 (12–24) 0.52
Table 4. Pathological features. Data are n (%), or median (inter-quartile range) unless otherwise indicated.
Oxford classification; M1, Mesangial hypercellularity score > 0.5; E1, any endocapillary hypercellularity; S1, any
segmental sclerosis; T, tubular atrophy and interstitial fibrosis (T0 ≤ 25%, 25% < T1 ≤ 50%, T2 > 50% of cortical
area); IFTA, interstitial fibrosis/tubular atrophy. a Pearson’s chi-square test. b Fisher’s exact test. c Wilcoxon test.
all of the incremental predictive abilities, i.e. ECA and T score; AIC decreased from 127.6 to 119.1, difference
of C-index: 0.05 (95% CI: 0.00–0.11), category-free NRI: 0.69 (0.20–1.19), and IDI: 0.14 (0.01–0.26), NPA and
T score; AIC decreased from 127.6 to 119.4, difference of C-index: 0.05 (-0.00–0.10), category-free NRI: 0.70
(0.14–1.27), and IDI: 0.13 (0.01–0.25). Receiver operating curves (ROC) of estimation models with and without
glycan index and T score are shown in Supplementary Fig. 6. The calculated sensitivity, specificity, and accuracy
by Youden’s method are shown in Supplementary Table 8. The addition of ECA or NPA increased sensitivity and
further inclusion of T score improved specificity.
Discussion
Glycans play pivotal roles in various physiological and pathological processes such as development, inflam-
mation, autoimmune, hormone action, cell adhesion, and cancer20–22. In the current investigation, we firstly
demonstrated that urinary excretion of glycans originated from the N-glycosylation process was tightly associ-
ated with the renal prognosis of IgAN. We found that the urinary excreted levels of glycans binding to ECA and
NPA were significantly higher in IgAN patients with a poor renal outcome (Group P). Gal(β1-4)GlcNAc bound
Scientific Reports | (2021) 11:3394 | https://doi.org/10.1038/s41598-020-77736-1 5
Vol.:(0123456789)www.nature.com/scientificreports/
Univariate model Multivariate model
Pathological parameters Odds ratio 95%CI P value Pathological parameters Odds ratio 95%CI P value
Oxford classification Oxford classification
M1 – – – M1 – – –
E1(vs. E0) 1.07 0.43–2.70 0.88 E1(vs. E0) 0.74 0.27–2.06 0.56
S1(vs. S0) 1.35 0.57–3.19 0.49 S1(vs. S0) 1.02 0.38–2.71 0.97
T1(vs. T0) 1.62 0.59–4.43 0.35 T1(vs. T0) 4.49 1.03–19.53 0.05
T2(vs. T0) 5.00 1.34–18.62 0.02 T2(vs. T0) 26.79 3.22–222.61 < 0.01
Cellular crescenta 0.91 0.31–2.67 0.87 Cellular crescenta 0.47 0.13–1.65 0.24
Fibrocellular crescenta 0.76 0.32–1.79 0.53 Fibrocellular crescenta 0.78 0.31–1.97 0.60
Fibrous crescenta 1.15 0.42–3.18 0.79 Fibrous crescenta 1.29 0.42–3.96 0.66
Adhesiona 1.10 0.37–3.21 0.87 Adhesiona 1.41 0.41–4.92 0.59
Global sclerosisa 1.01 0.99–1.04 0.20 Global sclerosisa 1.02 0.99–1.05 0.26
IFTA (10% increase) 1.26 1.02–1.55 0.04 IFTA (10% increase) 1.60 1.11–2.31 0.01
Table 5. Logistic regression analysis of the renal outcome. Oxford classification; M1, Mesangial
hypercellularity score > 0.5; E1, any endocapillary hypercellularity; S1, any segmental sclerosis; T, tubular
atrophy and interstitial fibrosis (T0 ≤ 25%, 25% < T1 ≤ 50%, T2 > 50% of cortical area). CI, confidence interval;
IFTA, interstitial fibrosis / tubular atrophy. a The absence of each pathological parameter is defined as a
reference.
Figure 2. The comparisons of the odds ratios in the groups stratified according to ECA/NPA signals and T
score. All patients were divided into four groups by lower or higher median lectin binding signals for ECA, NPA
and T score (T0, T1, and T2). The odds ratio for renal outcome was calculated by a logistic regression analysis.
The box and neighboring number indicate the odds ratio, and the bar shows the standard error. *P < 0.05 (vs
reference group). Abbreviations: ECA, Erythrina cristagalli lectin; NPA, Narcissus pseudonarcissus lectin; Ref,
reference. (StataCorp. 2015. Stata Statistical Software: Release 14. College Station, TX: StataCorp LP)
to ECA is involved in the process of both N- and O-glycosylation, while high-mannose including Man(α1-6)
Man bound to NPA is mainly involved in N-glycosylation. It was recognized that aberrant N-glycosylation of
IgA was associated with the pathogenesis of mouse IgAN23. Similarly, the abnormalities of O-glycans as well
as the N-glycans in the aberrant IgA1 in human IgAN were reported24. Iwanami et al. showed that most of the
N-glycans of the aberrant IgA1 were neutral complex- and high mannose-type, and the high mannose-type
glycan was abundant and exclusively observed in the aberrant IgA124. Although all 45 lectins including ECA and
NPA recognize specific sugar structures, any protein carriers with specific sugar structures could be detected
by lectin array systems and lectin signals are not confined to specific protein carrier, such as IgA. In organelles,
N-glycosylation process begins in the endoplasmic reticulum (ER), and the complex- and hybrid- type glycans
are synthesized from the high mannose-type glycans by its trimming and subsequent glycan elongation through
the Golgi25. More specifically, high-mannose including Man(α1-6)Man is synthesized in the ER, Cis-Golgi, and
part of the Medial-Golgi, subsequently complex- and hybrid- type glycans are generated in another part of the
Medial-Golgi and Trans-Golgi25,26. In the final step in the Golgi, sialyltransferase, which enables sialic acid to
bind to Gal(β1-4)GlcNAc, also functions in the Trans-Golgi (Supplementary Fig. 7a)26. The knockout of genes
encoding α1,2-mannosidase-I and N-acetylglucosaminyl-transferase-I in HEK293 cells resulted in removed
hybrid- and complex-type N-glycans and only high mannose-type N-glycans among recombinant p roteins27.
In addition, we previously raised the possibilities that urinary glycan excretion could reflect kidney-specific
Scientific Reports | (2021) 11:3394 | https://doi.org/10.1038/s41598-020-77736-1 6
Vol:.(1234567890)www.nature.com/scientificreports/
Depesndent C-index (95% Difference of Category-free
variables AIC CI) C-index (95% CI) P value NRI (95% CI) P value IDI (95% CI) P value
Only covariates
127.6 0.76 (0.65–0.87)
(crude)
With ECA (Galβ1- 0.03 (− 0.02 to 0.05 (− 0.01 to
123.9 0.79 (0.67–0.90) 0.21 0.56 (0.09–1.02) 0.02 0.12
4GlcNAc) 0.07) 0.11)
With NPA (High-
0.01 (− 0.04 to 0.05 (− 0.02 to
Man including 124.2 0.77 (0.66–0.89) 0.63 0.51 ( 0.08–0.94) 0.02 0.19
0.06) 0.13)
Manα1-6Man)
0.04 (− 0.01 to 0.09 (− 0.01 to
With T score 121.5 0.80 (0.69–0.91) 0.09 0.67 (0.17–1.17) 0.009 0.08
0.09) 0.19)
Combination with
124.8 NAa NAa NAa NAa
ECA and NPA
Combination with
119.1 0.81 (0.71–0.92) 0.05 (0.00–0.11) 0.045 0.69 (0.20–1.19) 0.006 0.14 (0.01–0.26) 0.03
ECA and T score
Combination with 0.05 (− 0.00 to
119.4 0.81 (0.70–0.93) 0.06 0.70 (0.14–1.27) 0.01 0.13 (0.01–0.25) 0.03
NPA and T score 0.10)
Table 6. AIC, category-free NRI, and IDI for predicting the 3-year outcome with glycan index data, and
difference of C-index between estimation models with or without glycan index and T score. Covariates (crude)
were age, sex, estimated glomerular filtration rate, and log-transformed urinary protein excretion at the time
of renal biopsy. AIC, Akaike’s information criterion; NRI, net reclassification improvement; IDI, integrated
discrimination improvement; 95% CI, 95% confidence interval; C-index, concordance index; T score,
tubular atrophy and interstitial fibrosis (T0 ≤ 25%, 25% < T1 ≤ 50%, T2 > 50% of cortical area); ECA, Erythrina
cristagalli lectin; NPA, Narcissus pseudonarcissus lectin; NA, Not applied. a In combination with ECA and NPA
model, the AIC was higher than the single models of ECA, NPA, and T score, and other statistical analyses
were not performed.
alterations of glycosylation rather than circulating serum glycosylation c hanges18. Taken together, the increased
urinary high-mannose including Man(α1-6)Man and Gal(β1-4)GlcNAc could reflect the glycosylation abnormal-
ity in the Trans-Golgi and Medial-Golgi of renal tissues, and those glycosylation abnormalities might be involved
in the progression of IgA nephropathy (Supplementary Fig. 7b).
Since the Oxford classification was published, a number of studies have proved that the classification is
useful for predicting the renal prognosis of IgAN. The relationship of the renal prognosis with mesangial and
endocapillary hypercellularity is still controversial, while IFTA has been reported to be a strong predictor of the
renal outcome in several s tudies28–31. In our study, IFTA was significantly associated with the renal prognosis
independent of baseline proteinuria and eGFR, which was compatible with previous reports28–31. Intriguingly,
IFTA demonstrated mild correlation with the ECA and NPA signals, suggesting that the glycans detected by ECA
and NPA might be involved in the mechanism of IFTA progression (Table 6). Furthermore, the urinary ECA and
NPA signals had incremental predictive abilities when they were added to the model containing IFTA (Table 6).
The addition of T scores in multivariate logistic regression model 1 in Tables 2 and 3; Supplementary Tables 4
and 5 did not alter the ORs of ECA and NPA signals, respectively. Therefore, we speculate that ECA/NPA binding
glycans and interstitial renal injuries shown by IFTA are independently associated with progression of IgAN.
As well as IFTA, glomerular crescents tightly associated with a poor renal outcome of IgAN, resulting in the
new inclusion of cellular and/or fibrocellular crescent scoring in the updated Oxford c lassification32,33. In the cur-
rent investigation, crescents and segmental sclerosis were not associated with the renal prognosis. We found that
patients with cellular crescents were more likely to receive steroid therapy than those without cellular crescents,
and steroid therapy was associated with a good renal prognosis in the cellular crescent ( +) group. Likewise, in
the patients with segmental sclerosis, those with steroid therapy tended to have a better renal prognosis, although
the difference did not reach statistical significance (Supplementary Table 7). Given these associations, the treat-
ment strategies and their therapeutic effects might affect the prognosis, resulting in different consequences from
previous studies.
The localization of glycans in kidney tissues has been investigated only in the limited studies. ECA has been
reported to bind to the proximal, distal tubules in the cortex, and the loops of Henle in the inner medulla on
human kidney tissues34. The reported localization of ECA-recognizing Gal(β1-4)GlcNAc may support the link
between elevation of urinary ECA signals and IFTA. NPA is a member of a large family of monocot mannose-
binding proteins. The preferred glycan structures differ among lectins belonging to the same family. For exam-
ple, NPA binds to α1-6-linked mannosyl residues, while GNA has a higher affinity to α1-3-linked mannosyl
residues35. Since the relationship between NPA and kidney diseases has not been investigated, further experi-
mental research is needed.
One of the limitations was the observational study with relatively smaller number of the enrolled patients.
For example, only 26 renal events were observed, and 11 patients were classified as T2 category. We could not
completely negate the possibility that the treatments for IgAN might not be standardized and the potential con-
founders could not be fully adjusted in the analyses. However, we observed no statistical differences in major
treatment factors, such as ACE-I or ARB use, steroid therapy, and blood pressure control between Group P and
G (Supplementary Table 2). Moreover, our sensitivity analyses revealed that ECA and NPA signals were still
significant in the multivariate logistic regression analysis even after adjustment for various potential confounders
Scientific Reports | (2021) 11:3394 | https://doi.org/10.1038/s41598-020-77736-1 7
Vol.:(0123456789)www.nature.com/scientificreports/
(Tables 2, 3; Supplementary Tables 4 and 5). Another limitation is that the lectin microarray system may not
determine the complete glycan structure and unknown preferred glycans to lectin potentially result in some bias.
However, less time-consuming and more cost effective than conventional methods such as mass spectrometry
(MS) were the benefits of lectin microarray20.
In conclusion, we showed that urinary excretion of glycans binding to two lectins, ECA recognizing Gal(β1-4)
GlcNAc, and NPA binding to high-mannose including Man(α1-6)Man, were significantly associated with a poor
renal prognosis in patients with IgAN. Furthermore, the addition of one of the two lectin binding signals and the
Oxford classification T score to known renal prognostic factors can significantly improve the prediction of renal
outcome. We need the further research to prove the underling mechanisms why the ECA and NPA signals could
increase in urine of IgAN progressors and the abnormalities of glycosylation, especially N-glycosylation which
was commonly recognized by ECA and NPA, might be involved with the progression of IgAN.
Methods
Study design. The current study was conducted as a retrospective cohort study. Among 157 patients diag-
nosed as “isolated IgAN” by performing biopsies from December 2010 to August 2017 at Okayama University
Hospital, 142 were eligible for the enrollment. The patients with ≤ 3 glomeruli on biopsy specimens, < 1 year of
follow-up, < 3 repeated measurements of eGFR, and a baseline eGFR < 10 mL/min/1.73 m 2 were excluded (Sup-
plementary Fig. 1).
Ethics statement. This study was conducted in accordance with the principles of the Declaration of Hel-
sinki, and the protocol was approved by the ethics committee of Okayama University Hospital (authorization
number: 1709–039). Written informed consents were obtained from all participants. For patients < 18 years old,
informed consent was obtained from parents or legal guardian. The study is registered with the University Hos-
pital Medical Information Network Clinical Trials Registry (UMIN000029336).
Lectin microarray analysis. Urine samples collected and stored at renal biopsy were used to measure
urinary glycan levels. All specimens were stored at -80 °C, and thawed once to perform this study. We previously
described a novel technique of glycan profiling by the evanescent-field fluorescence-assisted lectin microarray.
In brief, 20 μL of urine samples were labeled with 100 μg of Cy3 (GE Healthcare) and free Cy3 was removed
by Zeba Desalt Spin Column (Pearce). We applied urinary Cy3-labeled glycoproteins on the wells of LecChip
Ver1.0 plotted with 45 lectins. The lectin binding signals were measured with GlycoStation Reader 1200 with
scanning condition of Cumulative = 4 times, Exposure time = 299msec, Camera Gains = 75, 85, 95, 105, 115,
125 (GlycoTechnica Ltd, Tsukuba). Since Cy3 binds to primary amine in principle, and urinary albumin and
creatinine were labeled by Cy3, causing minimal background reactivity. The data were analyzed by software,
GlycoStation Tools Pro Ver.1.5., and the glycan index, i.e. the net glycan intensity (Net-I = raw glycan intensity
[Raw-I] – background intensity [BG-I]) was used to quantify the lectin biding signals. In previous study, we
investigated the variations between spot urine and 24-h collected urine data using 3 parameters, Net-I, Net-I/
urinary creatinine (UCr), and Raw-I/UCr. As a result, Net-I values of spot urine most exactly reflected the 24-h
urine among 3 parameters18. The changes of glycosylation modification in urinary proteins is quantitatively
demonstrated by Net-I values, since the BG-I mainly reflects Cy3-albumin and Cy3-creatine and the subtraction
of BG-I normalizes the albumin and creatinine concentrations in each urine sample. We performed all analyses
by using the glycan index appropriately transformed from the Net-I according to its distribution.
Laboratory parameters. Hypertension was defined as the baseline BP ≥ 140/90 mmHg or use of anti-
hypertensive agents. For patients ≥ 18 years old, the eGFR was estimated by the equation: eGFR (mL/min/1.73
2) = 194 × (serum creatinine [sCr] [mg/dL])−1.094 × (age [years])−0.287 (× 0.739 if female)36. For patients < 18 years
m
old, the eGFR was calculated using the equation reported by the Japanese Society for Pediatric N ephrology37.
Occult blood in urine was defined as > 5 urinary red blood cells /high-powered field in multiple urinalysis before
a renal biopsy.
Diagnosis and Oxford classification. The diagnosis of IgAN performed by 3 nephrologists and a renal
pathologist by confirming mesangial proliferative glomerulonephritis in light microscopy, mesangial IgA depo-
sition by immunofluorescence, and electron-dense deposits in the mesangial area by electron m icroscopy38. The
following pathological scoring systems were employed, including MEST scores by Oxford classification39, pres-
ence of crescent formation (cellular/fibrocellular/fibrous) & tuft adhesion, glomeruli with global sclerosis (%),
and IFTA (10% increments). There was very good agreement among 3 nephrologists’ scores in the percentage
of IFTA (weighted κ value40: 0.92). The Oxford classification excludes cases with fewer than 8 glomeruli from
analysis39. In this investigation, 9 patients (7 ≥ glomeruli ≥ 4) were included and the Oxford classification was
performed by the consensus of 3 nephrologists.
Outcomes. The primary outcome was defined as meeting at least one of the following criteria: eGFR decline
of > 4 ml/min/1.73 m2/year during follow-up, 30% decline in eGFR from the baseline within three years, and
commencement of renal replacement therapy for end-stage renal disease within the same period. The partici-
pants who reached the renal outcome were defined Group P (poor renal outcome; n = 26) and the others as
Group G (good renal outcome; n = 116). We selected the composite outcome because the absolute eGFR decline,
but the percent eGFR decline, is not affected by the baseline eGFR, and the composite outcome including abso-
lute and percent eGFR decline is employed in a recent biomarker study41–43.
Scientific Reports | (2021) 11:3394 | https://doi.org/10.1038/s41598-020-77736-1 8
Vol:.(1234567890)www.nature.com/scientificreports/
Statistical analysis. Continuous variables are summarized as mean ± standard deviation (SD) or the
median with the interquartile range, as appropriate. Categorical variables are presented as number of patients
and proportions (%). Student’s t-test for continuous data and of Wilcoxon test for ordinal scale data are applied
for comparing between two groups. Comparing the main clinical parameters at baseline and final follow-up was
evaluated using the paired t-tests, the Wilcoxon signed rank test, or the McNemar test. Categorical variables
were compared using Pearson’s chi-square test and Fisher’s exact test. Non-normally distributed variables were
subjected to log-transformation to improve normality before analysis. To evaluate inter-observer concordance,
we calculated weighted κ s tatistics40. The logistic regression model was used to calculate the OR and 95% CI. To
avoid the type I errors in null hypothesis testing when conducting multiple comparisons, FDR is calculated by
Benjamini and Hochberg. In the multivariate model, ORs were adjusted for age, sex, eGFR, and log-transformed
UP (g/day) at the time of renal biopsy. These covariates were selected according to biological plausibility and the
findings of previous reports44. In addition, as sensitivity analyses, other potential covariates were incorporated
into the multivariate models one by one. We tested for a formal interaction of each glycan index with eGFR or
log-transformed UP in the multivariate regression models. Any glycan index × eGFR/log-transformed UP was
not statistically significant. We also divided all patients into four groups by median of the glycan index (ECA or
NPA) and T score (T0 / T1 or T2), and calculated the ORs to the renal outcome by a logistic regression analysis.
Furthermore, several analyses were employed to evaluate the incremental predictive value of preferable glycan
biomarkers and pathological scores. We first used AIC to compare the model fitting. Next, C-index was com-
pared between multivariate logistic regression models with or without biomarkers. Finally, improvement in dis-
criminating the three-year risk of the outcome was assessed by analysis of category-free NRI and IDI, as reported
elsewhere45–47. The 95% CIs for the differences in the C-index, category-free NRI, and IDI were computed based
on 500 bootstrap samples. ROC of estimation models with and without glycan index and T score were used to
evaluate the characteristics of biomarkers. The cutoff points were calculated by Youden’s method. Two-tailed
P < 0.05 was considered to indicate statistical significance. Analyses and creation of graphs were performed with
StataCorp. 2015. Stata Statistical Software: Release 14. College Station, TX: StataCorp LP. and Origin version
2018 (OriginLab Corporation, MA, USA) software programs.
Data availability
The main clinical data and lectin binding signal data generated during the current study are available in the
Supplementary datasheet.
Received: 7 June 2020; Accepted: 17 November 2020
References
1. D’Amico, G. The commonest glomerulonephritis in the world: IgA nephropathy. Q. J. Med. 64, 709–727 (1987).
2. McGrogan, A., Franssen, C. F. & de Vries, C. S. The incidence of primary glomerulonephritis worldwide: a systematic review of
the literature. Nephrol. Dial. Transplant. 26, 414–430. https://doi.org/10.1093/ndt/gfq665 (2011).
3. Schena, F. P. & Nistor, I. Epidemiology of IgA nephropathy: a global perspective. Semin. Nephrol. 38, 435–442. https://doi.
org/10.1016/j.semnephrol.2018.05.013 (2018).
4. Lv, J. et al. Effect of oral methylprednisolone on clinical outcomes in patients with IgA nephropathy: the TESTING randomized
clinical trial. JAMA 318, 432–442. https://doi.org/10.1001/jama.2017.9362 (2017).
5. Barratt, J. & Feehally, J. IgA nephropathy. J. Am. Soc. Nephrol. 16, 2088–2097. https://doi.org/10.1681/ASN.2005020134 (2005).
6. Wyatt, R. J. & Julian, B. A. IgA nephropathy. N. Engl. J. Med. 368, 2402–2414. https://doi.org/10.1056/NEJMra1206793 (2013).
7. Wakai, K. et al. A scoring system to predict renal outcome in IgA nephropathy: from a nationwide prospective study. Nephrol.
Dial. Transplant. 21, 2800–2808. https://doi.org/10.1093/ndt/gfl342 (2006).
8. Berthoux, F. et al. Predicting the risk for dialysis or death in IgA nephropathy. J. Am. Soc. Nephrol. 22, 752–761. https://doi.
org/10.1681/ASN.2010040355 (2011).
9. Knoop, T. et al. Addition of eGFR and age improves the prognostic absolute renal risk-model in 1,134 Norwegian patients with
IgA nephropathy. Am. J. Nephrol. 41, 210–219. https://doi.org/10.1159/000381403 (2015).
10. Robert, T., Berthelot, L., Cambier, A., Rondeau, E. & Monteiro, R. C. Molecular insights into the pathogenesis of IgA nephropathy.
Trends Mol. Med. 21, 762–775. https://doi.org/10.1016/j.molmed.2015.10.003 (2015).
11. Suzuki, H. et al. The pathophysiology of IgA nephropathy. J. Am. Soc. Nephrol. 22, 1795–1803. https://doi.org/10.1681/ASN.20110
50464(2011).
12. Glassock, R. J. The pathogenesis of IgA nephropathy. Curr. Opin. Nephrol. Hypertens. 20, 153–160. https://doi.org/10.1097/
MNH.0b013e3283436f5c (2011).
13. Inoue, T. et al. Suppression of adiponectin by aberrantly glycosylated IgA1 in glomerular mesangial cells in vitro and in vivo. PLoS
ONE 7, e33965. https://doi.org/10.1371/journal.pone.0033965 (2012).
14. Inoue, T. et al. Abnormalities of glycogenes in tonsillar lymphocytes in IgA nephropathy. Adv. Otorhinolaryngol. 72, 71–74. https
://doi.org/10.1159/000324610 (2011).
15. Stuchlova Horynova, M. et al. N-acetylgalactosaminide alpha2,6-sialyltransferase II is a candidate enzyme for sialylation of galac-
tose-deficient IgA1, the key autoantigen in IgA nephropathy. Nephrol. Dial. Transplant. 30, 234–238. https://doi.org/10.1093/ndt/
gfu308 (2015).
16. Suzuki, H. et al. Galactose-deficient IgA1 as a candidate urinary polypeptide marker of IgA nephropathy?. Dis. Markers 2016,
7806438. https://doi.org/10.1155/2016/7806438 (2016).
17. Berthoux, F. et al. Autoantibodies targeting galactose-deficient IgA1 associate with progression of IgA nephropathy. J. Am. Soc.
Nephrol. 23, 1579–1587. https://doi.org/10.1681/ASN.2012010053 (2012).
18. Mise, K. et al. Identification of novel urinary biomarkers for predicting renal prognosis in patients with type 2 diabetes by glycan
profiling in a multicenter prospective cohort study: U-CARE study 1. Diabetes Care 41, 1765–1775. https://doi.org/10.2337/dc18-
0030 (2018).
19. Gudelj, I., Lauc, G. & Pezer, M. Immunoglobulin G glycosylation in aging and diseases. Cell. Immunol. 333, 65–79. https://doi.
org/10.1016/j.cellimm.2018.07.009 (2018).
20. Hirabayashi, J., Yamada, M., Kuno, A. & Tateno, H. Lectin microarrays: concept, principle and applications. Chem. Soc. Rev. 42,
4443–4458. https://doi.org/10.1039/c3cs35419a (2013).
Scientific Reports | (2021) 11:3394 | https://doi.org/10.1038/s41598-020-77736-1 9
Vol.:(0123456789)www.nature.com/scientificreports/
21. Gill, D. J., Clausen, H. & Bard, F. Location, location, location: new insights into O-GalNAc protein glycosylation. Trends Cell Biol.
21, 149–158. https://doi.org/10.1016/j.tcb.2010.11.004 (2011).
22. Belicky, S., Katrlik, J. & Tkac, J. Glycan and lectin biosensors. Essays Biochem. 60, 37–47. https://doi.org/10.1042/EBC20150005
(2016).
23. Nishie, T. et al. Development of immunoglobulin A nephropathy- like disease in beta-1,4-galactosyltransferase-I-deficient mice.
Am. J. Pathol. 170, 447–456. https://doi.org/10.2353/ajpath.2007.060559 (2007).
24. Iwanami, N. et al. Similarities between N-glycan glycoform of tonsillar IgA1 and that of aberrant IgA1 abundant in IgA nephropathy
patient serum. J. Nephrol. 21, 118–126 (2008).
25. Vasconcelos-Dos-Santos, A. et al. Biosynthetic machinery involved in aberrant glycosylation: promising targets for developing of
drugs against cancer. Front. Oncol. 5, 138. https://doi.org/10.3389/fonc.2015.00138 (2015).
26. Varki, A. et al. Essentials of Glycobiology 3rd edn. (Cold Spring Harbor Laboratory Press, New York, 2017).
27. Ren, W. W. et al. Glycoengineering of HEK293 cells to produce high-mannose-type N-glycan structures. J. Biochem. 166, 245–258.
https://doi.org/10.1093/jb/mvz032 (2019).
28. Shi, S. F. et al. Pathologic predictors of renal outcome and therapeutic efficacy in IgA nephropathy: validation of the oxford clas-
sification. Clin. J. Am. Soc. Nephrol. 6, 2175–2184. https://doi.org/10.2215/CJN.11521210 (2011).
29. Herzenberg, A. M. et al. Validation of the Oxford classification of IgA nephropathy. Kidney Int. 80, 310–317. https: //doi.org/10.1038/
ki.2011.126 (2011).
30. Yau, T., Korbet, S. M., Schwartz, M. M. & Cimbaluk, D. J. The Oxford classification of IgA nephropathy: a retrospective analysis.
Am. J. Nephrol. 34, 435–444. https://doi.org/10.1159/000332223 (2011).
31. Kang, S. H. et al. The Oxford classification as a predictor of prognosis in patients with IgA nephropathy. Nephrol. Dial. Transplant.
27, 252–258. https://doi.org/10.1093/ndt/gfr295 (2012).
32. Lv, J. et al. Evaluation of the Oxford Classification of IgA nephropathy: a systematic review and meta-analysis. Am. J. Kidney Dis.
62, 891–899. https://doi.org/10.1053/j.ajkd.2013.04.021 (2013).
33. Trimarchi, H. et al. Oxford Classification of IgA nephropathy 2016: an update from the IgA Nephropathy Classification Working
Group. Kidney Int. 91, 1014–1021. https://doi.org/10.1016/j.kint.2017.02.003 (2017).
34. Grupp, C. et al. Identification of nucleated cells in urine using lectin staining. Am. J. Kidney Dis. 37, 84–93. https: //doi.org/10.1053/
ajkd.2001.20592(2001).
35. Sauerborn, M. K., Wright, L. M., Reynolds, C. D., Grossmann, J. G. & Rizkallah, P. J. Insights into carbohydrate recognition by
Narcissus pseudonarcissus lectin: the crystal structure at 2 A resolution in complex with alpha1-3 mannobiose. J. Mol. Biol. 290,
185–199. https://doi.org/10.1006/jmbi.1999.2862 (1999).
36. Matsuo, S. et al. Revised equations for estimated GFR from serum creatinine in Japan. Am. J. Kidney Dis. 53, 982–992. https://doi.
org/10.1053/j.ajkd.2008.12.034 (2009).
37. Uemura, O. et al. Creatinine-based equation to estimate the glomerular filtration rate in Japanese children and adolescents with
chronic kidney disease. Clin. Exp. Nephrol. 18, 626–633. https://doi.org/10.1007/s10157-013-0856-y (2014).
38. Jennette, J. C., Heptinstall, R. H., Olson, J. L., Silva, F. G. & DʾAgati, V. D. Heptinstall’s Pathology of the Kidney. 7th ed edn (Wolters
Kluwer, Alphen aan den Rijn, 2015).
39. Roberts, I. S. D. et al. The Oxford classification of IgA nephropathy: pathology definitions, correlations, and reproducibility. Kidney
Int. 76, 546–556. https://doi.org/10.1038/ki.2009.168 (2009).
40. Kundel, H. L. & Polansky, M. Measurement of observer agreement. Radiology 228, 303–308. https://doi.org/10.1148/radiol.22820
11860(2003).
41. Peters, K. E. et al. Identification of novel circulating biomarkers predicting rapid decline in renal function in type 2 diabetes: the
fremantle diabetes study phase II. Diabetes Care 40, 1548–1555. https://doi.org/10.2337/dc17-0911 (2017).
42. Fan, F., Jia, J., Li, J., Huo, Y. & Zhang, Y. White blood cell count predicts the odds of kidney function decline in a Chinese commu-
nity-based population. BMC Nephrol. 18, 190. https://doi.org/10.1186/s12882-017-0608-4 (2017).
43. Peters, K. E. et al. Validation of a protein biomarker test for predicting renal decline in type 2 diabetes: the fremantle diabetes study
phase II. J. Diabetes Complicat. https://doi.org/10.1016/j.jdiacomp.2019.07.003 (2019).
44. Tangri, N. et al. A predictive model for progression of chronic kidney disease to kidney failure. JAMA 305, 1553–1559. https://
doi.org/10.1001/jama.2011.451 (2011).
45. Pencina, M. J., D’Agostino, R. B. Sr., D’Agostino, R. B. Jr. & Vasan, R. S. Evaluating the added predictive ability of a new marker:
from area under the ROC curve to reclassification and beyond. Stat. Med. 27, 157–172. https://doi.org/10.1002/sim.2929 (2008).
46. Pencina, M. J., D’Agostino, R. B. Sr. & Steyerberg, E. W. Extensions of net reclassification improvement calculations to measure
usefulness of new biomarkers. Stat. Med. 30, 11–21. https://doi.org/10.1002/sim.4085 (2011).
47. Pencina, M. J., D’Agostino, R. B., Pencina, K. M., Janssens, A. C. & Greenland, P. Interpreting incremental value of markers added
to risk prediction models. Am. J. Epidemiol. 176, 473–481. https://doi.org/10.1093/aje/kws207 (2012).
Acknowledgements
The authors thank Dr. Yuji Takatori (Kousei General Hospital), Dr. Kazuhi Taniai (Uneki Clinic), Dr. Takanobu
Nakajima (Kato & Namiki-dori Hospital), Dr. Kentaro Wada (Nippon Kokan Fukuyama Hospital), Dr. Soichiro
Haraguchi (Kobayashi clinic), Dr. Naoya Horimoto (Sumitomo Besshi Hospital), and Dr. Sonei Shojima (Fukuy-
ama Josei Hospital) for providing data and treating patients. The authors also thank Drs. Shinji Kitamura,
Haruhito Adam Uchida, Ryoko Umebayashi, Ayu Ogawa-Akiyama, Kishio Toma, Keiji Ohashi, Ichiro Nojima,
Yuzuki Kano, Yuriko Yamamura, Hiroko Takahashi, Mariko Nishiwaki, Keigo Hayashi, Noriko Fujiwara,
Naoko Kurooka, and Yosuke Asano (Okayama University Graduate School of Medicine, Dentistry and Phar-
maceutical Sciences, Okayama) for collecting data. This research is supported by AMED under grant number
JP19lk1403007h0001, and JSPS KAKENHI Grant Numbers JP19H03675, JP18K16001.
Author contributions
C.K. contributed to analyzing and interpreting data, collecting and summarizing clinical data, and writing the
manuscript. K.M. contributed to designing the research, analyzing and interpreting data, measuring urinary
glycan levels, collecting and summarizing clinical data, performing statistical analyses, and writing the manu-
script. H.S. contributed to collecting and summarizing clinical data. Y.O. contributed to measuring urinary
glycan signals, interpreting data, and writing manuscript. M.Ya. contributed to measuring urinary glycan signals,
interpreting data, and writing manuscript. M.Yo. contributed to interpreting data and performing statistical
analyses. J.W. was responsible for the study design, supervised data collection and data analysis, and contrib-
uted to drafting and editing the manuscript. J.W. is the guarantor of this work and, as such, had full access to all
the data in the study and takes responsibility for the integrity of the data and the accuracy of the data analysis.
Scientific Reports | (2021) 11:3394 | https://doi.org/10.1038/s41598-020-77736-1 10
Vol:.(1234567890)www.nature.com/scientificreports/
Competing interests
J.W. receives speaker honoraria from Astra Zeneca, Daiichi Sankyo, MSD, Novartis, Tanabe Mitsubishi, Taisho
Toyama and receives grant support from Baxter, Chugai, Dainippon Sumitomo, Ono, Teijin. M.Ya. is employee
of Glycotechnica. Rest of the authors declare no competing interest.
Additional information
Supplementary information is available for this paper at https://doi.org/10.1038/s41598-020-77736-1.
Correspondence and requests for materials should be addressed to K.M. or J.W.
Reprints and permissions information is available at www.nature.com/reprints.
Publisher’s note Springer Nature remains neutral with regard to jurisdictional claims in published maps and
institutional affiliations.
Open Access This article is licensed under a Creative Commons Attribution 4.0 International
License, which permits use, sharing, adaptation, distribution and reproduction in any medium or
format, as long as you give appropriate credit to the original author(s) and the source, provide a link to the
Creative Commons licence, and indicate if changes were made. The images or other third party material in this
article are included in the article’s Creative Commons licence, unless indicated otherwise in a credit line to the
material. If material is not included in the article’s Creative Commons licence and your intended use is not
permitted by statutory regulation or exceeds the permitted use, you will need to obtain permission directly from
the copyright holder. To view a copy of this licence, visit http://creativecommons.org/licenses/by/4.0/.
© The Author(s) 2021
Scientific Reports | (2021) 11:3394 | https://doi.org/10.1038/s41598-020-77736-1 11
Vol.:(0123456789)You can also read