RP2K: A Large-Scale Retail Product Dataset for Fine-Grained Image Classification - arXiv.org
←
→
Page content transcription
If your browser does not render page correctly, please read the page content below
RP2K: A Large-Scale Retail Product Dataset for
                                                   Fine-Grained Image Classification

                                                              Jingtian Peng1 Chang Xiao2 Xun Wei1 Yifan Li1
                                                             1
                                                               Pinlan Data Technology Co,. Ltd. 2 Columbia University
arXiv:2006.12634v5 [cs.CV] 18 Jan 2021

                                                                                        Abstract

                                                  We introduce RP2K, a new large-scale retail product dataset for fine-grained
                                                  image classification. Unlike previous datasets focusing on relatively few products,
                                                  we collect more than 500,000 images of retail products on shelves belonging to
                                                  2000 different products. Our dataset aims to advance the research in retail object
                                                  recognition, which has massive applications such as automatic shelf auditing and
                                                  image-based product information retrieval. Our dataset enjoys following properties:
                                                  (1) It is by far the largest scale dataset in terms of product categories. (2) All images
                                                  are captured manually in physical retail stores with natural lightings, matching
                                                  the scenario of real applications. (3) We provide rich annotations to each object,
                                                  including the sizes, shapes and flavors/scents. We believe our dataset could benefit
                                                  both computer vision research and retail industry. Our dataset is publicly available
                                                  at https://www.pinlandata.com/rp2k_dataset.

                                         1   Introduction

                                         Retailing is a vital commercial activity which plays an essential role in our daily life. The traditional
                                         retail industry requires tremendous human labor for its entire supply chain, from product distribution
                                         to inventory counting. In response to the rise of online shopping, traditional markets also quickly
                                         take advantage of AI-related technology at the physical store level to replace the tedious human labor
                                         by computer algorithms and robots. Many promising applications of applying AI to retailing are
                                         considered to be widely realized in the near-term. For instance, by using computer vision techniques,
                                         the retailers can audit the placement of products or track in-store sale activities from shelves images,
                                         while the customers can obtain the product information by taking pictures of the shelf. To implement
                                         these applications, one of the core problem is to apply object recognition techniques to recognize the
                                         products on shelves.
                                         Despite the recent advances in computer vision, the task of recognizing retail products on shelves,
                                         which is a basic task for many important retailing events, is still considerably challenging in the
                                         computer vision perspective. First, the number of product categories can be huge in a supermarket.
                                         According to Goldman et al. [13], a typical supermarket could have more than thousands of different
                                         products. Second, different products may have similar appearances. For example, products from
                                         the same brand with different sizes or flavors usually have similar appearance, but they should
                                         be recognized as separate products (see Fig. 1-a,b). Third, the camera angle of the product to be
                                         recognized and lighting condition may vary a lot (see Fig. 1-c), so a reliable recognition algorithm
                                         should able to handle the scene complexities.
                                         To overcome these challenges, several retail product datasets have been proposed in the past decades
                                         [42, 13, 28, 10, 15, 33]. However, most of the previous datasets either focus on a relatively small scale
                                         (less than 200 categories), or collect data in a controlled environment (e.g., lab with sufficient light).
                                         Thereby, we propose the RP2K dataset, which contains images of 2000 different products (stock
                                         keeping units or SKUs), from real retail stores, to bridge the gap between research and real-life
                                         applications.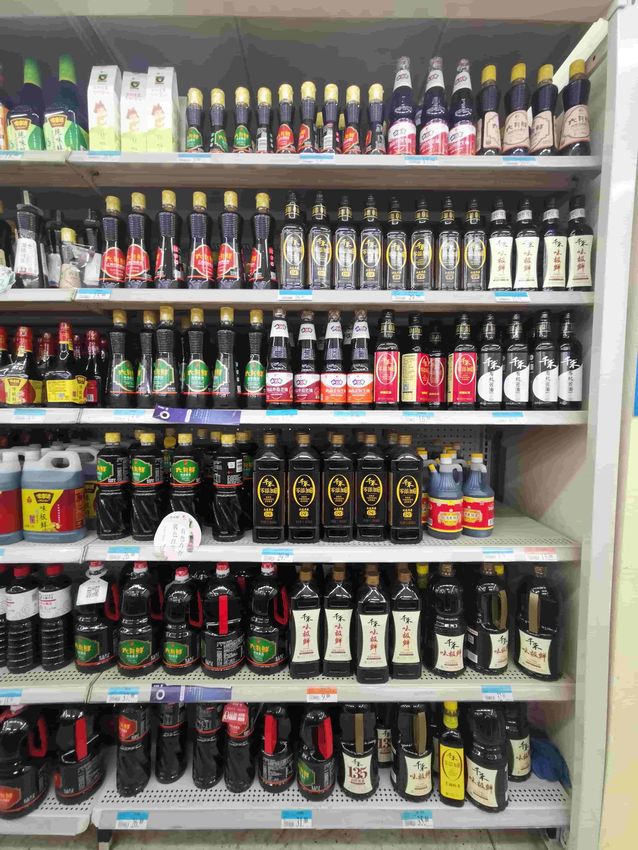
(a)

             (b)

             (c)

Figure 1: Sample images from our dataset. Precise retail product recognition on shelves is considered highly
challenging because (a) Products from the same line may have different sizes, and they usually have similar
appearances but different prices. The image size could not reflect the real size of the products. (b) The
manufacturer usually make multiple flavors for one product line, but their appearance only have subtle differences
on the labels. (c) Product images may be captured at different camera angles according to its placement location
on shelves. The image can also be stretched due to camera distortion.
It is worth noting that a full retail product recognition pipeline usually consists of two seperate
parts—an object detector for locating the potential objects of interests and a classifier to recognize the
object from a cropped image containing the object. Since the object detection task has been addressed
by many of the previous dataset [13, 42, 10], our dataset mainly focuses on recognizing objects on
retail shelves, namely, given a shelf image and bounding boxes of potential products on the shelf,
identifying the SKU ID for each bounding box1 .
We highlight the contributions of our dataset as follows:
Large scale. Our dataset is large scale in terms of both the number of images and the number of
categories. We collect images of 2000 different SKUs, each containing 250 images on average,
rendering a dataset with more than 500k images. We also include the 10k original on-shelf images,
with an average resolution of 3024 x 4032.
Realistic retail environment. Unlike many of the previous datasets with images taken under the
laboratory environment or web images, our images are all manually captured in real retail stores. The
collection of our dataset matches the settings of realistic applications.
Hierarchical labels. Besides the individual SKU ID of each image, we also provide multiple levels
of hierarchical labels. The 2000 SKUs can be categorized into 6 meta-categories based on their
product types, or another 7 meta-categories based or their shapes. In addition, we provide the detailed
attributes of each SKU, including the brand, flavor/type, and size, which allows the users to evaluate
their algorithms on a customized fine-grained level. We will discuss this more in Sec. 3.

2         Related work
2.1        Fine-grained image classification

Fine-grained image classification is an extensively-studied field in computer vision, which refers
to the task of recognizing images from multiple subordinate categories of a meta-category. Those
subordinate categories usually share similar visual features, thus additional attention is required
to deal with them. To benchmark the performance of fine-grained image classification algorithms,
      1
          We also release an auxiliary shelf object detection dataset, see Appendix C for details.

                                                             2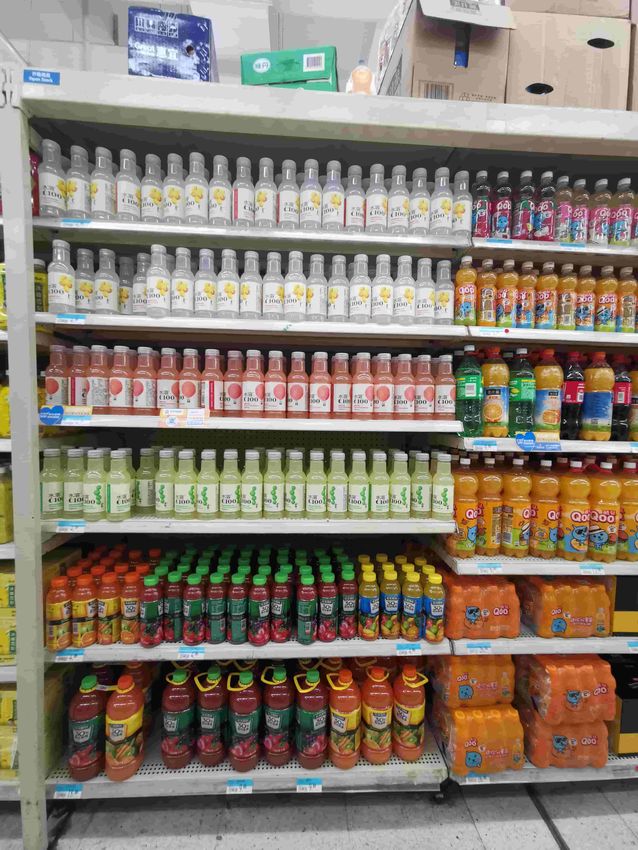
2000                                            Our RP2K Dataset

                        1000

               # Categories
                              500
                                                                 RPC
                              100         Grozi-120

                               50                       MVTEC
                                               TGFS
                                           Grocery Shelves
                                                                                     SKU-110K
                               0    10k       50k      100k      500k       1M       2M
                                                      # Images
Figure 2: Comparing to other datasets, our dataset shows considerably larger number of categories, while
maintaining a decent amount of images.

many datasets have been proposed in the past few years, including distinguishing different animal
species [43, 20, 3], car models [23] and clothes [26]. Comparing to traditional image classification,
fine-grained image classification is considered more challenging due to the similar appearance in
different subcategories. Furthermore, models trained on dataset with images captured under lab-
controlled environment may not perform well on natural images [11], so that additional domain
adaption techniques are required to resolve this gap.
Retail product recognition lies in the field of fine-grained image classification, as products from
different brands or with different flavors will look very similar even to human eyes.

2.2   Retail product dataset

Retail product detection/recognition has been widely-studied due to its basic role in automatic retailing
industry. Even before the deep learning dominant computer vision, researchers have investigated
recognition algorithms on various retail products datsets for decades. For example, SOIL-47 [4]
dataset contains only 47 categories and 987 images which were acquired under different geometry of
light sources. Grozi-120 [28] is proposed for recognizing groceries in physical retail store, which
contains 120 grocery product categories and 11,870 images. Similarly, the supermarket product
dataset [33] focuses on fruit and vegetable classification, containing 15 categories and 2,633 images.
There are many other similar datasets [12, 41, 18, 41], and we refer the reader to the survey [34] for
a comprehensive list of retail product datasets. Those early datasets usually have less than 20,000
images and may not work well on today’s data-demanding deep learning model. Thus, here we briefly
review some of the recently-released datasets that are most relevant to ours.
RPC dataset [42] is a large-scale dataset proposed for automatic checkout. It contains 200 categories
and 83,739 images. Each image includes different number of products, from 3 to 20, based on their
clutter mode. Since bounding boxes and labels are provided for each object in each image, it could
also provide more than 400k single-object images for object recognition task. However, since the
images were captured under controlled lighting and clean background, this dataset may not able to
reflect the real-life scenario of product recognition on shelves.
Take Goods from Shelves (TGFS) [15] dataset is a object detection/recognition dataset for automatic
checkout. Unlike RPC dataset captured in laboratory environment, TGFS dataset use images collected
from real self-service vending machines. Thus, the images are closer to the checkout system in
natural environment. Yet, it contains only 30K images from 24 fine-grained and 3 coarse classes, and
the resolution of each image is 480 x 640, which limit the usage of this dataset.
SKU-110K dataset [13] is so far the largest retail image dataset in terms of the number of images.
It contains more than 1M images from 11,762 images of store shelves. Since the main focus of the
dataset is retail object detection in densely packed scenes, they only provide bounding boxes of each
object in scene without further annotating the category of the bounding boxes. Thus, this dataset
cannot be used for object recognition purpose.
MVTEC [10] is an instance-aware semantic segmentation dataset for retail products. It provides
21,000 images of 60 object categories with pixelwise labels. It can also be served as additional

                                                         3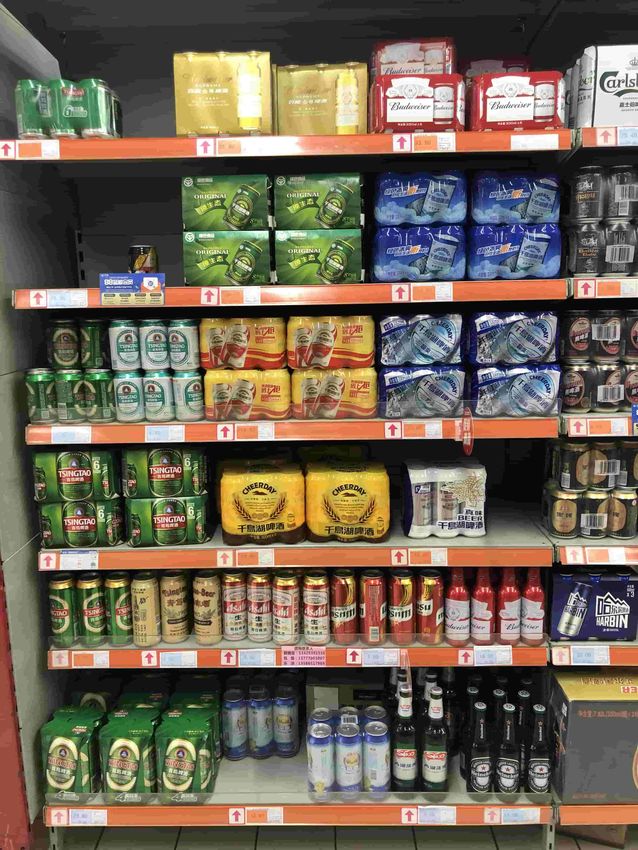
Discard Incorrect Images
                                           Shelve Image
      Original Shelve Image             with Bounding Boxes

                                                                                     Annotate Remaining Images
                                                                     Human Annotator

                                                                                              Spring Water A (500mL)

                                                                                                Coke A (1000mL)

                                                                                                                       ......
                         Machine Annotator                                                       Coke B (500mL)

Figure 3: Pipeline of our data collection process. Our photo collectors were first distributed in over 500 different
retail stores and collected over 10k high-resolution shelf images. Then we use a pre-trained detection model
to extract the bounding boxes of potential objects of interests. After that, our human annotators discard the
incorrect bounding boxes, including heavily occluded images and images that is not a valid retail product. The
remaining images are annotated by the annotators.

grocery relevant component to other semantic segmentation datasets [6, 8, 25]. Similar to RPC
dataset, MVTEC is also captured in laboratory environment with controlled camera settings. The
scale of this dataset in terms of images and categories is also relatively small. Thus, it may not be
suitable for the task of object recognition in real store.

3    Our dataset
In this section, we provide the details of our RP2K dataset.
Organizations. Our dataset contains two components: the original shelf images and the individual
object images cropped from the shelf images. The shelf images are labeled with the shelf type, store
ID, and a list of bounding boxes of objects of interest. For each image cropped from its bounding
box, we provide rich annotations include the SKU ID, product name, brand, product type, shape, size,
flavor/scent and the bounding box reference to its corresponding shelf image. Fig. 5 demonstrates
some sample attributes of the object images. Note that some attributes may not be applicable to
particular products.
We also provide meta category label for each object image, in two different ways. One is categorized
by its product type, which reflects the placement of the products, i.e., products with the same type
usually placed on the same or nearby shelves. We include 6 meta categories by product types: dairy,
liquor, beer, cosmetics, non-alcoholic drinks and seasoning.
Another categorization method is by its product shape. We include 7 shapes, bottle, can, box, bag,
jar, handled bottle and pack , which covers all possible shapes that appeared in our dataset. These
7 shapes are also used in training our pre-annotation detector. The sample images for different
meta-categories are shown in Fig. 4.
Besides these two meta categorization method, our rich labels provide an option for the users to
evaluate their algorithms on a customized fine-grained level.
Data collections. The shelve images were collected in 10 cities from 500 different general stores,
to increase the data diversity. The data collectors were instructed to make sure the shelf positioned in
the center of the image, and each image should only contain one shelf. Each shelf image is at least
3000 by 3000 pixels. The image collectors use different (smartphone) camera models to capture the

                                                         4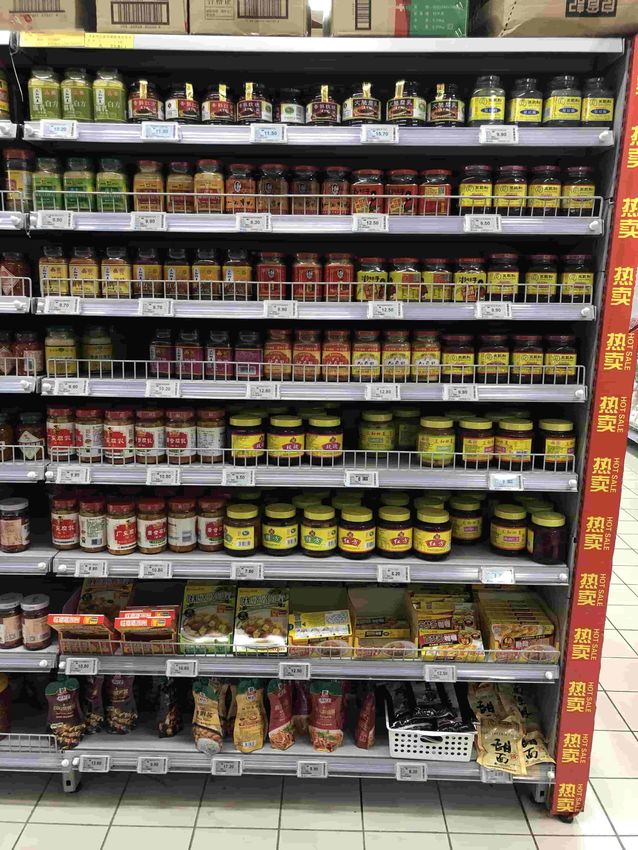
Dairy                   Liquor            Beer           Cosmetics          Drinks       Seasoning

    Bottle                  Can          Box            Bag              Jar    Handled Bottle    Pack

Figure 4: Sample images from our dataset with different meta-categorizations. (top) Categorized by product
types. (bottom) Categorized by product shapes.

photos under natural in-store lighting environments, mimicking the realistic application scenarios.
We also make sure each individual object in the collected images is at least 80 by 80 pixels and clear
enough to be recognized by human eyes.
After collected from multiple stores, the shelves images were sent to a group of annotators to label
the products that appeared in those images. To reduce the workload of human labor, we first run a
pre-annotation step by using a pre-trained object detector to generate bounding boxes of potential
objects. We use RetinaNet [24] as the base structure of the object detector and train it on our auxiliary
object detection dataset; see Appendix C for details. The annotators then manually remove all
the unwanted bounding boxes (e.g., overlapped box or occluded box), before assigning labels and
attributes to each bounding box image. The data collection pipeline is summarized in Fig. 3.

Statistics. We collect 14,368 high-resolution shelf images in total, with, on average, 37.1 objects
in each images, resulting in a dataset with 533,633 images of individual objects. Each individual
object image represents a product from in total of 2000 SKUs. We split the train/test set by the ratio
of 0.85/0.15. The detailed statistics for different meta categories are illustrated in Table 1.

Auxiliary detection dataset. To encourage the development of a full pipeline solution, from on-
shelve product detection to recognition, we also provide our auxiliary object detection dataset. We
include 95,800 bounding boxes from 1400 shelve images with 7 different shapes described in Fig. 4
to train our object detector. We refer the audience for a detailed description of our detection dataset to
Appendix C. We want to emphasize that the object detection task for retail shelve has been targeted

                                         Table 1: Statistics of our dataset.
                  Meta Category        SKUs     Train Imgs.      Test Imgs.    Total Imgs.   Imgs./SKU
                  Dairy                 325      117,597          20,753        138,350        425.7
     By Product

                  Liquor                167       17,394           3,069         20,463        122.53
                  Beer                  238       57,875          10,213         10,213        236.4
                  Cosmetics             257       17,714           3,126         20,840         81.1
                  Non-Alcohol Drinks    354       46,147           8,143         54,290        153.4
                  Seasoning             609      196,887          34,745        231,632        380.3
                  Bottle               1,063     257,254          45,398        302,652        284.7
                  Can                   267       69,063          12,187         81,250        304.3
     By Shape

                  Box                   201       42,193           7,446         49,639        247.0
                  Bag                   109        9,814           1,732         1,1546        105.9
                  Jar                   46         9,123           1,610         10,733        233.3
                  Handled Bottle        251       56,925          10,045         66,970        266.8
                  Pack                  63         9,219           1,627         10,846        172.2
                  Total                2,000     453,614          80,049        533,663        266.8

                                                         5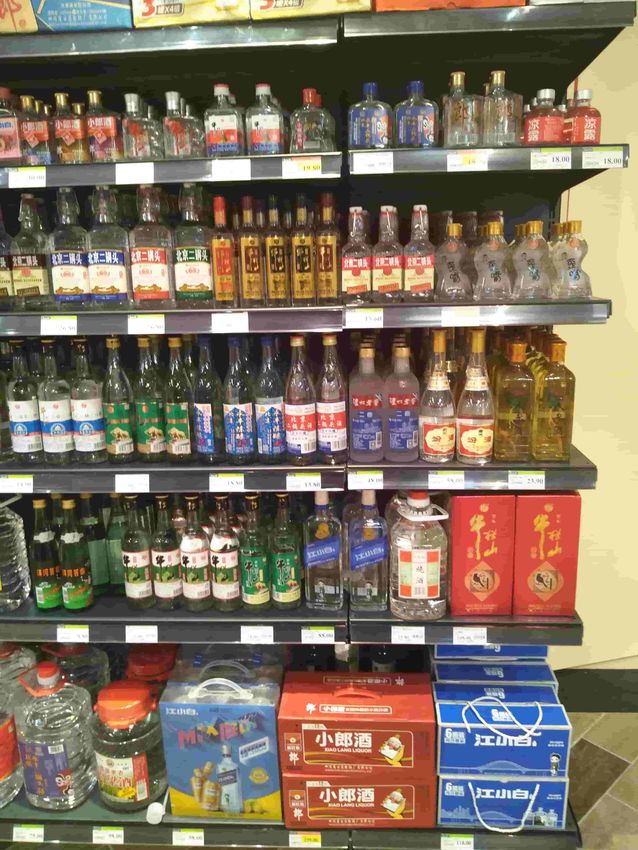
Table 2: Classification results for different categories. # images indicates the number of total images available
in the corresponding meta-category. MobileNetV1 shows better performance compare to InceptionV3. However,
neither of them achieved enough high accuracy for deploying real applications such as product placement
auditing.
                                                          MobileNetV1             InceptionV3
             Meta-Category               # images
                                                         Top-1   Top-5          Top-1     Top-5
             Dairy                        138,350       91.05% 98.69%          84.17% 97.15%
             Liquor                        20,463       86.59% 97.15%          73.07% 92.89%
             Beer                          68,088       93.30% 98.54%          85.86% 96.52%
             Cosmetics                     20,840       78.88% 95.95%          75.80% 93.83%
             Non-Alcohol Drinks            54,290       86.80% 96.51%          76.74% 93.29%
             Seasoning                    231,632       88.08% 97.61%          75.46% 92.99%
             All                          533,663       87.05% 96.94%          54.94% 81.69%

by many other dataset [13], thus we do not target our dataset as an object detection dataset. Here we
provide the detection dataset for completeness’ sake.

4    Benchmarking our dataset

In this section, we provide our evaluations to benchmarking our RP2K dataset. We demonstrate our
results on the classification task. Yet, we would like to emphasize that our dataset is not limited to the
task. We will provide a further discussion on other potential use cases of our dataset in Sec. 5.
We report the experimental results by meta categories; specifically, we train independent models and
evaluate the performance for each meta-category. We also tested using a single model to predict 2000
SKUs. We use MobileNet [17] and InceptionV3 [39] as our base network structure to perform the
classification. Two fully connected layers are attached after the base structure. Each fully connected
layer are followed by a BatchNorm and a ReLU activation. Another fully connected layer with the
output dimension of the number of classes is set to be the final layer of the whole network. For
both MobileNet and InceptionV3, we use the ImageNet pre-trained model, i.e., we use the ImageNet
pre-trained model that available in the TensorFlow [1] library, and freeze the feature extraction
layers while only optimize the fully connected layer for 20 epochs with learning rate 0.1. Then
we unfreeze the feature extraction layers and train the entire network for another 5 epochs with
learning rate 0.01. We use Adam optimizer [21] for all experiments. All models are trained using the
TensorFlow framework on a single NVIDIA Tesla V100 GPU. We report both top-1 accuracies and
top-5 accuracies for our evaluation.
As shown in Table 2, MobileNetV1 outperforms InceptionV3 on all 6 meta-categories, as well as
using all images. However, higher accuracy is required to implement commercial applications such
as checking if the products on the shelf are placed in the correct way.

Training from scratch and data augmentation. Since images in our dataset are captured under
diverse view angles and lighting conditions, using data augmentation during training presumably
would increase the classification performance. In addition, we are also interested in evaluating the
performance between using a pre-trained model and training from scratch.

             SKU id: 746                  SKU id: 748              SKU id: 450                     SKU id: 1049
             Type: Drinks                 Type: Drinks             Type: Cosmetics                 Type: Dairy
             Shape: Can                   Shape: Can               Shape: Handled Bottle           Shape: Box
             Brand: Starbucks             Brand: Starbucks         Brand: OMO                      Brand: Yili
             Size: 250mL                  Size: 250mL              Size: 1.8L                      Size: 1L
             Flavor: Latte                Flavor: Motcha           Flavor: N/A                     Flavor: Original

                                Figure 5: Sample data with attributes information.

                                                             6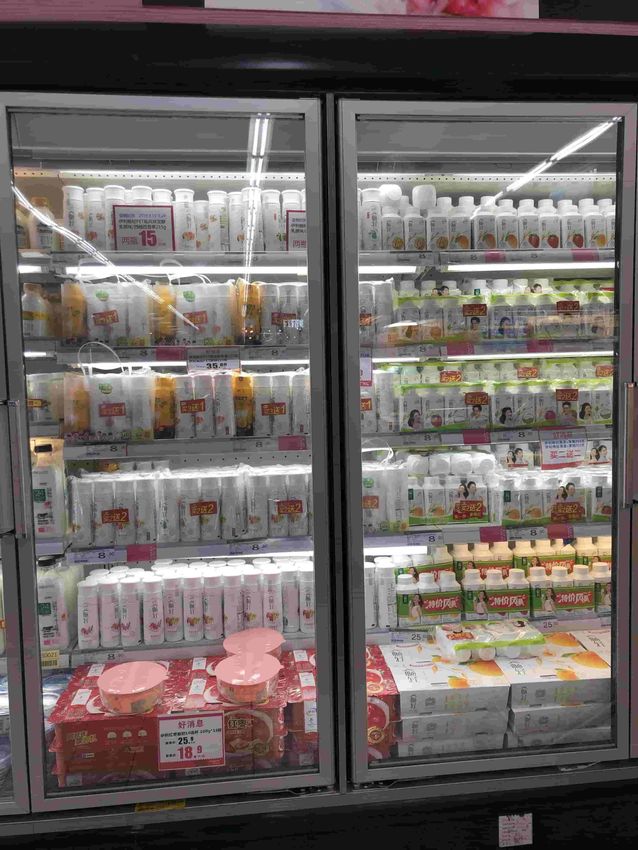
Table 3: Evaluation of different training protocols. We found that adding data augmentation does not necessarily
increase the recognition performance. We hypothesis it is due to our dataset already include lighting variance
and camera distortion, further augmenting data does not making our dataset more close to the real image.
                                 Model         Full      Pre-trained   Full + Aug.       Pre-trained + Aug.
                                 Top-1 Acc.   85.19%      87.05%        76.30%                 86.84%
                                 Top-5 Acc.   96.08%      96.94%        91.57%                 97.60%

Thus, we further evaluate the MobileNetV1 using 4 different training schemes: training from scratch,
pre-training, training from scratch with data augmentation, and pre-training with data augmentation.
For all training scheme we use the Adam optimizer.
The training from scratch scheme refers to random initializing the entire network, and train it for a
fixed time. We first train the network with 0.1 learning rate for 30 epochs, and then we decay the
learning rate to 0.01 to train the network for another 10 epochs. The momentum is set to 0.9 all the
time.
To mimic the real scenario environment, we use the following data augmentation scheme in our
training:

                     •       Adding a constant border with a width randomly chosen between 0 and 30px.
                     •       Cropping randomly by up to 10px.
                     •       Applying a randomly-parameterized perspective transformation.
                     •       Darkening/Brightening the image ramdomly by up to 20%.

The results of evaluating 4 training protocols are shown in Table 3.
 Besides reporting classification accuracy for each meta category, we also plot the relationship between
 the number of instance image and classification accuracy for each individual instance. To analyze
 this relationship, we first sort our entire 2000 product by its instance count, and then group each 10
 nearby products. Then we calculate the average top-1 classification accuracy for each group. As
 shown in Fig. 6, the prediction accuracy is decreasing with the number of instances available in the
 dataset, and the variance of the accuracy increased. This suggest that future research should focus on
 improving the prediction accuracy for the "long tail" part, since total accuracy could be high due to
 instances with abundant training data usually have high prediction performance while contribute to
 the statistics more. In contrast, the long tail part may still have low accuracies.
As we mentioned in Sec. 3, we also collect a object detection dataset for training the pre-annotator.
To give a reference of the real retail store application scenario, we evaluate the performance of the
detection using our auxiliary object detection dataset. Please refer to Appendix C for detailed results
and discussions.

                 40000                                                                                              100%

                 30000                                                                                              80%
                                                                                                                           Top-1 Accuracy
Instance Count

                 20000                                                                                              60%

                 10000                                                                                              40%

                    0
                         1                          50                             100                        200
                                                            Product Category IDs
 Figure 6: Long tail problem in fine-grained recognition. With the decreased number of available images, the
 recognition accuracy is tend to decrease.

                                                                   7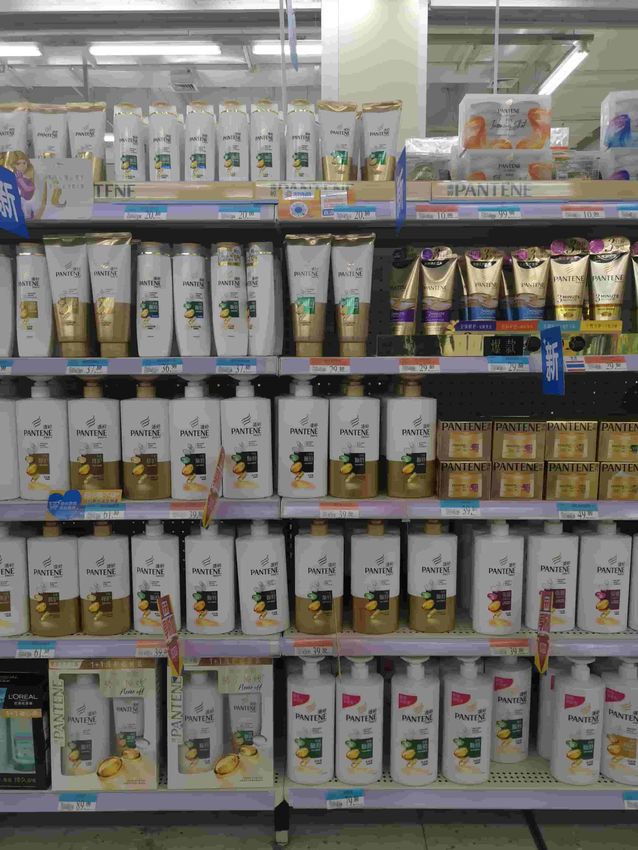
5   Other potential research problems

Besides the classification and detection task, there are many other potential research problems on our
dataset. We list a few of them in this section.

Adversarial attacks and defenses. Adversarial attacks refer to adding deliberately crafted, imper-
ceptible noise to natural images, aiming to mislead the network’s decision entirely [14]. Adversarial
attacks pose serious threats to numerous machine learning applications, from autonomous drive to
face recognition authorization. Motivated by building a robust neural network model, a series of
adversarial attacks and defenses have been proposed, advancing the understanding of adversarial
examples [5, 36, 45, 27, 40].
However, most of the existing defense methods are evaluated on standard benchmarks such as
MNIST, CIFAR-10 or ImageNet. In those datasets, the visual difference between images from
different classes are often large. In contrast, due to the fine-grained characteristics, two images from
different classes in our dataset could also hold very similar visual features. Besides, the number of
total categories in our dataset (2000) is also considerably higher than traditional benchmarks like
CIFAR-10 (10) or ImageNet (200). These two factors could pose a much more challenging problem
in the adversarial defense task. Thus, it would be worthwhile to develop and evaluate new adversarial
defenses algorithm on our dataset.

Generative models on structured images. Image synthesis has achieved remarkable progress in
recent years with the emergence of various generative models [31, 2, 44, 29, 19, 22]. The state-of-
the-art generative models are capable of generating realistic high-resolution images of many distinct
objects and scenes.
Despite the success in generating natural images, generating images with structured layouts remains
challenging, as pointed out by many recent work [30, 16, 38]. Our original shelves image dataset
could be a practical dataset for evaluating generative models on structured image synthesis. The
bounding box combined with SKU labels in our dataset provides the ground truth of semantic layout
information. Once robust generative models are developed, it could also facilitate to pave a way for
generating more data for shelf objects detection and recognition.

Few-shot learning. The ability to learn from a few examples remains a challenge for modern
machine learning systems. This problem has received significant attention from the machine learning
community [9, 32, 37, 7, 35]. According to Fig. 6, the long-tail effect of our characteristics provides
more than 100 classes with the number of instance images less than 30. Thus, our dataset could
also serve the purpose of few-shot learning algorithm evaluation. Moreover, the large number of
categories reside in our dataset enables a broader range of choices to evaluate the algorithm. Besides
the research value of few-shot learning in our dataset, few-shot learning is also important in the retail
industry since some products may only have few placed in a retail store.

6   Conclusion

We introduce a new retail recognition dataset, RP2K. Our dataset is inspired by the task of retail
product recognition on store shelves, which has tremendous applications on AI-powered retail
industry—image-based product retrieval, empty shelf detection, and sales activity tracking, to name a
few. As a fine-grained classification dataset, our dataset has the so far largest amount of categories,
while maintaining a decent amount of images. In addition to the pre-defined meta-categories, we
also provide rich attributes information that allows the user to adjust the fine-grained level for their
evaluations. To bridge the gap between research and real-life applications, our data are all collected in
natural retail store environments. Our experiments show that there are many spaces of improvement
for current models to establish a robust recognition system. Besides object recognition, our dataset
could also be used for other important computer vision tasks such as few-shot learning and generative
model. We believe our dataset could further progress the revolution that is already occurring in the
retail industry.

                                                   8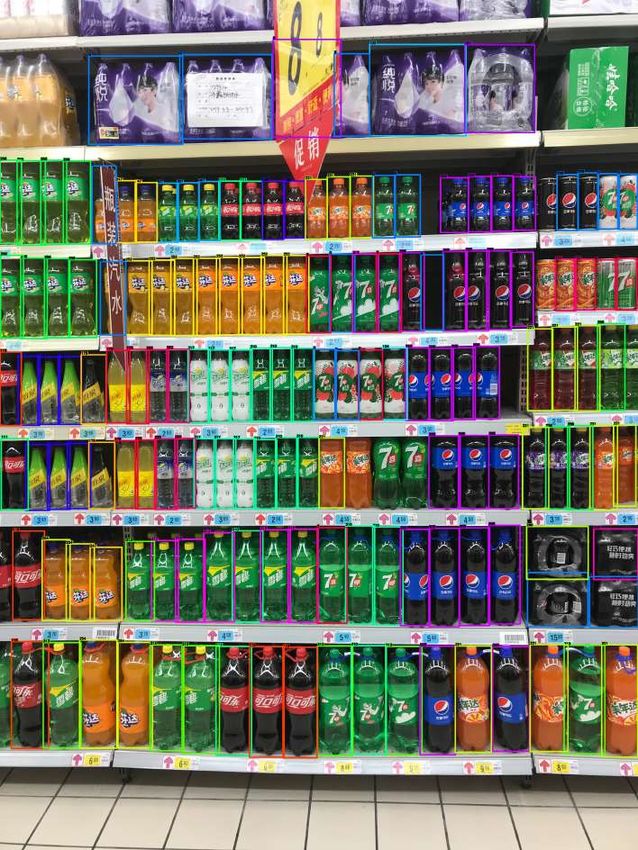
References
 [1] A BADI , M., BARHAM , P., C HEN , J., C HEN , Z., DAVIS , A., D EAN , J., D EVIN , M., G HE -
     MAWAT, S., I RVING , G., I SARD , M., ET AL . Tensorflow: A system for large-scale machine
     learning. In 12th {USENIX} Symposium on Operating Systems Design and Implementation
     ({OSDI} 16) (2016), pp. 265–283.
 [2] A RJOVSKY, M., C HINTALA , S., AND B OTTOU , L. Wasserstein generative adversarial networks.
     In International Conference on Machine Learning (2017), pp. 214–223.
 [3] B ERG , T., L IU , J., W OO L EE , S., A LEXANDER , M. L., JACOBS , D. W., AND B ELHUMEUR ,
     P. N. Birdsnap: Large-scale fine-grained visual categorization of birds. In Proceedings of the
     IEEE Conference on Computer Vision and Pattern Recognition (2014), pp. 2011–2018.
 [4] B URIANEK , J., A HMADYFARD , A., AND K ITTLER , J. Soil-47, the surrey object image library,
     centre for vision, speach and signal processing, univerisity of surrey. J. Kittler.[Electronic
     resource].–Mode of access http://www. ee. surrey. ac. uk/CVSSP/demos/colour/soil47 (2002).
 [5] C OHEN , J., ROSENFELD , E., AND KOLTER , Z. Certified adversarial robustness via randomized
     smoothing. In International Conference on Machine Learning (2019), pp. 1310–1320.
 [6] C ORDTS , M., O MRAN , M., R AMOS , S., R EHFELD , T., E NZWEILER , M., B ENENSON ,
     R., F RANKE , U., ROTH , S., AND S CHIELE , B. The cityscapes dataset for semantic urban
     scene understanding. In Proceedings of the IEEE conference on computer vision and pattern
     recognition (2016), pp. 3213–3223.
 [7] D UAN , Y., A NDRYCHOWICZ , M., S TADIE , B., H O , O. J., S CHNEIDER , J., S UTSKEVER ,
     I., A BBEEL , P., AND Z AREMBA , W. One-shot imitation learning. In Advances in neural
     information processing systems (2017), pp. 1087–1098.
 [8] E VERINGHAM , M., E SLAMI , S. A., VAN G OOL , L., W ILLIAMS , C. K., W INN , J., AND
     Z ISSERMAN , A. The pascal visual object classes challenge: A retrospective. International
     journal of computer vision 111, 1 (2015), 98–136.
 [9] F INN , C., A BBEEL , P., AND L EVINE , S. Model-agnostic meta-learning for fast adaptation
     of deep networks. In Proceedings of the 34th International Conference on Machine Learning-
     Volume 70 (2017), JMLR. org, pp. 1126–1135.
[10] F OLLMANN , P., B OTTGER , T., H ARTINGER , P., KONIG , R., AND U LRICH , M. Mvtec
     d2s: densely segmented supermarket dataset. In Proceedings of the European Conference on
     Computer Vision (ECCV) (2018), pp. 569–585.
[11] G EBRU , T., H OFFMAN , J., AND F EI -F EI , L. Fine-grained recognition in the wild: A multi-task
     domain adaptation approach. In Proceedings of the IEEE International Conference on Computer
     Vision (2017), pp. 1349–1358.
[12] G EORGE , M., AND F LOERKEMEIER , C. Recognizing products: A per-exemplar multi-label
     image classification approach. In European Conference on Computer Vision (2014), Springer,
     pp. 440–455.
[13] G OLDMAN , E., H ERZIG , R., E ISENSCHTAT, A., G OLDBERGER , J., AND H ASSNER , T. Precise
     detection in densely packed scenes. In Proceedings of the IEEE Conference on Computer Vision
     and Pattern Recognition (2019), pp. 5227–5236.
[14] G OODFELLOW, I. J., S HLENS , J., AND S ZEGEDY, C. Explaining and harnessing adversarial
     examples. arXiv preprint arXiv:1412.6572 (2014).
[15] H AO , Y., F U , Y., AND J IANG , Y.-G. Take goods from shelves: A dataset for class-incremental
     object detection. In Proceedings of the 2019 on International Conference on Multimedia
     Retrieval (2019), pp. 271–278.
[16] H INZ , T., H EINRICH , S., AND W ERMTER , S. Generating multiple objects at spatially distinct
     locations. In International Conference on Learning Representations (2019).
[17] H OWARD , A. G., Z HU , M., C HEN , B., K ALENICHENKO , D., WANG , W., W EYAND , T.,
     A NDREETTO , M., AND A DAM , H. Mobilenets: Efficient convolutional neural networks for
     mobile vision applications. arXiv preprint arXiv:1704.04861 (2017).
[18] K ARLINSKY, L., S HTOK , J., T ZUR , Y., AND T ZADOK , A. Fine-grained recognition of
     thousands of object categories with single-example training. In Proceedings of the IEEE
     Conference on Computer Vision and Pattern Recognition (2017), pp. 4113–4122.

                                                  9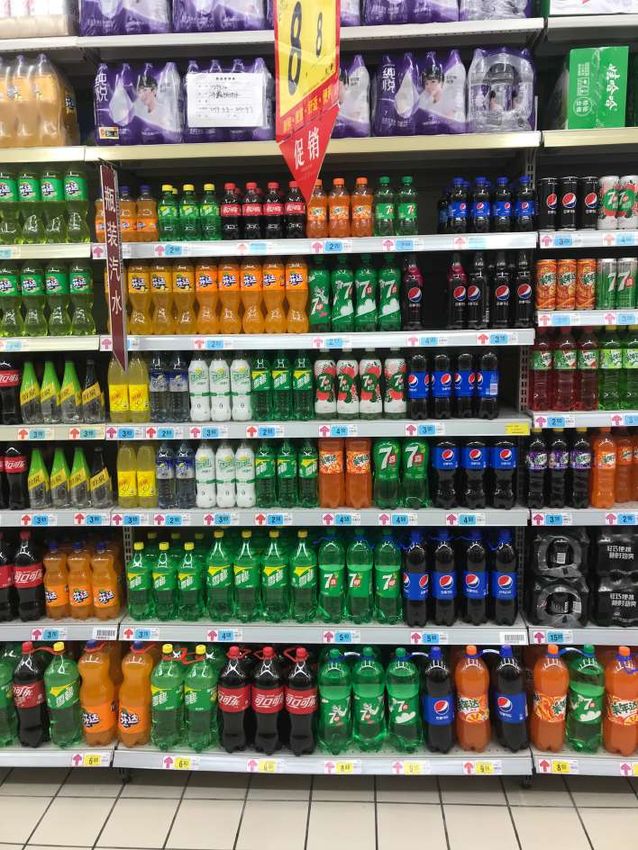
[19] K ARRAS , T., L AINE , S., AND A ILA , T. A style-based generator architecture for generative
     adversarial networks. In Proceedings of the IEEE Conference on Computer Vision and Pattern
     Recognition (2019), pp. 4401–4410.
[20] K HOSLA , A., JAYADEVAPRAKASH , N., YAO , B., AND F EI -F EI , L. Novel dataset for fine-
     grained image categorization. In First Workshop on Fine-Grained Visual Categorization, IEEE
     Conference on Computer Vision and Pattern Recognition (Colorado Springs, CO, June 2011).
[21] K INGMA , D. P., AND BA , J. Adam: A method for stochastic optimization. arXiv preprint
     arXiv:1412.6980 (2014).
[22] KOTOVENKO , D., S ANAKOYEU , A., L ANG , S., AND O MMER , B. Content and style disen-
     tanglement for artistic style transfer. In Proceedings of the IEEE International Conference on
     Computer Vision (2019), pp. 4422–4431.
[23] K RAUSE , J., S TARK , M., D ENG , J., AND F EI -F EI , L. 3d object representations for fine-grained
     categorization. In 4th International IEEE Workshop on 3D Representation and Recognition
     (3dRR-13) (Sydney, Australia, 2013).
[24] L IN , T.-Y., G OYAL , P., G IRSHICK , R., H E , K., AND D OLLÁR , P. Focal loss for dense object
     detection. In Proceedings of the IEEE international conference on computer vision (2017),
     pp. 2980–2988.
[25] L IN , T.-Y., M AIRE , M., B ELONGIE , S., H AYS , J., P ERONA , P., R AMANAN , D., D OLLÁR ,
     P., AND Z ITNICK , C. L. Microsoft coco: Common objects in context. In European conference
     on computer vision (2014), Springer, pp. 740–755.
[26] L IU , Z., L UO , P., Q IU , S., WANG , X., AND TANG , X. Deepfashion: Powering robust clothes
     recognition and retrieval with rich annotations. In Proceedings of IEEE Conference on Computer
     Vision and Pattern Recognition (CVPR) (2016).
[27] M ADRY, A., M AKELOV, A., S CHMIDT, L., T SIPRAS , D., AND V LADU , A. Towards deep
     learning models resistant to adversarial attacks. In International Conference on Learning
     Representations (2018).
[28] M ERLER , M., G ALLEGUILLOS , C., AND B ELONGIE , S. Recognizing groceries in situ using
     in vitro training data. In 2007 IEEE Conference on Computer Vision and Pattern Recognition
     (2007), IEEE, pp. 1–8.
[29] M USTAFA , M., BARD , D., B HIMJI , W., L UKI Ć , Z., A L -R FOU , R., AND K RATOCHVIL , J. M.
     Cosmogan: creating high-fidelity weak lensing convergence maps using generative adversarial
     networks. Computational Astrophysics and Cosmology 6, 1 (2019), 1–13.
[30] Q I , M., WANG , Y., Q IN , J., AND L I , A. Ke-gan: Knowledge embedded generative adversarial
     networks for semi-supervised scene parsing. In Proceedings of the IEEE Conference on
     Computer Vision and Pattern Recognition (2019), pp. 5237–5246.
[31] R ADFORD , A., M ETZ , L., AND C HINTALA , S. Unsupervised representation learning with
     deep convolutional generative adversarial networks. arXiv preprint arXiv:1511.06434 (2015).
[32] R EN , M., T RIANTAFILLOU , E., R AVI , S., S NELL , J., S WERSKY, K., T ENENBAUM , J. B.,
     L AROCHELLE , H., AND Z EMEL , R. S. Meta-learning for semi-supervised few-shot classifica-
     tion. arXiv preprint arXiv:1803.00676 (2018).
[33] ROCHA , A., H AUAGGE , D. C., WAINER , J., AND G OLDENSTEIN , S. Automatic fruit and
     vegetable classification from images. Computers and Electronics in Agriculture 70, 1 (2010),
     96–104.
[34] S ANTRA , B., AND M UKHERJEE , D. P. A comprehensive survey on computer vision based
     approaches for automatic identification of products in retail store. Image and Vision Computing
     86 (2019), 45–63.
[35] S ATORRAS , V. G., AND E STRACH , J. B. Few-shot learning with graph neural networks. In
     International Conference on Learning Representations (2018).
[36] S HAFAHI , A., NAJIBI , M., G HIASI , M. A., X U , Z., D ICKERSON , J., S TUDER , C., DAVIS ,
     L. S., TAYLOR , G., AND G OLDSTEIN , T. Adversarial training for free! In Advances in Neural
     Information Processing Systems (2019), pp. 3353–3364.

                                                   10
[37] S NELL , J., S WERSKY, K., AND Z EMEL , R. Prototypical networks for few-shot learning. In
Advances in Neural Information Processing Systems 30, I. Guyon, U. V. Luxburg, S. Bengio,
H. Wallach, R. Fergus, S. Vishwanathan, and R. Garnett, Eds. Curran Associates, Inc., 2017,
pp. 4077–4087.
[38] S UN , W., AND W U , T. Image synthesis from reconfigurable layout and style. In The IEEE
International Conference on Computer Vision (ICCV) (October 2019).
[39] S ZEGEDY, C., VANHOUCKE , V., I OFFE , S., S HLENS , J., AND W OJNA , Z. Rethinking the
inception architecture for computer vision. In Proceedings of the IEEE conference on computer
vision and pattern recognition (2016), pp. 2818–2826.
[40] T RAMER , F., C ARLINI , N., B RENDEL , W., AND M ADRY, A. On adaptive attacks to adversarial
example defenses. arXiv preprint arXiv:2002.08347 (2020).
[41] VAROL , G., AND K UZU , R. S. Toward retail product recognition on grocery shelves. In Sixth
International Conference on Graphic and Image Processing (ICGIP 2014) (2015), vol. 9443,
International Society for Optics and Photonics, p. 944309.
[42] W EI , X.-S., C UI , Q., YANG , L., WANG , P., AND L IU , L. Rpc: A large-scale retail product
checkout dataset. arXiv preprint arXiv:1901.07249 (2019).
[43] W ELINDER , P., B RANSON , S., M ITA , T., WAH , C., S CHROFF , F., B ELONGIE , S., AND
P ERONA , P. Caltech-UCSD Birds 200. Tech. Rep. CNS-TR-2010-001, California Institute of
Technology, 2010.
[44] X IAO , C., Z HONG , P., AND Z HENG , C. Bourgan: Generative networks with metric embeddings.
In Advances in Neural Information Processing Systems (2018), pp. 2269–2280.
[45] X IAO , C., Z HONG , P., AND Z HENG , C. Resisting adversarial attacks by k-winners-take-all.
arXiv preprint arXiv:1905.10510 (2019).
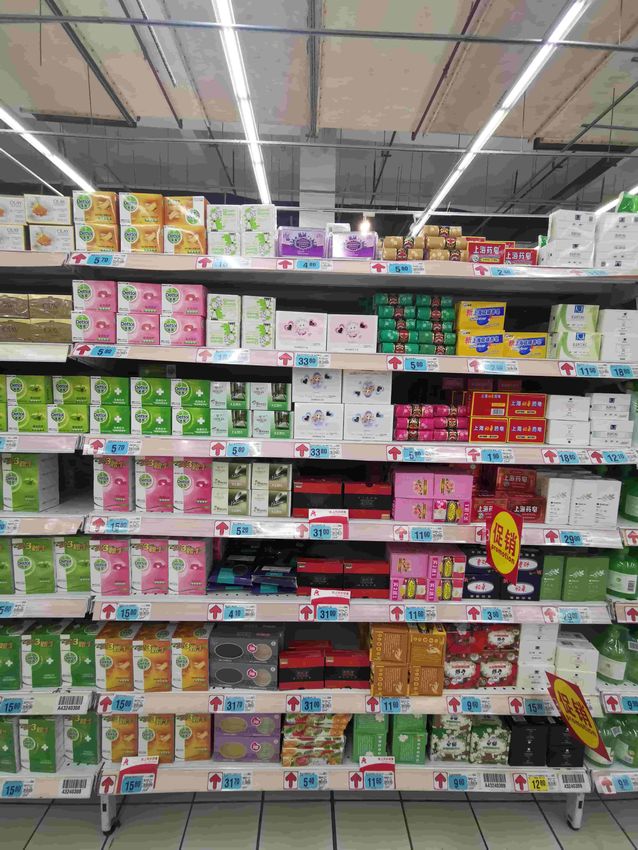
11A Additional Samples of Shelf Images
(a) Beer. (b) Seasoning.
(c) Cosmetics. (d) Liquor.
Figure 7: Additional shelf images.
12(a) Dairy. (b) Seasoning.
(c) Non-Alcoholic Drink. (d) Cosmetics.
Figure 8: More additional shelf images.
13B Additional Samples of Object Images
SKU id: 54
Types: Dairy
Shape: Box
Size: 1L
Brand: Mengniu
Flavor: Original
SKU id: 126
Types: Drink
Shape: Can
Size: 250mL
Brand: Meco
Flavor: Peach
SKU id: 127
Types: Drink
Shape: Can
Size: 250mL
Brand: Meco
Flavor: Lime
SKU id: 360
Types: Cosmetics
Shape: Can
Size: 250mL
Brand: TJOY
Flavor: Oil Control
SKU id: 361
Types: Cosmetics
Shape: Can
Size: 250mL
Brand: TJOY
Flavor: Moisture
Figure 9: Additional images with different SKUs.
14SKU id: 589
Types: Beer
Shape: Pack
Size: 12x250mL
Brand: TUBORG
Flavor: Original
SKU id: 646
Types: Drink
Shape: Bottle
Size: 100mL
Brand: evian
Flavor: Original
SKU id: 1003
Types: Seasoning
Shape: Bottle
Size: 1L
Brand: Weidamei
Flavor: Fish
SKU id: 1345
Types: Seasoning
Shape: Jar
Size: 348g
Brand: Tantanxiang
Flavor: Original
SKU id: 1724
Types: Seasonging
Shape: Bag
Size: 200g
Brand: Haidilao
Flavor: Pork
Figure 10: More images with different SKUs.
C Auxiliary Detection Dataset
Here we provide the evaluation on the auxiliary detection dataset. We split the 95,800 bounding boxes
to 80,000 training boxes and 15,800 test boxes. We use the standard RetinaNet [24] to evaluate the
detection performance. We report the Average Precision (AP) for each shape, as well as mean Average
Precision (mAP) for the entire test set, with different IoU threshold, the results are summarized in
Table 4.
15Table 4: Performance of object detection. AP(x) indicates AP with IoU threshold=x.
Shape AP(0.5) AP(0.55) AP(0.6) AP(0.65) AP(0.7) AP(0.75) AP(0.8)
Box 0.3485 0.3475 0.344 0.3372 0.3195 0.3003 0.2670
Can 0.6886 0.6868 0.6837 0.6811 0.6766 0.6650 0.6314
Bottle 0.7525 0.7509 0.7487 0.7448 0.7365 0.7137 0.6545
Jar 0.2620 0.2559 0.235 0.2302 0.2191 0.1921 0.1748
Handled Bottle 0.4919 0.4896 0.4658 0.4505 0.4014 0.3804 0.3059
Bag 0.3449 0.338 0.3273 0.3151 0.2827 0.2518 0.1901
Pack 0.4643 0.4634 0.4634 0.4634 0.4634 0.4494 0.3789
mAP for All 0.6186 0.6164 0.6121 0.6069 0.5962 0.5739 0.3994
16You can also read