STATE OF DOWNTOWN COLUMBUS - e YEAR END 2018

Page created by Juan Daniel
 
CONTINUE READING
STATE OF DOWNTOWN COLUMBUS - e YEAR END 2018
|1

     STATE OF
DOWNTOWN COLUMBUS
           YEAR END 2018

                                    e

             Prepared by
   Capital Crossroads & Discovery
   Special Improvement Districts
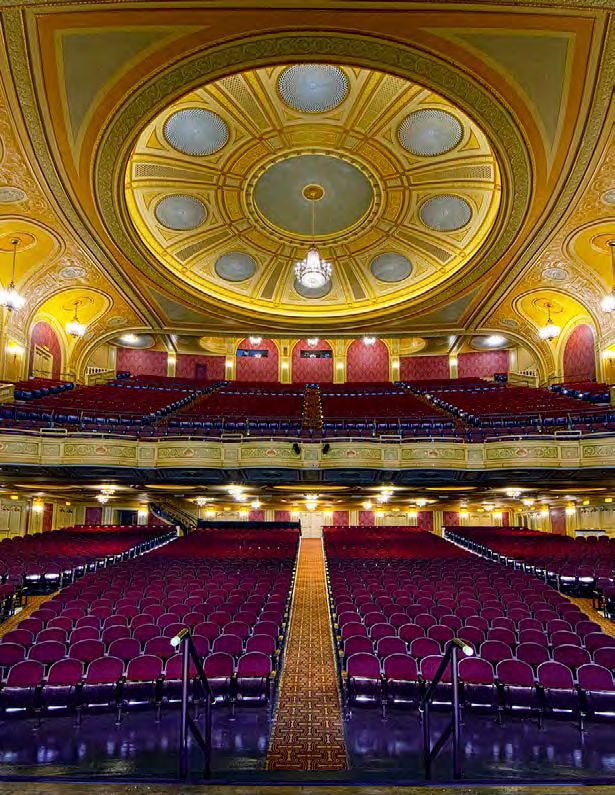
STATE OF DOWNTOWN COLUMBUS - e YEAR END 2018
|2

GET A FREE RIDE.
Downtown property owners pay for unlimited access to COTA’s entire bus
system. Visit DowntownCpass.com to see if you and your company are eligible.

         5 REASONS TO RIDE THE BUS

1. Save money: Fewer miles on your car equals fewer car-related expenses and no more parking fees.

2. No more parking hassles: Park for free at one of 25 Park & Rides and get downtown quick.

3. No more road rage: Let the COTA driver deal with traffic headaches.

4. Get a jump start on your day: Every bus has free Wi-Fi so catch up on email or text your bestie, and it
   won’t cost you a dime.

5. Unwind: Watch your favorite podcast or laugh at funny cat videos.

                                                                                                          When used on a white, color, or photographic background        When used on a backgro

                                                                                                          Colors:                                                        Colors:
                                                                                                          Process Black + White + PMS 1795                               White + PMS 1795

A Capital Crossroads SID Program
Powered by gohio commute
www.DowntownCpass.com
STATE OF DOWNTOWN COLUMBUS - e YEAR END 2018
i        ABOUT US                                                                                                                                            |3

Capital Crossroads Special
Improvement District                                                               670
(CCSID) is an association of more
than 500 commercial and residential

                                                                         NEIL
property owners in 38-square blocks                             HUNTINGTON      NATIONWIDE

of downtown Columbus. Its purpose
                                                                   PARK           ARENA

is to support the development of
downtown Columbus as a clean, safe

                                                                                                                                      GRANT
                                                                                                     HIGH

                                                                                                                             FOURTH
                                                                                                            SPRING

                                                                                             FRONT

                                                                                                                     THIRD
and fun place to work, live and play.
                                                                                                            LONG

Hours of Operation:                                                                                         GAY
                                                                                                                                              COLUMBUS
                                                                                                                                               MUSEUM

5:30 a.m. - 2 a.m. Monday - Saturday;
                                                                                                                                                OF ART
                                                                                                                                                           71
                                                                                                            BROAD

9:30 a.m. - 8 p.m. Sunday                                                                              STATEHOUSE
                                                                                                                                                 TOPIARY
                                                                                                                                                  PARK
                                                                                                                                           COLUMBUS

Discovery Special
                                                                                                                                         METROPOLITAN
                                                                                                                                            LIBRARY
                                                                                                        COLUMBUS
                                                                                                        COMMONS

Improvement District                                                                                        RICH

(DSID) helps property owners                                                                                MAIN

maintain a safe, vibrant, diverse,
distinctive and walkable mixed-use
neighborhood. DSID was formed
in 2005 by property owners in the
eastern area of downtown.

Hours of Operation:                      Capital Crossroads Special Improvement District
5:30 a.m. – 2 a.m. Monday – Saturday
                                         Discovery Special Improvement District
                                         Downtown District

                                        ABOUT THIS REPORT
                                        The CCSID and DSID track information that gauges the vitality of the central business
                                        district. Unless otherwise specified, the content included is specific to the Downtown
                                        District: the area bounded by I-670, I-71, I-70 and the CSX railroad tracks.

                                        All information is believed accurate at the time received. Where outside sources
                                        are used, attribution is provided. SID staff monitors and interprets downtown data
                                        covering a variety of areas, and every effort is given to provide the most accurate
                                        information possible.

                                        SID staff is available to provide custom research. Please contact Marc Conte at
23 N. Fourth St.
                                        mvconte@sidservices.com or (614) 591-4507 for more information.
Columbus OH 43215
(614) 591-4565
DowntownColumbus.com
                                        Photo credits: Andy Spessard, COTA, Kaufman Development, Larry Hamill, Randall Schieber, Legacy
                                        Management Services, DesignGroup, Melissa Fast, Lear Block/DeVere LLC, Brad Feinknopf Photography
Customer Service Hotline:               For Columbus Downtown Development Corporation
(614) 228-5718                          Design: Bluewave Creative
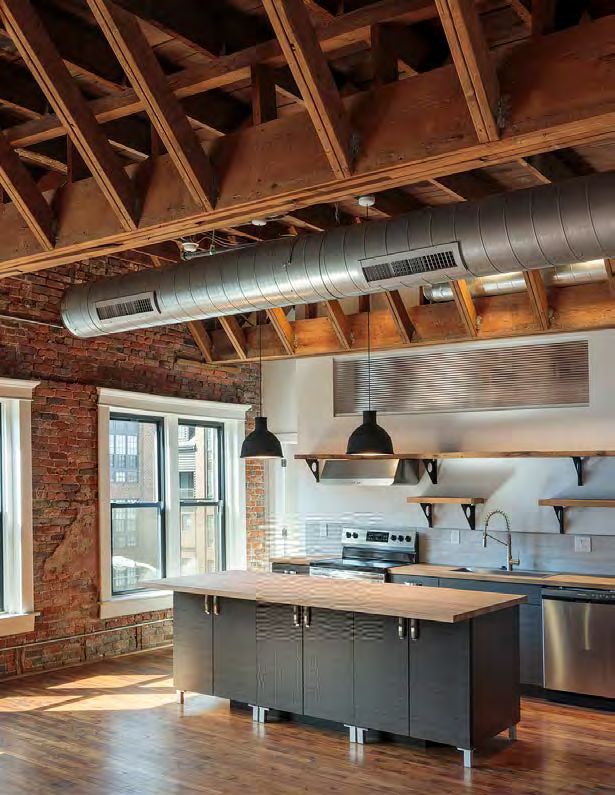
STATE OF DOWNTOWN COLUMBUS - e YEAR END 2018
|4

TABLE OF CONTENTS   •   05   Report Highlights

                        06   Major Investments

                        11   Housing & Residents

                        17   Employment & Office

                        21   Education

                        23   Retail

                        24   Hospitality & Attractions

                        26   Transportation & Land Use
STATE OF DOWNTOWN COLUMBUS - e YEAR END 2018
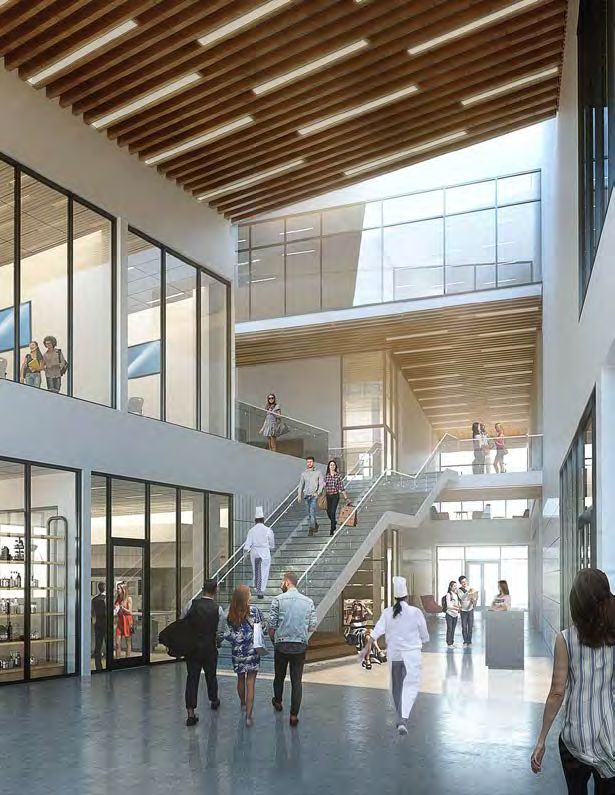
•      REPORT HIGHLIGHTS                                                     |5

                              Major Investments

       $2.1 BILLION             $454 MILLION          $299 MILLION
           PROPOSED            UNDER CONSTRUCTION     COMPLETED IN 2018

        37 PROJECTS               23 PROJECTS           17 PROJECTS

         Housing &              Employment &            Education
         Residents                 Office
            9,000                    85,248                   4
           RESIDENTS                 WORKERS             COLLEGES &
                                                         UNIVERSITIES

              95%                    14.9%                33,457
          APARTMENT             OFFICE VACANCY RATE
          OCCUPANCY               (CLASS A, B & C)     COLLEGE STUDENTS

           Retail                Hospitality &        Transportation
                                  Attractions           & Land Use
              5                        307                    87
     NEW RETAILERS IN 2018      ROOMS PROPOSED OR     CARS PER 100 WORKERS
                                UNDER CONSTRUCTION    DRIVE INTO DOWNTOWN
           240+
    RETAIL GOODS & SERVICES          70.1%                   408
           BUSINESSES             OCCUPANCY RATE      COMPANIES ENROLLED
                                                      IN DOWNTOWN C-PASS
STATE OF DOWNTOWN COLUMBUS - e YEAR END 2018
MAJOR INVESTMENTS                                                         |6

                    HIGHLIGHTS
                    Construction began on the first phase of the
                    White Castle headquarters redevelopment. Later
                    phases will include a second office building and
                    five apartment buildings. A new Columbus Crew
                    stadium is planned as the anchor for Confluence
                    Village, which will also include residential and
                    office buildings. Confluence Village is planned for
                    land just south of the White Castle headquarters
                    at the western edge of the Arena District.

                    $2.1 BILLION
                    PROPOSED
                    Notable Projects
                    Hilton 2.0 ($210 million)
                    Columbus Crew Stadium
                    Confluence Village Office and Housing

                    $392 MILLION
                    UNDER CONSTRUCTION
                    Notable Projects
                    The Nicholas Apartments ($40 million)
                    Xander on State Apartments ($35 million)
                    Mitchell Hall at Columbus State ($34 million)

                    $299 MILLION
                    COMPLETED IN 2018
                    Notable Projects
                    80 on the Commons ($90 million)
                    Michael B. Coleman Government Center
                    ($60 million)
                    National Veterans Memorial & Museum
                    ($55 million)
STATE OF DOWNTOWN COLUMBUS - e YEAR END 2018
MAJOR INVESTMENTS                                                                                                                                       |7

                                                                   670

                                                            NEIL
                                                   HUNTINGTON       NATIONWIDE
                                                      PARK            ARENA

                                                                                                                     FOURTH

                                                                                                                                 GRANT
                                                                                             HIGH
                                                                                                    SPRING

                                                                                   FRONT

                                                                                                             THIRD
                                                                                                     LONG                                                           71

                                                                                                     GAY
                                                                                                                                         COLUMBUS
                                                                                                                                          MUSEUM
                                                                                                                                           OF ART
                                                                                                    BROAD

                                                                                                 STATEHOUSE
                                                                                                                                              TOPIARY
                                                                                                    STATE                                      PARK
                                                                                                                                      COLUMBUS
                                                                                                                                    METROPOLITAN
                                                                                                                                       LIBRARY
                                                                                                  COLUMBUS
                                                                                                  COMMONS

                                                                                                     RICH

                                                                                                    MAIN

                   PROPOSED                                              UNDER CONSTRUCTION                                              COMPLETED IN 2018

       5%                  1%                                                                                                                 4%
   RESIDENTIAL    2%      PARKING             1%                         10%                                                               STREETSCAPE
                                                                    TRANSPORTATION
                 RETAIL
STATE OF DOWNTOWN COLUMBUS - e YEAR END 2018
MAJOR INVESTMENTS                                                                                                                          |8

                                                                                         Cost Estimate
Proposed Projects                                              Location                      (Millions)        Use
Hilton 2.0                                                     High & Ohio Center Way              $210     Hospitality
Crew Stadium                                                   W. Nationwide Blvd.                    NA    Hospitality
Scioto Peninsula Redevelopment                                 Belle & Broad                       $500     Mixed Use
White Castle Office 2                                          555 W. Goodale St.                    $12    Office
Capitol Square Office Tower Upgrades                           3rd & State                             $3   Office
266 N. 5th St.                                                 5th & Naghten                        $0.4    Office
Confluence Village Office and Residential                      W. Nationwide Blvd.                    NA    Office/Residential
Convention Center East Garage                                  3rd & Nationwide                      $18    Parking
6th & Long Garage                                              6th & Long                              $6   Parking/Retail
Franklin University Courtyard                                  Grant & Rich                         $0.5    Plaza
The View on Long                                               Pearl & Long                          $16    Residential
White Castle Residential 1A & 1B                               555 W. Goodale St.                    $16    Residential
Neighborhood Launch - 6th & Gay                                Sixth & Gay                             $4   Residential
White Castle Residential 2A, 2B & 3A                           555 W. Goodale St.                    $12    Residential
83 Normandy Ave. Residential                                   Normandy & Gay                          $3   Residential
220 E. Main St. Apartments                                     Fifth & Main                            $1   Residential
92 N. 5th St. Renovation                                       5th & Gay                            $0.4    Residential
Market Tower                                                   Park & Spruce                       $120     Residential/Office/Retail
Millennial Tower                                               Front & Rich                        $150     Residential/Office/Retail/Hospitality
255 South High Apartments                                      255 S. HighSt.                        $18    Residential/Retail
Grant Oak Apartments                                           Grant & Oak                           $16    Residential/Retail
The Harlow                                                     Fourth & Main                         $15    Residential/Retail
274 E. Long St.                                                Neilston & Long                         $1   Residential/Retail
60 on Broad                                                    Capitol Square                         NA    Residential/Retail
Cap Law Apartments and Garage                                  Grant & Oak                            NA    Residential/Retail/Parking
4th & Rich Apartments                                          4th & Rich                             NA    Residential/Retail/Parking
COSI Connection Corridor                                       333 W. Broad St.                      $40    Retail
111-115 Vine St.                                               Armstrong & Vine                        $1   Retail
70/71 Phase 6B-E - West Interchange                            I-70 & 71                           $280     Transportation
70/71 Phase 2D - South Innerbelt                               I-70 & 71                           $166     Transportation
70/71 Phase 4R - Inbound Downtown                              I-70 & 71                           $128     Transportation
70/71 Phase 5 - 70 East Freeway                                I-70 & 71                             $95    Transportation
70/71 Phase 6R - Outbound Downtown                             I-70 & 71                             $82    Transportation
70/71 Phase 3B - East Broad to Long                            I-70 & 71                             $78    Transportation
70/71 Phase 4B - Fulton & Livingston                           I-70 & 71                             $59    Transportation
TOTAL                                                                                        $2.1 Billion

                                                                                         Cost Estimate
Projects Under Construction                                    Location                      (Millions)            Use

Mitchell Hall at Columbus State Community College              Cleveland & Mt. Vernon               $34     Education
Canopy by Hilton                                               77 E. Nationwide Blvd.               $24     Hospitality
AC Hotel                                                       511 Park St.                         $23     Hospitality
White Castle HQ & Garage                                       555 W. Goodale St.                   $25     Office/Parking
Rhodes Tower Modernization                                     Capitol Square                       $50     Office
The Hayden Renovation                                          Capitol Square                       $19     Office
Riffe Center Upgrades                                          Capitol Square                       $11     Office
Huntington Center Upgrades                                     Capitol Square                        $5     Office
562 E. Main St.                                                Lester & Main                         $2     Office
33 N. 3rd St. Renovations                                      3rd & Lynn                            NA     Office
Rise Brands HQ                                                 4th & Long                            $2     Office/Parking
Former Light Plant                                             555 W. Nationwide Blvd.              $20     Office/Retail
101 E. Main St. Renovation                                     Third & Main                          $3     Office/Retail
44 N. High St.                                                 High & Gay                            NA     Office/Retail
330 Oak Street Apartments                                      330 E. Oak St                        $10     Residential
Xander on State                                                Sixth & State                        $35     Residential/Office/Retail
White-Haines/Madison's                                         High & Gay                           $14     Residential/Office/Retail

Sources: City of Columbus Department of Development, Developer and Architects                                                  continued on next page
STATE OF DOWNTOWN COLUMBUS - e YEAR END 2018
MAJOR INVESTMENTS                                                                                                                          |9

                The Nicholas                                                                               High & Gay                           $40     Residential/Retail
                230 E. Long St. Apartments                                                                 Fifth & Long                         $25     Residential/Retail
                Motorists Residential Project                                                              Washington & Oak                     $20     Residential/Retail
                150-156 N. 3rd St.                                                                         3rd & Long                           $15     Residential/Retail
                Lifestyle Communities Beatty Block                                                         213 S. High St.                      $15     Residential/Retail
                Lifestyle Communities Matan Block                                                          261 S. Front St.                     $15     Residential/Retail
                Microliving @ Long and Front                                                               55 W Long St                         $11     Residential/Retail
                70/71 Phase 2E & G - Fulton, Grant & Mound                                                 I-70 & 71                            $36     Transportation
                TOTAL                                                                                                                   $454 Million

                                                                                                                                    Cost Estimate
               Completed Projects in 2018                                                                  Location                     (Millions)             Use
               National Veterans Memorial and Museum                                                       Belle & Broad                         $55     Institutional
               Michael B. Coleman Government Center                                                        111 N. Front St.                      $60     Office
               Education First Credit Union                                                                Washington & Noble                      $2    Office
               405 E. Town St.                                                                             405 E. Town St.                         $1    Office
               Versa Coworking                                                                             Neil & Nationwide                       $1    Office
               231 N. Fifth St. Façade Improvements                                                        231 N. 5th St.                       $0.1     Office
               457-459 N. High St.                                                                         High & Vine                             $3    Office/Retail
               Grant Medical Center Parking Garage                                                         Grant & Rich                          $19     Parking
               Washington Gladden Social Justice Park                                                      Cleveland & Broad                       $2    Plaza
               Parks Edge Condominiums Phase II                                                            Arena District                        $31     Residential
               Lifestyle Communities Trautman Block                                                        205 S. High St.                       $15     Residential
               The View on Grant                                                                           Grant & Mt. Vernon                      $6    Residential
               Sixth Street Mews Phase II                                                                  Sixth & Gay                             $4    Residential
               65-67 S. Fifth St.                                                                          Fifth & Oak                             $2    Residential
               80 on the Commons                                                                           225 S. 3rd St.                        $90     Residential/Office/Retail
               The Lear Block                                                                              Sixth & Long                            $3    Residential/Retail
               Creative Campus Streetscape Improvements                                                    Ninth & Gay                             $8    Streetscape
               TOTAL                                                                                                                     $299 Million

                                         Downtown Investments Based on Year Completed
                                           $450

                                           $400
                                                                                                                                Major Investments 2008-2018
                                                                                                                                Year Completed       Private         Public          Total
                                           $350
                                                                                                                                2008                  $63                $0             $63
                                           $300                                                                                 2009                 $768               $62            $140
                                                                                                                                2010                 $151               $79            $230
Investment in millions of 2018 dollars

                                           $250
                                                                                                                                2011                  $25              $195            $221
                                           $200                                                                                 2012                 $213               $56            $269
                                                                                                                                2013                  $83               $33            $116
                                           $150                                                                                 2014                  $78              $240            $319
                                                                                                                                2015                 $213              $116            $330
                                           $100
                                                                                                                                2016                  $80               $50            $130
                                            $50                                                                                 2017                 $274              $151            $425
                                                                                                                                2018                 $176              $123            $299
                                             $0
                                                                                                                                TOTAL              $1,434            $1,105          $2,540
                                                   2008   2009   2010   2011   2012   2013   2014   2015   2016   2017   2018
                                         PUBLIC
                                                                                                                                (In Millions of 2018 dollars)
                                         PRIVATE

Sources: City of Columbus Department of Development, Developers and Architects
STATE OF DOWNTOWN COLUMBUS - e YEAR END 2018
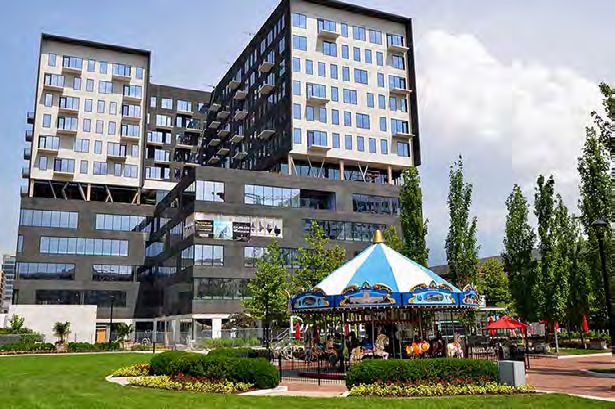
MAJOR INVESTMENTS SPOTLIGHT                                                                                                   | 10

80 on the Commons
Located on the perimeter of John F. Wolfe Columbus                 five floors of office space, six residential floors housing 121
Commons, 80 on the Commons combines the amenities of               apartments, incorporating micro-units of 400-square feet. It
exclusive, high-rise living with the energetic excitement of the   also includes community and event space.
city below. Imagine watching national acts on Bicentennial
Pavilion from a towering patio or participating in a free          Apartments lease from $1200-$3345 per month. Known for
fitness class in the park.                                         creating great community space, the partners set out to
                                                                   create high-design public spaces that are every bit as enticing
Daimler and Kaufman Development joined forces with NBBJ            as the private residential and commercial areas.
to complete the final phase of development around the
Columbus Commons. The 12-story, 281,000 square-foot                Beautiful and bold, 80 on the Commons offers modern
development sits at Third and Rich streets. This mixed-use         design at the center of everything and embraces the public
building includes ground-floor retail and restaurant space,        landscape.
HOUSING & RESIDENTS                                                            11
                                                                             | 11

                      HIGHLIGHTS
                      Downtown had its 15th consecutive year of
                      population growth as seven new residential buildings
                      opened in 2018. 80 on the Commons filled in the
                      last development site at Columbus Commons and
                      Lifestyle Communities opened LC RiverSouth nearby
                      at High & Rich. Construction continues on two more
                      apartment buildings from Lifestyle Communities in
                      RiverSouth. The Discovery District, on the eastern
                      side of Downtown, will see more than 500 additional
                      residents in the next few years with the completion
                      of Xander on State, apartments at 330 Oak Street
                      and Motorists’ new residential development north of
                      Topiary Park.

                      9,000
                      RESIDENTS

                      6,678
                      RESIDENTIAL UNITS

                      95%
                      APARTMENT OCCUPANCY

                      $867 MILLION
                      PROPOSED

                      3,966 UNITS
                      PROPOSED

                      $200 MILLION
                      UNDER CONSTRUCTION

                      1,265 UNITS
                      UNDER CONSTRUCTION

                      $150 MILLION
                      COMPLETED IN 2018

                      455 UNITS
                      COMPLETED IN 2018
                      Source: US Census ACS 2015, CCSID, DSID
HOUSING & RESIDENTS                                                                                                               | 12

                                                     670

                                            NEIL
                                   HUNTINGTON       NATIONWIDE
                                      PARK            ARENA

                                                                                                  FOURTH

                                                                                                           GRANT
                                                                          HIGH
                                                                                 SPRING

                                                                  FRONT

                                                                                          THIRD
                                                                                 LONG

                                                                                                                                          71
                                                                                  GAY
                                                                                                                   COLUMBUS
                                                                                                                    MUSEUM
                                                                                                                     OF ART
                                                                                 BROAD

                                                                            STATEHOUSE
                                                                                                                       TOPIARY
                                                                                 STATE                                  PARK
                                                                                                                COLUMBUS
                                                                                                              METROPOLITAN
                                                                                                                 LIBRARY
                                                                             COLUMBUS
                                                                             COMMONS

                                                                                 RICH

                                                                                 MAIN

                 PROPOSED                          UNDER CONSTRUCTION                                         COMPLETED IN 2018

                            Housing Unit Tenure Breakdown: Owner Occupied Vs. Rental

  1%
 OWNER
OCCUPIED
                                                                                                                       24%
                                                                                                                      OWNER
                                                                                                                     OCCUPIED

                            75%                                  100%
           24%              MIX                                  RENTAL
           RENTAL
                                                                                                                                 76%
                                                                                                                                 RENTAL
HOUSING & RESIDENTS                                                                                                | 13

 Proposed                                                             Address                 Number Of Units    Tenure
 Scioto Peninsula Redevelopment                                       Belle & Broad                  1700        Mix
 Confluence Village Office and Residential                            W. Nationwide Blvd.             885        NA
 White Castle Residential 1A & 1B                                     555 W. Goodale St.              270        Rental
 Market Tower                                                         45 Spruce St.                   200        NA
 Millennial Tower                                                     Front & Rich                    179        Mix
 4th & Rich Apartments                                                4th & Rich                      124        Rental
 The Harlow                                                           195 E. Main St.                 121        Rental
 255 South High Apartments                                            255 S. High St.                 120        Rental
 Grant Oak Apartments                                                 66 S. Grant Ave.                120        Rental
 White Castle Residential 2A, 2B & 3A                                 555 W. Goodale St.              100        Rental
 The View on Long                                                     55 E. Long St.                   95        Rental
 Neighborhood Launch - 6th & Gay                                      304 E. Gay St.                   28        Owner Occupied
 220 E. Main St. Apartments                                           220 E. Main St.                  14        Rental
 60 on Broad                                                          60 E. Broad St.                   4        Owner Occupied
 274 E. Long St.                                                      274 E. Long St.                   3        Rental
 83 Normandy Ave. Residential                                         83 Normandy Ave.                  2        Owner Occupied
 92 N. 5th St. Renovation                                             92 N. 5th St.                     1        Owner Occupied
 Cap Law Apartments and Garage                                        56 S. Grant Ave.                 NA        Rental
                                                                                              3,966 UNITS

 Under Construction                                                   Address                 Number Of Units    Tenure
 230 E. Long St. Apartments                                           230 E. Long St.                 234        Rental
 The Nicholas                                                         85 N. High St.                  232        Rental
 Xander on State                                                      265 E. State St.                222        Rental
 Lifestyle Communities Matan Block                                    261 S. Front St.                150        Rental
 Lifestyle Communities Beatty Block                                   229 S. High St.                 121        Rental
 330 Oak Street Apartments                                            330 E. Oak St                    93        Rental
 150-156 N. 3rd St.                                                   150 N. 3rd St.                   79        Rental
 Motorists Residential Project                                        65 S. Washington Ave.            68        Rental
 Microliving @ Long and Front                                         55 W Long St                     36        Rental
 White-Haines/Madison's                                               72 N. High St.                   30        Rental
 TOTAL                                                                                        1,265 UNITS

 Completed in 2018                                                    Address                  Number Of Units   Tenure
 80 on the Commons                                                    225 S High St                    125       Rental
 Lifestyle Communities RiverSouth                                     203 S. High St.                  106       Rental
 Parks Edge Condominiums Phase II                                     230 W. Spring St.                 81       Owner Occupied
 The View on Grant                                                    358 Mt. Vernon Ave.               80       Rental
 Sixth Street Mews Phase II                                           Sixth & Gay                       28       Owner Occupied
 Lear Block                                                           155 N. Sixth St.                  26       Rental
 65-67 S. 5th St.                                                     65 S. 5th St.                      9       Rental
 TOTAL                                                                                           455 UNITS

Sources: City of Columbus Department of Development, Developers and Architects
HOUSING & RESIDENTS                                                                                                                                                                                  | 14

Population And Housing Units		                                                                                                            Sales of Owner-Occupied Units
                                                       2017                                     2018                                                                               2017                   2018
 Rental                                               4,720                                     5,194                                       Sales of New Units                      74                    43
 Owner Occupied                                       1,364                                     1,484                                       Median Sale Price - New              $614,204            $733,693
 Total Housing Units                                  6,084                                    6,678                                        Median Price/Sq. Ft. - New             $345                  $380
 Population                                          8,400                                     9,000
                                                                                                                                            Sales of All Units                      212                   192
                                                                                                                                            Median Sale Price - All              $387,500            $350,000

                                                                                                                                            Median Price/Sq. Ft. - All             $286                  $274

Downtown Population Comparison
                                                                                                                                     2018 People
 Area                                         2000 Population                           2018 Population                               Per Acre                   Percent Increase           Land Area (Acres)
 Columbus                                             3,488                                     9,000                                           6.0                   158%                        1,500
 Cleveland                                           11,060                                     16,724                                      12.6                         51%                      1,332
 Cincinnati                                           5,340                                      8,607                                      13.3                         61%                       649

Apartment Rents And Occupancy
                                                            Average Rent                                                      Average Unit SF
                                                                                                                                                                       Percent
 Area                                   1-Br and Smaller                    2-Br and Larger                   1-Br and Larger                   2-Br and Larger       Occupied
 Downtown                                     $1,390                                $1,898                                 736                        1,262              94.6%
 Central Ohio*                                  $780                                $1,056                                 725                        1,200              95.6%
US $1,425 $1,671 755                                                                                                                                  1,130              93.6%

*Excludes downtown area

Source: Vogt Strategic Insights
                                                                                                                                                        YEAR             Population           Housing Units
                                                                                                                                                        2002               3,619                   2,251
        Downtown Residents and Housing Units 2002-2021
                                                                                                                                                        2003               3,793                   2,418
        (includes projection)
                                                                                                                                                        2004               4,078                   2,764
                                                                                                                                                        2005               4,402                   2,943
12,000                                                                                                                                                  2006               4,722                   3,247
                                                                                                                                                        2007               4,943                   3,356
10,000                                                                                                                                                  2008               5,314                   3,670
                                                                                                                                                        2009               5,576                   3,957
 8,000                                                                                                                                                  2010               5,991                   4,127
                                                                                                                                                        2011               6,249                   4,382
                                                                                                                                                        2012               6,322                   4,371
 6,000
                                                                                                                                                        2013               6,675                   4,984
                                                                                                                                                        2014               7,080                   5,109
 4,000
                                                                                                                                                        2015               7,716                   5,366
                                                                                                                                                        2016               8,100                   5,743
 2,000                                                                                                                                                  2017               8,400                   6,084
                                                                                                                                                        2018               9,000                   6,678
     0                                                                                                                                                  2019**             9,925                   7,165
           2002
                  2003
                         2004
                                2005
                                       2006
                                              2007
                                                     2008
                                                            2009
                                                                   2010
                                                                          2011
                                                                                 2012
                                                                                        2013
                                                                                               2014
                                                                                                      2015
                                                                                                             2016
                                                                                                                    2017
                                                                                                                           2018
                                                                                                                                  2019
                                                                                                                                         2020

                                                                                                                                                        2020**            11,690                   8,530
                                                                                                                                                        2021**            12,700                   9,400
Source: Franklin County Auditor, Vogt Strategic Insights, CCSID & DSID                                                                                                                       ** Projection 2019-2021
HOUSING & RESIDENTS                                                                                                                                                                   | 15

 Downtown Residential Demographics
 US Census ACS 2017 Five-Year Estimates
                                                                                                                                             670
                                                                Franklin
 Race                                        Downtown Tracts    County

                                                                                                          NEIL
   One Race
       White
                                                   93%
                                                   66%
                                                                   96%
                                                                   68%
                                                                                             HUNTINGTON
                                                                                                PARK
                                                                                                                 NATIONWIDE
                                                                                                                   ARENA
                                                                                                                                                       30
       Black                                       21%             22%
                                                                                                                                         SPRING

                                                                                                                                                                              GRANT
                                                                                                                                      HIGH

                                                                                                                                                              FOURTH
                                                                                                                              FRONT
                                                                                                                                             LONG

                                                                                                                                                      THIRD
       American Indian                           0.01%            0.2%
       Asian                                        5%              5%                                                                       GAY
                                                                                                                                                                       COLUMBUS
                                                                                                                                                                        MUSEUM
                                                                                                                                                                         OF ART       71

       Hawaiian                                     0%           0.04%                                                                   BROAD

                                                                                                                                      STATEHOUSE

       Other                                        1%              1%

                                                                                                                                                      40
                                                                                                                                                                        TOPIARY
                                                                                                                                                                         PARK

   Two or more races                                7%              4%                                                                  COLUMBUS
                                                                                                                                        COMMONS

                                                                                                                                             RICH

   Hispanic or Latino origin (of any race)          4%              5%                                                                       MAIN

 Commuting Habits
   Workers 16 years and over                      4,769         636,160
      Drive Alone                                   61%             81%                      Map of Census Tracts 30 and 40
      Carpool                                        4%              8%           Data for Tracts 30 and 40 have been combined for this report and referred to
                                                                                    as Downtown Tracts to represent the downtown residential population.
      Public Transportation                          3%              2%
      Walk                                          24%              3%                                                                                                                     Franklin
      Bike                                         1.8%            0.6%         Population                                                      Downtown Tracts                             County
      Other Means                                  1.2%            0.9%         Total                                                                         7,252                        1,253,507
      Work at home                                   5%              4%
                                                                                Median Age                                                          30.9 and 35.9                            34.0
   Mean travel time (minutes)                      19.4            21.8
                                                                                Male/Female                                                          53% / 47%                         49% / 51%

 Educational Attainment
   Population 25 years and over                   5,705        830,824
                                                                                Income and Benefits
                                                                                (In 2017 Inflation-Adjusted Dollars)
      High school graduate or higher               94%            91%
                                                                                Median household                                                    $55,680 and
      Bachelor's degree or higher                  61%            46%                                                                                                                      $56,319
                                                                                income                                                                $37,574
                                                                                Mean household income                                                    $78,643                           $76,492

  Occupation Downtown Tracts 30 & 40

        Management, Business,
              Science & Arts

                 Sales & Office

                        Service

     Production, Transportation
             & Material Moving

Natural Resources, Construction                                                                                                                                               Franklin County
                & Maintenance
                                                                                                                                                                              Downtown
                                  0     10          20          30         40           50                            60
                                                               Percent
HOUSING & RESIDENTS SPOTLIGHT                                                                                          | 16

The View on Grant
Industrial meets modern in The View on Grant.                 The View on Grant boasts 86 apartments—flex studios, as
Conveniently located within the vibrant Discovery District,   well as one- and two-bedroom layouts. The studios offer
the area is defined by top-notch educational institutions     an industrial sliding door, which allows for an entirely open
and internationally recognized cultural destinations. The     studio feel or a separate bedroom and common area. All
View on Grant combines a five-story historic renovated        the units include open kitchens, large windows and soaring,
factory with a three-story addition on top.                   12-feet loft ceilings to create a truly open concept.

“JSDI Celmark wanted to create something new that would       The building is located at 350 Mt. Vernon Avenue, and is 69
still set them apart from other properties in the downtown    percent leased with rents ranging from $1050 to $2500.
area,” said Mitchell Vallis, property manager of The View
on Grant. “The building was actually an old steel pressing
factory and has an industrial feel throughout.”
EMPLOYMENT & OFFICE MARKET                                                                17
                                                                                       || 17
                                                                                          17

                             HIGHLIGHTS
                             While downtown had positive absorption for the
                             year, the vacancy rate increased slightly as new
                             space entered the market at 80 on the Commons.
                             The Hayden was awarded a $1.9 million state
                             historic tax credit for the renovation of the
                             buildings at 16 and 20 E. Broad St. Upgrades to
                             lobbies and tenant amenities are at varying stages
                             of development for many other buildings around
                             Capitol Square including the Huntington Center,
                             One Columbus and the Capitol Square Office Tower.

                             85,248
                             WORKERS

                             14.9%
                             OFFICE VACANCY RATE

                             41%
                             DOWNTOWN WORKERS LIVING IN
                             THE CITY OF COLUMBUS

                             SELECT COMMERCIAL LEASES
                             • Root Insurance, 80 on the Commons, 65,000 sq. ft.
                             • Chipotle Corporate Offices, 333 W. Nationwide
                               Blvd., 31,000 sq. ft.
                             • AEP, 80 on the Commons, 11,000 sq. ft.

                             Source: CBRE, US Census Bureau, Colliers International,
                             Columbus Business First, CCSID, DSID
EMPLOYMENT & OFFICE MARKET                                                                                                                                          | 18

               Quarterly Data (Class A, B, & C)

                                               1Q 2017           2Q 2017              3Q 2017            4Q 2017          1Q 2018          2Q 2018         3Q 2018            4Q 2018

               Net Absorption                  (1,608)              (35,025)          (110,076)          9,506             (98,464)         (10,497)         98,924               109,442

               Vacancy Rate                    12.0%                12.3%             13.2%              13.3%             14.2%            14.3%                14.7%            14.9%

               Comparison with other Downtowns (Class A, B, & C)
                                                     Net Rentable Building
                City                                      Area (SF)                    Vacancy Rate                 2018 Net Absorption                 Average Lease Rate
                Columbus                                  12,425,533                      14.9%                              99,405                               $21.34
                Cleveland (A & B only)                    16,053,932                      21.3%                           (20,313)                                $19.56
                Cincinnati                                12,312,860                      14.8%                            263,417                                $21.31
                Indianapolis                              11,934,183                      13.0%                            188,456                                $22.19
                Nashville                                     9,444,639                       7.8%                         517,131                                $28.64

               Comparison with Suburban Market (Class A, B, & C)
                                                     Net Rentable Building
                Location                                  Area (SF)                    Vacancy Rate                2018 Net Absorption                 Average Lease Rate
                Downtown Columbus                         12,425,533                      14.9%                           99,405                             $21.34
                Suburban Columbus                         24,119,699                      14.9%                           272,232                            $18.79

               Downtown Office Vacancy Rates And Lease Rates 1999-2018
                25%                                                                                                                                                                         $35

                                                                                                                                                                                            $30
                20%

                                                                                                                                                                                            $25
                                                                                                                                                                                                  Lease Rate (2018 Dollars)
VACANCY RATE

                15%
                                                                                                                                                                                            $20

                                                                                                                                                                                            $15
                10%

                                                                                                                                                                                            $10
                 5%
                                                                                                                                                                                            $5

                 0%
                       1999   2000   2001     2002     2003    2004    2005    2006     2007      2008    2009     2010   2011     2012   2013   2014     2015     2016    2017   2018

                  Lease rate (2018 dollars)          Vacancy rate
               Source: CBRE
EMPLOYMENT & OFFICE MARKET                                                                                                                                                             | 19

                                                                     Downtown                                       Franklin County                                         Metro
 Total All Jobs                                             Count                       Share                      Count                    Share                   Count               Share
                                                            85,248                      100%                      739,538                   100%                    999,665              100%

 Jobs by Worker Age
 Age 29 or younger                                          14,415                       17%                      180,003                    24%                    245,964                25%
 Age 30 to 54                                               51,456                       60%                      414,450                    56%                    555,513                56%
 Age 55 or older                                            19,377                       23%                      145,085                    20%                    198,188                20%

 Jobs by Earnings
 $15,000 per year or less                                   11,879                       14%                      166,757                    23%                    233,930                23%
 $15,000 - $40,000 per year                                 19,383                       23%                      244,703                    33%                    334,697                34%
 $40,000 per year or more                                   53,986                       63%                      328,078                    44%                    431,038                43%

 Jobs By Worker Race
 White Alone                                                69,258                       81%                      592,367                   80%                     827,885                83%
 Black or African American Alone                            12,563                       15%                      114,349                   16%                     130,828                13%
 American Indian or Alaska Native                                150                     0.2%                       1,801                0.2%                         2,449            0.002%
 Alone
 Asian Alone                                                 2,331                         3%                      21,188                    3%                      25,953                    3%
 Native Hawaiian or Other Pacific                                 29                    0.03%                         364               0.05%                            467             0.05%
 Islander Alone
 Two or More Race Groups                                         917                       1%                       9,469                    1%                      12,083                    1%

 Jobs by Worker Ethnicity
 Not Hispanic or Latino                                     83,459                       98%                      719,137                   97%                     973,843                    97%
 Hispanic or Latino                                          1,789                         2%                      20,401                    3%                      25,822                    3%

 Jobs by Worker Sex
 Male                                                       40,661                       48%                      365,823               49.5%                       498,993                    50%
 Female                                                     44,587                       52%                      373,715               50.5%                       500,672                    50%

 Jobs By Worker Educational Attainment

     Downtown             5%                  18%                                 26%                                              34%                                           17%

Franklin County           7%                     21%                                     24%                                    24%                                       24%

           Metro          7%                        21%                                   24%                                     23%                                      25%

             Ohio         7%                        24%                                         25%                                   21%                                  23%

              USA              10%                     21%                                      25%                                   22%                                  23%
                     0%                 10%                20%              30%             40%             50%             60%               70%             80%               90%            100%

  Less than high school        high school or equivalent         some college or associate degree     bachelor’s degree or advanced degree        not available (workers aged 29 or younger)

Source: US Census Bureau, OnTheMap Application 2015
EMPLOYMENT & OFFICE MARKET                                                          | 20

Jobs by NAICS Industry Sector
                                                                           0%   5%   10%   15%

                                 Accommodation and Food Services

Administration & Support, Waste Management and Remediation

                          Agriculture, Forestry, Fishing and Hunting

                                 Arts, Entertainment, and Recreation

                                                          Construction

                                                  Educational Services

                                                Finance and Insurance

                                   Health Care and Social Assistance

                                                           Information

                        Management of Companies and Enterprises

                                                        Manufacturing

                      Mining, Quarrying, and Oil and Gas Extraction

                  Other Services (excluding Public Administration)

                     Professional, Scientific, and Technical Services

                                                 Public Administration

                                   Real Estate and Rental and Leasing

                                                           Retail Trade

                                    Transportation and Warehousing
  Downtown
                                                               Utilities
  Franklin County

  Metro                                                Wholesale Trade

Source: US Census Bureau, OnTheMap Application, 2015
EDUCATION                                                          | 21
                                                                      | 21

            HIGHLIGHTS
            Enrollment remains strong at downtown’s colleges
            and universities with more than 33,000 students
            pursuing higher education. Columbus State’s School
            of Hospitality Management and Culinary Arts in
            Cameron Mitchell Hall is a game changer in meeting
            the workforce needs of the growing hospitality
            industry. Housed downtown, it will offer real estate
            and economic development opportunities in the
            Discovery District for years to come.

            4 INSTITUTIONS WITH 33,457 STUDENTS
            COLUMBUS STATE COMMUNITY COLLEGE
                27,204 STUDENTS
               TOP MAJOR: NURSING

            FRANKLIN UNIVERSITY
                4,753 STUDENTS
                TOP MAJOR: BUSINESS

            COLUMBUS COLLEGE OF ART & DESIGN
                1,075 STUDENTS
                TOP MAJOR: COMMERCIAL/ADVERTISING ART

            CAPITAL UNIVERSITY LAW SCHOOL
                425 STUDENTS
                TOP MAJOR: JURIS DOCTOR

            Source: Universities, College Navigator
            *Fall 2018 enrollment
EDUCATION                                                                                                                 | 22

Cameron Mitchell Hall at Columbus State Community College
Cameron Mitchell Hall, which will become the home of the          Michael Bongiorno, managing director and design principal at
School of Hospitality Management and Culinary Arts at             DesignGroup. “Mitchell Hall aligns with our company philosophy
Columbus Community College, provides a national model of          of impact-driven architecture and deepens our commitment to
public-private partnerships. Cameron Mitchell and David Miller    Columbus and the quality of its physical landscape.”
of Cameron Mitchell Restaurants are leading private-sector
investment with a plan to raise $10 million, and Columbus State   This project launches Columbus State’s master plan and will
Community College, the State of Ohio and City of Columbus         spur economic development along Cleveland Avenue in the
have all committed funding.                                       Discovery District. Columbus State currently offers culinary
                                                                  and hospitality programs in restaurant and foodservice
“Mitchell Hall is a first of its kind in the United States        management, culinary apprenticeship, baking and pastry arts,
and will be transformational for Columbus State and the           and hotel, tourism and event management. Adding hotel
Discovery District. We were excited by the opportunity to         management, hotel administration and apprentice sommelier
work under the leadership of Dr. Harrison, in partnership         as part of this project will take programming to a whole new
with a community icon like Cameron Mitchell, to create            level—all with state-of-the-art teaching kitchens, a culinary
pathways toward exceptional student success and expansive         theatre, an innovation kitchen and classrooms.
workforce development opportunities for its students,” said
RETAIL                                                            23
                                                                 | 23

          HIGHLIGHTS
          Restaurants dominate Downtown’s retail sector
          with little progress in attracting other tenants.
          In 2018, Downtown welcomed 11 new businesses,
          eight of which are restaurants. Meanwhile six
          businesses closed. While retail demand continues to
          grow as Downtown adds residents and attractions,
          the challenge continues to be an unproven market
          for chain retail and a lack of appropriate space for
          independent retail.

          5
          NET NEW RETAILERS

          11
          AVERAGE NET NEW RETAILERS
          EACH YEAR SINCE 2009

          2,110
          AVERAGE SQUARE FEET
          OF NEW LEASES IN 2018

          NEW BUSINESSES:
          The Goat @ LC               219 S. High St.
          Rio Fresh                   50 N. High St.
          Oasis Face Bar              20 E. Gay St.
		        Lash Spa Studio             49 N. High St.
          Pecan Penny’s               113 E. Main St.
          BurgerIM                    121 S. High St.
          Criollo                     51 E. Gay St.
          Viiza Pizza                 4 E. Broad St.
          Don Rey Cigar               1 E. Gay St.
          Barroluco                   47 N. Pearl St.
          Stauf’s                     350 Mt. Vernon Ave.
          OH Pizza and Brew           88 N. Broad St.
          (relocation)

          Source: CCSID, DSID
HOSPITALITY & ATTRACTIONS                                                           | 24

                            HIGHLIGHTS
                            The National Veterans Memorial and Museum
                            opened Fall 2018 and welcomed dignitaries like
                            General Colin Powell. Columbus continues to pop up
                            on “Best Of” lists across the country, and no doubt
                            the newly renovated Palace Theatre will help spur
                            even more attention. Listed on the National Register
                            of Historic Place, the 92-year-old theater received
                            a facelift as part of an ongoing $6.5 million capital
                            campaign to fund a full renovation of the theatre.

                            10 MILLION
                            DOWNTOWN VISITORS IN 2018

                            900,000
                            VISITORS TO NATIONWIDE ARENA

                            16
                            HOTELS DOWNTOWN

                            4,056
                            HOTEL ROOMS DOWNTOWN

                            217
                            HOTEL ROOMS UNDER CONSTRUCTION

                            307
                            HOTEL ROOMS PROPOSED

                            70.1%
                            HOTEL OCCUPANCY DOWNTOWN

                            $149.64
                            DOWNTOWN AVERAGE DAILY RATE

                            Source: Experience Columbus, CCSID, DSID
HOSPITALITY & ATTRACTIONS SPOTLIGHT                                                                                             | 25

National Veterans Memorial and Museum
The National Veterans Memorial and Museum (NVMM)                     personal artifacts, quotes, letters, imagery and powerful films
is the only place where the stories of our veterans, their           of veterans telling their unique story in their own words.
families and the fallen are told together across all branches        Together, these elements link our national story to the larger
of service and all eras of conflict. This 53,000-square-foot         context of world events since our country’s earliest days
cultural institution stands as a place of inspiration for all        and demonstrate the importance of veterans in shaping our
visitors to come together and unite in a goal to serve their         history.
communities and country.
                                                                     The Columbus Downtown Development Corporation
Inside the museum, visitors embark on a narrative journey,           (CDDC) served as the project manager, overseeing the
following exhibitions that focus on the people—the soldier,          development, construction and fundraising for the Museum,
sailor, airman, Marine, Coastguardsman and their families—           which opened October 27, 2018 on the Scioto Peninsula in
from answering the call to life after military service. Individual   Downtown Columbus.
stories and shared experiences are illustrated through
TRANSPORTATION & LAND USE                                                       || 26
                                                                                   26

                            HIGHLIGHTS
                            The Downtown C-pass program launched in June
                            and allows thousands of downtown workers to ride
                            COTA for free thanks to funding from property
                            owners and generous supporters. Columbus said
                            a sad goodbye to the car2go rideshare program,
                            but other forms of alternative transportation can
                            help people navigate car-free, including downtown
                            scooter rentals from Lime and Bird.

                            CENTRAL OHIO TRANSIT
                            AUTHORITY (COTA)
                             18,913,789 RIDES IN 2018
                             17% INCREASE IN RUSH HOUR RIDERSHIP

                            COGO BIKE SHARE
                             72 STATIONS
                             40,716 TRIPS TAKEN IN 2018
                             43215 TOP ZIP CODE

                            DOWNTOWN C-PASS
                             524,709 RIDES
                             13,500 EMPLOYEES ENROLLED
                             408 COMPANIES PARTICIPATING

                            Sources: COTA, CoGo Bike Share, CCSID
TRANSPORTATION & LAND USE SPOTLIGHT                                                                                    | 27

Downtown C-pass
Thanks to a partnership between Capital Crossroads Special    “This is an unprecedented program, and we’re really pleased
Improvement District (SID) property owners, the Mid-Ohio      with the progress,” said Kacey Brankamp, program director.
Regional Planning Commission (MORPC) and the Central          “Once we received the ‘green light’ last year, the SID and its
Ohio Transit Authority (COTA), eligible companies can         partners implemented the program in a mere six months,
offer employees free, unlimited access to COTA service.       including building and integrating two new software systems.
The C-pass allows users to ride any bus, any day, any time.   I’m really proud of our team.”
The program launched June 1 to ease downtown’s parking
crunch.                                                       A six-month status report shows more than 500,000 trips
                                                              have been taken using C-pass. COTA reports a 17% increase
Over 400 companies have enrolled in the program, and          in Rush Hour routes offering express service from suburbs to
among them are the 50 largest employers downtown,             downtown. More information about the C-pass program can
including the City of Columbus, Franklin County and           be found at DowntownCpass.com.
Huntington Bank.
| 28

SEE SOMEONE WHO NEEDS HELP DOWNTOWN?
    call or text for a downtown outreach specialist
                 (614) 228-5718

   CARING
CONNECTIONS            Last year, Downtown outreach specialists helped nearly
                       200 people find housing or access social services.
You can also read