Application of Cognitive Modelling for Operation Improvement of Retail Chain Management System
←
→
Page content transcription
If your browser does not render page correctly, please read the page content below
TEM Journal. Volume 10, Issue 1, Pages 358‐367, ISSN 2217‐8309, DOI: 10.18421/TEM101-45, February 2021.

 Application of Cognitive Modelling for
 Operation Improvement of
 Retail Chain Management System
 Oksana Dankeieva 1, Nataliia Solomianiuk 1, Larysa Strashynska 1,
 Nataliia Fiedotova 1, Yuliia Soloviova 1, Viktor Koval 2
 1
 National University of Food Technologies Volodymyrska Street, 68, Kyiv, Ukraine
 2
 Odessa Institute of Trade and Economics of Kyiv National University of Trade and Economics,
 Inglezi 6, Odesa, Ukraine

 Abstract – The purpose of the study is to implement that are characterized by hierarchical, network
cognitive modelling of the retail chain management relationships between subsystems or where random
system to ensure the effectiveness of management processes take place.
decisions in order to implement structural changes in Keywords – cognitive map, concept models, balanced
its activities. It is determined that the organization of scorecard, development scenarios, retail chains.
retail chain management is more effective due to
provided principles of a systematic approach which are
applied. Therefore, using the concept of Balanced 1. Introduction
Scorecard (BSC) in this study, which reflects the
interaction and interdependence of structural units, Sustainable development of retail chains requires
which is feasible, we propose it to further search for managers to constantly improve existing methods of
development scenarios for the retail chain managing retail facilities to ensure a competitive
management. The article presents a sequence of advantage in the market environment. Cognitive
cognitive modelling, which consists of seven main modelling is considered to be one of the newest
stages. Drogerie - format management system of retail directions of the modern theory of managerial
chains has been chosen since it has recently been decision-making, recognized among scientific
standing out by its popularity with consumers among methods of management efficiency improvement.
other formats, as an object for the study. The results of A significant advantage of cognitive modelling in
this study can be useful for enterprises and
 the management system of retail enterprises, which
organizations with complex systems
 are characterized by a large number of elements,
 relationships and interactions between them, the
DOI: 10.18421/TEM101-45
 complexity of the structure, volatility, and presence
https://doi.org/10.18421/TEM101-45 of both quantitative and qualitative characteristics - is
 the ability to analyse and predict as a whole and its
Corresponding author: Viktor Koval, components, without losing a connection between
Odessa Institute of Trade and Economics of Kyiv National them. The relevance of the study of the problem of
University of Trade and Economics, Inglezi 6, Odesa, retail chain management system in the application of
Ukraine. cognitive modelling means that there is an
Email: victor‐koval@ukr.net opportunity: to solve a set of theoretical and practical
Received: 17 December 2020. problems purposely and coherently; not only to
Revised: 20 January 2021. generate alternative solutions for the management of
Accepted: 26 January 2021. a complex system or adaptation to it but also to
Published: 27 February 2021. assess the consequences of decisions; reduce the risk
 of the human factor and increase the effectiveness of
 © 2021 Viktor Koval et al; published by
UIKTEN. This work is licensed under the Creative
 management decisions. The article aim is to
Commons Attribution‐NonCommercial‐NoDerivs 4.0 implement cognitive modelling of the retail chain
License. management system to ensure the effectiveness of
 management decisions and the introduction of
The article is published with Open Access at structural changes in its operation.
www.temjournal.com

 358 TEM Journal – Volume 10 / Number 1 / 2021.
TEM Journal. Volume 10, Issue 1, Pages 358‐367, ISSN 2217‐8309, DOI: 10.18421/TEM101‐45, February 2021. 2. Literature Review graphic method (to visualize information, its grouping, comparison, and generalization). The definition of "cognitive" (Latin "cognitio" – Analysing the theoretical and methodological basis knowledge, the cognitive process of the human of cognitive modelling, a certain sequence of its mind) was borrowed from psychology in the second implementation has been found [9]: half of the twentieth century, regarding the 1. Establishing the purpose and objectives of the information processing, logical thinking, study. imagination, decision making, etc. 2. Analysing the level of complexity of the situation The most famous representative of this approach that needs to be clarified concerning the goal. is Atkinson [1], who identified numerous structural Scientists usually collect, systematize, analyse components (blocks) of cognitive and executive data in terms of quantitative and qualitative processes – memory. It is also worth mentioning the information about the object of management and work of Anderson [2], Axelrod [3], Baars [4], who its environment, as well as determine the first proposed using cognitive maps in order to conditions and limitations at this point. analyze situations and make decisions with a high 3. Identification of the main factors influencing the degree of uncertainty. development of the management situation. Development of the computer became a 4. Determining the dependency between factors due significant incentive for the further application of to causality (creation of a cognitive map in the cognitive modelling. Technology reduced the time form of a directed graph). spent on alternatives, helped to visualise the studied 5. Examination of the power of the interaction of model, increased the accuracy of calculations and various factors. For this purpose, both reliability of the analysis. Currently, some mathematical models are used, which describe researchers actively use the cognitive approach in some precisely identified quantitative their scientific and practical research, among them: relationships between factors, and the subjective Sharifi [5], Pérez-López, González-López, ideas of the expert on the formalization of Rodríguez-Ariza [6], Litau [7]. However, the qualitative relationships between factors. In possibility of applying the methodology of retail stages 3-5, the final cognitive model of the chain management based on cognitive modelling system is built, which is depicted as a functional has not been studied yet. graph. In general, modelling is the replacement of one 6. Verification of the sufficiency of the cognitive object with another to obtain information about the model for a real situation. most important properties of the original object using 7. Determining possible options with the help of a a model object. The simulation is based on the theory cognitive model for the development of the of similarity, according to which absolute similarity situation (system), identifying ways, and is possible only when replacing one object with the mechanisms of influence to achieve the desired same another [7], [8]. results, prevention of undesirable consequences Cognitive modelling is a tool of cognition designed by creating management strategies. Defining to solve a set of low-structured system problems: desired directions and factors for changing determining the object of study, conducting an expert processes trends. Selecting a set of measures (a procedure for selecting factors, determining the type, set of control factors), determining their possible strength and nature of the influence of selected and desired impact (specific and practical factors, building a cognitive map, forecasting, application of the cognitive model) are explained decision making, adaptability, self-organization [8]. by [6], [9], [10], [11]. The purpose of cognitive modelling is to predict the development of the system, its management, to The studied literature on cognitive modelling [8], determine the possibilities of its adaptation to the [9], [10] showed that most authors consider the outer environment. model in the form of a cognitive map, which formally has the form of a directed graph, the 3. Methodology vertices of which are factors, and the edges are the relationship between them (1) [11]. According to the goal of the study, a set of general ⟨ , ⟩, (1) and specific methods of scientific knowledge have been applied, such as: where V is the set of vertices, the vertices Vi ϵ V (i analysis and synthesis, cognitive modelling (to = 1, 2 ... k) are elements of the studied system – find the best scenarios for retail network strategic goals; E is the set of edges, the edges are E management improvement); (i, j = 1, 2 ...N) reflect the relation between the vertices Vi and Vj. TEM Journal – Volume 10 / Number 1 / 2021. 359
TEM Journal. Volume 10, Issue 1, Pages 358‐367, ISSN 2217‐8309, DOI: 10.18421/TEM101‐45, February 2021. Given directed graph reflects the influence of management organization based on a systematic factors taking into account the weights of the edge approach. Research emphasizes that the category Wij established by experts. The weights of the edges "system" means a whole set of mutually dependent can be established on the basis of the functional parts [14]. In general, any set of interacting objects dependence (if any), as well as the coefficient bij can be identified as a systemic formation, i.e. a from the linear regression dependence of factors type system. Thus, the vast majority of systems, especially such as yj=a+bijxi [12]. economic ones, are complex because they are: Thus, the direct (quantitative) and indirect characterized by a large number of elements and (qualitative) influence of factors on the indicators internal connections, their heterogeneity and selected for efficiency assessment have been taken diversity, the performance of many functions, as well into account. as the content of subsystems; hierarchical - due to the This allows to more fully describing the problem order of components in order of importance; open area and the effect of the implementation of certain because there is a constant information exchange measures. Studies have also shown that factors can with the environment; dynamic – with the inevitable affect each other [6], [9], [10], [12]. Two elements of transition of processes, indicators, characteristics, the system are depicted in the scheme as separate etc. from one state to another; homeostatic – through points – vertices Vi and Vj if the element Vi is efforts to maintain integrity, achieve their own goals connected with the element Vj by a causal relation: and the ability to influence certain processes of the Vi Vj, where Vi is the cause, Vj is the consequence. environment, etc. To study the management system, retail chains of Therefore, based on a systematic approach to retail the Drogerie-format were chosen, which was chain management, to model development scenarios, determined by its popularity with consumers among the concept of Balanced Scorecard (BSC) was other retail formats: first, their stores are located chosen Kaplan, Norton [15], [16], which reflects the "near the house". According to a study held by [13], interaction and interdependence of four perspectives: 56% of people choose stores closer to their home, "Finance", "Clients", "Internal Business Processes" 46% – prefer to shop quickly. Secondly, thanks to its and "Training and Development". According to the range, which is easily optimized for the needs of the procedure of cognitive modelling, the primary task is local consumer, moderate pricing, loyalty programs, to establish the purpose and objectives of the study. etc., makes them important. The study involved 18 Since the guaranteed indicator of the functioning of experts from the chain of selected format, who were all structural units of retail networks is the indicator grouped into three groups according to the following of profitability, the strategic goal setting has been requirements: the first group of experts included 6 "Increase in profits compared to the previous period." senior sellers of selected companies who have been The most important goals corresponding to the main working in this chain for at least three years and have prospects of the Balanced Scorecard (BSC) were also the total experience of more than five years in trade; identified (Table 1). the second group of experts included 6 administrators It was expedient to supplement the goals of of trading rooms with experience of administrative prospects with the following initial indicators – work over three years with higher education in measurability and recognition. Measurability economics; the third group consisted of 6 marketers indicates a quantitative or qualitative indicator, and with higher education in marketing management or recognition indicates a value in the retail chain more than five years of experience in this or a similar management system. Then, according to the method position. of cognitive modelling, the control vertices were The experts were asked to fill out a questionnaire chosen, through which control actions will be that determined the degree of the judgment of each submitted, the vertices of the perspective "Internal expert on the given questions. The study has shown business processes"; target peaks, a given change of the consistency of experts' opinions by calculating which has to be achieved – the peaks of the the Kendall concordance coefficient. The coefficient perspective "Finance"; indicator peaks that was equal to 0.98, which testified to the almost characterize the development of economic processes complete consistency of experts' opinions. Scenarios of the model – the peaks of prospects "Clients" and for the development of the management system in the "Training and Development". To search for system retail chain "BROCARD" were modelled based on development scenarios for making more effective the obtained data. management decisions in the activities of retail chains, the following task set has been defined to 4. Results and Discussion achieve the following strategic goals [14], [17], [18]: The key to the success of the network in a market construct a graph and determine the vertices, as full of threats and dangers is a purposeful well as their edges; 360 TEM Journal – Volume 10 / Number 1 / 2021.
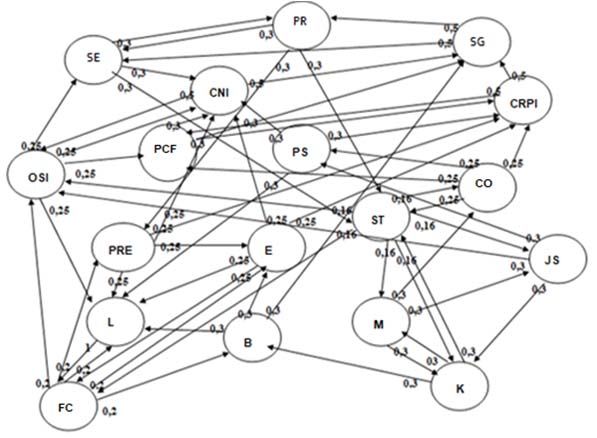
TEM Journal. Volume 10, Issue 1, Pages 358‐367, ISSN 2217‐8309, DOI: 10.18421/TEM101‐45, February 2021. determine the distinction of vertices in the in the case where the studied system is resistant concept of the model; to influence (excitation), conduct pulse investigate the relation of the vertices and their modelling, which should reflect the possible edges of each of the prospects to determine the scenario of the situation; stability/instability of the system; analyse the results obtained to select a more explore the relationship between prospects in effective management decision. terms of sustainability; Table 1. Concept Models Abbreviation Characteristic Perspectives Goals – meaning of vertices Measurability for vertices of vertices 1.Increase in profit compared to previous period PR Goal Quantitative Finance (F) 2.Extention of the structure of activity SE Goal Quantitative 3. Sales growth SG Goal Quantitative 1.Increase in the number of consumers CNI Indicator Quantitative 2.Increase in the number of customers who make CRPI Indicator Quantitative repeat purchases Clients (C) 3.Improving online sales OSI Indicator Quantitative 4.Personalisation PS Indicator Qualitative 5.Focus on the "profitable" consumer PCF Indicator Qualitative 1.Expanding the product range PRE Management Quantitative Internal 2.Emotional component increase for better E Management Qualitative business perception of store visits processes 3.Increasing chain brand-loyalty L Management Qualitative (IBP) 4.Creating a positive (image) for the chain B Management Qualitative 5. Supply optimization Client Orientation CO Management Qualitative 1.Reducing staff turnover К Indicator Qualitative Training and 2.Stuff motivation М Indicator Qualitative Development 3.Staff training system development ST Indicator Qualitative (TD) 4. Increasing the internal focus on the customer FC Indicator Qualitative 5. Job satisfaction increase JS Indicator Qualitative As already emphasized, modern retail chains are Note: PR – Profit; SE – Extension of the structure of activity; open economic systems that, reaching these goals, SG – Sales Growth; CNI – Consumers Number Increase; CRPI – Increase in the number of customers who make repeat interact closely with each other and the external purchases; OSI – Online sales improvement; PS – environment. According to the requirements of Personalization; PCF–Focus on the "profitable" consumer; CO cognitive modelling in the construction of the – Client Optimization; PRE – Expanding the product range; E – relationship graph – these are the edges coming from Emotional component increase for better perception of store visits; L – brand-loyalty increase; B – Creating a positive image the top, which characterizes the corresponding goal for the chain; K – Reducing staff turnover; M – Staff Motivation; of the perspective to achieve the strategic goal ST – Staff training system development; FC – Increasing the (Figure 1). internal focus on the customer; JS – Job satisfaction increase. To determine the importance of the value of the vertices of the graph, an expert group of employees of the network "BROCARD" was involved along with a calculation of Kendall concordance coefficient of experts’ agreement – 0.74, which means a high extent of agreement. According to the rules of the survey, the experts were offered a Likert rating scale, where it was necessary to set scores from 4 – the highest score, to 1 – the lowest score. The average assessment of experts is the value of the goal. According to the rules of graph theory, the fulfilment of one goal depends on the achievement of others. Therefore, each target vertex is related to several other goal vertices, forming a transition and probabilities (Table 2). The connections between the Figure 1. Cognitive Map OF The Retail Network ribs should have only positive consequences because Management System the fulfilment of one goal will have a positive effect TEM Journal – Volume 10 / Number 1 / 2021. 361
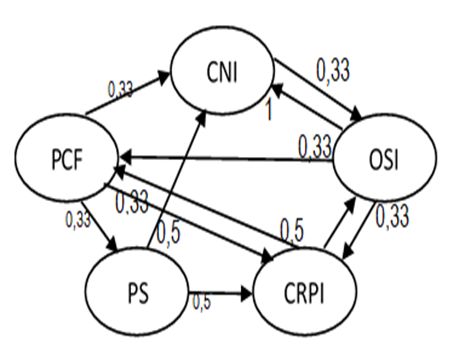
TEM Journal. Volume 10, Issue 1, Pages 358‐367, ISSN 2217‐8309, DOI: 10.18421/TEM101‐45, February 2021.

on the achievement of others. Thus, the value of the clarity of the mathematical apparatus, the high
edge that connects to the vertices will show the probability and accuracy of the obtained solutions,
impact on the aspired goal. Markov's chain theory deserves special attention.
 The obtained indicators provide an opportunity to They describe the behaviour of complex systems,
investigate the relationship between the vertices and which are characterized by hierarchical, network
their edges to determine the stability in individual relationships between subsystems or subsystems
perspectives and the entire system of the retail trade where random processes occur. In order to calculate
chain. Given the fact that retail networks have to the numerical parameters that will characterize this
make management decisions in conditions of randomness, it is necessary to build a probabilistic
uncertainty, the use of probabilistic approaches are model of the phenomenon, which will take into
considered by researchers [8], [9], [12] are the most account probabilistic factors.
rational. Due to the comparative simplicity and
Table 2. Relationship of Vertices of Cognitive Map of Retail Chain Management System
 PR SE SG CNI CRPI OSI PS PCF PRE E L B CO K M ST FC
 PR 0 0 0 0 0 0 0 0 0,34 0 0 0 0 0 0 0,33 0
 SE 0,3 0 0 0 0,33 0 0 0 0 0 0 0 0 0 0 0,33 0
 SG 0,5 1 0 0 0 0 0 0 0 0 0 0 0 0 0 0 0
 CNI 0 0 0,5 0 0 0,5 0 0 0 0 0 0 0 0 0 0 0
 CRPI 0 0 0,5 0 0 0 0 0,5 0 0 0 0 0 0 0 0 0
 OSI 0 0 0 0,3 0 0 0 0,25 0 0 0,25 0 0 0 0 0 0
 PS 0 0 0 0,3 0,33 0 0 0 0 0 0,34 0 0 0 0 0 0
 PCF 0 0 0,33 0,3 0,33 0 0 0 0 0 0 0 0 0 0 0 0
 PRE 0 0 0 0,3 0,25 0 0 0 0 0,25 0,25 0 0 0 0 0 0
 E 0 0 0 0,3 0,25 0 0 0 0 0 0,25 0 0,25 0 0 0 0
 L 0 0 0 0 0 0 0 0 0 0 1 0 0 0 0
 B 0 0 0,33 0 0 0 0 0 0 0,33 0,34 0 0 0 0 0 0
 CO 0 0 0 0 0 0,2 0 0 0,2 0,2 0,2 0,2 0 0 0 0 0
 K 0 0 0 0 0 0 0 0 0 0 0 0,33 0 0 0,34 0,33 0
 M 0 0 0 0 0 0 0 0 0 0 0 0 0 0,33 0 0 0,33
 ST 0 0 0 0 0 0,16 0 0 0 0 0 0 0,16 0,16 0,16 0 0,16
 FC 0 0 0 0 0,25 0 0,25 0,25 0 0 0 0 0 0 0 0,25 0
 JS 0 0 0 0 0 0 0,33 0,34 0 0 0 0 0 0,33 0 0 0
 Note: PR – Profit; SE – Extension of the structure of activity; SG – Sales Growth; CNI – Consumers Number Increase; CRPI –
Increase in the number of customers who make repeat purchases; OSI – Online sales improvement; PS – Personalization; PCF–
Focus on the "profitable" consumer; CO – Client Optimization; PRE – Expanding the product range; E – Emotional component
increase for better perception of store visits; L – brand-loyalty increase; B – Creating a positive image for the chain; K – Reducing
staff turnover; M – Staff Motivation; ST – Staff training system development; FC – Increasing the internal focus on the customer; JS –
Job satisfaction increase.

 Researching complex systems that develop under According to the theory, the Markov chain [19] is
the influence of random factors, it is possible to homogeneous, i.e. the transitions of the system from
assume that the system – S (in our case – a separate state to state are described by transient probabilities,
perspective), defined by this graph, consistently which are constant values ij .
passes through discrete-time intervals from one state To simplify the analysis of the model, investigation
to another, forming many states: , , …, , of the relationship between the vertices and their
Transitions of the system from state to state are edges for each of the perspectives will be carried out
possible only at fixed moments of time t: , , …, and, if necessary, their stability in perspectives
 . established [20].
 Thus, a random process that occurs in the system is Since the top of the perspective "Finance" is the
a function of an integer argument. According to target factor of its implementation depends on the
Wentzel [19], if for each step the probability of following perspectives: "Clients", "Internal Business
transition from any state to any other state does not Processes", "Training and Development". Figure 2
depend on when and how the system came to such a shows the approximate graph of the BSC perspective
state, and then the sequence of events is a Markov "Customers".
chain.

 362 TEM Journal – Volume 10 / Number 1 / 2021.
TEM Journal. Volume 10, Issue 1, Pages 358‐367, ISSN 2217‐8309, DOI: 10.18421/TEM101‐45, February 2021.

 Then the transition probability matrix P will take
 the form:
 0 0 0,33 0,5 0,33
 0 0 0,33 0,5 0,33
 1 0,5 0 0 0
 0 0 0 0 0,33
 0 0,5 0,33 0 0
 The initial state of the system is set by a vector-
 column, which is formed by expert evaluation and
 has passed the procedure of coordination, prospects
 "Clients". The experts had to determine the weight of
 Note: CNI – Consumers Number Increase; CRPI – Increase in the components of the perspective so that in the end
the number of customers who make repeat purchases; OSI – the amount equals 1.
Online sales improvement; PS – Personalization; PCF– Focus
on the "profitable" consumer. 0,3
 Figure 2. Directed Graph of BSC Perspective "Clients" ⎛0,12⎞
 0 ⎜0,14⎟ (3)
 According to the initial information, the transition 0,3
probabilities are given by the following weights, ⎝ 0,14⎠
where P ij is the probability of transition in one step An equation that describes the state of the system
from the state Si to the state Sj. In our case, the in at moment of time is described by matrix
element P is the weight of the edge (see Figure 2), equations in recurrent form.
coming from the specified vertex-target:
 P11=0 P12=0 P13=0 P14=1 P15=0 ⋅ 1 , ( 1,2,..., ), (4)
 P21=0 P22=0 P23=0,5 P24=0 P25=0,5
 where the matrix transposed relative to the matrix
 P31=0,33 P32=0,33 P33=0 P34=0 P35=0,33
 P41=0,5 P42=0,5 P43=0 P44=0 P45=0
 R.
 P51=0,33 P52=0,33 P53=0 P54=0,33 P55=0 The results of calculations by equation (4) using
 MS Excel are shown below in Figure 3.

 0.4

 0.35

 0.3

 0.25

 0.2

 0.15

 0.1

 0.05

 0
 1 2 3 4 5 6 7 8 9 10 11
 CNI 0.3 0.2424 0.176946 0.216711 0.1959804 0.20632945 0.19707753 0.20205909 0.19680396 0.19866247 0.19566315
 CRPI 0.12 0.2424 0.176946 0.216711 0.1959804 0.20632945 0.19707753 0.20205909 0.19680396 0.19866247 0.19566315
 OSI 0.14 0.36 0.3636 0.265419 0.3250665 0.2939706 0.30949418 0.29561629 0.30308864 0.29520595 0.2979937
 PS 0.3 0.0462 0.035046 0.0792 0.06879213 0.06466144 0.06773651 0.06605776 0.06622171 0.06553236 0.06547901
 PCF 0.14 0.1062 0.24 0.208461 0.19594377 0.20526215 0.20017503 0.20067184 0.19858292 0.19842123 0.1967492

Note: CNI – Consumers Number Increase; CRPI – Increase in the number of customers who make repeat purchases; OSI – Online
sales improvement; PS – Personalization; PCF– Focus on the "profitable" consumer.

 Figure 3. Results of Calculations for Perspective "Clients"

TEM Journal – Volume 10 / Number 1 / 2021. 363
TEM Journal. Volume 10, Issue 1, Pages 358‐367, ISSN 2217‐8309, DOI: 10.18421/TEM101‐45, February 2021.

 Therefore, the analysis of graphs shows that the this perspective will be subject to improved online
system over time, the probability of reaching the sales (0.298), targeting the "profitable" consumer
resistance to impact (stationary mode), when: (0.197) will increase, however as at the initial stage,
 the promising components of increasing the number
 0,196 of consumers (0.3) and their personalization (0.3)
 ⎛ 0,196 ⎞ were identified.
 ∞ ⎜ 0,298 ⎟ Similarly, the stable development of prospects
 0,0655 "Internal Business Processes" and "Training and
 ⎝ 0,197 ⎠ Development" is defined. The calculations are given
 These calculations of interactions and weights of in Figure 4 and Figure 5.
their vertices the perspective "Customers" mean that
starting from the 3rd step, the stable development of

 0.6
 0.5
 0.4
 0.3
 0.2
 0.1
 0
 1 2 3 4 5 6 7 8 9 10 11
 CO 0.18 0.28 0.51 0.2925 0.35375 0.3996875 0.34265625 0.36332031 0.37255859 0.35753418 0.36420166
 PRE 0.21 0.045 0.07 0.1275 0.073125 0.0884375 0.09992188 0.08566406 0.09083008 0.09313965 0.08938354
 E 0.3 0.24 0.115 0.1975 0.200625 0.1615625 0.18835938 0.18558594 0.17649414 0.18396973 0.18252319
 L 0.13 0.39 0.235 0.255 0.299375 0.261875 0.26914063 0.27976563 0.26928711 0.2722168 0.27450806
 B 0.18 0.045 0.07 0.1275 0.073125 0.0884375 0.09992188 0.08566406 0.09083008 0.09313965 0.08938354

Note: CO – Client Optimization; PRE – Expanding the product range; E – Emotional component increase for better perception of
store visits; L – brand-loyalty increase; B – Creating a positive image for the chain.
 Figure 4. Results of Calculations for Perspective "Internal Business Processes"

 Thus, if at the initial consideration the experts The construction of the initial vector of the last
considered the development of this perspective far- perspective "Learning and Development", according
reaching with the proper development of the to experts, allowed to determine the same prospects
emotional (0.3) component, the calculations of for all components, as the degree of employee
interactions and weights of their peaks of the satisfaction depends on meeting the goals of all the
perspective "Internal Business Processes" showed above prospects and achieving this main strategic
that stable network development will be achieved by goal [21], [22], [23]. Table 5 shows the results of
increasing the value of the component optimization establishing stability in the vertices and their edges
of work with suppliers (0.364) and improvement of depending on the 4th step of the experiment.
measures to increase consumer loyalty (0.275).
 0.4
 0.35
 0.3
 0.25
 0.2
 0.15
 0.1
 0.05
 0
 1 2 3 4 5 6 7 8 9 10 11
 K 0.19 0.2576 0.2836 0.256729 0.2577 0.2640802850.2607105530.2592515950.2598564460.2592041080.25841564
 M 0.22 0.2 0.1763 0.2062 0.1992645 0.193032250.1964651430.1963753480.1948034350.1947411220.194566166
 ST 0.21 0.095 0.1288 0.1418 0.1283645 0.12885 0.1320401430.1303552760.1296257970.1299282230.129602054
 FC 0.19 0.3626 0.3311 0.321129 0.3286 0.3282625350.3251355530.3252716660.3250340840.3240170070.323379752
 JS 0.18 0.0726 0.066 0.058179 0.068046 0.0657572850.0637006430.0648334970.0648038650.0642851340.06426457

Note: K – Reducing staff turnover; M – Staff Motivation; ST – Staff training system development; FC – Increasing the internal focus
on the customer; JS – Job satisfaction increase.
 Figure 5. Results of Calculations for Perspective "Training and Development"

 364 TEM Journal – Volume 10 / Number 1 / 2021.
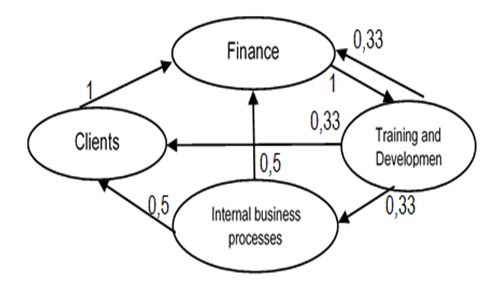
TEM Journal. Volume 10, Issue 1, Pages 358‐367, ISSN 2217‐8309, DOI: 10.18421/TEM101‐45, February 2021.

 Therefore, stable development in this perspective The obtained calculations showed (Figure 7) that
will be subject to proper development and the retail network is developing steadily in the 4th
implementation of new systems to increase internal step. Next, according to the plan of the task of
consumer orientation (0.323). formalizing the qualitative links between the factors
 The stability of the whole model is represented by were set to achieve the goal. The plan of the
graph (Figure 6) and the stable development of all experiment consisted of the successful introduction
prospects in a similar scenario is established, where of disturbances to the top of the component
the initial vector is expert assessments (Figure 7). perspective "Internal business processes": first –
 "Expansion of the range of goods", then – to the top
 "Optimization of work with suppliers".

 Figure 6. Graph of BSC Prospects

 0.6
 0.5
 0.4
 0.3
 0.2
 0.1
 0
 1 2 3 4 5 6 7 8 9 10 11
 F 0.148 0.51841 0.33534 0.2921653 0.3950272 0.35221425 0.33344943 0.3634124 0.35330006 0.34652723 0.35498162
 C 0.279 0.23941 0.09593 0.1962353 0.1987919 0.15342235 0.18002708 0.18338533 0.16991473 0.1766125 0.17836913
 IBP 0.296 0.09418 0.05032 0.1762594 0.1140156 0.0993362 0.13430925 0.11975284 0.1133728 0.12356022 0.12012202
 TD 0.277 0.148 0.51841 0.33534 0.2921653 0.3950272 0.35221425 0.33344943 0.3634124 0.35330006 0.34652723

 Note: F – Finance; C – Clients; IBP – Internal business procedures; TD – Training and Development
 Figure 7. Results of Calculations for BSC Prospects

 According to the theory [9] modelling of pulse [25] determines the changes in the parameters of the
processes occurs according to the formula: vertices by the equations:
 х 1 х п ∑ (5) AR (6)
 where хi (n) – value of impulse in the point і in the ... AQ IQ (7)
previous moment (pace of modelling) (п),
 хi(п + 1) – value of impulse in the point і at the Having made a perturbation at the top of the graph
interesting for the researcher moment (п +1); by 20%, corresponding to the control factor
 fij – the momentum conversion factor in the initial "Optimization of work with suppliers", an increase in
stages of modelling is considered fij = 1; the target factor "Profit" is observed by more than
 Рj(п) – the value of the pulse in the vertices 10%. For greater clarity, Figure 4 shows an element
adjacent to the vertex i; of the graph with vertices in which the corresponding
 Qi (п) – vector of perturbations and control indicators were significantly increased.
influences entering the top and moment (n). Having made a perturbation at the top of the graph
 While adding Qi(п) the question “What happens at by 20%, corresponding to the control factor
the moment (п+1) if?” is investigated. "Expansion of the product range", an increase in the
 The set of implementations of impulse processes is target factor "Profit" to 15% is observed (Figure 8).
called "development scenario" and indicates possible Thus, the results of the experiments showed that
trends in situations. the significant control factors are the factors
 The situation in pulse simulation is characterized "Optimization of work with suppliers" and
by a list of all Qi values of X in each of its cycles. "Expansion of the range", to which management
The calculation formula obtained from [9], [24], and needs to pay priority attention. Thus, cognitive
 modelling and its implementation illustrate the

TEM Journal – Volume 10 / Number 1 / 2021. 365
TEM Journal. Volume 10, Issue 1, Pages 358‐367, ISSN 2217‐8309, DOI: 10.18421/TEM101‐45, February 2021.

dependence of network performance on many factors analysis which helps to increase the level of sound
and confirms that in order to obtain sound recommendations needed to support management
management decisions to stabilize the state of such a decisions [26], [27], and [28].
system need to form subjective models of problems,

 35
 30
 25
 20
 15
 10
 5
 0
 1 2 3 4 5 6 7 8 9 10 11 12
 SG 0 1.568 1.896 1.698 1.987 1.235 1.459 1.789 1.125 1.154 1.478 1.897
 PS 0 1.236 1.258 1.478 1.4658 1.487 1.789 1.489 1.799 2.1157 2.1473 2.235
 PR 0 3.213 3.322 3.364 3.698 3.597 3.798 3.157 3.998 4.158 4.568 5.125
 PRE 0 5.56 6.18 6.98 7.24 7.25 7.56 7.566 7.58 7.89 8.487 8.56
 СО 0 4.466 4.899 4.999 5.123 5.145 5.698 5.789 6.156 6.148 6.235 6.789
 CNI 0 5.236 5.893 5.698 5.789 5.987 6.789 6.458 6.789 6.987 7.465 7.789

Note: PR – Profit; PRE – Expanding the product range; фі CNI — Consumers Number Increase; PS – Personalization; SG – Sales
Growth; CO – Client Optimization.
 Figure 8. Results of Experiment with Increasing Control Factor "Expansion of the Product Range"

 The obtained simulation results show that the that will ensure the efficiency of economic activity in
situational approach in the form of cognitive models a changing business environment.
provides an opportunity to provide effective
structural transformations in the management system References
of retail networks of Drogerie-format [29], [30], [31].
 [1]. Atkinson, R. C., Herrnstein, R. J., Lindzey, G., &
5. Conclusions Luce, R. D. (Eds.). (1988). Stevens' handbook of
 experimental psychology. (Vols. 1). New York:
 Using modern management models requires the Wiley.
use of powerful analytical tools to assess the [2]. Anderson, J. R. (1990). Cognitive psychology and its
performance of the management system, which implications (3rd ed.). New York: Freeman.
should be a significant basis for more effective [3]. Axelrod, R. (1976). The Structure of Decision:
management decisions. The use of a balanced Cognitive Maps of Political Elites. United States:
scorecard allows us to specify the goals and Princeton University Press.
strategies of the management system in terms of the [4]. Baars, B. J. (1993). A cognitive theory of
overall strategy of the retail network. consciousness. Cambridge University Press.
 This will determine the strategic guidelines for the [5]. Sharifi, S. S., & Esfidani, M. R. (2014). The impacts
development of the network management system, of relationship marketing on cognitive dissonance,
depending on the development of all its components, satisfaction, and loyalty: The mediating role of trust
as well as to identify the most promising to increase and cognitive dissonance. International Journal of
the efficiency of its operation. Retail & Distribution Management, 42(6), 553-575.
 The issue of modelling scenario development in [6]. Pérez-López, M. C., González-López, M. J., &
retail network management systems is extremely Rodríguez-Ariza, L. (2019). Applying the social
complex and multifaceted. cognitive model of career self-management to the
 Due to the insufficient level of its development in entrepreneurial career decision: The role of
both methodological and applied aspects, it is exploratory and coping adaptive behaviours. Journal
advisable to use mathematical models and use known of Vocational Behavior, 112, 255-269.
 [7]. Litau, E. (2018, August). Entrepreneurship and
analytical tools based on software packages. The
 economic growth: A look from the perspective of
search for scenarios is modelled on the example of a
 cognitive economics. In Proceedings of the 2018 9th
specific retail network, which allows determining the
 International Conference on E-business, Management
most effective consequences of development and
 and Economics (pp. 143-147).
making more effective management decisions based [8]. Nicolás, C., Rubio, A., & Fernández-Laviada, A.
on them. (2018). Cognitive determinants of social
 We will focus on modelling the development of entrepreneurship: Variations according to the degree
scenarios in retail network management systems of economic development. Journal of Social
using other quantitative and qualitative indicators Entrepreneurship, 9(2), 154-168.

 366 TEM Journal – Volume 10 / Number 1 / 2021.
TEM Journal. Volume 10, Issue 1, Pages 358‐367, ISSN 2217‐8309, DOI: 10.18421/TEM101‐45, February 2021.

[9]. Udell, M., Stehel, V., Kliestik, T., Kliestikova, J., & [19]. Wentzel, E.S. (1972). Issledovanie operacij
 Durana, P. (2019). Towards a smart automated [Operations research]. Moscow: Soviet Radio. [in
 society: Cognitive technologies, knowledge Russian].
 production, and economic growth. Economics, [20]. Nouri, F. A., Nikabadi, M. S., & Olfat, L. (2019).
 Management and Financial Markets, 14(1), 44-49. Developing the framework of sustainable service
[10]. Ginis, L. A. (2020, November). Methodological basis supply chain balanced scorecard (SSSC
 of simulation and cognitive modelling technology of BSC). International Journal of Productivity and
 socio-economic systems. In Journal of Physics: Performance Management, 68(1), 148-170.
 Conference Series (Vol. 1661, No. 1, p. 012035). IOP [21]. Wood, M. D., Bostrom, A., Bridges, T., & Linkov, I.
 Publishing. (2012). Cognitive mapping tools: review and risk
 https://doi.org/10.1088/1742-6596/1661/1/012035 management needs. Risk Analysis: An International
[11]. Firsova, A. A., Makarova, E. L., & Tugusheva, R. Journal, 32(8), 1333-1348.
 R. (2020). Institutional management elaboration [22]. Gardner, H. (1985). The mind's new science: A
 through cognitive modeling of the balanced history of the cognitive revolution. New York: Basic
 sustainable development of regional innovation Books.
 systems. Journal of Open Innovation: Technology, [23]. Arsawan, I. W. E., Sanjaya, I. B., Putra, I. K. M., &
 Market, and Complexity, 6(2), 32. Sukarta, I. W. (2018). The effect of expatriate
 http://doi.org/10.3390/joitmc6020032 knowledge transfer on subsidiaries’ performance: a
[12]. Gorelova, G., & Badwan, N. (2019). Cognitive moderating role of absorptive capacity. In Journal of
 Modeling for the Intellectual System of Supporting Physics: Conference Series (Vol. 953, No. 1, p.
 Decision Making on Regulating Reproduction and 012082). IOP Publishing.
 Accumulation of Financial Capital. International [24]. Osherson, D.N. y H. Lasnik, Eds. (1990): Language.
 Research Journal of Finance and Economics, 175, 70- An Invitation to Cognitive Science, Vol. 1. The MIT
 82. Press: Cambridge (MA).
[13]. Nielsen (2018). Retail Measurement. Retrieved from: [25]. Roseman, I. J. (1984). Cognitive determinants of
 https://www.nielsen.com/eu/en/solutions.html. emotions: A structural theory. In P. Shaver (Ed.).
 [accessed: 12 November 2020]. Review of personality and social psychology: Vol. 5,
[14]. Rousseau D, Billingham J, Wilby JM, Blachfellner S Emotions. Relationships, And Health. Beverly Hills,
 (2016) In search of general systems theory. Systema CA: Sage.
 4(1), 76-92 [26]. Eden, C. (1988). Cognitive mapping. European
[15]. Kaplan, R. S., & Norton, D. P. (1996). Using the Journal of Operational Research, 36(1), 1-13.
 balanced scorecard as a strategic management [27]. Ayers, J. B., & Odegaard, M. A. (2017). Retail
 system. Harvard Business Review, 74(1), 75-85. supply chain management. CRC Press.
[16]. Kaplan, R. S., & Norton, D. P. (2001). Strategy- [28]. Fernie, J., & Sparks, L. (Eds.). (2018). Logistics and
 focused organization: How balanced scorecard retail management: emerging issues and new
 companies thrive in the new business environment. challenges in the retail supply chain. Kogan page
 Boston: Harvard Business School Press. publishers.
[17]. Kostetska, K., Khumarova, N., Umanska, Y., [29]. Gandhi, A., Shaikh, A., & Sheorey, P. (2017). Impact
 Shmygol, N., & Koval, V. (2020). Institutional of supply chain management practices on firm
 qualities of inclusive environmental management in performance. International Journal of Retail &
 sustainable economic development. Management Distribution Management, 45(4), 366-384.
 Systems in Production Engineering, 28(1), 15-22. [30]. Krasyuk, I. A., Krymov, S. M., Medvedeva, Y.,
 https://doi.org/10.2478/mspe-2020-0003 Chernisheva, A. M., & Lashko, S. I. (2017).
[18]. Arsawan, I. W. E., Koval, V., Rajiani, I., Rustiarini, Marketing Management in Retail
 N. W., Supartha, W. G., & Suryantini, N. P. S. (2020). Chains. International Journal of Applied Business and
 Leveraging knowledge sharing and innovation culture Economic Research, 15(12), 83-91.
 into SMEs sustainable competitive [31]. Ekinci, E., & Baykasoğlu, A. (2019). Complexity and
 advantage. International Journal of Productivity and performance measurement for retail supply
 Performance Management. chains. Industrial Management & Data
 https://doi.org/10.1108/IJPPM-04-2020-0192 Systems, 119(4), 719-742.

TEM Journal – Volume 10 / Number 1 / 2021. 367
You can also read