CENTRAL PATTANA Public Company Limited - POA 2021 Conference by DBS Vickers Securities
←
→
Page content transcription
If your browser does not render page correctly, please read the page content below

CENTRAL PATTANA Public Company Limited
                    POA 2021 Conference by DBS Vickers Securities

January 8, 2021                Virtual Meeting
Disclaimer
                                                 Please read before you proceed!

    ▪ The information contained in this presentation is for information purposes only and does not constitute an offer or invitation to sell or
      the solicitation of an offer or invitation to purchase or subscribe for share in Central Pattana Public Company Limited (“CPN” and
      shares in CPN, “shares”) in any jurisdiction nor should it or any part of it form the basis of, or be relied upon in any connection with,
      any contract or commitment whatsoever.

    ▪ This presentation may include information which is forward-looking in nature. Forward-looking information involve known and
      unknown risks, uncertainties and other factors which may impact on the actual outcomes, including economic conditions in the
      markets in which CPN operates and general achievement of CPN business forecasts, which will cause the actual results,
      performance or achievements of CPN to differ, perhaps materially, from the results, performance or achievements expressed or
      implied in this presentation.

    ▪ This presentation has been prepared by the CPN. The information in this presentation has not been independently verified. No
      representation, warranty, express or implied, is made as to, and no reliance should be placed on, the fairness, accuracy,
      completeness or correctness of the information and opinions in this presentation. None of the CPN or any of its agents or advisers,
      or any of their respective affiliates, advisers or representatives, shall have any liability (in negligence or otherwise) for any loss
      howsoever arising from any use of this presentation or its contents or otherwise arising in connection with this presentation.

    ▪ This presentation is made, furnished and distributed for information purposes only. No part of this presentation shall be relied upon
      directly or indirectly for any investment decision-making or for any other purposes.

    ▪ This presentation and all other information, materials or documents provided in connection therewith, shall not, either in whole or in
      part, be reproduced, redistributed or made available to any other person, save in strict compliance with all applicable laws.

2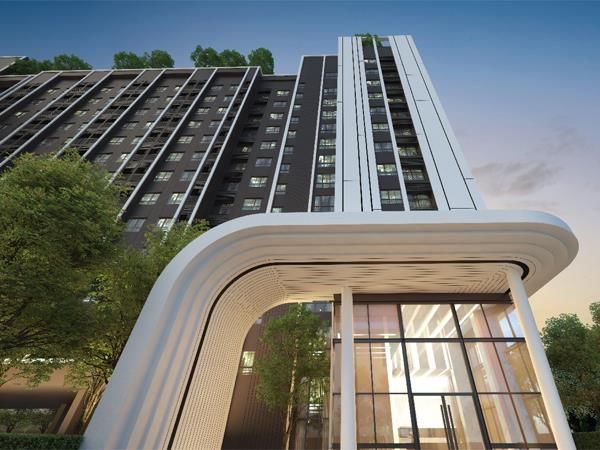
Agenda

    1. Company Overview

    2. Business Updates & Outlook

    3. Appendices

3
Company Overview

Central Pattana at a Glance

                                                                                                                A top regional retail-led diversified property developer

                                               92       %                                                     34          Retail Projects
 Company
 Overview
                                                                                                              10           Office Buildings

                      1.8                                                 7                                      2              Hotels Projects

                                                                                                                  15                     Residential Projects

 UPDATES
                     Solid financial performance and robust                                                                   Strategic investments in REIT and Prop. Fund
                       capital structure to support growth                                                                          as well as business collaboration

                                                                                                                           27%                      25%
                        23.7                         54%                        0.53
                         bn THB                                                  times
APPENDICES

                  9M20 total revenue          9M20 EBITDA margin          9M20 Net Debt/Equity                      10 projects includes        The Offices at
                  88% of which from           contributes to strong      signifies low gearing to                    Retail, Office and         CentralWorld
                rent-based businesses         operating cash flow          support investments                           Hospitality

              Note: Information as of November 30, 2020 ; Projects include those managed by Grand Canal Land plc (GLAND), a subsidiary of Central Pattana
        5           **Includes CPNREIT retail space
Market leadership in BMA and dominant player in provincial area
Highly accessible location, concept matched the surrounding area with key tenant magnets
✓ Chiangmai 1
✓ Chiangrai ✓ Completed Projects • Central Pattana’s shopping malls in BMA and UPC
Competition in BMA ✓ Lampang Future Projects located in strategic location adjacent to mass transit
✓ Phitsanulok
Logo = Locations with where shoppers can highly accessible.
CPN’s presence
Others 20 ✓ Khonkaen
✓ Nakhon
NORTH Ratchasima
Company 36
Overview % market share ✓ Udonthani
✓ Ubonratchathani
5 The Mall
of total GFA
in Bangkok at 3 Siam Piwat
18.9 mn sq.m.
14
Proprietary Ayutthaya
Developers
22
Hypermarket
UPDATES
✓ Chonburi 2
Si Racha
Chanthaburi
✓ Rayong
✓ Phuket 3
✓ Suratthani 4
✓ Hatyai
APPENDICES ✓ Nakhon Si
Thammarat
Note:
Bangkok Metropolitan Area include operational shopping malls, namely at 1) Lardprao ; 2) Ramindra ; 3) Pinklao ; 4) Rama 3 ; 5) Bangna ; 6) Rama 2 ; 7) CentralWorld ; 8)
Rattanathibet ; 9) Chaengwattana ; 10) Grand Rama 9 ; 11) Salaya ; 12) WestGate ; 13) EastVille ; 14) Mahachai, and announced future projects,
namely at A) Central Village and B) Dusit Central Park
1. Chiangmai includes 2 shopping malls: CentralPlaza Chiangmai Airport and CentralFestival Chiangmai
2. Chonburi includes 3 shopping malls: CentralMarina, CentralFestival Pattaya Beach and CentralPlaza Chonburi
6 3.
4.
Phuket includes 2 shopping malls: Central Phuket Floresta and Central Phuket Festival (both under the same complex “Central Phuket”)
Suratthani includes 2 shopping malls: CentralPlaza Suratthani and CentralFestival Samui
Strong Support from Major Shareholders
             Central Group’s leadership in retail and lifestyle experiences

                Serve as effective traffic magnets into CPN’s
                properties through widely recognized brands
                with over 7 decades presence in Thailand.          New
 Company                                                         Economy
 Overview

 Company
 Overview

                                               Department                       Vietnam
                                                 Store                           Group
                                                                                           Utilize customer data shared across
                                                                                           business    units and    the  new
                                                                                           economy space to create unique,
                                                                                           personalized experience for every
                                                                                           customer.
 UPDATES

                                                                                Home &
                                                Food Retail                     Hardline

APPENDICES                                                       Restaurant
                                                                Group, Hotels
                                                                  & Resorts

        7
Development & Management Structure

                            Joint - developer Area                                             CPN Developed & Managed Area

 Company
 Overview

                                                                                      CRG & CMG

 UPDATES

                ❖ Central Group - department store & Bus
                  invest their own structure and assets                                                  ▪   Comprises anchor and assorted tenants
APPENDICES

                                                                                     12%   CRG & CMG
                ❖ Invest in their own structure and assets                                               ▪   Standard contractual and pricing terms

                ❖ Shares cost of landscaping and                                           Third Party   ▪   Enables optimum tenant mix at each
                  surrounding facilities                                             88%
                                                                                           Tenants           location
        8     Note: CRG = Central Restaurant Group ; CMG = Central Marketing Group
Rental Contract Structure1
             Robust contract structure with potential             Revenue Sharing with   Fixed Rent :                              Long-term contracts :
             upside from expiring long-term leases                minimum guarantee      Mainly adopted by local / small-
                                                                                         size retailers, banks / financial
                                                                                         services                                  More than 50% are long-term
                                                                  • International                                                  leases (already paid upfront),
                                                                                         technology service providers and
                                       Consignment,                 fashion brands       most specialty shops.                     which will expire in the next
               Fixed Rent,                 42%                                                                                     several years and presents
 Company
 Overview          43%                        (41%)               • Food chain &         Consignment :                             considerable upside upon
                 (43%)                                              international F&B                                              renewal.
                                                                                         Mainly adopted by international
                                                                    brands               brands (e.g., fast fashion, café /
                                   Long-term                                             restaurant / fine dining chains,
                                   Lease, 15%                     • Cinema               etc.), cinemas, and food kiosks.
                                      (16%)
                                                                  • Food kiosks
                                                                                                                     Rental rate upside
 UPDATES
             % Long-term lease expiration schedule 2                                     • Rental rate aggregation 3-5%/year for Fixed Rent contract
             ISETAN contract expired in 2020, CPN is on process of procure new
             tenants.                                                                    • Upside from revenue sharing with minimum guaranteed rate
                                                                                           aggregate 3-5%/year same as Fixed Rent contract

                                                                                         • Approximately +10% rental rate reversion after major renovation
                         Isetan Dept. Store

APPENDICES                     27%                                                       • Upside from LT lease expiration schedule (opportunity reallocate to
                                                                         39%               ST contract).
                                                        26%
                                                                         9%
                                                                                         Source: Company estimate as of September 30, 2020
                             < 1 year                 1-3 years       > 3 years          (1) Percentage based on occupied area.
                                                                                         (2) Based on total long-term lease area of 132,071 sq.m. with less than 5% rental
                             Retail           Dept Store in Acquired Projects
        9                                                                                    income contribution.
Dedication towards sustainable development

                                                               Central Pattana
                                                     Sustainable Development Highlights
 Company        Business Collaboration                   Highly satisfied customers                          Environmentally friendly business
 Overview
                 Deliver new experiences and value       Creating destinations for every customer            operator
                 with capable business leaders              with unique lifestyle and interests
                                                                                                            Platinum LEED certification for
                                                                                                              foodwOrld at CentralWorld

                                                            Food Destination          Family Destination

 UPDATES
                Transparent and Integrity towards
                general public                                                                                     Energy conservation intiatives
                                                         Fashion Destination        Sports Destination            (e.g., solar rooftop, LED lighting)
                            The only Thai real estate
                            company selected to DJSI
                                                         Educated Tenants

APPENDICES

                                                                                                                 Green area within CPN properties
                                                                               CPN Lead & SME marketplace

                                                         Highly satisfied all stakeholders
       10
Business updates & outlook
3Q20 Key Highlights
                                          Reiterating Central’s Safety and Hygiene Plan   Signature events to maintain customer engagement

 Company
 Overview
                 New Normal
                “Center of Life”

                                                     Apple Store @ CentralwOrld                  Farewell Isetan & welcome new tenants

 UPDATES

              New Destinations &
                 Attractions

                                                  New residential project launches                  Progressing with landmark projects
                                     Chiangrai                      Bangna                Dusit Central Park             Rama 2
APPENDICES

             Building on Mixed-use
                  Development
       12
COVID-19 Timeline and Mall Operational Updates
Adaptation of “New Normal” lifestyles help boosting better-than-expected recovery
Pre-Outbreak Period Outbreak & Lockdown Easing and Control Recovery and Rebuild
Traffic
Company
Overview
85 – 20 – 40 – 60 – 85-
87-92%
95% 30% 60% 85% 90%
UPDATES
January - February March - mid May 2H May June-July Aug-Sep rest of 2020
APPENDICES 1H20 (incl. lockdown period) 3Q20 Rest of the year
% Average rental
discount to tenants 30-50%
Below 30% Circumstantial
100% (during closure period)
Note: % of normal levels, figures as of November 30, 2020
13Sustained occupancy rate post-lockdown
Nearly every tenant have re-opened and area fit-out for new brands are underway
Actual vs. Contracted Occupancy Rate during and post-lockdown
Includes area under Central Pattana and CPNREIT
Closure Period
93% 93% 92% 92% 92% 92% 92% 92% 92% 92% 91% 92% 92%
Company Businesses operate as normal as
Overview 90%
80%
tenant sales improve with
Majority of tenants
ready to resume increasing confidence
Contracted businesses
Actual
UPDATES
10% 12% 12% Continue to utilize additional
service and communication
channels (online + offline)
Jan Feb Mar Mar Apr May May Jun Jul Aug Sep Oct Nov
(closure) (re-op)
Avg. 1Q20 Avg. 2Q20 Avg. 3Q20
APPENDICES
Contracted
Occ. Rate 92% 92% 92% Support provided to tenants with
ample flexibility in contract
Actual
Occ. Rate 85% 50% 92% renewal terms and conditions
14Residential Development Pipeline
Solid backlog and strong project line-up and demand begins to recover
Launched in 1H20 New residential project launches in 3Q/4Q 2020
ESCENT TOWN NIRATI Format: Single-detached House
PHITSANULOK CHIANGRAI
Price Range: 4 - 9 MTHB/unit
Total Units: 183 (all phases)
Company Total Value: ~1,000 MTHB
Overview
Open for Sale: October 2020
Nearest mall: Central Chiangrai (4 km)
NINYA Format: Single-detached House
NIRATI
KALLAPAPRUEK
BANGNA Price Range: 6 – 10 MTHB/unit
Total Units: 156 (all phases)
Total Value: ~1,100 MTHB
UPDATES Open for Sale: November 2020
Nearest mall: Central Village (12 km)
Backlog and expected transfers in 2020
APPENDICES
1.0 0.8 0.1-0.2 1.8-2.0
bn THB bn THB bn THB bn THB
transferred in backlog to new demand for new and expected transfers in
9M20 transfer in existing projects 2020
4Q20
15 * Distance between residential project and the closest shopping mall is within a 5-km radiusUpdate on Investment Plan
2020 CAPEX reduction in motion with little impact to long-term growth momentum
More than 10 bn THB CAPEX to be reduced Abundance of future project pipeline with ample
and deferred to subsequent years flexibility to maintain long-term growth
Unit: bn THB Unit: mn. sq.m. NLA
~2.4
Company
Overview
>50% 1.8
Reduction 23 - 26
22.3
>30% increase in
Retail NLA
(5.5% CAGR)
13.1 2020 2024
< 11.0
UPDATES Announced projects are proceeding as scheduled
< 7.0 New Projects No. of New Projects up to 2024 (Revised)
2.1
Original Plan Latest Update
AEI
7.1 < 2.0 Retail 15 - 17 12 – 14
Residential (incl. Intl’)
< 2.0 Hotel & Others
APPENDICES Offices 2 1–2
2020 2020 2021-2024
Original Revised Approximated Hotels 10 5–6
(per year)
Residential >30 15 - 20
16 Note: Information based on the Company’s latest projection and are subject to change upon the development of external situationsOn track to meet 2020 full-year guidance
Revenue recovery momentum and cost reduction initiatives to sustain going forward
Performance Recap and Outlook for 2020 Near/Medium Term Outlook
% change vs. 2019 9M20 FY20 Embrace the New Normal
except for margins Actual Guidance - Continue safety and hygiene measures
Company
Overview - Accelerate online engagement & services
- Strengthen offline value proposition to customers
Total Revenue -28% -25% to -20% and deliver unique O2O experience
Maintain operating efficiencies
Rental & Services
Revenue -27% -25% to -20% - Sustain cost saving initiatives without compromising
quality of services
(~88% of revenue) - Adopt new technology and digitized services to
improve customer experience
Rental & Services
UPDATES
39% 38% to 42%
Gross Profit Margin Keep pace with long-term growth plan
- Progress on development of new projects and asset
SG&A to Revenue enhancement initiatives
18.5% 18% to 19% - Prudent review of new project funnel to capitalize
Ratio on demand recovery in the horizon
Collaborate & co-create with partners
APPENDICES
EBITDA Margin 54% >50%
- Explore new business opportunities to support
growth foundation of core business
- Engage with stakeholders and communities to
develop and grow hand-in-hand
Note: Excludes non-recurring items and TFRS impact
17 Information based on the Company’s latest projection and are subject to change upon the development of external situationsThank you for your kind attention!
For more information, please contact:
Investor Relations Department
Central Pattana Public Company Limited
Central Pattana Public +662 667 5555
Company Limited ext. 1614, 1632 or 1688
31st Fl, the Offices at
CentralWorld Facsimile: +662 264 5593
999-9 Rama I Rd., Patumwan
District
Bangkok 10330
Thailand
@ http://www.centralpattana.co.th ir@centralpattana.co.th
18Appendices: 3Q20 & 9M20 Financial Performance
3Q20 & 9M20 Financial Performance
             Revenues and profits have recovered as the situation continues to improve domestically

                                                                                                                                                    Key Highlights

                                           34                             1.8                              92      %
                                                                                                                                             Total revenue was revamp
                                                                                                                                             QoQ majority from rental &
 Company                                                                                                                                     services business due to a
 Overview                                                                                                                                    lower rent discount provided
                                                                                                                                             in-line with traffic and tenant’s
                                                                                                                                             sales performance recovery.
                                                  Key Financial Performance and Ratios***
                                                                                                                                             Food center services revenue
             Unit: THB m n                   3Q19        2Q20         3Q20         YoY%        QoQ%              9M19     9M20     YoY%      also recovered QoQ after fully
                                                                                                                                             operated.
             Total Rev enue                    9,413        3,613        7,440      -21.0% 105.9%                27,285   19,623   -28.1%    Hotel revenue has returned
 UPDATES     Gross Profit                      4,531          162        3,216      -29.0% 1885.5%               13,261    7,314   -44.8%    after lockdown.
             Operating Profit                  3,259         -698        2,365      -27.4% 438.9%                 9,560    4,627   -51.6%    Residential     revenue      was
                                                                                                                                             performed in-line with target
             Net Profit                        2,816         -611        1,973      -29.9% 423.0%                 8,154    3,864   -52.6%    from unit transferred of existing
             EPS (THB/share)                    0.63        -0.14         0.44        -0.19    0.58                1.82     0.86     -0.95   project and new project
                                                                                                                                             launched.

             Gross Profit Margin              49.8%         4.7%        44.9%        -4.9%        40.2%          50.3%    38.9%    -11.4%    The Company continues to
             EBI TDA Margin                   52.0%        32.8%        59.0%         7.0%        26.2%          52.4%    53.6%      1.2%    implement an effective cost
                                                                                                                                             management and prudent
APPENDICES   SG&A to Rev enue                 17.4%        29.9%        15.6%        -1.7%       -14.3%          17.5%    18.5%      1.0%    cost control measures to
             Net D/E Ratio                     0.45x        0.55x        0.53x      +0.08x        -0.03x          0.45x    0.53x   +0.08x    maintain     its  profitability
                                                                                                                                             throughout the year.
             *     Central Phuket, which includes the Floresta and Festival buildings, is counted as 1 project
             **    Includes area transferred to CPNREIT and CPNCG
             ***   Excludes non-recurring items and impact from TFRS16
       20
3Q20 reconciliation from F/S to core performance
3Q20 Profit & Loss Statement reconciliation between F/S and core performance
Core
performance
Adj. non- Excl. non- TFRS16
Unit: MTHB Per F/S (excl. non-
recurring recurring Impact
Company recurring and
Overview
TFRS16)
Revenue from rental and services 6,792 6,792 (159) 6,633
Revenue from other businesses 526 526 526
Other Income 281 281 281
Total income 7,599 0 7,599 (159) 7,440
Cost of rental & services 3,354 3,354 234 3,588
UPDATES
Cost of other businesses 355 355 355
Administrative expenses 1,044 119 1,163 1,163
Operating profit (loss) 2,847 (119) 2,728 (393) 2,335
(+)Share of profit from invested co. 187 187 187
(+)Investment income 351 351 (321) 30
(-)Interest expense 436 436 (294) 142
(-)Income tax expense 448 448 (32) 416
APPENDICES (-)Minority interest 20 20 20
Net profit to parent company 2,481 (119) 2,362 (388) 1,973
Please see explanation to the non-recurring items and the impact of TFRS16 on the Management Discussion & Analysis for the financial performance of the current period
as announced on the Stock Exchange of Thailand
219M20 reconciliation from F/S to core performance
9M20 Profit & Loss Statement reconciliation between F/S and core performance
Core
performance
Adj. non- Excl. non- TFRS16
Unit: MTHB Per F/S (excl. non-
recurring recurring Impact
Company recurring and
Overview
TFRS16)
Revenue from rental and services 18,201 18,201 (998) 17,203
Revenue from other businesses 1,595 1,595 1,595
Other Income 3,957 (3,132) 825 825
Total income 23,753 (3,132) 20,621 (998) 19,623
Cost of rental & services 9,748 9,748 683 10,431
UPDATES
Cost of other businesses 1,054 1,054 1,054
Administrative expenses 3,972 (347) 3,625 3,625
Operating profit 8,979 (2,785) 6,194 (1,681) 4,513
(+)Share of profit from invested co. 872 (270) 602 602
(+)Investment income 756 756 (642) 114
(-)Interest expense 1,407 1,407 (882) 525
(-)Income tax expense 1,645 (621) 1,024 (200) 824
APPENDICES (-)Minority interest 16 16 16
Net profit to parent company 7,540 (2,434) 5,106 (1,241) 3,864
Please see explanation to the non-recurring items and the impact of TFRS16 on the Management Discussion & Analysis for the financial performance of the current period
as announced on the Stock Exchange of Thailand
22TFRS16 impact on rental revenue
➢ Upon the adoption of TFRS16, rental revenue and discount whose contract value can be reasonably estimated is
recognized on a straight-line basis (comparison of before and after TFRS16 adoption illustrated below)
➢ In the early periods of the contract, rental revenue would be higher than the actual revenue as it includes the future rate
increases. Towards the end of the period, the positions become inverted
➢ Upon contract renewal, rental revenue will be recognized on a straight-line based on the total value of the renewed
Company
Overview
contract (including all future rate increases)
➢ Applies to tenants with >1-year rental contracts (i.e., excludes temp. contracts, consignment for amounts above min.
guarantee, services and utilities income)
➢ Discount amortization may vary based on the best estimated amount provided to tenants at a certain point in time
Recognition of rental revenue per tenant Discount amortization impact per tenant
Reversion based on
Discount amount given at each period
UPDATES
new contract terms Before Amount based on
estimated total
discount throughout
Straight-line recognition the contract period
of contract value
After
Reversion
Before upon renewal End of contract
After
APPENDICES Annual
escalation
First contract period Contract Renewed period
Renewal Period of which discounts are given
23Cost performance achieved as planned
Saving measures carried out to minimize impact to profitability
Operating cost performance for the period
Fixed Costs
unit: BN THB 20%
Company YoY
Overview 12.3
Fixed Cost
Variable Cost Personnel Op. Leases Outsourced
9.8 Whilst overhead costs (e.g., headcount, committed
expenditures) are maintained, certain aspects of costs
49% are reduced (e.g., OT, travel) or optimized for further
cost efficiencies (e.g., contracted services)
21%
YoY
UPDATES
54% 12% YoY
Variable Costs
4.2
3.3
49% 15% YoY 51%
53% 46% 28% YoY Utilities Marketing Administrative
51% 47% 26% YoY
APPENDICES Although 3Q20 sees a QoQ increase in variable costs as
the situation recovers, efficiency measures have been
3Q19 3Q20 9M19 9M20 continuously enacted, resulting in a considerably lower
cost base compared to the previous year
24 Note: Total operating costs excludes D&A, cost of non-core businesses (food center, hotel, residential) and financing costsCPN’s Asset Performance Summary
Occupancy rates sustained for all malls
Land NLA(1)(2) (mn sqm) Occupancy Rate(1)
No. of
Retail Properties Freehold & Department
Projects Freehold Leasehold Retail Total 3Q19 2Q20 3Q20
Leasehold Store
BMA 15 5 7 3 0.72 0.06 0.79 93% 93% 93%
Company
Overview
Provinces 18 12 4 2 0.67 0.06 0.73 90% 90% 90%
Thailand 33 17 11 5 1.39 0.12 1.51 92% 91% 91%
Overseas 1 1 0.08 0.00 0.08 74% 83% 84%
(1)
Total 34 18 11 5 1.48 0.12 1.59 91% 91% 91%
UPDATES
NLA split by region Rent revenue split by region
Overseas,
5% Overseas, 2%
BMA, Provinces,
Provinces BMA,
49% 41%
, 46% 57%
No. of Occupancy Rate (1) (%)
Non-core Properties NLA (sqm)
Projects 3Q19 2Q20 3Q20
APPENDICES
(1)(2)
Office in BMA 8 138,110 94% 90% 91%
Residential for Rent in BMA 1 1,568 27% 21% 22%
Hotel in prov incial area 2 561 rooms 81% 0% 23%
(1) Counts Central Phuket (Floresta + Festival) as one project ; Excludes area transferred to CPNREIT, CPNCG and area under GLAND
25 (2) Excludes rental agreements < 1 year, such as kiosk, carts, ATMs and coin machines.CPN’s Financial Performance
Revenues and profits have gradually recovered since the lockdown measures in 1H20
Total Revenue Operating Profit Normalized (LHS) and Net (RHS) Profit
MTHB MTHB MTHB
38,104
34,949 Normalized Net profit Net profit
13,497
29,234 30,875 12,486 13,568
27,285 10,814 11,314
11,216 11,738
Company 9,560 10,990 11,621
Overview 19,623 9,244 9,244 9,893
8,154
8,068 7,540
4,627
3,864
2016 2017 2018 2019 9M19 9M20 2016 2017 2018 2019 9M19 9M20 2016 2017 2018 2019 9M19 9M20
% YoY Growth 2016 2017 2018 2019 9M19/3 9M20/3
UPDATES Total revenues (Exc. non-recurring items) /1 14% 6% 13% 9% 5% (28%)
Operating profit (Exc. non-recurring items) 19% 5% 10% 8% (2%) (52%)
Normalized Net profit 19% 7% 11% 6% (4%) (53%)
Net profit 17% 47% (17%) 3% (7%) (7%)
Same store revenue growth 2% 4% 3% 3.4% 3.2%/2 (29%)
GP Margin (Exc. Other Income and non-recurring)(%) 49% 50% 51% 51% 50% 39%
APPENDICES
APPENDICES EBITDA Margin (Exc. non-recurring items) (%) 54% 54% 52% 54% 52% 55%
/1 Includes rental & services, hotel operation, food & beverages, real estate sales and other income. Excludes interest income and share of profit from joint
ventures and associated companies
/2 Excludes Central i-City, Central Village, CentralwOrld, CentralPlaza Lardprao, CentralPlaza Chonburi, CentralPlaza Chiangrai, Central Phuket Festival,
CentralFestival Pattaya Beach, CentralFestival Chiangmai and CentralPlaza Rama2.
/3 Excludes non-recurring items and adoption of TFRS 16 sine January 1, 2020, cost of rental and services , interest expenses for the current periods have been
26 adjusted to better reflect the normal business operation.Total Revenue & Cost of operation
Total revenue Total cost of operations
(THB mn) (THB mn)
20,000
50,000 45,000 18,087
16,463
Company 40,000
Overview 38,104 14,041 14,518
40,000 34,949 35,000 15,000
30,875 30,000
29,234
30,000
-21.0% YoY
25,000 10,000 -12.9% YoY
20,000
20,000
9,413
15,000 4,525
5,000 3,942
7,440 10,000
10,000
5,000
0 0 0
UPDATES
2016 2017 2018 2019 3Q19 3Q20 2016 2017 2018 2019 3Q19 3Q20
3Q20 Breakdown 3Q20 Breakdown
Office 5%
F&B 2%
Hotel 0%
Office 2%
Retail 84% Retail 89%
F&B 2%
Management Hotel 1%
APPENDICES
fee 2%
Other Residential
income 2% 6%
Residential 5%
Note: Includes revenues from residential projects and water & amusement park, property management fees from CPNREIT & CPNCG and other income.
27 Excludes non-recurring items and adoption of TFRS16 since January 1, 2020 to better reflect the normal business operation.Selling and Administrative (SG&A) Expenses
Prudent cost control measures during lockdown
(THB mn) 3Q20 SG&A expenses /1 -29.0 % YoY , a decrease is mainly
attributed from:
8,000
6,708 • Lower marketing & promotion expenses regarding to
6,114 marketing activities deceleration compare to the normal
6,000 situation which strictly control and minimizing risk of
Company 5,066
4,406
COVID-19 outbreak.
Overview
• A decrease in rental expense incurred to CPNREIT for the
4,000 -29.0% YoY
sublet of Hilton Pattaya.
• The Company demonstrated prudent cost control
2,000 1,637 measures to be in-line with a decrease in revenue to
1,163
retain business normalcy.
0
2016 2017 2018 2019 3Q19 3Q20 Closely monitor on business operations
To combat the COVID-19 situation, the Company
UPDATES implemented various cost control initiatives to mitigate the
3Q20 Breakdown impact on revenue and profitability through various cost
reduction initiatives.
Advertising & Reductions in general administrative expenses, such as
Promotion 11% certain outsourced services and excessive administrative
costs at both business and head office levels have been
identified based on the lower scalability of business
Personnel
operations and employee reallocation plan.
55%
Depreciation
APPENDICES 15%
Others 15% Rental
Expense to
REIT 5%
Note: /1 Excludes non-recurring items
283Q20 Rent & services Business
Rental & services Business performance Key Highlights
Rental & services income
3Q20 Rent and services/1 -17.1% YoY, a decrease is mainly attributed
29,026 31,843 from:
Company 25,247 26,057 -17.1% YoY
Overview • Rent discount to tenants at appropriate levels and on a case-by-
8,005 case basis.
6,633
• The Company deferred certain events and marketing activities
during the period. Hence, revenue derived from marketing
2016 2017 2018 2019 3Q19 3Q20 activities slightly declined.
Cost of rental & services 3Q20 Cost of rent and services/2 -10.7% YoY, a decrease is mainly
attributed from:
14,142 15,481 -10.7% YoY
UPDATES 12,630 12,894 • Lower utility cost from the Company’s cost-effective
management and continuous effort to conserve energy and
4,019 3,588 utilities in operations.
3Q20 Gross Profit Margin -3.9% YoY from:
2016 2017 2018 2019 3Q19 3Q20 • A decrease in revenue proportion higher than a decrease in cost
a decrease in cost after mall fully re-operated.
%GPM Rental & Services • Nevertheless, the Company continues to implement effective
-3.9% YoY and cost management and prudent cost control measures to
50.5% 51.3% 51.4% maintain its profitability and ongoing to recover.
50.0% 49.8%
APPENDICES
APPENDICES 45.9%
2016 2017 2018 2019 3Q19 3Q20
Note: /1 Includes revenues from water & amusement park and offices.
29 /2 Higher cost of rental and services excludes the effects of TFRS16 adoption in 20203Q20 Food center services Business
Food center services Business performance Key Highlights
Food center services income
3Q20 Food center services /1 -41.7% YoY, a decrease is mainly
1,631 attributed from:
Company 1,389 -41.7% YoY
Overview
851 • Lower revenue from food center services due to COVID-19
733 impact however, the performance recovered QoQ due to mall
209 122 fully reoperates with an improvement on traffic.
2016 2017 2018 2019 3Q19 3Q20 3Q20 Cost of food center services /1 -24.4% YoY, a decrease is mainly
attributed from:
Cost of food center services • Effective cost management in line with revenue performance
1,281 which has not yet returned to normal level.
1,086
UPDATES -24.4% YoY
394 3Q20 Gross Profit Margin /1 -14.2% YoY from:
332
100 76 • A decrease in revenue proportion higher than a decrease in
cost.
2016 2017 2018 2019 3Q19 3Q20
%GPM Food center services
54.7% 53.7% 52.1% -14.2% YoY
APPENDICES
21.9% 21.4%
37.9%
Note: /1 Changed from “Revenue from food and beverages sales” and “cost of food and
2016 2017 2018 2019 3Q19 3Q20 beverages” due to the adoption of TFRS 15 from January 1, 2019 onwards to better
reflect the nature of business of food center services, including the comparative year
in 2018. Hence, gross profit margin for the food center business is reflective of the new
30 financial reporting standard from 2018 onwards.3Q20 Hotel Business
Hotel Business performance Key Highlights
Hotel Income
The Company adopted a new hotel revenue and cost recognition
1,097 1,208 1,121
998 from 2019 onwards in which net revenue from services was reported
Company -88.8% YoY
Overview as gross revenue and cost on cash basis, resulting an increase both
274 in revenue and cost items.
31 3Q20 Hotel operations -88.8% /1 YoY, a decrease is mainly attributed
from:
2016 2017 2018 2019 3Q19 3Q20 • Lower tourists from COVID-19 outbreak globally since the
beginning of the year and temporary closed with early
Cost of hotel accelerate the renovation of Hilton Pattaya Hotel.
• However, Centara Hotel & Convention Center Udonthani has re-
423 379 -75.8% YoY opened at the beginning of 3Q20 with occupancy rate
UPDATES 325 344
improvement.
94
23
3Q20 Cost of hotel operations -75.8% YoY , a decrease is mainly
2016 2017 2018 2019 3Q19 3Q20 attributed from:
• Both hotels showed an effective cost control conform the
changing situation as well as Hilton Pattaya Hotel cease of
%GPM Hotel operation during renovation.
-40.3% YoY
67.4% 68.7% 65.0% 66.2% 65.5%
APPENDICES 3Q20 Gross Profit Margin -40.3% YoY , a decrease is mainly attributed
25.1% from:
• A gradual recovery of occupancy rate and the absence of
revenue from hotel operations during renovation.
2016 2017 2018 2019 3Q19 3Q20
Note: /1 Excludes non-recurring items.
313Q20 Residential Business
Residential Business performance Key Highlights
Residential sales
3Q20 Real estate sales -37.9% /1 YoY , a decrease is mainly attributed
Company 2,762 2,904 -37.9% YoY from:
Overview • Lower transferred during 3Q20 if compare to the same period of
the previous year with higher transfer records. Nevertheless, there
602 374 were a continuity of transfers of condominium units, namely
ESCENT Nakhon Ratchasima, Phyll Pahol 34, ESCENT
2016 2017 2018 2019 3Q19 3Q20 Ubonratchathani, ESCENT PARK VILLE Chiangmai and Belle
Grand Rama 9 as well as the newly launched in 1Q20 namely
Cost of residential sales ESCENT TOWN PHITSANULOK and NINYA KALLAPAPRUEK. Hence,
1,833 the residential transfers met the Company’s target.
1,565
-25.8% YoY
UPDATES
3Q20 Cost of real estate sales -25.8% YoY , a decrease is mainly
345 256 attributed from:
• Consistent with revenue performance and the Company
effectively manage cost as well as cost adjustment to the Belle
2016 2017 2018 2019 3Q19 3Q20
Grand Rama 9 to accurately reflect the project’s cost of sale.
-11.2% YoY
%GPM Residential sales 3Q20 Gross Profit Margin -11.2% YoY mainly attributed from:
• A newly transferred projects in the current year.
43.3% 42.7%
APPENDICES
36.9% 31.5%
APPENDICES
2016 2017 2018 2019 3Q19 3Q20 Note: /1 Excludes non-recurring items.
32Debt Analysis
Lower cost of debt achieved despite higher debt principal
Financing cost and average cost of debt 3Q20 Debt Breakdown
(mn Baht) Long-term Short-term
loan loan
Company 900 6% 31% 36%
Overview 811
800 +95% YoY 5%
700 633 -36% YoY (ex. TFRS16)
600 3.27% 4%
509
490
500 426 2.96% 436
364
3.47% 293 3% Long-term
400 3.23% 3.08% 294 Short-term
2.81% bond bond
300 2.29% 2% 24%
UPDATES 2.13% 9%
200 224
197 1%
100 142
Fixed
0 0% 35%
2015 2016 2017 2018 2019 3Q19 2Q20 3Q20
Floating
Interest expenses recorded under TFRS 16 Interest expenses 65%
RS: Weighted average cost of debt
➢ Corporate credit
AA Stable
APPENDICES ➢ Senior unsecured
debenture
Credit Rating Rating Outlook
Note: Weighted average interest rate was derived from interest expenses including interest capitalization for projects under development.
Financing cost includes the impact of TFRS16 adoption amounting 294 MTHB in 3Q20
33 All borrowings at denominated in THB. Includes consolidation of GLAND’s debt at THB 5,281 mnCapital Structure
Higher net D/E stable at comfortable level
CPN’s net D/E ratios are historically below its debt covenant of 1.75x
(mn Baht) (Times)
Company
Overview 90,000 0.70
80,462
80,000 75,292 74,632
74,176 72,302 0.60
70,000
63,880
0.55 0.50
60,000 0.53
0.39 53,005 0.37 0.37
0.37 47,934 0.40
50,000
43,791
UPDATES 40,000 46,801
0.28 41,942 0.30
33,210
30,000 30,398
22,623 0.20
0.07
20,000 17,904 13,996
9,529 8,478 0.10
10,000 4,326 4,347
3,204 5,361 3,067 3,055
0 0.00
2015 2016 2017 2018 2019 1Q20 2Q20 3Q20
APPENDICES
Cash & current investment Interest bearing debts Equity RS: Net D/E
Noted: Excludes lease liabilities arising from financial leases recorded under TFRS16
34Appendices: Other Corporate Information
Central Pattana “CPN” Shares Trading Statistics
             As of December 30, 2020

                                         Ownership Structure                                         Top ten shareholders                             % own
                                                                                                     Central Holding Co. Ltd.                          26.21
                                        Other
                                        18%                                                          Thai NVDR Co. Ltd.                                 6.00
                                                                                                     Social Security Office, Thailand                   2.74
 Company                                      % ownership in CPN
 Overview                                      by investor group
                                                                                                     SOUTH EAST ASIA UK (TYPE C) NOMINEES               2.44
                                                     out of                                          STATE STREET EUROPE LIMITED                        1.81

                                              4,470
                                                                     Central
                                                                                                     BBHISL NOMINEES LIMITED                            1.76
                                                                     Group*
                                                                      53%                            Niti Osathanugrah                                  1.72
                                                    million                                          UBS AG SINGAPORE BRANCH                            1.37
                                 Foreign         total shares
                               Institutions                                                          THE BANK OF NEW YORK MELLON                        1.37
                                   29%                                                               BANK OF SINGAPORE LIMITED-THB SEG AC               1.29
 UPDATES

                                                                                                     Key Trading Statistics as of December 30, 2020
              Dividend History                                                                       Key Metrics                                        THB
             Key Metrics                          2019     2018    2017    2016      2015    2014    Par Value                                           0.5
             Par Value (THB)                         0.5     0.5     0.5       0.5     0.5     0.5   Share Price (THB)                                 47.75
             Div idend (THB/Share)                   0.8     1.1     1.4    0.83       0.7    0.65   LTM EPS diluted (THB)                               2.5
                                                                                                     P/E (x)                                           19.04
APPENDICES   Div idend Paid (THB mn)               3,576   4,937   6,283   3,725     3,142   2,917
                                                                                                     P/BV (x)                                           3.22
             Div idend Payout Ratio               30.5%     44%     46%     40%       40%     40%    Div idend Yield (%)                               1.68%

             Dividend policy: paid annually approximately 40% of net profit                          Market Capitalization (THB bn)                   214.30

             (unless there is compelling reason against this).                                       Authorized Share Capital (mn shares)              4,488
       36
CPNREIT and CPNCG
Asset performance summary
On December 1, 2017, CPNRF was converted into CPNREIT, which also leased additional assets in CentralFestival Pattaya Beach and Hilton
Pattaya. At the end of 4Q17, CPNREIT has five retail properties and two office towers in its portfolio, with CPN REIT Management Co., Ltd., as
the REIT manager and CPN as the property manager.
CPNREIT additionally invested in The Ninth Towers Office Building on March 1, 2020 and in Unilever House Office Building Project on March 2,
Company
2020.
Overview
CPNCG was established in September 2012 and currently owns one office with SCB Asset Management Co., Ltd. as the fund manager and
Central Pattana as the property manager.
Remaining Life Leasable Area Occupancy Rate 1 (%) Chiangmai Airport
CPNREIT - Project
(years) (sq.m.) 3Q19 2Q20 3Q20
CentralPlaza Rama 3 74 Yr & 10 M 36,495 96 97 96
CentralPlaza Rama 2 34 Yr & 10 M 82,566 96 94 94
CentralPlaza Pinklao 4 Yr & 3 M 27,656 99 99 99
UPDATES
CentralPlaza Chiangmai Airport 26 Yr & 7 M 38,060 94 94 95
Rama 2
CentralFestival Pattaya Beach 16 Yr & 10 M 29,388 98 97 95
Pinklao Office Tower A 4 Yr & 3 M 22,762 87 84 82
Pinklao Office Tower B 4 Yr & 3 M 11,627 94 91 94
2
The Ninth Towers 26 Yr & 10 M 59,322 n/a 89 84
2
Unilever House 14 Yr & 6 M 18,527 n/a 100 100 The Ninth Towers
Total/Average 326,403 95 94 93
Hilton Pattaya 3 16 Yr & 10 M 302 rooms 89 n/a n/a
APPENDICES Remaining Life Leasable Area Occupancy Rate 1 (%)
CPNCG - Project Pattaya Beach
(years) (sq.m.) 3Q19 2Q20 3Q20
The Offices at centralwOrld 13 Yr 81,672 99 99 98
Remarks: /1 quarterly average occupancy rate
Unilever House
/2 including contract extension with CPN on 31 Mar 2020
/3 Hotel was temporary closed since April 1, 2020 for renovation purpose.
Note: Includes rental agreements < 1 year such as kiosk, carts, ATMs and coin machines and CPN acts as the property manager.
37 Percentage based on leasable area.Property Development Portfolio (1/2)
Retail and mixed-use properties in BMA
Transferred to Other developed or managed projects in
CPNREIT same area by CPN
Retail Property Name Open Land Invest. NLA % of Lease Food Office Hotel Resid. Conv. Hall
(Expire) (MTHB) (sqm) area expire Center
Company CentraPlaza Lardprao 1982 L(2028) 4,509 45,518 ✓ ✓
Overview
CentralPlaza Ramindra 1993 L(2023) 664 17,125
CentralPlaza Pinklao 1995 L(2027) 3,045 63,189 42% 2027 ✓ ✓
CentralPlaza Rama 3 1997 F 2,035 54,354 81% 2045 ✓
CentralPlaza Bangna /A 2001 F 5,782 64,163 ✓ ✓ ✓
CentralPlaza Rama 2 2002 L(2055) 9,121 91,835 96% 2025 ✓ ✓
CentralWorld /A 2002 L(2040) 14,350 196,674 ✓ ✓
UPDATES CentralPlaza Rattanathibet /A 2003 F&L 2,368 76,917 ✓
(2034)
CentralPlaza Chaengwattana 2008 F 5,409 65,476 ✓ ✓ ✓
CentralPlaza Grand Rama 9 2011 L(2040) 5,172 59,085 ✓
CentralPlaza Salaya 2014 F&L 2,609 38,738 ✓
(2044)
CentralPlaza WestGate 2015 L(2043) 7,052 78,657 ✓ ✓
CentralFestival EastVille 2015 F&L 3,880 36,049 ✓
(2045)
APPENDICES
CentralPlaza Mahachai 2017 F 2,803 24,363 ✓
Central Village 2019 F 2,583 19,987 ✓
Source: CPN Annual Report 2018 ; Information as of December 31, 2018
/A = acquired projects
Land: F = Freehold, L = Leasehold, F&L = both ; Investment of each project is reported at cost
38 Net leasable area (NLA) excludes area invested by joint developer and convention hallProperty Development Portfolio (2/2)
Retail and mixed-use properties in provinces
Transferred to CPNREIT Other developed or managed projects in same area by CPN
Retail Property Name Open Land Invest. NLA % of Lease Food Office Hotel Resid. Conv. Hall
(Expire) (MTHB) (sqm) area expire Center
CentralMarina 1995 L(2035) 1,442 16,536 ✓
Company
Overview CentralPlaza Chiangmai Airport /A 1996 F 2,421 76,622 49% 2044 ✓ ✓
CentralFestival Pattaya Beach 2009 F&L 4,500 57,469 50% 2037 ✓ ✓
(2038)
CentralPlaza Udonthani /A 2009 F 4,614 71,796 ✓ ✓ ✓
CentralPlaza Chonburi 2009 F&L 3,131 39,128 ✓
(2027)
CentralPlaza Khonkaen 2009 F 3,951 47,267 ✓ ✓ ✓
CentralPlaza Chiangrai 2011 F 2,016 26,252 ✓ ✓
UPDATES
CentralPlaza Phitsanulok 2011 F 1,590 26,474 ✓
CentralPlaza Suratthani 2012 F 2,245 31,022 ✓ ✓
CentralPlaza Lampang 2012 L(2041) 1,145 19,709 ✓
CentralPlaza Ubonratchathani 2013 F 1,835 29,144 ✓
CentralFestival Chiangmai 2013 F 4,300 68,028 ✓ ✓
CentralFestival Hatyai 2013 F 4,917 66,801 ✓ ✓
CentralFestival Samui 2014 L(2043) 1,875 31,647 ✓
APPENDICES CentralPlaza Rayong 2015 F 2,685 29,466 ✓ ✓ ✓
Central Phuket
- Festival /A 2015 L(2056) 8,152 47,547 ✓
- Floresta 2018 L(2056) 5,499 35,012 ✓
CentralPlaza Nakhon Si Thamm. 2016 F 1,833 21,343 ✓
39 CentralPlaza Nakhon Ratchasima 2017 F 4,560 48,971 ✓ ✓ ✓You can also read