Delivered Wholesale Gas Price Outlook 2020-2050 - Residential & Commercial and Gas Generation Segments - AEMO
←
→
Page content transcription
If your browser does not render page correctly, please read the page content below
Delivered Wholesale Gas Price Outlook 2020-2050
Residential & Commercial and Gas Generation Segments

Eastern Australia, Western Australia and Northern Territory

December 2019

Core Energy Group © 2015               August 2015            i
Wholesale Gas Price Outlook 2020-2050 | Eastern, Western & Northern Australia                                                                                                            Table of Contents

Table of Contents
1.            Introduction .................................................................................................................................................................................. 5

2.            Executive Summary...................................................................................................................................................................... 6

3.            Validation of prior year projections ........................................................................................................................................... 13

4.            Methodology ............................................................................................................................................................................... 14

5.            Key Risks, Uncertainties and Key Assumptions ..................................................................................................................... 20

6.            Delivered Wholesale Price Projections ...................................................................................................................................... 21

Terms of Use .............................................................................................................................................................................................. 32

Core Energy & Resources Pty Limited                                                            December 2019                                                                                                 ii
Wholesale Gas Price Outlook 2020-2050 | Eastern, Western & Northern Australia       General Definitions

General Definitions

Acronyms

  AEMO                   Australian Energy Market Operator
  AUD                    Australian dollars
  bbl                    Barrel
  CBJV                   Cooper Basin Joint Venture
  CCGT                   Combined Cycle Gas Turbine
  CORE                   Core Energy & Resources Pty Limited
  CPI                    Consumer Price Index
  CSG                    Coal Seam Gas
  EGP                    Eastern Gas Pipeline
  EIA                    U.S. Energy Information Administration
                         U.S. Energy Information Administration (Long-Term)
  EIA LTEO
                         International Energy Outlook
                         U.S. Energy Information Administration Short-Term Energy
  EIA STEO
                         Outlook
  GBJV                   Gippsland Basin Joint Venture
  GJ                     Gigajoule
  GPG                    Gas Powered Generation
  I                      Industrial
  LMP                    Longford Melbourne Pipeline
  LNG                    Liquefied Natural Gas
  MAP                    Moomba Adelaide Pipeline
  MDQ                    Maximum Daily Quantity
  MSP                    Moomba Sydney Pipeline
  NEM                    National Electricity Market
  NGFR                   National Gas Forecasting Report
  NSW                    New South Wales
  NVI                    NSW Victoria Interconnect
  OCGT                   Open Cycle Gas Turbine                                              iii
  QGP                    Queensland Gas Pipeline

  QLD                    Queensland

  R&C                    Residential and Commercial
  RBP                    Roma Brisbane Pipeline
  SA                     South Australia
  SEA Gas                South East Australian Gas Pipeline
  SWP                    South West Pipeline
  SWQP                   South West Queensland Pipeline

  TAS                    Tasmania
  TGP                    Tasmania Gas Pipeline
  TIPS                   Torrens Island Power Station

Core Energy & Resources Pty Limited                                December 2019                     iii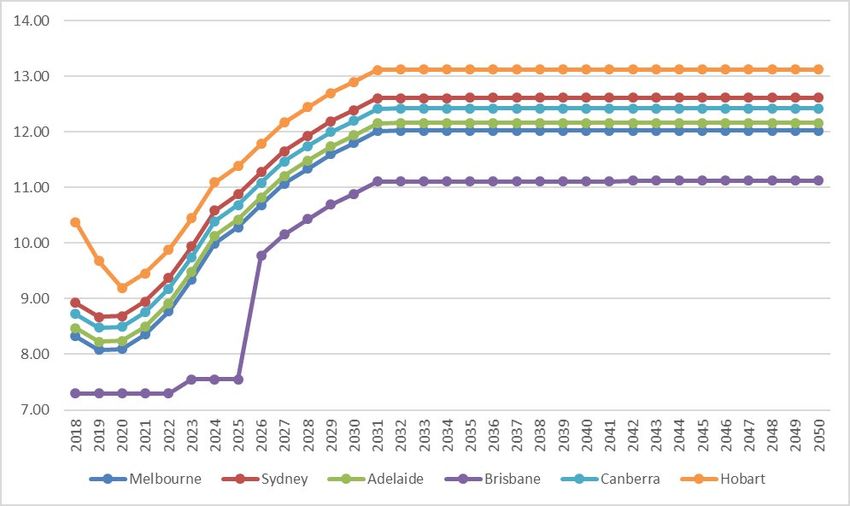
Wholesale Gas Price Outlook 2020-2050 | Eastern, Western & Northern Australia                                                  General Definitions

  USD                    US dollars

  VIC                    Victoria

  WA                     Western Australia

Report Convention

                                      This Report has been prepared by Core Energy & Resources Pty Limited, referred to as ‘CORE’.
  Author

                                      All references to years that appear in the report are to calendar years.
  Year References

                                      All references to $ are to Australian dollars unless otherwise stated, and values are expressed in
  $ value references                  real July 2019 terms.

                                      Delivered prices are at exit flange/metering point of a transmission pipeline system
  Delivery points

Frequently Used Terms

  Delivered Price                     The price of gas at the delivery point on a transmission pipeline to a generator or gas distribution
                                      offtake point. Note that all prices are quoted in real July 2019 terms.

  Gas Powered                         A gas market demand segment that comprises gas-fired power stations. Gas is delivered via
  Generation (GPG)
                                      transmission pipeline before being combusted to drive a gas turbine to generate electricity.

  ICE Brent                           An oil price marker widely used, internationally, to establish the exchange value of oil-linked
                                      commodities.

  Linepack                            The pressurised volume of gas stored in the pipeline system. Essential to enable gas
                                      transportation through the pipeline network throughout each day and required as a buffer for
                                      within-day supply/demand balancing.

  Netback price                       An export parity price that a gas supplier can expect to receive for exporting its gas. It is
                                      calculated by taking the price that could be received for LNG and subtracting or ‘netting back’ the
                                      costs incurred by the supplier to convert the gas to LNG and ship it to the destination port.

  Residential &                       A gas market demand segment that comprises households and businesses with connections to
  Commercial
                                      a gas distribution network.

Core Energy & Resources Pty Limited                                   December 2019                                                             iv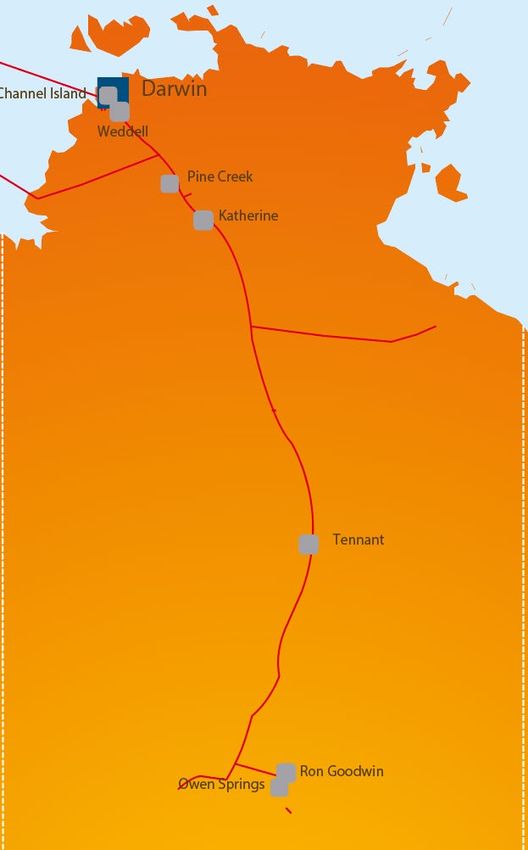
Wholesale Gas Price Outlook 2020-2050 | Eastern, Western & Northern Australia 1. Introduction
1. Introduction
1.1. Scope of Report
The Australian Energy Market Operator (“AEMO”) has engaged Core Energy & Resources (“CORE”) to provide annual projections
of wholesale delivered gas prices for the calendar year period from 2020 to 2050 as an input into AEMO’s various 2020
forecasts, including the 2020 Gas Statement of Opportunities (“GSOO”). The delivered prices include:
delivered wholesale gas price for residential and commercial (“R&C”) demand nodes (entry gate to distribution network);
and
delivered wholesale gas price for gas powered generators (“GPG”) in the eastern Australian National Electricity Market
(“NEM”); South West Interconnected System (“SWIS”) in Western Australia (“WA”) and the Darwin Katherine
Interconnected System (“DKIS”) in the Northern Territory (“NT”).
1.2. Report Structure
This report includes four main elements:
Executive Summary
The executive summary provides a concise overview of the assessment and methodology undertaken by CORE and highlights
CORE’s conclusion regarding:
GPG delivered wholesale gas price by major system generator;
Retail delivered wholesale price delivered to by major city demand nodes for sale to R&C consumers.
Methodology
This section outlines the methodology CORE has adopted to arrive at estimates of projected prices.
Risks, Uncertainties and Assumptions adopted
This section summarises the key risks, uncertainties and assumptions adopted relating to the price estimates presented.
Delivered Price Projections
This section summarises projected price analysis and results.
Core Energy & Resources Pty Limited December 2019 5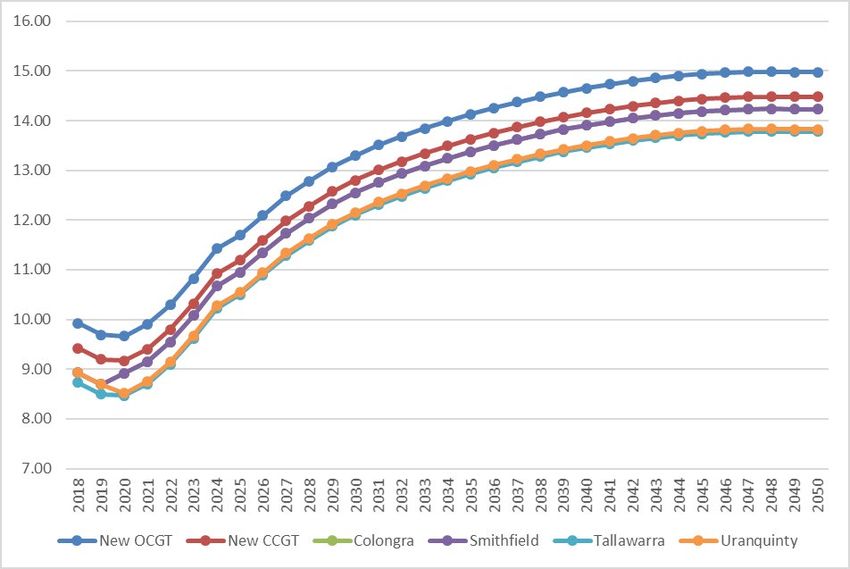
Wholesale Gas Price Outlook 2020-2050 | Eastern, Western & Northern Australia 2. Executive Summary
2. Executive Summary
2.1. Introduction
CORE has been engaged by AEMO to provide an independent estimate of future delivered wholesale gas prices, between 2020
and 2050, within three regional gas markets – Eastern Australia, Western Australia and Northern Territory, for two gas
consumer segments:
• Residential and Commercial consumers (“R & C”) who access gas via gas distribution networks (major city demand
hubs included in figures 2.1 to 2.3).
• Gas Powered Generators (“GPG”) who receive gas via a transmission pipeline system (major GPG demand hubs included
in figures 2.1 to 2.3).
For the avoidance of doubt, delivered wholesale price estimates referred to throughout this report exclude any costs associated
with distribution services, retailer cost and margin and any market or ancillary charges.
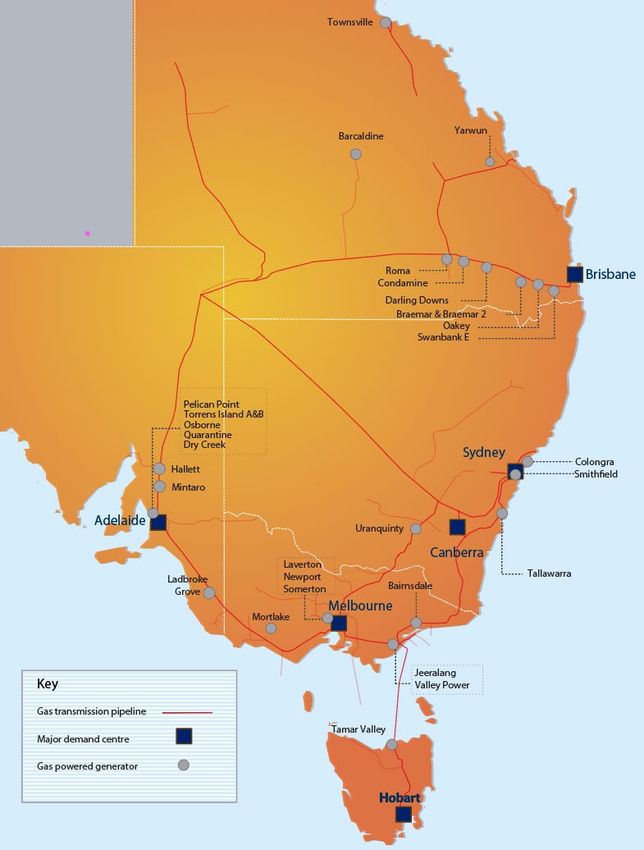
Figures 2.1 to 2.3 present an illustration of Australia’s three regional gas systems, highlighting the location of the relevant GPG
and major demand centres, for which delivered wholesale prices have been estimated by CORE. Note Sydney and Canberra prices
have been combined for the purposes of this report
Figure 2.1 Location of GPG and major city demand centres in Eastern Australia
Source: Core Energy & Resources
Core Energy & Resources Pty Limited December 2019 6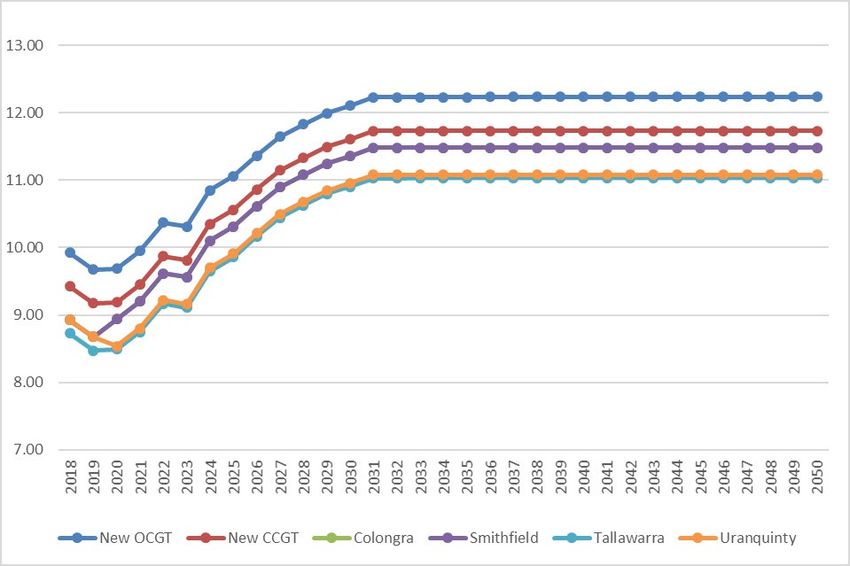
Wholesale Gas Price Outlook 2020-2050 | Eastern, Western & Northern Australia                                                                                      2. Executive Summary

Figure 2.2 Location of GPG and R&C Demand Nodes in Western Australia

Source: Core Energy & Resources Note 1

Figure 2.3 Location of GPG and major demand centres in Northern Territory

Source: Core Energy & Resources

1
    Kalgoorlie is also a significant load on the SWIS and under “normal” non-peak operation, these Kalgoorlie non-mining loads are supplied by these generators.

Core Energy & Resources Pty Limited                                                             December 2019                                                                         7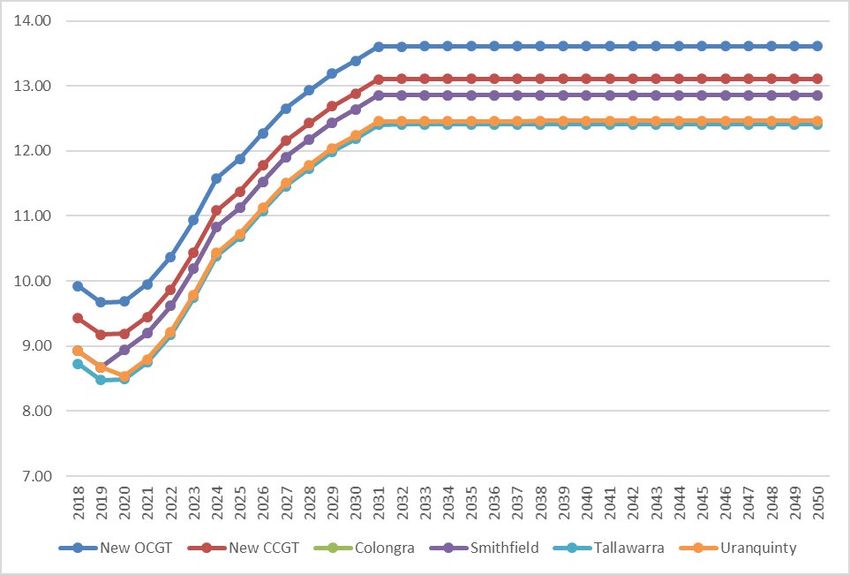
Wholesale Gas Price Outlook 2020-2050 | Eastern, Western & Northern Australia                                                                                              2. Executive Summary

2.2. Methodology

CORE has adopted a bottom-up approach to derive an estimate of delivered wholesale prices for the 2020-2050 period. Three
major inputs have been separately estimated, and subsequently aggregated, to derive delivered wholesale price estimates. Each
element has relied upon public and privately sourced data, including:

Wholesale contract price - the price of gas metered at the inlet to the gas transmission line, based on the estimated weighted
average gas portfolio price for a specific gas buyer (retailer or generation facility owner).

Weighted Average gas portfolio price = gas price from Contract A * Weight of Contract A (As determined by Total
Contract) + gas price from Contract B* Weight of Contract B (to Total Contracts)

Transmission cost - the relevant transmission pipeline tariff incurred when gas is transported from the upstream supply point
to the metered delivery point relating to each GPG plant or distribution network delivery point (for R & C consumers), in
accordance with an estimated gas transmission system tariff.

Transmission Tariff = x% * Capacity Tariff + y% * Commodity Tariff + z% * Nitrogen removal charge

Peak supply cost - the cost of peak supply service to meet the variation between annual average demand and peak seasonal
demand, which does not form part of the wholesale contract cost/price, or base transmission service but incurred as an
additional cost – for example the use of the Iona and Mondarra underground gas storage services in Eastern and Western
Australia respectively or the use of transmission system linepack.

Peak Supply Cost = (peak – average seasonal demand) * (Contract Cost + Margin + Gas Storage Cost)

CORE has applied its methodology based on three scenarios as provided by AEMO, which present three alternative pathways to
the development of the energy system and the future energy consumption needs of consumers. This includes a reference range
between a ‘Central (Upper)’ and a ‘Central (Lower)’ scenario which is CORE’s best estimate of a most likely single point outcome
on an annual basis; a ‘High’ scenario and a ‘Low’ scenario.

These scenarios take into consideration, among other influences, the following oil price and exchange rate scenarios:

Figure 2.4 Future Oil Price Scenarios (USD/Bbl)                                                       Figure 2.5 Future Exchange Rate Scenarios (USD: AUD)

Note: Central (Upper) and Central (Lower) share same price line                                         Note: Central (Upper) and Central (Lower) share same price line

Source: Core/EIA Short- and Long-term Projections – Reference retained flat in real terms               Source: Reuters for 2018, 2019 Actual. Forecast provided by AEMO
from 2032.

Core Energy & Resources Pty Limited                                                         December 2019                                                                                    8
Wholesale Gas Price Outlook 2020-2050 | Eastern, Western & Northern Australia 2. Executive Summary
2.3. Key Risks, Uncertainties and Key Assumptions
As is the case with any projection of future outcomes, there are a range of risks and uncertainties, both to the downside and
upside, which relate to future price projections referenced throughout this report. CORE considers that a range of factors,
including the following, could give rise to a material variance outside the range identified within this report:
Government intervention
Movement in supply/demand balance
Changes in the concentration of market power/competition on buy and/or sell sides
Changes in the pricing formula for LNG or any other gas related market which has commercial linkage with domestic
markets
2.4. GPG Delivered Wholesale Price Projections 2020 – 2050
CORE’s estimates of future prices take into consideration certain differences in market forces between Eastern Australia,
Western Australia and Northern Territory:
Eastern Australia is expected to have the closest link to LNG netback prices due to a relatively tight supply/demand balance
and competition for supply between domestic and LNG markets. This is reflected by a contract price formula whereby the
domestic price has a relationship to an LNG/oil reference price such as Brent. CORE assumes that the future linkage will be
approximately 7.5 to 8% of Brent beyond the timeframe of existing contracts. Prior to this CORE has estimated existing
contract prices including contracts that include either fixed pricing or a combination of fixed and floating prices, consistent
with disclosures by the ACCC in its Gas Inquiry reports.
Western Australia prices are expected to be lower than the east due to the influence of LNG project reserves (and associated
production) which must be reserved for domestic purposes.
Northern Territory prices are expected to remain relatively flat in real terms as prices are assumed to be fixed under a long-
term contract with the NT government, which is assumed to be passed on to generators and retailers at cost. Prices are
assumed to inflate materially upon maturity of this contract due to competition with oil-price linked eastern Australia
source gas, given the two regions became connected via the Northern Gas Pipeline from December 2018.
2.4.1. Eastern Australia
Figures 2.6 to 2.10 present CORE’s estimate of wholesale delivered gas prices for each generator, by region/State/Territory,
under the Central (Upper) and Central (Lower) scenarios. All prices are presented in real July 2019, Australian Dollar (AUD) terms.
In broad terms prices are expected to trend upward by almost AUD4/GJ between 2019 and 2032, driven primarily by assumed
linkage between increased A$ LNG prices and domestic contract prices (albeit changing over time due to potential impact of LNG
imports, government intervention and other forces). In this regard CORE expects future LNG import terminals to place a degree
of supply pressure on the market, via initial contract price negotiation that will place some upper limit for the contracting
purchaser/s most likely beyond 2024-5. Further market intervention may change natural market supply/dynamics which could
result in lower prices as observed through reservation in WA.
Core Energy & Resources Pty Limited December 2019 9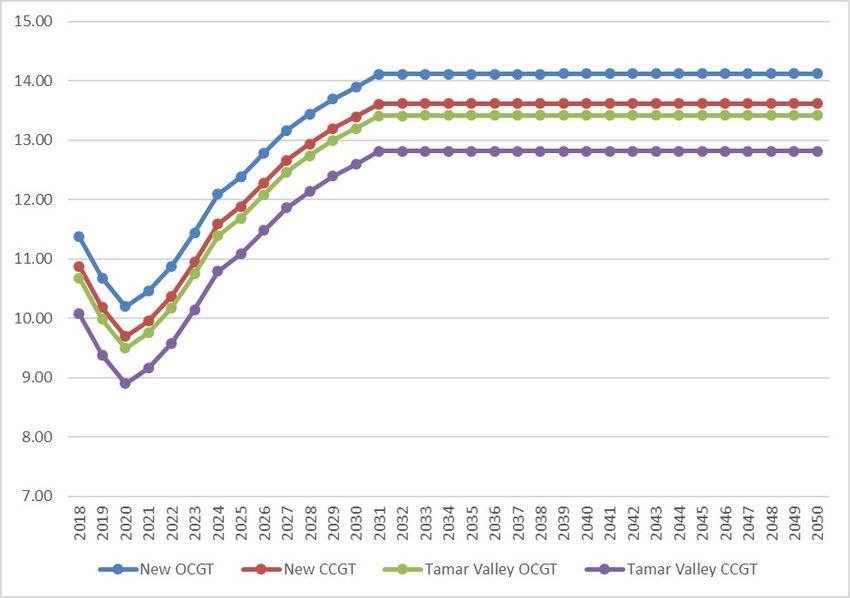
Wholesale Gas Price Outlook 2020-2050 | Eastern, Western & Northern Australia                                                                                                                                  2. Executive Summary

Variations between generators within States and across States is attributable to variations in the estimated weighted average
portfolio prices of generator owners, including the price and term to maturity of existing contracts and assumed new contract
prices beyond this term.

  Weighted Average gas GPG price = gas price from Contract A * Weight of Contract A (As determined by Total Contract) +
                                                  gas price from Contract B* Weight of Contract B (to Total Contracts)

  Figure 2.6 Victoria | Central (Upper) | AUD/GJ real 7.2019                                                       Figure 2.7 New South Wales | Central (Upper) | AUD/GJ real 7.2019

  Note: Jeeralang B&A, Valley Power, Somerton, Newport, Laverton and Bairnsdale
  share same price line.                                                                                           Note: Smithfield and Colongra share same price line.

  Figure 2.8 Queensland | Central (Upper) | AUD/GJ real 7.2019                                                     Figure 2.9 South Australia | Central (Upper) | AUD/GJ real 7.2019
  Note: Barcaldine, Braemar 1&2, Condamine, Oakey, Roma and Swanbank E share same price line. Yarwun and Darling   Note: TIPS A&B, Osborne share same price line. Dry Creek, Hallet, Ladbroke Grove, Mintaro, Pelican Point and
  Downs share same price line.                                                                                     Quarantine share same price line.

  Figure 2.10 Tasmania             | Central (Upper) | AUD/GJ real 7.2019

Source: Core Energy & Resources.

Core Energy & Resources Pty Limited                                                                       December 2019                                                                                                           10
Wholesale Gas Price Outlook 2020-2050 | Eastern, Western & Northern Australia 2. Executive Summary 2.4.2. Western Australia In broad terms, wholesale delivered prices to generators in Western Australia are expected to trend upward by around AUD1/GJ between 2021 and 2033, due to a partial influence of LNG netback prices on LNG domestic gas supply which is reserved for domestic markets under State Agreements. Variations between generators is attributable to variations in the estimated weighted average portfolio prices of generator owners, including the price and term to maturity of existing contracts and assumed new contract prices or contract price resets and transport and any peak supply services. Figure 2.11 WA GPG Gas Price | Central (Upper) | AUD/GJ real 7.2019 Note: Pinjar, Kwinana (KPS), Cockburn share same price line. Source: Core Energy & Resources. 2.4.3. Northern Territory In broad terms wholesale delivered prices to generators are expected to remain flat until the maturity of the existing Black-tip supply contract. New contract prices in 2035 are expected to increase to over AUD9/GJ, influenced in part by projected eastern Australian prices, given regional interconnection from 2019. Figure 2.12 NT GPG Gas Price | Central | AUD/GJ real 7.2019 Note: All prices are estimated to follow the same price line. Source: Core Energy & Resources. Core Energy & Resources Pty Limited December 2019 11
Wholesale Gas Price Outlook 2020-2050 | Eastern, Western & Northern Australia                                                                                                     2. Executive Summary

2.5. R&C Delivered Wholesale Price Projections

The following figures present CORE’s estimate of the movement in wholesale delivered prices to major retail R&C demand nodes
(at distribution network inlet point) under the Central (Upper) and Central (Lower) scenarios for Eastern Australia (refer to
Section 5 for CORE’s estimates for each of the three scenarios for Eastern Australia) and all scenarios for Western Australia and
Northern Territory.

2.5.1.        Eastern Australia

The progressive increase in Eastern Australia to 2032 is primarily the result of assumed linkage between domestic wholesale
prices and LNG prices, which are expected to flatten in the longer term due to supply/demand balance.

Figure 2.13 R&C Delivered Price Retail Gas Price (EA) | Central (Upper) | AUD/GJ real 7.2019               Figure 2.14 R&C Delivered Price Retail Gas Price (EA) | Central (Lower) | AUD/GJ real 7.2019

Source: Core Energy & Resources

2.5.2.        Western Australia                                                                            2.5.3.        Northern Territory

The stepped change in prices in WA is associated with                                                      NT prices which include assumed wholesale and
assumed future prices under new contracts or contract                                                      transmission prices, are assumed to remain flat until the
price resets under-price review mechanisms, with risk to                                                   end of the Blacktip contract and reset to a price closer to
downside in short term as supply exceeds demand and risk                                                   eastern Australia and/or LNG in 2034.
to the upside in future as there is lower new supply and
                                                                                                           Figure 2.16 R&C Delivered Price Retail Gas Price (NT) | Scenarios | AUD/GJ real 7.2019
prices start to track LNG pricing.

Figure 2.15 R&C Delivered Price Retail Gas Price (WA) | Scenarios | AUD/GJ real 7.2019

Core Energy & Resources Pty Limited                                                            December 2019                                                                                         12
Wholesale Gas Price Outlook 2020-2050 | Eastern, Western & Northern Australia 3. Validation of Prior Year Projections
3. Validation of prior year projections
CORE has taken steps to cross-check or validate projections presented in prior years and the current year report. In this regard
CORE notes the following:
> Eastern Australia
o projections presented in the prior year report2 and this report are materially consistent with facts presented by ACCC
within reports released under its Gas Inquiry as it relates to 2018-2020 years. CORE has had regard to ACCC refences
relating to linkage with LNG, reference to implied ‘slopes’ up to 8%, reference to fixed price, floating price and hybrid
contracts – floating and fixed. CORE assumes a starting point of contract prices of close to $7/GJ which is consistent
with ACCC disclosures
o CORE attended a meeting arranged by AEMO to discuss our draft finding with a range of industry participants - the Gas
Review Group”. A range of questions were asked at this session which CORE has taken into consideration in forming its
scenario-based projections.
o beyond this date there is inconsistent quality of public disclosure, however the broad approach adopted by CORE is
consistent with approaches adopted in a range of public releases.
> Western Australian and Northern Territory
o gas prices have been derived using an approach that is consistent with approaches adopted by other specialists, for
demand analysis purposes, including use of weighted average contract prices, reference to disclosed transmission tariffs
and an estimate of the cost of to address seasonal/variable demand in the residential, commercial and GPG sectors.
o CORE has not identified any sources which provide a specific cross-check for the term addressed in this report and
encourages public feedback to continually improve the quality of future projections.
o CORE notes that Futures markets are not forecasts, regardless the Brent Futures market is only trading as far ahead as
December 2028 when a forecast till 2050 is required.
Core Energy & Resources Pty Limited December 2019 13Wholesale Gas Price Outlook 2020-2050 | Eastern, Western & Northern Australia 4. Methodology
4. Methodology
The following is a summary of the methodology adopted by CORE to develop scenario-based projections of delivered wholesale
gas prices for the GPG and R&C consumer segments. The approach is consistent with last year; however, several assumptions
vary as addressed below.
4.1. Scenarios
CORE has derived estimates of delivered wholesale gas prices (delivered to generator inlet or inlet of distribution network) under
three scenarios, consistent with a scenario framework developed by AEMO.
Driver 1. Central Scenario 2. Step Change 3. Slow Change
(Central scenario) (Strong growth) (Weak growth)
Economic Drivers • Neutral global growth (86% GDP • Strong global growth • Weak global growth (62%
growth by 2041 compared to 2018) (213% GDP growth by GDP growth by 2041
• Neutral domestic growth 2041 compared to 2018) compared to 2018)
• Medium population growth (ABS • Strong domestic growth • Weak domestic growth
Series B) • High population growth • Low population growth
(ABS Series A) (ABS Series C)
Technology Drivers • Moderate energy efficiency • Aggressive energy • Weak energy efficiency
measures efficiency measures measures
• Average case for gas to electricity • Strong case for gas to • Weak case for gas to
fuel switching electricity fuel switching electricity fuel switching
Decarbonisation • Current policy settings • Stronger action on • Lower decarbonisation
ambition climate change ambition
The Scenarios developed by CORE, align with the AEMO scenarios as follows:
AEMO Scenario 1. Central Scenario (Central 2. Step Change 3. Slow Change
Scenario) (Strong Growth) (Weak Growth)
Corresponding Central (Upper) - east and west High Low
CORE Scenario
Central (Lower) – east and west
Central - NT
Central (Upper) Scenario
Opening 2018-19 prices are based on Core analysis of weighted average contract price for major Retailers, which include a
combination of hybrid and fixed price contracts, consistent with recent ACCC publications.
In this scenario the forecast oil price is assumed to be a hybrid of the EIA short term and long-term Reference price scenario and
Core assumption of a flattening out of oil price from the mid 2030’s broadly in line with the prior year analysis. The most recent
EIA LTEO was adjusted for changes in the EIA STEOs between LTEO publication date and the most recent EIA STEO publication
date.
The future drivers of price in this scenario are the supply short nature of the market, the high marginal cost of future reserve
development, the linkage to LNG export markets, and oil price inflation when measured in Australian dollars, which drive prices
Core Energy & Resources Pty Limited December 2019 14Wholesale Gas Price Outlook 2020-2050 | Eastern, Western & Northern Australia 4. Methodology
upward until the mid-2030’s. Beyond then a range of forces are assumed to result in price stabilisation, including LNG imports,
cost efficiencies, market intervention levers, lower LNG prices beyond the current contracts expiring from 2034, flat
infrastructure costs and an assumed low cost of capital.
Central (Lower) Scenario
The Central (Lower) Scenario addresses the uncertainty with the Central (Upper) scenario and describes a range of prices
reasonably covering the risks and uncertainties described in this report, in particular the risk of intervention, import terminals,
the magnitude of oil linkage, and oil price. In this scenario generally the ratio of gas Price to Brent prices reduces below 7%
progressively to 2023 and is then flat.
Opening 2018-19 prices are based on Core analysis of weighted average contract price for major Retailers, which include a
combination of hybrid and fixed price contracts, consistent with recent ACCC publications. The contract profile assumed is
consistent with the profile provided to AEMO and disclosed with CORE’s Production report.
In this scenario the forecast oil price is assumed to be a hybrid of the EIA short term and long term Reference price scenario and
a CORE assumption of a flattening out of oil price from the mid 2030’s broadly in line with the prior year analysis and potential
impact of future technology, as addressed in another EIA scenario 3. The most recent EIA LTEO was adjusted for changes in the
EIA STEOs between LTEO publication date and the most recent EIA STEO publication date.
The future drivers of price in this scenario are the supply short nature of the market, the high marginal cost of future reserve
development, the linkage to LNG export markets, and oil price inflation when measured in Australian dollars, which drive prices
upward until the mid-2030’s. Beyond then a range of forces are assumed to result in price stabilisation, including LNG imports,
cost efficiencies, market intervention levers, lower LNG prices beyond the current contracts expiring from 2034, flat
infrastructure costs and an assumed low cost of capital.
Low Scenario
Opening 2018-19 prices are consistent with the Central (Upper) scenario.
The highest weighting has been given to the factors listed first in the Scenario Description; Economic Drivers of weak global
growth, weak domestic growth and low population growth, leading to weak global energy demand, and therefore selection of
the EIA Low Case. In this scenario the forecast oil price is assumed to be a hybrid of EIA short term and long-term Low-price
scenario. The most recent EIA LTEO was adjusted for changes in the EIA STEOs between LTEO publication date and most recent
EIA STEO publication date.
The future drivers of price in this scenario are the gas supply short market, the linkage to LNG export markets, low gas prices
based on an assumed lower cost of extraction, flat infrastructure costs and an assumed low cost of capital.
3
“High oil and gas resource and technology” scenario
Core Energy & Resources Pty Limited December 2019 15Wholesale Gas Price Outlook 2020-2050 | Eastern, Western & Northern Australia 4. Methodology High Scenario Opening 2018-19 prices are consistent with the Central (Upper) and Low scenario. The highest weighting has been given to the factors listed first in the Scenario Description; Economic Drivers of strong global growth, strong domestic growth and high population growth. Technology Drivers and Decarbonisation Ambition for this scenario dampen but do not outweigh this global increase in energy demand, which is why the EIA Reference rather than High Case was selected. Oil Price is a hybrid of EIA short term and long-term Reference price scenario. The most recent EIA LTEO was adjusted for changes in the EIA STEOs between LTEO publication date and most recent EIA STEO publication date. The future drivers of price are the gas supply short market, the linkage to LNG export markets, and oil price inflation when measured in Australian dollars, driving prices upward throughout the period, flat infrastructure costs and the low cost of capital. Unless otherwise stated, scenario-based prices assume the following average annual oil prices and AUD: USD exchange rates. Figure 4.1 Brent Oil Price (USD per bbl) Figure 4.2 Exchange Rate (AUD: USD) Note: Central (Upper) and Central (Lower) share same price line. Note: Central (Upper) and Central (Lower) share same price line. Source: Core, EIA Source: AEMO 4.2. Market Structure CORE’s view is that market structure is like last year. CORE’s projections have been developed following consideration of certain material differences between the dynamics of western, eastern and northern markets are summarised below. Eastern Australia: CORE assumes that the demand/supply balance in eastern Australia, as it relates to the domestic market, will remain tight throughout the projection period. Given linkages between export and domestic market supply, it is further assumed that future prices under new contracts will move closer to, but fall short of, LNG netback parity, where netback is defined as the price of LNG netted back to the Wallumbilla hub, which includes the Gladstone f.o.b. LNG price less costs associated with transport, marine facilities and LNG processing. Western Australia: CORE assumes that WA will move from a situation where supply is long during the period to 2021 to one where it is generally in balance due to the combined influences of reserved gas supply from LNG projects and dedicated domestic supply projects including the new Waitsia development and demand which is expected to remain relatively flat. Accordingly, prices in WA are assumed to track below LNG net back prices as compared to eastern Australia. Northern Territory: Most of the gas supply in Northern Territory is sourced under a long-term contract with Power and Water Corporation. Therefore, CORE assumes that NT prices will remain flat until that contract matures. Future prices are assumed to Core Energy & Resources Pty Limited December 2019 16
Wholesale Gas Price Outlook 2020-2050 | Eastern, Western & Northern Australia                                               4. Methodology

be influenced to some extent by prices in eastern Australia, less the cost of transport, given interconnection between NT and the
east from December 2018, via the Northern Gas Pipeline.

4.3. Delivered Wholesale Price Elements

In determining the wholesale gas prices, three elements have been considered, and these elements have been aggregated under
each scenario to arrive at a future range of feasible delivered wholesale price outcomes:

Wholesale contract price - the price of gas metered at the inlet to the gas transmission line, based on the estimated weighted
average gas portfolio price for a specific gas buyer (retailer or generation facility owner).

 Weighted Average contract price = gas price from Contract A * Weight of Contract A (As determined by Total Contract) +
                   gas price from Contract B* Weight of Contract B (to Total Contracts) or Wholesale Costs + Margin.

Transmission cost - the relevant transmission pipeline tariff incurred when gas is transported from the upstream supply point
to the metered delivery point relating to each GPG plant or distribution network delivery point (for R & C consumers), in
accordance with an estimated gas transmission system tariff.

                  Transmission Tariff = x% * Capacity Tariff + y% * Commodity Tariff + z% * Any processing/Nitrogen removal
                                                                                        charge

Peak supply cost - the cost of peak supply service to meet the variation between annual average demand and peak seasonal
demand, which does not form part of the wholesale contract cost/price, or base transmission service but incurred as an
additional cost – for example the use of the Iona and Mondarra underground gas storage services in Eastern and Western
Australia respectively or the use of transmission system linepack.

                 Peak Supply Cost = (peak – average seasonal demand) * (Contract Cost + Margin + Gas Storage Cost)

It should be noted that this price represents the estimated weighted portfolio cost of gas to the buyer (retailer or GPG owner)
over time (existing contracts and assumed future contract prices, based on CORE analysis of public disclosures and assessment
of movements in supply/demand balance) and not the marginal cost or opportunity cost, which may also influence future
market behaviour. The prices therefore also do not reflect the potential volatility that may exist in short term gas markets.

Prices are expressed in July 2019 real terms unless stated otherwise.

The following sections provide more detail on CORE’s approach to estimating each price/cost component.

4.3.1.        Wholesale Contract Price

Internally, CORE maintains a database which incorporates a best estimate of existing contracts and key features of each
contract. The database includes estimated prices, and these prices have been relied upon to develop estimates of projected
wholesale gas price for the estimated duration of each contract. Further, CORE maintains an assessment of future prices for
those years (and associated links to LNG pricing) which extend beyond the estimated term of an existing contract and these
prices have been relied upon to develop price estimates to 2050. CORE has also considered the extent of any shorter-term
market price influence – i.e. trades via short-term markets, swaps, or other short-term exchange mechanism. The extent of this
influence is assumed to be up to 10% in WA (including short term contracts), less than 5% in Eastern Australia, and no impact in
Northern Territory.

Core Energy & Resources Pty Limited                                             December 2019                                           17
Wholesale Gas Price Outlook 2020-2050 | Eastern, Western & Northern Australia 4. Methodology
More specifically CORE’s approach has involved the following steps:
1. Estimate a portfolio-wide weighted average price of wholesale gas for the major retailers and generators in each
jurisdiction (e.g. Gentailers AGL, Origin Energy and EnergyAustralia in eastern Australia, gas retailers Alinta and
Kleenheat in Western Australia and Territory Generation for GPG in Northern Territory);
2. Estimate the market share of each retailer for each region to derive an estimate of the weighted average wholesale
price for that region;
3. For those existing contracts which are assessed to be linked to oil price, estimate a future price estimate by applying
the oil and exchange rate assumptions, as outlined above;
4. For new future contracts, CORE has assumed that prices will be determined by specific dynamics within each of the
three markets, including assumed linkage in eastern Australia to future LNG netback prices, with that relationship
varying between region and scenario.
4.3.2. Transmission Tariff
CORE has utilised the Gas Infrastructure module of its Energyview system to develop estimates of future transmission tariffs.
CORE’s approach involves:
1. An assumption under all scenarios is that transmission cost will remain flat in real terms due to regulatory, supply and
demand side competition influences and that Buyers portfolio tariffs are in line with public ‘headline’ tariffs. CORE
notes that larger buyers will negotiate discounts to such prices in practice but the extent of discount by pipeline is not
available in the public domain. Such discounts can be material, based on CORE’s experience.
2. For R&C demand centres the transmission cost has been derived on a weighted average basis by estimating the
relative utilisation of pipelines connecting with each State/Territory R&C and generator demand node. For example,
gas is delivered to South Australia via both the South East Australian (“SEA”) Gas Pipeline and Moomba Adelaide
Pipeline (“MAP”), therefore transmission costs in South Australia are weighted based on the estimated relative
pipeline flows. These costs are assumed to constant in real terms.
3. The transmission cost for power stations is based on the main pipeline link. For example, Bairnsdale, Jeeralang A and B
and Valley Power stations are situated on the Longford Melbourne Pipeline (“LMP”), and the associated transmission
cost is assumed to be the LMP transmission tariff.
4.3.3. Peak Supply Tariff
CORE’s approach to estimating peak supply costs is as follows:
1. Determine the R&C and GPG peak requirements in each State/Territory.
2. Determine the weighted average cost of utilisation of peak supply sources in each State/Territory.
3. Determine the weighted average cost of peak supply in each State/Territory for each R&C and GPG demand node. Note:
For States and Territories with material swing in seasonal demand, a peak supply charge/tariff has been included for
supply outside of contracted maximum daily quantity (“MDQ”). CORE assumes that any variability in daily demand is
met by contracted MDQ in Queensland, Tasmania and Northern Territory. Therefore, additional peak supply costs are
assumed to be modest if applicable at all, for R&C and GPG in those regions.
Core Energy & Resources Pty Limited December 2019 18Wholesale Gas Price Outlook 2020-2050 | Eastern, Western & Northern Australia 4. Methodology CORE notes that it has assumed a consistent peak profile across all scenarios as gas is assumed to fill any gaps in peak demand due to increased use of intermittent electricity generation. There is a risk that battery or other storage sources could change this position, however the cost of such supply is expected to remain high. Core Energy & Resources Pty Limited December 2019 19
Wholesale Gas Price Outlook 2020-2050 | Eastern, Western & Northern Australia 5. Key Risks & Uncertainties
5. Key Risks, Uncertainties and Key Assumptions
CORE notes that the demand/supply position considered in its analysis was the GSOO 2019 and CORE’s own views of changing
forces, where appropriate.
The following table provides a summary of the key risks and uncertainties related to the estimates of future delivered wholesale
gas prices.
Table 5.1 Key Uncertainties
Factor Influence
Wholesale Price
AUD Oil Price Linkage Movement in oil price and exchange rate could materially impact future gas prices through
contract pricing mechanisms linked to USD and AUD oil prices
Policy Changes in government policy which materially impact gas demand, supply or cost
Production Cost Future cost of gas extraction, including uncertainty associated with reservoir/well performance
Scope for technology advancement
Availability of Supply Source Timing, location and scale of any future exploration success
LNG import terminal Timing, scale and contracting of gas supply from a future import terminal and impact of the cost
of such supply in setting a new marginal price benchmark
Transmission Cost
Pipeline capacity utilisation Movement in capacity contracting could result in movement in tariffs
Regulation Any change in regulation which impacts tariffs
Peak Supply Cost
Movement in peak and intermediate gas Movement in demand side forces such as reduction in peak GPG due to battery storage or
supply/demand balance reduction in winter gas heating due to expansion of R-C air-conditioning use in winter heating
season
Cost of New Entrant Capacity Cost of any new greenfield underground storage service
Cost of any new LNG spiking facility
Availability and cost of any augmentation of linepack or other pipeline storage service
Based on the risks and uncertainties listed above, CORE considers it feasible that there will be a future price path that is
materially above that presented under the Central (Upper) and Central (Lower) and High scenarios for eastern Australia. In such
circumstances CORE believe it may have a material impact on the large industrial, gas intensive sector as is currently being
reported by Rio Tinto and others. However, CORE’s analysis indicates that supply in the retail and peak GPG sectors will be less
price sensitive.
Core Energy & Resources Pty Limited December 2019 20Wholesale Gas Price Outlook 2020-2050 | Eastern, Western & Northern Australia 6. Delivered Wholesale Price Projections 6. Delivered Wholesale Price Projections 6.1. Introduction Historical and projected delivered wholesale gas price paths for defined generators and major gas networks is provided in the following paragraphs. 6.2. GPG Delivered Wholesale Price Projections 6.2.1.1 Victoria The location of Victorian gas-powered generators is presented in Figure 6.1 Figure 6.1 Map of Victorian GPG locations (illustrative only) Source: Core Energy & Resources The following figures present a summary of CORE’s projection of delivered VIC GPG wholesale prices between 2020 and 2050 under Central (Upper), Central (Lower), High and Low scenarios. Figure 6.2 VIC GPG Gas Price Projections | Central (Upper) | AUD/GJ real 7.2019 Figure 6.3 VIC GPG Gas Price Projections | Central (Lower) | AUD/GJ real 7.2019 Note: Jeeralang B&A, Valley Power, Somerton, Newport, Laverton and Bairnsdale share same price line. Note: Jeeralang B&A, Valley Power, Somerton, Newport, Laverton and Bairnsdale share same price line. Figure 6.4 VIC GPG Gas Price Projections | High Scenario | AUD/GJ real 7.2019 Figure 6.5 VIC GPG Gas Price Projections | Low Scenario | AUD/GJ real 7.2019 Note: Jeeralang B&A, Valley Power, Somerton, Newport, Laverton and Bairnsdale share same price line. Note: Jeeralang B&A, Valley Power, Somerton, Newport, Laverton and Bairnsdale share same price line. Core Energy & Resources Pty Limited December 2019 21
Wholesale Gas Price Outlook 2020-2050 | Eastern, Western & Northern Australia                                                                               6. Delivered Wholesale Price Projections

6.2.1.2 New South Wales

Figure 6.6 presents the location of gas-powered generators in New South Wales

Figure 6.6 Map of New South Wales GPG locations (illustrative only)

Source: Core Energy & Resources

The following figures present a summary of CORE’s projection of NSW delivered GPG wholesale prices between 2020 and 2050
under Central (Upper), Central (Lower), High and Low scenarios.

   Figure 6.7 NSW GPG Gas Price Projections | Central (Upper) | AUD/GJ real 7.2019                   Figure 6.9 NSW GPG Gas Price Projections | High Scenario | AUD/GJ real 7.2019
   Note: Smithfield and Colongra share same price line.                                              Note: Smithfield and Colongra share same price line.

                                                                                                     Figure 6.10 NSW GPG Gas Price Projections | Low Scenario | AUD/GJ real 7.2019
   Figure 6.8 NSW GPG Gas Price Projections | Central (Lower) | AUD/GJ real 7.2019                   Note: Smithfield and Colongra share same price line.
   Note: Smithfield and Colongra share same price line.

   Source: Core Energy & Resources.

Core Energy & Resources Pty Limited                                                  December 2019                                                                                                     22
Wholesale Gas Price Outlook 2020-2050 | Eastern, Western & Northern Australia 6. Delivered Wholesale Price Projections 6.2.1.3 South Australia Figure 6.11 presents a summary of the location of gas-powered generators in South Australia Figure 6.11 Map of South Australian GPG locations (illustrative only) Source: Core Energy & Resources The following figures present a summary of CORE’s projection of delivered SA GPG wholesale prices between 2020 and 2050 under Central (Upper), Central (Lower), High and Low scenarios. Figure 6.12 SA GPG Gas Price Projections | Central (Upper) | AUD/GJ real 7.2019 Figure 6.13 SA GPG Gas Price Projections | Central (Lower) | AUD/GJ real 7.2019 Note: TIPS A&B, Osborne share same price line. Dry Creek, Hallet, Ladbroke Grove, Mintaro, Pelican Point and Note: TIPS A&B, Osborne share same price line. Dry Creek, Hallet, Ladbroke Grove, Mintaro, Pelican Point and Quarantine share same price line. Quarantine share same price line. Figure 6.14 SA GPG Gas Price Projections | High Scenario | AUD/GJ real 7.2019 Figure 6.15 SA GPG Gas Price Projections | Low Scenario | AUD/GJ real 7.2019 Note: TIPS A&B, Osborne share same price line. Dry Creek, Hallet, Ladbroke Grove, Mintaro, Pelican Point and Note: TIPS A&B, Osborne share same price line. Dry Creek, Hallet, Ladbroke Grove, Mintaro, Pelican Point and Quarantine share same price line. Quarantine share same price line. Source: Core Energy & Resources. Core Energy & Resources Pty Limited December 2019 23
Wholesale Gas Price Outlook 2020-2050 | Eastern, Western & Northern Australia                                                                                                        6. Delivered Wholesale Price Projections

6.2.1.4 Queensland

Figure 6.16 presents the location of gas-powered generators in Queensland.

Figure 6.16 Map      of Queensland GPG locations (illustrative only)

Source: Core Energy & Resources

The following figures present a summary of CORE’s projection of delivered QLD GPG wholesale prices between 2020 and 2050
under Central (Upper), Central (Lower), High and Low scenarios.

Movements over time are associated with assumed movements in the influence of $A LNG prices and recontracting events at
new price levels based on market forces at the time.

Figure 6.17 QLD GPG Gas Price Projections | Central (Upper) | AUD/GJ real 7.2019                                        Figure 6.18 QLD GPG Gas Price Projections | Central (Lower) | AUD/GJ real 7.2019
Note: Barcaldine and Braemar 1&2, Condamine, Oakey, Roma and Swanbank E share same price line. Yarwun and               Note: Barcaldine and Braemar 1&2, Condamine, Oakey, Roma and Swanbank E share same price line. Yarwun and
Darling Downs share same price line.                                                                                    Darling Downs share same price line.

Figure 6.19 QLD GPG Gas Price Projections | High Scenario | AUD/GJ real 7.2019                                          Figure 6.20 QLD GPG Gas Price Projections | Low Scenario | AUD/GJ real 7.2019
Note: Barcaldine and Braemar 1&2, Condamine, Oakey, Roma and Swanbank E share same price line. Yarwun and               Note: Barcaldine and Braemar 1&2, Condamine, Oakey, Roma and Swanbank E share same price line. Yarwun and
Darling Downs share same price line.                                                                                    Darling Downs share same price line.

Source: Core Energy & Resources.

Core Energy & Resources Pty Limited                                                                         December 2019                                                                                                      24
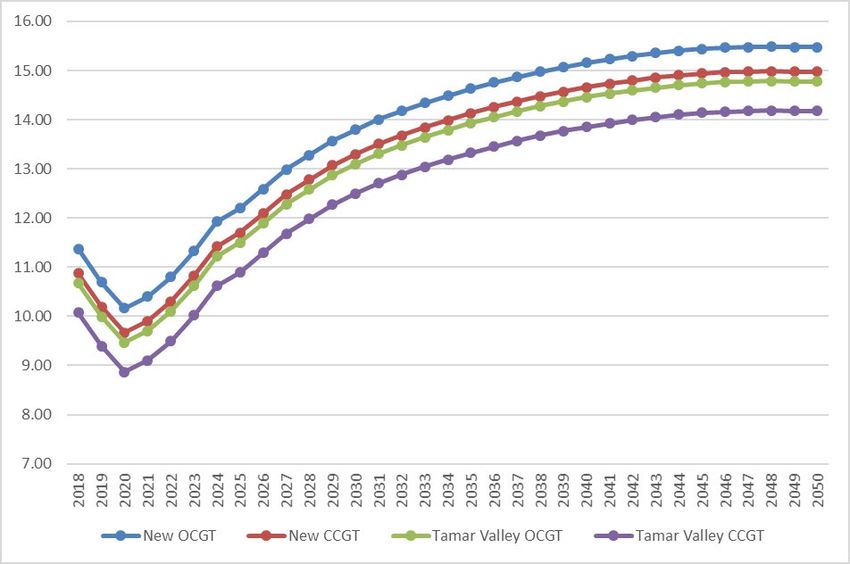
Wholesale Gas Price Outlook 2020-2050 | Eastern, Western & Northern Australia                                                                     6. Delivered Wholesale Price Projections

6.2.1.5 Tasmania

The following figure presents the location of gas-powered generators in Tasmania.

Figure 6.21 Map      of Tasmania GPG locations (illustrative only)

Source: Core Energy & Resources.

Figures 6.22to 6.25 present a summary of CORE’s projection of delivered TAS GPG wholesale prices between 2020 and 2050
under Central (Upper), Central (Lower), High and Low scenarios.

Figure 6.22 TAS GPG Gas Price Projections| Central (Upper) | AUD/GJ real 7/2019               Figure 6.24 TAS GPG Gas Price Projections | High Scenario | AUD/GJ real 7.2019

Figure 6.23 TAS GPG Gas Price Projections| Central (Lower) | AUD/GJ real 7/2019               Figure 6.25 TAS GPG Gas Price Projections | Low Scenario | AUD/GJ real 7.2019

Core Energy & Resources Pty Limited                                               December 2019                                                                                        25
Wholesale Gas Price Outlook 2020-2050 | Eastern, Western & Northern Australia                                                                 6. Delivered Wholesale Price Projections

6.2.2.           Western Australia

The location of Western Australia’s gas-powered generators is presented in the map in Figure 6.26

Figure 6.26 Map       of WA GPG locations (illustrative only) 4

Source: Core Energy & Resources.

The following figures present a summary of CORE’s projection of delivered WA GPG wholesale prices between 2020 and 2050
under Central (Upper), Central (Lower), High and Low scenarios.

•                Prices based on average of assumes Alinta and Synergy

•                Note storage and pipeline averages $1.5/GJ

•                High assumes contract prices will track high oil after 2025 through resets or new contracts

•                Central (Upper) assumes contract prices track toward $8

•                Central (Lower) assumes future contract prices track toward $6

•                Low is based on low oil and cost floor – assumes ~$5.50 contract price

•                For GPG prices are be based on owner contracts and assumed flexibility charges if any

4
    Kalgoorlie is also a significant load on the SWIS and under “normal” non-peak operation, these Kalgoorlie non-mining loads are supplied by these generators.

Core Energy & Resources Pty Limited                                               December 2019                                                                                    26
Wholesale Gas Price Outlook 2020-2050 | Eastern, Western & Northern Australia 6. Delivered Wholesale Price Projections Figure 6.27 WA GPG Gas Price Projections| Central (Upper) | AUD/GJ real 7.2019 Figure 6.29 WA GPG Gas Price Projections| High Scenario | AUD/GJ real 7.2019 Note: Pinjar, Kwinana (KPS), Cockburn share same price line. Wagerup and Pinjarra share same price line. Note: Pinjar, Kwinana (KPS), Cockburn share same price line. Wagerup and Pinjarra share same price line. Figure 6.28 WA GPG Gas Price Projections| Central (Lower)| AUD/GJ real 7.2019 Figure 6.30 WA GPG Gas Price Projections| Low Scenario | AUD/GJ real 7.2019 Note: All share same price line from 2020 Note: All share same price line from 2033 Source: Core Energy & Resources. Core Energy & Resources Pty Limited December 2019 27
Wholesale Gas Price Outlook 2020-2050 | Eastern, Western & Northern Australia                                                                   6. Delivered Wholesale Price Projections

6.2.3.            Northern Territory

The location of Northern Territory’s GPG's is presented in the map in Figure 6.31

Figure 6.31 Map of WA GPG locations (illustrative only)

Source: Core Energy & Resources

Figures 6.32 to 6.34 present a summary of CORE’s projection of delivered NT GPG wholesale prices between 2020 and 2050
under Central, High and Low scenarios.

CORE notes that the projected prices to 2034 include an existing contract price plus transmission costs, and that prices are reset
at new levels after 2034, based on assumed market forces

Figure 6.32 NT GPG Gas Price Projections | Central | AUD/GJ real 7.2019                     Figure 6.33 NT GPG Gas Price Projections | High Scenario | AUD/GJ real 7.2019
Note: All follow same price line.                                                           Note: All follow same price line.

Figure 6.34 NT GPG Gas Price Projections | Low Scenario | AUD/GJ real 7.2019
Note: All follow same price line.

Source: Core Energy & Resources.

Core Energy & Resources Pty Limited                                             December 2019                                                                                        28
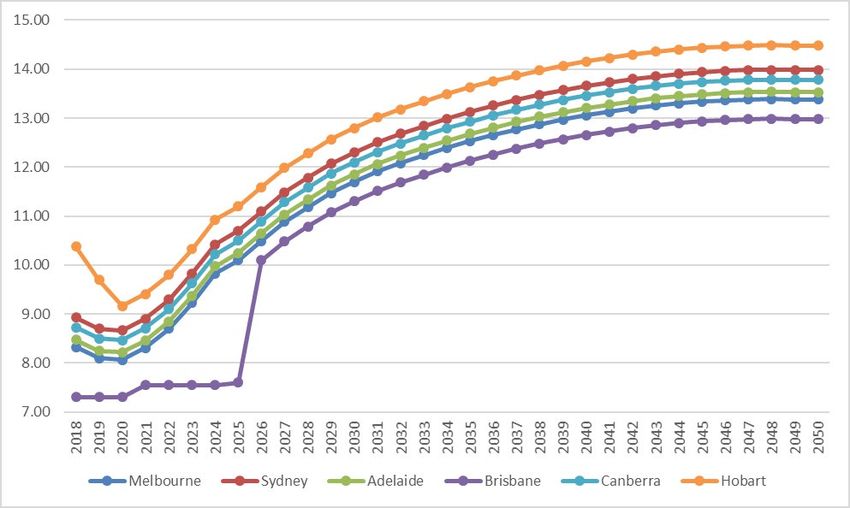
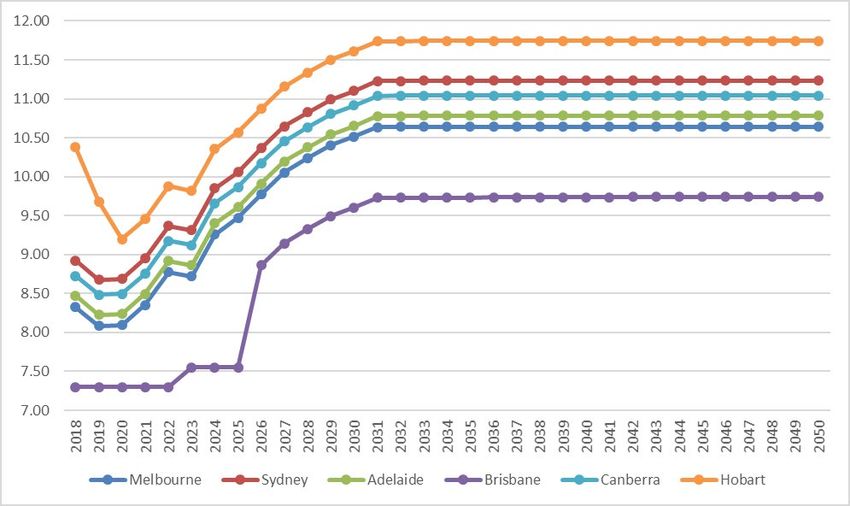
Wholesale Gas Price Outlook 2020-2050 | Eastern, Western & Northern Australia                                                                      6. Delivered Wholesale Price Projections

6.3. Residential and Commercial Delivered Wholesale Price

The following figures present a summary of CORE’s projection of delivered wholesale prices between 2020 and 2050 under
Central (Upper), Central (Lower), High and Low scenarios – as defined in the Methodology Section of this report.

CORE notes that variances between regions are due to differences in assumed contract profiles, existing contract prices
(particularly Brisbane whether low legacy prices are assumed), and differences in transportation and storage costs.

Eastern Australia

Figure 6.35 Retail Gas Price Projections | Central (Upper) | AUD/GJ real 7.2019               Figure 6.36 Retail Gas Price Projections | Central (Lower) | AUD/GJ real 7.2019

Figure 6.37 Retail Gas Price Projections | High scenario | AUD/GJ real 7.2019                 Figure 6.38 Retail Gas Price Projections | Low scenario | AUD/GJ real 7.2019

Figure 6.39 Retail Gas Price Projections | Melbourne | AUD/GJ real 7.2019                     Figure 6.40 Retail Gas Price Projections | Sydney | AUD/GJ real 7.2019

Core Energy & Resources Pty Limited                                               December 2019                                                                                         29
Wholesale Gas Price Outlook 2020-2050 | Eastern, Western & Northern Australia                                                                    6. Delivered Wholesale Price Projections

Figure 6.41 Retail Gas Price Projections | Adelaide | AUD/GJ real 7.2019                    Figure 6.42 Retail Gas Price Projections | Brisbane | AUD/GJ real 7.2019

Figure 6.43 Retail Gas Price Projections | Canberra | AUD/GJ real 7.2019                    Figure 6.44 Retail Gas Price Projections | Hobart | AUD/GJ real 7.2019

Source: Core Energy & Resources.

Core Energy & Resources Pty Limited                                             December 2019                                                                                         30
Wholesale Gas Price Outlook 2020-2050 | Eastern, Western & Northern Australia 6. Delivered Wholesale Price Projections
Western Australia
CORE noted that the scenarios are defined within the Methodology Section of this report. For WA a number of large contracts
are assumed to have prices reset, under-price review mechanisms, from 2020, which will place delivered prices under the Central
scenarios in the range $8 to $8.50 beyond 2024, and as low as $7 under Low and up to $10.50 under the High scenario. The latter
are assumed to be influenced by longer term international prices as future demand/supply is assumed to be in long (Low
scenario) to short (High Scenario).
Figure 6.45 Retail Gas Price Projections | AUD/GJ real 7.2019
Source: Core Energy & Resources
Northern Territory
In NT prices are assumed to be flat under a long-term contact until 2034. Future prices are set at a Low to High range which are
in line with a range of future demand/supply scenarios, including international LNG markets.
The High price scenario assumes linkage with LNG prices in a tighter global market.
The low-price scenario compensates the future supplier for cost of capital alone sue to a supply long position
The central scenario assumed some linkage with domestic and/or LNG market which are positioned at lower prices due
to global demand/supply.
Figure 6.46 Retail Gas Price Projections | AUD/GJ real 7.2019
Source: Core Energy & Resources
Core Energy & Resources Pty Limited December 2019 31Wholesale Gas Price Outlook 2020-2050 | Eastern, Western & Northern Australia Terms of Use Terms of Use This Report has been prepared by Core Energy & Resources Pty Limited, A.C.N. 110 347 085, in accordance with the terms of an executed agreement with AEMO, for the sole purpose of providing historical and forecast delivered price for gas-powered generators and major residential and commercial demand nodes in eastern Australia. This document has been prepared based on a specific scope and does not purport to contain all the information that a particular party may require. The information contained in this document may not be appropriate for all persons and it is not possible for CORE to have regard to the objectives, financial and other circumstances and needs of each party who reads or uses this document. CORE believes that the information contained in this document has been obtained from sources that are accurate at the time of issue but makes no representation or warranty as to the accuracy, reliability, completeness or suitability of the information contained within this document. To the extent permitted by law, CORE, its employees, agents and consultants accept no liability (including liability to any person by reason of negligence or negligent misstatement) for any statements, opinions, information or matter (expressed or implied) arising out of the information contained within this document. © Core Energy & Resources Group – All material in this document is subject to copyright under Australian and international law and permission to use the information must be obtained in advance and in writing from CORE. Core Energy & Resources Pty Limited December 2019 32
You can also read