Coronavirus (COVID-19) impact on Victoria's Visitor Economy - Released April 2021 - Business Victoria
←
→
Page content transcription
If your browser does not render page correctly, please read the page content below
OFFICIAL

Coronavirus (COVID-19)
impact on Victoria’s
Visitor Economy

Released April 2021

Report produced by the
Tourism, Events and
Visitor Economy (TEVE)
Research Unit
research@ecodev.vic.gov.au

                             OFFICIAL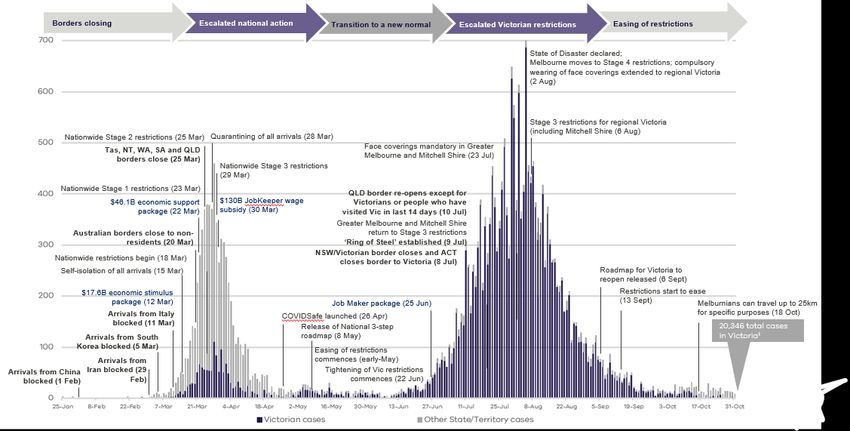
OFFICIAL

Contents

  1.       Summary
  2.       Impact of coronavirus (COVID-19) on trip behaviour
  3.       Overview of Victoria’s visitor economy
           a.    Key metrics
           b.    Total visitors to and within Victoria
           c.    Top 10 source markets by overnight visitors
           d.    Visitors within Victoria’s regions
  4.       Domestic overnight and daytrip visitors
           a.    Key metrics
           b.    State comparisons
           c.    Domestic overnight visitors - metro and regional Australia
           d.    Domestic overnight visitors - interstate and intrastate
           e.    Domestic overnight visitors – to and within Victoria
           f.    Domestic overnight visitors – Melbourne and regional Victoria
           g.    Domestic visitors - changes by purpose of visit
           h.    Domestic visitors likely to attend an event
  5.       International overnight visitors
           a.    Key metrics
           b.    International overnight visitors - source markets
           c.    International overnight visitors – Melbourne and regional Victoria
           d.    International overnight visitors – changes by purpose of visit
  6.       Victoria’s accommodation sector
  7.       The state of the industry
           a.    National Tourism Satellite Account/ Labour market
           b.    Payroll jobs and wages/ Impact on household - activities
           c.    Impact on household - travel
  8.       Substitution of interstate and outbound travel
  9.       Timeline of coronavirus (COVID-19) cases and events
  10.      List of resources
  11.      International and National Visitor Surveys - data notes

       Note: This report was finalised in December 2020. It therefore presents the best
       estimates available at the time of writing, which includes figures towards the
       end of the second wave of the coronavirus (COVID-19) pandemic in Victoria.

                                                                                          1
                                                   OFFICIAL
OFFICIAL

Summary
Since March 2020, the global outbreak of coronavirus (COVID-19) has deeply affected the Australian tourism
landscape. This report focuses on the impact of coronavirus (COVID-19) on the Victorian tourism industry,
using a range of data sources, including insights from specific questions added to visitor surveys on how
travellers responded to the coronavirus (COVID-19) pandemic, as well as broader insights on accommodation
and key economic indicators.

In the six months ending June 2020, total visitors to and within Victoria was 30.7 million, a decline of 19.9
million visitors (-39%) compared to the same period in 2019. Total visitor spend in Victoria over this period
experienced a deeper decline (-43%, or down $7.0 billion) to $9.3 billion.

Domestic visitors
• In the March quarter 2020, 33 per cent of Australians had their domestic travel plans (both past or future)
  change as a result of the coronavirus (COVID-19) outbreak (approximately 22 per cent of Australians (15
  years and over) travelled domestically in the three months prior to being questioned). This compared to 43
  per cent in the June quarter, which included the full Stage 3 restrictions across Australia (when
  approximately nine per cent of Australians travelled domestically in the prior three months).
• There have been 10.0 million domestic overnight visitors in Victoria in the nine months ending September
  2020 (-55% or down 12.5 million compared to the nine months ending September 2019).
• Following the easing of the national restrictions there was a softening decline in intrastate overnight
  visitors to/within Victoria in May and June. The Stage 3 and 4 restrictions that began in Victoria in July saw
  a return to a level of decline in August (-88%) that was experienced in April (-89%).
• Interstate overnight visitors to Victoria have experienced sustained declines of at least 90 per cent since
  April. These declines have seen a notable shift in proportions of domestic overnight travel. Interstate travel
  accounted for 36 per cent of visitors in Victoria but 52 per cent of spend in September 2019 however, in
  September 2020 this fell to just 5 per cent for visitors and 12 per cent of spend.
• Declines each month were similar for interstate overnight visitors to Victoria and visitors to Melbourne, and
  for intrastate overnight visitors within Victoria and visitors to regional Victoria, reflecting the dominant
  share of visitors to each destination.
• In terms of event attendance, as event sizes increase the proportion of domestic travellers less likely to
  attend an event increases for both indoor and outdoor events. Results are more favourable for outdoor
  events. Those that stated they were more likely to attend an event or had the same level of intention most
  were looking to home state events rather than interstate events.
International visitors
• There have been 612,000 international overnight visitors in Victoria in the six months ending June 2020
   (-61%, or down 942,000 visitors compared to the six months ending June 2019).
• The deepest decline in visitors was from Victoria’s highest spending international market China, which
   declined by 75 per cent in visitors (down 264,000 visitors). The next deepest falls in volume of visitors were
   from New Zealand (-55%, or down 91,000) and the United States of America (-61%, or down 82,000).
• International visitors arriving in Victoria for a short-term trip (less than 1 year) in September 2020 declined
   by 99.8 per cent compared to the same month in 2019 (recording only 330 short-term visitor arrivals).
Other tourism industry performance indicators
• The severe negative impacts of coronavirus (COVID-19) on monthly accommodation (hotels, motels and
  serviced accommodation of at least 10 rooms) have seen occupancy rates in Victoria take a sharp dive
  from March 2020. Occupancy rates in Victoria fell from 77.4 per cent in February 2020 to a low of 26.5 per
  cent in April, then lifted slightly to 33.1 per cent in June pre-Stage 4 restrictions.
• The sharpest impact of the crisis on payroll jobs has been in tourism related industries in Victoria. From the
  week ending 14 March to week ending 14 November 2020 Victoria had the deepest change in payroll jobs of
  all states and territories (-5.4%) compared to the national average decline of 2.9 per cent. Jobs in
  accommodation and food services (-22.6%) as well as arts and recreation services (-19.6%) experienced the
  deepest declines in Victoria.
                                                                                                                    2
                                                    OFFICIAL
OFFICIAL
Impact of coronavirus (COVID-19) on trip behaviour
Trip rates by Australians – to October 2020
The following charts show the changes in domestic daytrips had the most substantial difference in April
overnight (taken in the last month) and daytrip (taken 2020 (down 15% points when compared to April 2019).
in the last seven days) rates from January to the end This reflects the nationwide lockdown in May. Despite
of October 2020. Domestic overnight trips were at Melbourne being in Stage 4 Stay at Home restrictions
their lowest in May 2020 (6%) and domestic daytrips (limiting travel to within 5kms and only four reasons to
in April (4%). When comparing to the same month in leave home), the October school holidays in other states
2019, May 2020 shows the most substantial percentage looks to have had a positive impact in those states
point change in domestic overnight trips compared to although lower trip rates compared to 2019.
May 2019, down 28 percentage points, while domestic
Domestic overnight trips in 2019 and 2020 Domestic daytrips in 2019 and 2020
40% Nationwide Stage 3&4 40% Nationwide Stage 3&4
36% restrictions restrictions restrictions restrictions
35% 33% 32% 34% 33% 35%
32% 31% 31% 31%
28% 29% 29%
30% 30%
24%
25% 25%
22% 19% 20% 20%
19% 19% 19% 19% 18% 18%
20% 20% 17% 18% 18% 18%
15% 16% 16%
15% 15% 13% 13%
11% 10% 11% 12%
9% 9%
10% 10%
6%
4%
5% 5%
0% 0%
Jan Feb Mar Apr May Jun Jul Aug Sep Oct Jan Feb Mar Apr May Jun Jul Aug Sep Oct
ppt 3% -3% -7% -23% -28% -15% -11% -12% -13% -11% ppt -2% -2% -7% -15% -10% -5% -8% -9% -7% -6%
change change
2019 2020 2019 2020
How to interpret: The trip rate for October tells us 22 per cent of National Visitor Survey respondents interviewed that month reported taking one or
more overnight trips in the preceding 28 days (the reference period). The return date will have been in September for some of these trips. The trip
rate percentage for the month of October refers to trips returned from in that month.
Impact of coronavirus (COVID-19) on trips by Australians – to June 20201
In the six months ending June 2020, fifty per cent 100% Australian
of Australian travellers had their travel plans (both population
past or future) change as a result of the 15 years and older
coronavirus (COVID-19) outbreak (aged 15 years or
older).
34% had travelled* * Travel in the last 3
19% taken an overnight trip months relates to travel
12% taken a day trip in the last:
▪ 7 days for
9% taken an outbound trip
daytrips
▪ 4 weeks for
Were plans for trips in Australia changed overnight
due to the coronavirus outbreak? trips
Impacted ▪ 3 months for
overseas
trips
50%
62% 59%
No
Yes
50%
38% 41%
Travelled Did not travel Total
last 3 mths last 3 mths
Note: 1March and June quarters 2020 compared and includes both those who had travelled and not travelled in the last 3 months when questioned
unless otherwise specified. Source: National Visitor Survey, year ending June 2020, produced by Tourism Research Australia, October 2020.
Figures and charts produced by Tourism, Events and Visitor Economy Research Unit.
3
OFFICIALOFFICIAL
Impact of coronavirus (COVID-19) on trip behaviour
Coronavirus (COVID-19) questions1 (asked from January to June 2020), revealing
the following impacts on planned and future trips.
In the March quarter 2020, 33 per cent of Australians • Travellers (those who had taken a trip in the last three
had their domestic travel plans (both past and future) months when answering the survey) compared to non
changed as a result of the coronavirus (COVID-19) travellers (those who had not travelled in the last
outbreak, with early stages of restrictions beginning three months) were more likely to have changed their
on 23 March. This is compared to 43 per cent in the domestic travel plans in the June quarter results (53%
June quarter, which included the full Stage 3 compared to 40%). These were more than in the
restrictions across Australia, that began on 29 March March quarter 2020 where the percentages were 40
and began to ease in mid-May, and the cessation of per cent for travellers and 29 per cent for non-
outbound travel. travellers.
• In the June quarter 2020, Victorians aged 45-64 • Cancellations of planned domestic trips were similar
years were more likely to have changed their in the June quarter 2020 (64%) and March quarter
domestic travel plans due to the Coronavirus (67%), however trips were delayed or postponed more
outbreak (48% compared with 41% of Victorians in the June quarter (38% compared to 27%).
overall), followed closely by those aged 35-44 years • With the changes to future domestic trips, there had
(46%), while those aged 15-24 years old were the least been a shift by the end of June quarter 2020 to people
likely to have changed their plans (31%). more likely to delay or postpone a trip than cancel it.
• In the June quarter 2020, 50 per cent stated their In the June quarter 2020 43 per cent of respondents
domestic trip that had been planned was changed stated they were going to ‘cancel a trip and did not
‘before now’ (compared to 15% in the March quarter plan to go elsewhere’ (compared to 56% in the March
2020) and 32 per cent changed ‘for the future’ quarter 2020) and 56 per cent were going to ‘delay or
(compared to 73% in the March quarter 2020). postpone and did not plan to go elsewhere’
(compared to 46% in the March quarter 2020).
Were plans for trips in Australia changed due to
the coronavirus outbreak? (Australian respondents) How domestic plans were changed
(Australian respondents)
57% Cancelled a trip but didn't go 66%
67%
anywhere else instead 64%
43% Delayed or postponed a trip
33% 28%
but didn't go anywhere else yet
March quarter 2020 June quarter 2020 instead 38%
Yes No
When was the changed domestic trip planned? 6%
(Australian respondents) Cut short a trip you were on
2%
12% 18%
15%
Went somewhere else in 3%
50%
Australia instead 1%
73%
32% March quarter 2020 June quarter 2020
March quarter 2020 June quarter 2020
For the future Before now Both
Note: 1March and June quarters 2020 compared and includes both those who had travelled and not travelled in the last 3 months when
questioned unless otherwise specified. Figures in red italics had low samples and therefore must be interpreted with caution.
Source: National Visitor Survey, year ending June 2020, produced by Tourism Research Australia, October 2020.
Figures and charts produced by Tourism, Events and Visitor Economy Research Unit.
4
OFFICIALOFFICIAL
Impact of coronavirus (COVID-19) on trip behaviour
For Australian residents with overseas travel plans in June quarter 2020, 29 per cent
changed their plans because of coronavirus (COVID-19), with the majority of these (70%)
planned in the future.
• In the June quarter 2020, Victorians aged 45-64 • Cancellations of planned overseas trips were similar
years were more likely to have changed their in the June quarter 2020 (62%) and March quarter
overseas travel plans due to the Coronavirus (58%), however trips were delayed or postponed
outbreak (34% compared with 30% of Victorians more in the June quarter (32%, compared to 23%).
overall), followed closely by those aged 25-44 • With the changes to future overseas trips, there had
years (32%), while those aged 65+ years old were been a slight shift by the end of June quarter 2020
the least likely to have (23%). to people more likely to delay or postpone a trip
• Travellers (those who had taken a trip in the last than cancel it. In the June quarter 2020, 48 per cent
three months) compared to non travellers (those of respondents stated they were going to ‘cancel a
who had not travelled in the last three months) were trip and did not plan to go elsewhere’ (compared to
more likely to have changed their overseas travel 50% in the March quarter 2020) and 50 per cent
plans in the June quarter results (37% compared to were going to ‘delay or postpone and did not plan to
27%). These were more than in the March quarter go elsewhere’ (compared to 47% in the March
2020 where the percentages were 31 per cent for quarter 2020).
travellers and 20 per cent for non-travellers.
Were plans for overseas trips changed due to
the coronavirus outbreak? (Australian respondents)
How overseas plans were changed
(Australian respondents)
76% 71% Cancelled a trip but didn't go 58%
anywhere else instead 62%
Delayed or postponed a trip but
23%
24% 29% didn't go anywhere else yet
instead 32%
March quarter 2020 June quarter 2020
16%
Yes No Cut short a trip you were on
8%
When was the changed overseas trip planned? Went on an interstate trip 3%
(Australian respondents) instead 1%
3% 6%
11%
25% Went on a trip to your home 1%
state instead 1%
85% Went somewhere else overseas 2%
70% instead 0%
March quarter 2020 June quarter 2020
March quarter 2020 June quarter 2020
For the future Before now Both
Note: 1March and June quarters 2020 compared and includes both those who had travelled and not travelled in the last 3 months when
questioned unless otherwise specified. Figures in red italics had low samples and therefore must be interpreted with caution.
Source: National Visitor Survey, year ending June 2020, produced by Tourism Research Australia, October 2020.
Figures and charts produced by Tourism, Events and Visitor Economy Research Unit.
5
OFFICIALOFFICIAL
Overview of Victoria’s Visitor Economy
Since March 2020, the global outbreak of coronavirus (COVID-19) has deeply affected the Australian tourism
landscape. The impact of coronavirus (COVID-19) followed on from an already challenging start to the year,
with devastating summer bushfires in the East Gippsland and Victoria’s High Country tourism regions.
The results for both international and domestic travel reflect the impacts of progressive travel bans, and
restrictions on movement, combined with growing concerns about travel due to coronavirus (COVID-19).
The latest combined figures are for six months ending June 2020, as these are the latest international visitor
figures available. Further into the report, some key domestic visitor metrics are available and therefore
reported up until September 2020.
Total visitors to and within Victoria in the six months ending June 2020 was 30.7 million, a decline of 19.9
million visitors, or 39 per cent, compared to the same period in 2019. Total visitor spend in Victoria
experienced an even sharper decline over the same period (-43%, or a $7.0 billion decline).
30.7m 48.8m $9.3b
VISITORS NIGHTS SPEND
-39% -41% -43%
Substantial declines were noted across all visitor Interstate travel has been impacted due to state
categories in the six months ending June 2020 in border closures and other preventive measures to
Victoria as the impacts of the coronavirus (COVID- stop to the spread of the virus that limited
19) unfolded, reflecting the border closures and movement. This is shown by substantial declines
movement restrictions. These results include the noted in interstate overnight visitors (-54%, or down
nationwide restrictions in March/April and were 2.3 million), nights (-51%, or down 9.0 million) and
before the Stage 3 and 4 restrictions in Victoria from overnight spend (-52%, or down $2.0 billion).
July, that included the 5km travel distance limit for
With some limited movement enabled in May/June in
Melburnians.
Victoria, there was some recovery in intrastate travel
In the six months ending June 2020 compared to six and daytrips, however there remained a decline on
months ending June 2019, international travel to the previous year. Intrastate overnight travel had a
Victoria suffered the deepest decline in visitors as a substantial decline in visitors (-41%, or down 4.7
result of travel bans which were progressively million), nights (-24%, or down 6.7 million) and spend
implemented from February with overnight visitors (-36%, or down $1.7 million). Daytrips experienced a
(-61%, or down 0.9 million), visitor nights (-48%, or similar decline in spend (-37%, or down $1.2 billion)
down 17.8 million) and spend (-46%, or down $2.1 with a softer decline in visitors (-36%, or down 11.9
billion). million). Note that these results reflect travel that
occurred prior to the 5km travel distance limit.
Visitors to/within Victoria - 6 months ending June 2020 Spend in Victoria in 6 months ending June 2020
Source: International and National Visitor Surveys, year ending June 2020, produced by Tourism Research Australia, October 2020.
Figures and charts produced by Tourism, Events and Visitor Economy Research Unit.
6
OFFICIALOFFICIAL
Overview of Victoria’s Visitor Economy (continued)
TOTAL VISITORS TO AND WITHIN VICTORIA
Six months ending June 2020 compared to the six months ending June 2019
The chart below shows the change in proportions of The deepest declines in spend were by:
visitors to/within Victoria in the six months ending • international overnight visitors to Melbourne
June 2020 compared to the six months ending June (down $1.9 billion, or -45%), followed by
2019. There was a greater proportion of daytrips • interstate spend in Melbourne (down $1.5
to/within Melbourne, increasing from 63 per cent to billion, or -52%).
70 per cent, although the overall numbers of daytrips
Intrastate spend was down by $907 million (or -29%)
declined by 4.2 million (or -36%). The decline in
in regional Victoria and by $781 million (or -52%) in
volume of daytrips for regional Victoria was the
Melbourne. Daytrip spend in regional Victoria was
largest, down 7.7 million (or -36%), although there was
down $746 million (or -36%).
a slight increase in share (66% to 68%). The next
largest volume decline was intrastate visitors to
regional Victoria (down 3.5 million, or –38%).
19.0 million 10.9 million 32.3 million 20.2 million 50.7 million 30.7 million
55 m
3%, 1.6 m
50 m
9%, 4.3 m
45 m
40 m 23%
11.5 m
International
35 m overnight
1%, 0.3 m
2%, 0.6 m
4%, 1.4 m
30 m
7%, 2.0 m
Interstate
28%
22% overnight
25 m 9.1 m
6.7 m
1%, 0.1 m
20 m 8%, 1.5 m Intrastate
3%, 0.7 m
28% overnight
15 m 17%, 3.2 m 5.6 m
13%, 2.4 m 66%
5%, 0.6 m 66% 33.3 m 70% Domestic
10 m 14%, 1.5 m 21.4 m 21.4 m daytrips
11%, 1.1 m 68%
63%
5m 13.8 m
11.9 m 70%
7.6 m
0m
6 months ending 6 months ending 6 months ending 6 months ending 6 months ending 6 months ending
June 2019 June 2020 June 2019 June 2020 June 2019 June 2020
Melbourne Regional VIC Victoria
Source: International and National Visitor Surveys, year ending June 2020, produced by Tourism Research Australia, October 2020.
Figures and chart produced by Tourism, Events and Visitor Economy Research Unit.
7
OFFICIALOFFICIAL
Overview of Victoria’s Visitor Economy (continued)
TOP 10 SOURCE MARKETS BY OVERNIGHT VISITORS
Six months ending June 2020
Overnight visitors, nights and overall spend declined for The top 10 spending source markets (both domestic
all of Victoria’s source markets in the six months ending and international) for the six months ending June
June 2020 compared to the same period in the previous 2020 include:
year. • China, ranked 3rd with $851m, compared to 2nd for
the six months ending June 2019. Their spend fell
The deepest declines in visitors from the top source
$928m (-52%) between those periods, almost eight
markets reflected the border closures. With:
times that of the UK (the market with the second
• the Australian border closed to China on 1 February
highest volume loss (-$119m). Victoria’s rate of
and all non-residents on 20 March. The top
decline for Chinese spend was less than the
international visitor markets saw sharp declines –
national average (-60%), as well as Queensland
China (-75%), New Zealand (NZ) (-55%) and the
and NSW (both -63%).
United Kingdom (UK) (-41%). All international
• India, ranked 5th with $207 million, compared to
source markets experienced declines of at least
ranked 7th in the six months ending June 2019
50 per cent, with the exception of the UK.
• Malaysia, ranked 8th with $105m, compared to
• State and Territory borders closed on 25 March
ranked 10th in the six months ending June 2019
with Western Australia (WA), South Australia (SA),
• The increase in spend ranking by Indian and
Queensland, Tasmania and Northern Territory (NT).
Malaysian visitors was influenced by a slight
The deepest declines in domestic overnight visitors
increase in share of education visitor spend at the
were from SA and WA (both down 60%), Queensland
expense of China where the share in education
(-55%) and New South Wales (NSW) (-54%).
visitor spend fell from 54 per cent to 45 per cent in
the first six months of 2020.
TOTAL OVERNIGHT VISITORS TO AND WITHIN VICTORIA
Data in thousands (000s)
VICTORIA 6,732
▼ -41%
NEW SOUTH WALES 1,007 27,554
▼ -54%
QUEENSLAND
▼ -55%
376
$545*
AVERAGE SPEND
SOUTH AUSTRALIA 236 PER DOMESTIC
▼ -60% OVERNIGHT VISIT for
6 months ending June 2020,
WESTERN AUSTRALIA compared to $533 for
123 6 months ending 2019.
▼ -60%
AUSTRALIAN CAPITAL
TERRITORY 112 $3,991*
▼ -38% AVERAGE SPEND PER
INTERNATIONAL
TASMANIA 104 In the year ending OVERNIGHT VISIT for
▼ -47% December 2019 (pre 6 months ending June 2020,
coronavirus), China was compared to $2,931 for
ranked fifth for overnight 6 months ending June 2019.
CHINA 88
▼ -75% visitors to Victoria, and
third in spend.
NEW ZEALAND 74
▼ -55%
UNITED KINGDOM
69
▼ -41%
* Declines in visitors and spend from each source market have changed the profile of average visitor. For example, changes in length of
stay and purpose (such as international education and domestic business) have positively influenced the average spend per vis itor.
Source: International and National Visitor Surveys, year ending June 2020, produced by Tourism Research Australia, October 2020.
Figures and chart produced by Tourism, Events and Visitor Economy Research Unit.
8
OFFICIALOFFICIAL
Overview of Victoria’s Visitor Economy (continued)
DOMESTIC OVERNIGHT VISITORS TO AND WITHIN VICTORIA’S REGIONS
Six months ending June 2020 compared to the six months ending June 2019
Substantial declines were noted for all of Victoria's The largest percentage decline was experienced for
regions in the six months ending June 2020 Daylesford and the Macedon Ranges (down 60%).
compared to the same period in 2019.
Over this period, the regions with the largest volume
International overnight visitors to regional Victoria decline in domestic overnight spend were for:
represent one per cent of overall visitors to/within • Victoria’s High Country, down $278 million (-61%)
the area (excludes international daytrip visitors). to $179 million (noting bushfires in
As shown in the following chart, the largest volume January/February),
declines in domestic overnight visitors for the six • Murray, down $198 million (-38%) to $325 million,
months ending June 2020 compared to six months • Goldfields, down $191 million (-52%) to $176 million,
ending June 2019 were for: and
• Great Ocean Road, down 666,000 (-40%) • Yarra Valley and Dandenong Ranges, down $109
domestic overnight visitors to 989,000, million (-54%) to $92 million.
• Goldfields, down 598,000 (-49%) to 621,000,
• Victoria’s High Country, down 587,000 (-58%) to
432,000, and
• Murray, down 524,000 (-40%) to 775,000.
Volume and % change in domestic overnight visitors to/within Victoria’s regions
-800 -700 -600 -500 -400 -300 -200 -100 0 Visitors in 6 months
ending June 2020
(000s)
Great Ocean Road -666 -40% 989
Goldfields -598 -49% 621
Victoria's High Country -587 -58% 432
Murray -524 -40% 775
Mornington Peninsula -400 -33% 830
Geelong and the Bellarine -384 -39% 603
Yarra Valley and Dandenong Ranges -312 -48% 332
Daylesford and the Macedon Ranges -306 -60% 201
Phillip Island -282 -41% 399
Gippsland -260 -21% 996
Grampians -232 -41% 331
6 months ending June 2020 compared to 6 months ending June 2019
(000s)
Source: National Visitor Survey, year ending June 2020, produced by Tourism Research Australia, October 2020.
Figures and chart produced by Tourism, Events and Visitor Economy Research Unit.
9
OFFICIALOFFICIAL
Overview of Victoria’s Visitor Economy (continued)
DOMESTIC DAYTRIP VISITORS TO AND WITHIN VICTORIA’S REGIONS
Six months ending June 2020 compared to the six months ending June 2019
Substantial declines were experienced with • Goldfields, down 1.3 million (-45%) to 1.6 million,
domestic daytrips visitors. These declines were • Mornington Peninsula, down 1.1 million (-34%) to 2.2
softer than domestic overnight visitors for most million, and
regions. Notable variations in declines in domestic • Great Ocean Road, down 1.1 million (-49%) to 1.2
overnight visitors compared to domestic daytrip million, with the largest percentage decline of all
visitors include Daylesford and the Macedon Ranges the regions.
(-60% for overnight compared to -19% daytrip),
The softest percentage declines were experienced by
Victoria’s High Country (-58% compared with -31%),
Grampians (down 12%, or 74,000) and Daylesford and
Grampians (-41% compared with -12%),
the Macedon Ranges, (down 19%, or 274,000).
Phillip Island (-41% compared with -28%) and
Geelong and the Bellarine (-39% compared Over this period, the regions with the largest volume
with -27%). decline in domestic daytrip spend were for:
• Yarra Valley and Dandenong Ranges, down $135
As shown in the following chart, the largest volume
million (-55%) to $109 million,
declines in domestic daytrip visitors for the six
• Murray, down $126 million (-46%) to $147 million,
months ending June 2020 compared to six months
and
ending June 2019 were for:
• Mornington Peninsula, down $116 million (-43%) to
• Yarra Valley and Dandenong Ranges, down 1.4
$151 million.
million (-48%) to 1.6 million,
Volume and % change in domestic daytrip visitors to/within Victoria’s regions
Visitors in 6 months
ending June 2020
(000s)
-48%
1,553
-45%
1,605
-34% 2,166
-49% 1,158
-41% 1,286
-27% 1,629
-20% 1,546
-19% 1,135
-31% 567
-28% 536
-12% 558
Source: National Visitor Surveys, year ending June 2020, produced by Tourism Research Australia, October 2020.
Figures and chart produced by Tourism, Events and Visitor Economy Research Unit.
10
OFFICIALOFFICIAL
Overview of Victoria’s Visitor Economy (continued)
INTERNATIONAL OVERNIGHT VISITORS TO VICTORIA’S REGIONS
Six months ending June 2020 compared to the six months ending June 2019
Substantial declines in international overnight 18,000, and
visitors and spend were noted for all of Victoria's • Murray, down 20,000 (-54%) to 10,000
regions in the six months ending June 2020
The largest percentage decline of all the regions was
compared to the same period in 2019. This reporting
experienced by Goldfields (down 72%, or 72,000).
only includes international overnight visitors
because the International Visitor Survey (IVS) does Over this period, the regions with the largest volume
not capture specific detail on international daytrips. decline in international overnight spend were for:
• Geelong and the Bellarine, down $44 million
As shown in the following chart, the largest volume
(-72%) to $17 million,
declines in international overnight visitors for the
• Murray, down $42 million (-83%) to $9 million, and
six months ending June 2020 compared to six
• Great Ocean Road down $39 million (-66%) to
months ending June 2019 were for:
$20 million.
• Great Ocean Road, down 75,000 (-57%) to 57,000,
• Gippsland, down 28,000 (-65%) to 15,000,
• Mornington Peninsula, down 22,000 (-54%) to
Volume and % change in international overnight visitors to/within Victoria’s regions
Visitors in 6 months
ending June 2020
(000s)
-57% 57
-65%
15
-54% 18
-67% 10
-72% 8
-54% 16
-56% 14
-51% 16
-50% 15
-56% np
-31% np
Source: International Visitor Survey, year ending June 2020, produced by Tourism Research Australia, October 2020.
Note figures in red italics had low samples and therefore must be interpreted with caution.
Figures and chart produced by Tourism, Events and Visitor Economy Research Unit.
11
OFFICIALOFFICIAL
Domestic Overnight and Daytrip Visitors
Domestic visitors in 2020
Domestic survey data is now being provided monthly, There have been 10.0 million domestic overnight
to capture the emerging trends as early as possible. visitors in Victoria in the nine months ending
This allows key metrics for domestic visitors to be September 2020 (-55% or down 12.5 million compared
available up until September 2020. to the nine months ending September 2019).
Victoria recorded a significant loss in domestic visitor Victoria recorded a loss of $7.3 billion in domestic
spend (overnight and daytrip) of $9.8 billion for the overnight spend and a further loss of $2.5 billion in
period January to September 2020, compared to the domestic daytrip spend in the nine months ending
same period in 2019. September 2020, compared to the same period in
2019.
In July stay at home restrictions were reactivated in
Victoria in response to a second wave of coronavirus These declines have seen a notable shift in
(COVID-19). This saw a decline in overnight visitors proportions of domestic overnight travel. Interstate
and spend in August to levels seen in April during the travel accounted for 36% of visitors in Victoria but
initial phase of nation-wide stay at home restrictions. 52% of spend in September 2019, however in
September 2020 this fell to just 5% for visitors and
These were gradually eased in September for regional
12% of spend.
Victoria, including being allowed to travel for holidays
from mid-September, resulting in a slight The chart below shows that declines for the nine
improvement in trips on August but numbers months ending September 2020 compared to the
remained well below those seen before the second same period in 2019 were similar for interstate
wave. visitors to Victoria and visitors to Melbourne, and for
intrastate visitors within Victoria and visitors to
regional Victoria.
Domestic Overnight Visitors, Spend & Daytrips to and within Victoria
January - September % change 2019/20
0%
-10%
-20%
-30%
-40%
-50% -44%
-49% -50% -49% -51%
-60% -55% -52%
-58%
-70% -67% -68%
-69% -68%
-80%
Melb Reg VIC VIC Inter ON Intra ON Daytrips
Visitors Spend
Source: Tourism Research Australia, NVS monthly estimates for September 2020 as part of its provision of additional data to help
monitor the impacts of Australia’s summer bushfires and coronavirus (COVID-19) on tourism. Note figures in red italics had low samples
and therefore must be interpreted with caution. Chart produced by Tourism, Events and Visitor Economy Research Unit.
12
OFFICIALOFFICIAL
Domestic Overnight and Daytrip Visitors (continued)
State comparisons – 9 months to September 2020
• Domestic overnight visitors to/within Victoria fell by • Domestic daytrip visitors to/within Victoria fell by 51
55 per cent in the months from January to per cent in the months from January to September
September 2020 (compared to January to 2020, compared to January to September in 2019,
September in 2019), down 12.5 million to 10.0 million down 25.6 million to 24.7 million (compared to NSW,
(compared to NSW, -42% or down 12.3 million and down 35% or 19.9 million and Queensland, down 32%
Queensland, -39% or down 7.4 million). or 12.7 million).
• Domestic overnight spend in Victoria fell by 58 per • A further $2.5 billion has been lost in domestic
cent over the same period, down $7.2 billion to $5.3 daytrip spend since the start of the year resulting in
billion (compared to NSW, -48% or down $8.5 billion a loss in total domestic visitor spend for Victoria of
and Queensland, -46% or down $6.6 billion). $9.8 billion compared to the same period in 2019.
Domestic Overnight Visitors (million) Daytrip Visitors (million)
January - September January - September
60 60 56.5
50.3
50 50
-35%
40.0
40 40 36.6
-51% -32%
29.2
30
-42% 30 27.3
22.5
24.7
-55% -39%
19.2
-30%
16.9
20 18.0
20 -21%
-35% -24% 12.5 12.5
10.0
11.7
9.9
8.2
10
6.2
6.1
10
3.9
0 0
NSW VIC QLD SA WA NSW VIC QLD SA WA
2019 2020 2019 2020
State comparisons – focus on April 2020 and September 2020
The charts below highlight how all states suffered September, similar to April levels, following Stage 4
major falls in domestic overnight visitors in April as restrictions for the State that began in July to control
Stage 3 restrictions were put in place across the second wave of coronavirus (COVID-19). In contrast,
Australia from 29 March. Easing of restrictions most States and Territories experienced more
began on 27 April. Declines for April 2020 compared moderate declines in intrastate visitors in September
to April 2019 were over 90 per cent for all interstate 2020 (compared to September 2019) than they did in
overnight visitors, and intrastate overnight visitors April 2020 (compared to April 2019), within Tasmania
within Victoria were down 89 per cent (compared to (+97%, almost doubling) and WA the only other State to
-87% in NSW). experience growth (+6%). With most borders between
States remaining closed, declines in interstate visitors
After improved rates of travel from May to June,
in September 2020 compared to September 2019 were
interstate and intrastate overnight visitors to/within
experienced by all, although they were softer than
Victoria fell significantly again in August and
experienced in April 2020 compared to April 2019.
Domestic Overnight Visitors - Domestic Overnight Visitors -
April % change 2019/20 September % change 2019/20
97%
100% 100%
80% 80%
60% 60%
40% 40%
20% 20% 6%
0% 0%
-20% -20%
-8%
-40% -40% -19% -19%
-60% -60%
-80% -80%
-100% -72% -74% -74% -79%
-100% -79%
-120%
-91% -87% -95% -89% -97% -91% -90% -95% -87% -120%
-88%
-98% -93% -95% -97%
NSW VIC QLD SA WA TAS NSW VIC QLD SA WA TAS
Interstate Overnight Visitors Intrastate Overnight Visitors Interstate Overnight Visitors Intrastate Overnight Visitors
Source: Tourism Research Australia, NVS monthly estimates for September 2020 as part of its provision of additional data to help
monitor the impacts of Australia’s summer bushfires and coronavirus (COVID-19) on tourism. Note figures in red italics had low samples
and therefore must be interpreted with caution. Charts produced by Tourism, Events and Visitor Economy Research Unit.
13
OFFICIALOFFICIAL
Domestic overnight visitors – metro and regional Australia
Metro: domestic Regional: domestic
overnight visitors overnight visitors
In the nine months to September 2020 there Over this period there have also been deep
have been deep declines in both spend and declines in both spend and visitors noted
visitors across major metro areas in Australia. across major regional areas in Australia,
although softer than for the major metro areas.
The most substantial declines in the nine months to
September 2020 for domestic overnight visitors The deepest declines in the nine months to
was in Melbourne (down 67% compared to the nine September 2020 for domestic overnight visitors was
months to September 2019, or down 5.7 million), for regional Victoria (down 49% compared to the nine
followed by Sydney (-56%, or down 5.3 million), months to September 2019, or down 7.2 million),
Adelaide (-54%, or down 1.4 million) and Brisbane followed by regional NSW (-36%, or down 7.4 million)
and the Gold Coast (-47%, or down 4.2 million). and regional Queensland (-32%, or down 3.5 million).
Domestic overnight visitor spend in Melbourne Domestic overnight visitor spend in regional Victoria
declined by 69 per cent in the nine months to declined by 44 per cent in the nine months to
September 2020 resulting in a reduction in spend September 2020 resulting in a reduction in spend of
of $4.8 billion compared to the same period in 2019, $2.4 billion compared to the same period in 2019,
followed by Sydney (-66%, or down $4.5 billion) and followed by regional Queensland (-39%, or down $3.0
Brisbane and the Gold Coast (-54%, or down $3.6 billion) and regional NSW (-36%, or down $3.9 billion).
billion).
Domestic Overnight Visitors (million) Domestic Overnight Visitors (million)
January - September January - September
20 25
20.5
20
15 -36%
14.6
15 13.1
9.4 8.9 -49%
10 8.5 10.9
-32%
-56% -47% 10
-67% 7.4 7.4 -19%
4.7 -34% -24%
5 4.1 -54% 3.5 5.2
2.8 3.8 4.2
2.5 2.3 5 2.9
1.2
0 0
Sydney Melbourne Brisbane & GC Adelaide Perth Reg NSW Reg VIC Reg QLD Reg SA Reg WA
2019 2020 2019 2020
Source: Tourism Research Australia, NVS monthly estimates for September 2020 as part of its provision of additional data to help
monitor the impacts of Australia’s summer bushfires and coronavirus (COVID-19) on tourism. Note figures in red italics had low samples
and therefore must be interpreted with caution. Charts produced by Tourism, Events and Visitor Economy Research Unit.
14
OFFICIALOFFICIAL
Domestic overnight visitors – interstate and intrastate
Intrastate overnight visitors Interstate overnight visitors
Following the easing of the national restrictions Since the national restrictions that began in
there was a softening decline in intrastate March and went into early May, and with
overnight visitors to/within Victoria in May and many closed State borders remaining in place,
June. The Stage 3 and 4 restrictions that began the number of interstate visitors to Victoria
in Victoria in July saw a return to a level of has seen sustained declines of at least 90 per
decline in August (-88%) that was experienced cent since April.
in April (-89%).
Interstate overnight visitors to Victoria fell sharply
Intrastate overnight visitors in Victoria fell sharply during the national restrictions in April (-95%, the
during the national restrictions in April (-89%, or second largest volume decline to date when
down 1.8 million, compared to April 2019, the largest compared to April 2019). Over the following months,
monthly volume decline to date). The decline the estimated declines remained at or above 90 per
softened slightly in May (-69%, compared to May 2019) cent, with the exception of June (-86%, compared to
and June (-39%, compared to June 2019), in line with June 2019), reflecting the end of the national
easing restrictions, before falling again during the restrictions in May. However, with many State
Stage 3 and 4 restrictions in Victoria in July (-52%, borders remaining closed, the deepest declines
compared to July 2019), with a deeper decline in occurred in August (-99%, compared to August 2019)
August (-88%, or down 1.4 million, the second largest and September (-98%, or down 821,000 (the largest
monthly volume decline). The decline softened slightly volume decline) compared to September 2019), when
in September (-79%, or down 1.2 million, compared to Stage 3 and 4 restrictions were in place for Victoria.
September 2019) due to easing restrictions in regional
Victoria from mid-September that allowed travel
within regional Victoria.
Intrastate Overnight
Intrastate Visitors inVisitors
Overnight Victoria (000s) Interstate Overnight Visitors in Victoria (000s)
in Nationwide
Victoria (000s) Stage 3&4 Nationwide Stage 3&4
2,261 restrictions restrictions restrictions restrictions
2,500
2,080 2,084
2,000 2,327 1,630 1,695
1,641 1,548 1,528 1,478
1,500 1,279
1,408 1,033
1,000 741
513
500 238 309
178
0
Jan Feb Mar Apr May Jun Jul Aug Sep
2019 2020
Source: Tourism Research Australia, NVS monthly estimates for September 2020 as part of its provision of additional data to help
monitor the impacts of Australia’s summer bushfires and coronavirus (COVID-19) on tourism. Note figures in red italics had low samples
and therefore must be interpreted with caution. Charts produced by Tourism, Events and Visitor Economy Research Unit.
15
OFFICIALOFFICIAL
Domestic overnight visitors – to and within Victoria
Interstate and intrastate visitors Domestic overnight visitors to and
to and within Victoria within Melbourne and regional Vic
The declines that began with the nationwide Declines each month were similar for interstate
restrictions in March were deeper for visitors to Victoria and visitors to Melbourne,
interstate overnight visitors than intrastate and for intrastate visitors within Victoria and
overnight visitors. visitors to regional Victoria, reflecting the
share of visitors to each destination.
Interstate visitor declines were higher than
intrastate, with some rebound in intrastate evident Declines in August 2020 (compared to August 2019)
as restrictions eased in May/June. Deeper declines and September 2020 (compared to September
in July, August and September occurred following 2019) for both Melbourne and regional Victoria
the second wave and Stage 4 restrictions. Interstate returned to similar levels experienced in April 2020
visitors remained in deep decline through (compared to April 2019), when national restrictions
September as borders remained shut. were in place for the first wave. A softening decline
for regional Victoria is evident in September, due to
easing restrictions that allowed travel within
regional Victoria.
Domestic Overnight Visitors to and within Victoria Domestic Overnight Visitors in Melbourne & Regional Victoria
% change 2019/20 % change 2019/20
Nationwide Stage 3&4 40% Nationwide Stage 3&4
40%
restrictions restrictions restrictions restrictions
20% 15%
20% 20%
0% 0%
-1%
-3%
-20% -20%
-14% -12% -16%
-15%
-40% -40% -33%
-39% -39% -41%
-47%
-60% -52% -60% -55% -53%
-80% -69% -80% -70%
INTERSTATE MELBOURNE -78% -80%
-79% -84%
INTRASTATE -89% -90% -86% -88% REGIONAL VIC -87% -88% -89%
-100% -100%
-94% -97% -95% -95%
-95% -99% -98%
-120% -120%
Jan Feb Mar Apr May Jun Jul Aug Sep Jan Feb Mar Apr May Jun Jul Aug Sep
Travel to regional Victoria following mid-September opening
In September 2020 a greater share of overnight trips spent outside the Melbourne tourism region in
involved a regional stay than a stay in Melbourne September 2019, this increased to 85 per cent in
due to the tighter restrictions placed on metropolitan September 2020. The share of spend in regional
areas to slow the spread of coronavirus (COVID-19). areas also increased from 36 per cent in September
2019 to 81 per cent in September 2020 (albeit from a
While 59 per cent of trips in Victoria included nights
small volume).
Source: Tourism Research Australia, NVS monthly estimates for September 2020 as part of its provision of additional data to help
monitor the impacts of Australia’s summer bushfires and coronavirus (COVID-19) on tourism. Note figures in red italics had low samples
and therefore must be interpreted with caution. Charts produced by Tourism, Events and Visitor Economy Research Unit.
16
OFFICIALOFFICIAL
Domestic overnight visitors – Melbourne and regional Victoria
Domestic visitors to Melbourne Domestic visitors to regional Vic
Domestic Overnight Visitors
in Regional Victoria (000s)
Nationwide Stage 3&4 Nationwide Stage 3&4
2,500 2,248 restrictions
restrictions restrictions restrictions
1,963
2,000 2,223 1,819
1,602
1,447 1,442 1,452 1,366
1,500 1,226 1,258
952
1,000 1,220
687
433
500 246 276
137
0
Jan Feb Mar Apr May Jun Jul Aug Sep
2019 2020
Melbourne suffered a dramatic loss in visitors (-95% Regional Victoria was down 89 per cent in overnight
or down 973,000) in September 2020 compared to visitors (or down 1.12 million visitors) in August 2020
September 2019. This has been the largest volume (compared to August 2019) and down a slightly
loss for Melbourne to date and reflects the second softer 80 per cent (or down 1.09 million visitors) in
wave of cases that resulted in Stage 4 restrictions. September 2020 (compared to September 2019).
This was similar to the decline in April 2020 (-97%), This reflects the Stage 3 restrictions across regional
during the national restrictions. Victoria.
Domestic Overnight Visitors Domestic Overnight Visitors
METRO
April % change 2019/20 September % change 2019/20
METRO
20% 20%
REGIONAL REGIONAL 7%
0% 0%
-20% -20%
-40% -40% -29% -29% -31%
-48%
-60% -60% -52%
-59%
-80% -74% -72% -80% -73%
-78% -76% -80%
-87% -89% -87% -88%
-100% -93% -100%
-97% -95%
-120% -120%
NSW VIC QLD SA WA NSW VIC QLD SA WA
During the Stage 3 and 4 restrictions in Victoria in
During the national restrictions in April 2020, the
September 2020, the deepest decline compared to
deepest decline compared to April 2019 of all the
September 2019 of all metro areas was for
country’s major metro areas was seen in Melbourne
Melbourne (-95%, or down 973,000), followed by
(-97%, or down 954,000), followed by Adelaide (-93%,
Sydney (-73%, or down 855,000).
or down 322,000).
For regional Australia the deepest declines were in
For regional Australia the deepest declines were in
regional Victoria (-80%, or down 1.1 million),
regional NSW (-89%, or down 2.5 million), closely
compared to the following declines for regional SA
followed by regional Victoria (-87%, or down 1.7
(-31%, or down 157,000), regional NSW (-29%, or
million).
down 648,000) and regional Queensland (-29%, or
down 401,000).
During this time there were border restrictions by almost all states and territories, also influencing declines in
metro visitation.
In comparing the April and September declines, it is positive to see that the eased restrictions and lower (or no)
community transmission for the other states resulted in softer declines when compared to 2019, compared to
what Victoria was experiencing during its Stage 3 and 4 restrictions.
Source: Tourism Research Australia, NVS monthly estimates for September 2020 as part of its provision of additional data to help
monitor the impacts of Australia’s summer bushfires and coronavirus (COVID-19) on tourism. Note figures in red italics had low samples
and therefore must be interpreted with caution. Charts produced by Tourism, Events and Visitor Economy Research Unit.
17
OFFICIALOFFICIAL
Domestic visitors – changes by purpose of visit
Overnight visitors by purpose Daytrip visitors by purpose
These figures are for the six months ending June 2020, • Holiday daytrip visitors to/within Victoria declined
the latest domestic visitor metrics available by purpose. by 40 per cent, in line with NSW (-40%) and slightly
deeper than for Queensland (-36%) and the
In the six months ending June 2020 compared to six
national average (-38%).
months ending June 2019, there were substantial
• VFR daytrip visitors to/within Victoria declined by
declines for domestic overnight and daytrip visitors
34 per cent, similar to Queensland (-35%) and
across all purposes of visit, in all States and Territories.
deeper than for NSW (-30%) and the national
Despite easing of restrictions in May, borders did not average (-33%).
reopen, and Melbourne experienced the early stages of • Business overnight visitors to/within Victoria
a second lockdown in June. declined by 31 per cent, deeper than in Queensland
• Holiday overnight visitors to/within Victoria declined (26%), and similar to the rates of decline in NSW
by 45 per cent, softer than for Queensland (-54%) and the national decline (both down 30%).
and NSW (-52%) and the national average (-48%).
• Visiting Friends and/or Relatives (VFR) visitors The shares of each purpose for domestic daytrip
to/within Victoria declined by 46 per cent, deeper visitors remained relatively constant from the six
than to Queensland (-41%) and NSW (-40%) and the months ending June 2019 to six month ending June
national average (-40%). 2020, with the deepest decline in share being for
• Business overnight visitors to/within Victoria holiday visitors, (44% to 41%), and each of the other
declined by 44 per cent, deeper than to NSW (-40%) segments gaining one percentage point. The decline
and Queensland and the national average (both was influenced by declines in holiday daytrip visitors
down 39%). to/within regional Victoria (50% to 47%) and
Melbourne (34% to 31%).
The shares of each purpose remained relatively
constant from the six months ending June 2019 to 2020.
Domestic overnight visitors - 6 months ending June 2020 Domestic daytrip visitors - 6 months ending June 2020
Other Other
533.1k, -36% 2.8m, -30%
Business
1.6m, -44%
Business Holiday
Holiday
3.2m, -31% 8.9m, -40%
3.9m, -45%
VFR VFR
2.9m, -46% 6.6m, -34%
Domestic overnight visitors by purpose Domestic daytrip visitors by purpose
18,000 35,000
5%
16,000
30,000
12%
14,000 18% 14%
25,000
12,000
Visitors (000s)
Visitors (000s)
10,000 34% 20,000 30% 13%
6%
8,000
15%
18% 15,000
6,000 31%
33% 10,000
4,000 44%
45%
5,000 41%
2,000 44%
- -
6 months to June 2019 6 months to June 2020 6 months to June 2019 6 months to June 2020
Holiday Visiting friends and relatives Business Other Holiday Visiting friends and relatives Business Other
Source: National Visitor Survey, year ending June 2020, produced by Tourism Research Australia, October 2020.
Figures and charts produced by Tourism, Events and Visitor Economy Research Unit.
18
OFFICIALOFFICIAL
Domestic visitors likely to attend an event
Likelihood to attend indoor and outdoor events in next three months
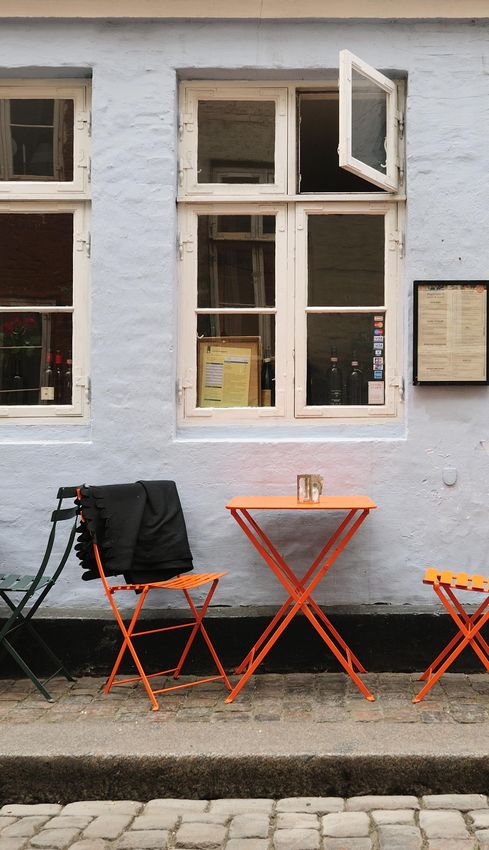
In July and November, additional questions were asked of domestic overnight visitors1 to gauge general
interest in attending events with no restrictions in place, over the next three months, compared to before
the coronavirus (COVID-19) outbreak. The latest responses taken in November highlight that sizeable
proportions remain less likely to attend the various event types compared to before coronavirus (COVID-
19), although they are lower for all types of events when compared to the July responses. As event sizes
increase the proportion less likely to attend also increases for both indoor and outdoor events. Results are
more favourable for outdoor events (that is, when comparing events of the same size to indoor events),
reflecting the pattern in July.
• Indoor events were on average less appealing than before coronavirus (COVID-19) than outdoor events,
46 per cent versus 34 per cent among Victorian respondents (compared to 52% versus 44% in July).
• With outdoor events, the November responses indicate that 14 per cent of Victorians were less likely to
attend if less than 100 people compared to 47 per cent with more than 5,000 people.
• For those that stated they were more likely to attend an event or had the same level of intention, most
were looking to home state events rather than interstate events. Respondents in July in all states were
more likely to attend an event in their home state than respondents in November. For example, in
November, 69 per cent of Victorians and 74 per cent nationally (compared to 78% of Victorians and 82%
nationally in July). The positive shift in the recent results was towards attending an event in both home
state and interstate, suggesting an increased confidence in interstate travel, increases in capacity and
events recommencing in some states.
Key points from the November responses
Less likely to attend an INDOOR event compared to
highlight: before COVID-19 - November 2020
• Victorians were, on average, less likely to 70%
want to attend indoor events than before 60%
coronavirus (COVID-19) (46%) compared to 50%
respondents in all states except NSW (47%) 40%
and the Australian Capital Territory (ACT) 30%
(49%).
20%
• Victorians were, on average, less likely to
10%
want to attend outdoor events than before
0%
coronavirus (COVID-19) (34%) compared to TOTAL VIC NSW QLD SA WA TAS NT ACT
respondents in all states except NSW (36%).
• The level of concern increases with the size Less likely to attend an OUTDOOR event compared to
before COVID-19 - November 2020
of indoor events, with: 70%
• 36 per cent of Victorians were less likely to
60%
attend an indoor event with less than 100
50%
people, compared to before coronavirus
(COVID-19) 40%
• 48 per cent less likely to attend an indoor 30%
event with 100 to 500 people 20%
• 53 per cent less likely to attend an indoor
10%
event with more than 500 people.
0%
TOTAL VIC NSW QLD SA WA TAS NT ACT
1 Theevents questions were added to the National Visitor Survey between 8 to 21 July and 1 to 17 November 2020 to gauge
interest/intentions on attending a range of event types to assess the impacts from coronavirus (COVID-19) and supplied by Tourism
Research Australia. Charts produced by Tourism, Events and Visitor Economy Research Unit.
19
OFFICIALOFFICIAL
Domestic visitors likely to attend an event (continued)
Results are more favourable for outdoor • 43 per cent less likely to attend an outdoor
events (that is, when comparing events of the event with more than 500 people (this is not
same size to indoor events) and those that mutually exclusive from the following category)
• 47 per cent less likely to attend an outdoor
stated they were more likely to attend an
event with more than 5,000 people.
event or had the same level of intention were
most were looking to home state events rather Most (69%) of the November responses by
Victorians who were more likely to attend an event
than interstate events.
or had the same intention, were looking to Victorian
The level of concern increases with the size of events rather than interstate events. This is the
outdoor event, although with lower percentages for lowest of all states (except the ACT at 63%):
people than for indoor events, with: • with 73 per cent of NSW residents likely to
• 14 per cent of Victorian respondents less likely to attend an event in NSW
• attend an outdoor event with less than 100 • with 76 per cent of Queensland residents
people, compared to before coronavirus likely to attend an event in Queensland
(COVID-19). • with 78 per cent of SA residents likely to
• 31 per cent less likely to attend an outdoor event attend an event in SA
with 100 to 500 people
• with 85 per cent of WA residents likely to
attend an event in WA.
More likely to attend an event in their home state More likely to attend an event in their home state
compared to before COVID-19 - July 2020* compared to before COVID-19 - November 2020*
100% 100%
85% 87% 87%
81% 81% 85%
78% 79%
78% 76%
80% 80% 73% 76% 73%
69%
59% 63%
60% 60%
40% 40%
27% 29%
23% 25%
21% 19% 20%
18%
20% 15% 15% 12% 10%
15% 14% 20% 12%
15%
3% 4% 8% 4% 3% 4% 7% 6%
1% 0% 2% 3% 3% 2% 1% 3%
0% 0%
NSW VIC QLD SA WA TAS NT ACT NSW VIC QLD SA WA TAS NT ACT
Home state or territory Another state or territory Both Home state or territory Another state or territory Both
* Respondents had already stated they were more likely to attend an event or had the same level of * Respondents had already stated they were more likely to attend an event or had the same level of
intention than before COVID-19, before answering if the event was more likely to be in their home intention than before COVID-19, before answering if the event was more likely to be in their home
state or other state or territory. state or other state or territory.
Note: questions asked were:
1. Think about organised events such as indoor or outdoor sports, music or cultural events etc. If no
restrictions are in place, how likely would you be to attend the following events over the next 3 months,
compared to before the Coronavirus outbreak? For each of these events can you please tell whether you
would be less likely to attend than before, about the same as before, or more likely to attend than before
the outbreak.
2. And for the events that you’ve just said you would be more or just as likely to attend, would you be likely to
attend those events in your home state or territory, or another state or territory?
1 Theevents questions were added to the National Visitor Survey between 8 to 21 July and 1 to 17 November 2020 to gauge
interest/intentions on attending a range of event types to assess the impacts from coronavirus (COVID-19) and supplied by Tourism
Research Australia. Charts produced by Tourism, Events and Visitor Economy Research Unit.
20
OFFICIALYou can also read